
Abstract
Background
The effective extractives of Tetrastigma hemsleyanum (T. hemsleyanum) are useful, but this plant was not fully utilized in rural China. In this study, flavonoids from the aerial parts of T. hemsleyanum were extracted, and the purification method and the antioxidant capability were explored.
Purpose
This study is to explore the optimized purification method and the biological capability of the total flavonoids extracted from T. hemsleyanum.
Materials and Methods
The optimal extraction conditions were determined by single-factor and Box-Behnken design experiments. The antioxidant activities were assessed by analyzing their capability to scavenge 2,2-diphenyl-1-picrylhydrazyl and OH free radicals.
Results and Discussion
The optimal conditions for the extraction of the total flavonoids were as follows: ethanol volume fraction 60%, liquid-to-material ratios 35:1 mL/g, temperature 45℃, and time 85 min. The extraction rate of the total flavonoids was (3.59 ± 0.03)%. NKA-9 is an ideal macroporous resin for purification. The optimized purification process conditions of flavonoids were mass concentration of adsorption solution 1.50 mg/mL, pH value of adsorption solution 4.0, sample loading flow rate 2 BV/h, ethanol volume fraction in desorption process 60%, desorption flow rate 2 BV/h and elution volume 4 BV. After crude extracts were purified by NKA-9 macroporous resin, the content of the total flavonoids enhanced from (21.76 ± 0.18)% to (58.92 ± 0.22)%. The results of the experiments for antioxidant activity showed that the half maximal inhibitory concentration (IC50) values of the purified flavonoids extracted were 33.1and 42.7 µg/mL, respectively.
Conclusion
The results of this study indicated that the flavonoids in T. hemsleyanum have good antioxidant activity in vitro and deserve exploring in further pharmacological studies.
Introduction
Tetrastigma hemsleyanum (T. hemsleyanum) is a plant of the Vitaceae family. It is edible and has medicinal value. T. hemsleyanum grows in the Yangtze River Basin in China (Ji et al., 2024; Lin et al., 2023). Multiple pharmacological studies have shown that the bulbous roots of this plant have antivirus, anti-inflammation, and antitumor functions, and relieve rheumatic pain and cold (Ding et al., 2019; Han et al., 2023; Ji et al., 2024; Xia et al., 2018). The extracts from the bulbous roots are used as therapeutic agents in China. T. hemsleyanum leaves (THL) are also very useful when their medicinal values are considered. However, THLs in rural China are waste biomass and are usually burned.
Numerous studies have reported the extraction of active ingredients including polyphenols, flavonoids, amino acids, and terpene compounds from THL (Liu et al., 2023; Wang et al., 2023; Zhou et al., 2023). Modern pharmacological studies show that its ethanol extracts have antibacterial, anti-falling sickness, anti-tumor, spasmolytic, and anti-inflammatory activities (Waghole et al., 2022; Wu et al., 2021; Xiao et al., 2023; Sun et al. 2017; Yong et al., 2018). The results of our preliminary experiments including color reaction and UV spectrum indicated that the ethanol extracts of THL might be rich in flavonoids.
Flavonoids are one of the most widely distributed natural compounds in the plant kingdom. They possess biological functions including antioxidant, antibacterial, and anti-inflammatory. Besides, they can regulate blood sugar, blood lipids, and blood pressure (Hamed et al., 2019; Kousar et al., 2023). Herein, the THL were used as experimental material, the response surface method was applied to optimize the extraction procedure by ethanol for total flavonoid extraction. Macroporous resin column chromatography was used to purify flavonoids. The antioxidant capability of the compounds was measured by assessing their capacity to scavenge 2,2-diphenyl-1-picrylhydrazyl (DPPH) and OH free radicals.
Materials and Methods
Plant Material and Chemicals
The fresh THL (4.2 kg) were collected in August 2022 from Ningbo Shengwang Biotechnology Corporation, China. In the experiment, the leaves were first dried at 45°C for 72 h. Then the dry leaves were ground into fines (1.2 kg), sieved by a screen of 60-mesh, and preserved in a desiccator. The specimens were identified by Prof. Xin Peng, Zhejiang University. The voucher specimen was stored at the Biotechnology Institute of Zhejiang Pharmaceutical University, China. Rutin and macroporous resins of D101, HP-20 and HPD 100 were purchased from Sinopharm Chemical Reagent Co., Ltd (Shanghai, China). Macroporous resins of NAK-9 and AB-8 were obtained from Nankai Hecheng Science & Technology Co., Ltd. (Tianjin, China). DPPH was purchased from Solarbio Technology Co., Ltd. (Beijing, China).
Assessment of Total Flavonoid Content
The total flavonoid content (TFC) was measured by NaNO2–Al(NO3)3–NaOH colorimetric method (Ma et al., 2023) with minor modification. A rutin solution of 1.05 mg/mL was prepared and served as the standard solution. The standard rutin solution in an appropriate volume was added into seven volumetric flasks (10 mL). Afterward, solutions including 5% NaNO2 (0.5 mL), 10% Al (NO3)3 (0.5 mL), and 4% NaOH (4 mL) were added in each flack at 5-min intervals. Then, the mixed solution was diluted to 10 mL with 70% ethanol. Finally, the rutin concentrations were 0, 10, 20, 30, 40, 50, and 60 µg/mL. The absorbance was measured thrice at 510 nm by a MAPADA P5 spectrophotometer. The absorbance was in direct proportion to rutin concentration, which ranges from 10 to 60 µg/mL. The formula of absorbance: A = 0.0172C + 0.0081 (R2 = 0.9995). A represented the average absorbance, and C was the rutin concentration. The TFC was evaluated by replacing the rutin solution with the extracted solution. The calibration curve was used for the calculation of the extraction rate.
Single-factor Experiments
The impacts of the volume fraction of ethanol, liquid-to-solid ratio (L/S ratio), and extraction temperature and time on the extraction rate of flavonoids from THL were explored. In the exploration of the optimal ethanol volume fraction, a series of volume infractions were set at 30%, 40%, 50%, 60%, 70%, 80%, and 90%. The L/S ratio, temperature, and time were 40:1 mL/g, 50°C, and 60 min, respectively. In the exploration of the optimal L/S ratio, a series of ratios were set at 10:1, 20:1, 30:1, 40:1, 50:1, 60:1, and 70:1 mL/g. In this exploration, the previously determined optimal ethanol volume fraction was taken, and the extraction temperature and time were at 50°C, and 60 min, respectively. In the exploration of the optimal temperature, a series of temperatures were set at 30°C, 40°C, 50°C, 60°C, 70°C, 80°C, and 90°C. The previously determined optimal ethanol volume fraction and L/S ratio were taken, and the extraction time was 60 min. In the exploration of the optimal extraction time, the determined optimal ethanol volume fraction, L/S ratio, and extraction temperature were taken.
Box-Behnken Experimental Design
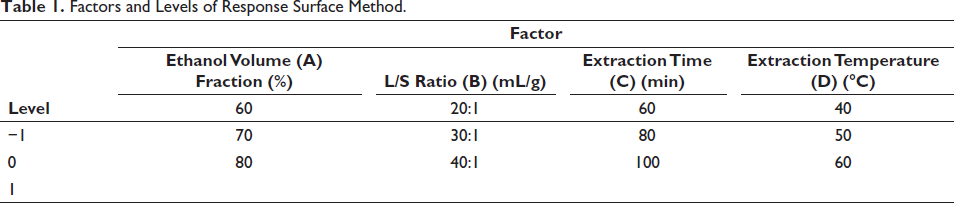
Box–Behnken design was used to optimize the extraction conditions. There were four independent variables of three levels: ethanol volume fraction (a) of 60%, 70%, and 80%; L/S ratio (b) of 20, 30, and 40 mL/g; extraction time (c) of 60, 80, and 100 min; and extraction temperature (d) of 40, 50, and 60oC. The extraction rate was the dependent variable (Table 1).
Factors and Levels of Response Surface Method.
Purification Process of Total Flavonoids
Five kinds of resin (HPD100, D101, HP-20, AB-8, and NAK-9) were employed, and the best resin for the purification of flavonoid was investigated. All the resins were immersed in 95% ethanol solution for 24 h, soaked until fully swelled, and then fully washed with distilled water until no ethanol flavor, with the washing liquid clear, not turbidified. Then, the resin was immersed in a 5% HCl solution for 5 h and thoroughly washed with distilled water through a 100 mesh sieve until the pH paper showed that the effluent wash solution was neutral. Then, the resin was immersed in 5% NaOH solution for 5 h and thoroughly washed with distilled water until the wash solution showed neutral.
Two grams of each of the five pre-treated resins were weighed and placed in a 50 mL conical flask, and 30 mL crude flavonoids of THL (mass concentration is C0) were added. The mixture was placed in an uniform temperature (30°C) oscillation chamber and fully shaken at 150 r/min for 24 h, and then filtered with suction, fixed the volume of the filtrate and determined the mass concentration of flavonoids (C1). Afterward, the adsorption resins were placed in a conical flask of 50 mL. Thirty milliliters ethanol solution (80%), which is the desorption solution, was added to the rotary mixer to desorb for 24 h. After vacuum filtration, the volume of the filtrate was fixed, and the mass concentration of flavonoids (C2) was determined. The calculation formulas for adsorption capacity, adsorption rate, and desorption rate are as follows:


Q denotes adsorption amount, mg/g; Q1 denotes adsorption rate, %; Q2 denotes desorption rate, %; C0 denotes the flavonoid mass concentration in the initial adsorption solution, mg/mL; C1 denotes the flavonoid mass concentration in the adsorption equilibrium solution, mg/mL; C2 denotes the mass concentration in the desorption solution, mg/mL; V denotes the sce, mL; M denotes the wet weight of the resin, g.
According to the selected adsorption resin, the optimization of the purification conditions was based on adsorption time, ethanol concentration, desorption time, and sample pH value, and dynamic adsorption and desorption, including sample concentration, sample loading flow speed, elute flow speed, and elution volume.
Determination of Antioxidant Activity In Vitro of Total Flavonoids
DPPH Radical Scavenging Assay
The DPPH radical scavenging assay for assessing the antioxidant capability of the extracted total flavonoids was based on a study previously reported (Li et al., 2021). At room temperature, 1.0-mL sample solution (1–100 µg/L) of different concentrations was mixed with 2.0 mL of DPPH (0.1 mM in ethanol). After half an hour of incubation, the absorbance of the mixture solution was recorded at 517 nm and expressed as Ai. The absorbance when the DPPH solution was replaced by ethanol solution was also recorded and expressed as Aj. In addition, the absorbance when the sample solution was replaced by ethanol solution was recorded as expressed as A0. Ascorbic acid served as a positive control. The formula for the scavenging rate (I%) was as below:

The results were expressed by half maximal inhibitory concentration (IC50).
Hydroxyl Radical Scavenging Assay
The in vitro antioxidant activity of the extracted total flavonoids was also measured by hydroxyl free radical scavenging assay (Kang et al., 2022). Salicylic acid was selected as a trapping agent for hydroxyl radicals produced by the Fenton reagent reaction to evaluate the antioxidant activity of the flavonoids. To start the reaction, 2.0-mL sample solution of different concentrations of flavonoids was added to the test tube, and then 2.0 mL of 1.8 mmol/L ferrous sulfate solution and 2.0 mL of 1.8 mmol/L salicylic acid ethanol solution, and finally 0.1 mL of hydrogen peroxide (0.03%). The absorbance recorded at 510 nm was expressed as Ai. The absorbance recorded when the hydrogen peroxide was replaced by distilled water was expressed as A0. The absorbance recorded when the sample solution was replaced by 70% ethanol solution was expressed as Aj. Ascorbic acid served as a positive control. The formula for the scavenging rate was the same as Formula (4).
Results and Discussion
Results of a Single-factor Experiment for Flavonoid Extraction
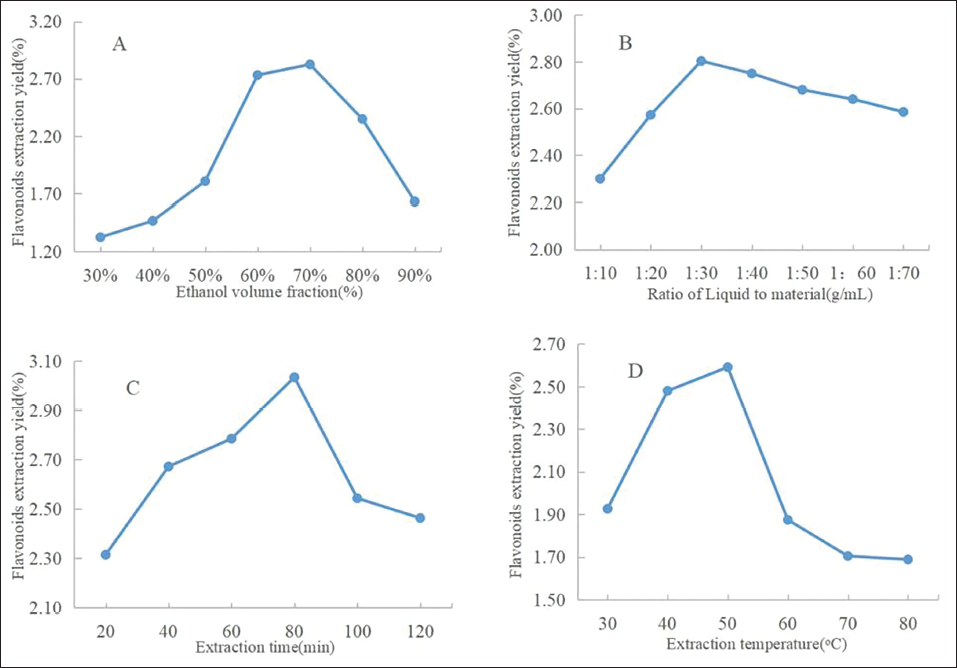
The results of the assessment of optimal ethanol volume fraction, L/S ratio, extraction temperature, and extraction time are presented in Figure 1. The extraction rate increased to the highest level when the volume fraction of ethanol was 70%, while declined sharply when the fraction was greater than 70%. This phenomenon was due to the polarity of the mixer change. The polarities of the mixer and total flavonoids were nearby when the volume fraction of ethanol was 70% (Yuan et al., 2014). Thus, the ethanol volume fractions of 60%, 70%, and 80% were taken as the three levels in the response surface experiment. As illustrated in Figure 1B, with the increase in the liquid-to-material ratio, the extraction rate increased first and then decreased with a further increase in the L/S ratio. This was because a larger L/S ratio corresponds to a larger difference in the concentrations between the plant and the exterior extraction solvent, thus the diffusion of the target compounds was more rapid. When the extract reaches saturation, too much ethanol may cause the dissolution of fat-soluble substances (Yao & Li, 2020). Besides, it is not cost-effective to use a large amount of extraction solvent, thus the L/S l ratios of 20:1, 30:1, and 40:1 g/mL were taken as the three levels in the response surface experiment. As illustrated in Figure 1C, the extraction rate of flavonoids gradually increased from 20 to 80 min, whereas after 80 min, the extraction rate declined, which may be due to that the flavonoid compounds of THL were unstable under the long-term heating (Wang et al., 2017), thus the extraction time of 60, 80, and 100 min were taken as the three levels in the response surface experiment. As illustrated in Figure 1D, when the temperature increases, the extraction rate of flavonoids first increased and then decreased sharply, which may be due to that the increase in temperature promotes molecular movement and accelerates the leaching of flavonoids, while the too-high temperature may destroy the structure of the flavonoid (Wang et al., 2022). Thus, the temperatures of 40℃, 50℃, and 60℃ were used as the three levels in the subsequent response surface experiment.
Effect of Sample Concentration (A), Ethanol Concentration (B), Liquid-Solid Ratio (C), and Extraction Temperature (D) on the Extraction of THL.
Response Surface Optimization
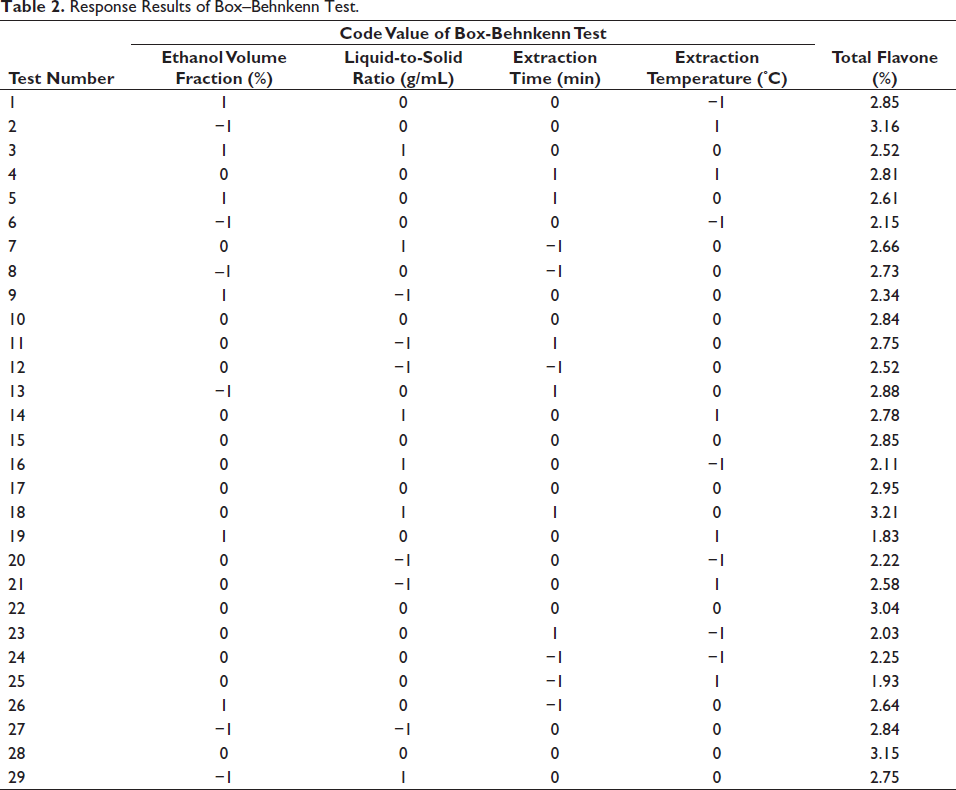
The extraction procedure of total flavonoids was designed by combining four factors and three horizontal based on the results of the single-factor experiment. The experimental design and response results are presented in Table 2. Design Expert 10.0 software was employed to conduct regression model variance analysis on the data in Table 2. By regression fitting the experimental data of each factor, the regression formula was obtained as follows:
Response Results of Box–Behnkenn Test.
Total flavonoids yield (%) = 2.97 − 0.1433A + 0.0650B + 0.1300C + 0.1233D + 0.0675AB − 0.0450AC − 0.5075AD + 0.0800BC + 0.0775BD + 0.2750CD − 0.1184A2 − 0.1209B2 − 0.1534 C2 − 0.4434D2.
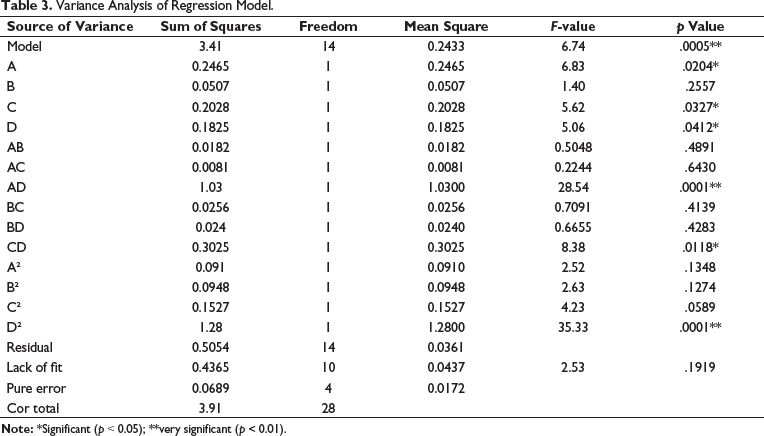
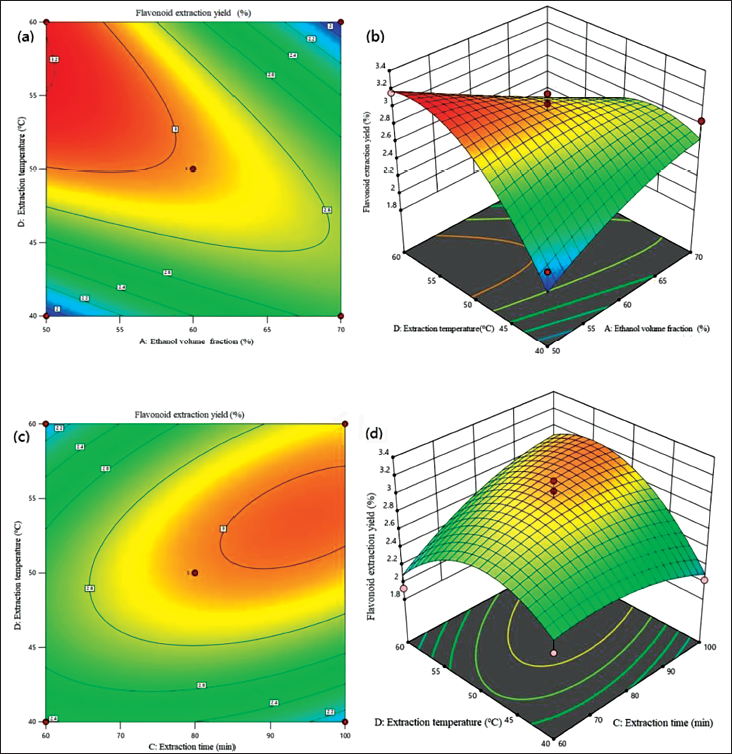
Table 3 shows that the regression ANOVA significance test showed that the model had significant regression (p = 0.0005 < 0.01), while the missing fitting item was not significant (p = .1919 > 0.05), and the model had statistical significance. The first-order terms A, C, and D have considerable impacts on the response value, and the second-order terms D2 have extremely remarkable impacts on the response value. The interaction term AD has a very significant effect on the response value, while CD has a significant influence. The F-value of each factor in the test can directly reflect the impact of each factor. The larger the F-value, the greater the effect on the response value. By analyzing the influence degree of each factor, it can be found that FA = 6.83, FB =1.40, FC = 5.62, FD = 5.06, thus it can be seen that the effect of each factor on the total flavonoids of THL was ethanol concentration > extraction time > extraction temperature > liquid-to-material ratio. The response surface diagram and contour diagram of the interaction between the test influencing factors were shown in Figure 2, which was in line with the results of the variance analysis of the regression model shown in Table 3. Response surface is an effective statistical and optimization method, which has been widely used in the exploration of optimal extraction conditions of flavonoids from plant sources. Compared with the traditional orthogonal design method, data analysis in the response surface method is more detailed, and the significance of each influencing factor and the interaction between the two factors can be intuitively seen (He, 2020; Yuan et al., 2019; Zhang et al., 2023).
Variance Analysis of Regression Model.
Contour and Response Surface of Effects of Two Factors on Extraction Yield of Total Flavonoids. (A) Contour of Effects of Ethanol Volume Fraction and Extraction Temperature. (B) Response Surface of Effects of Ethanol Volume Fraction and Extraction temperature. (C) Contour of Effects of Extraction Time and Extraction Temperature. (D) Response Surface of Effects of Extraction Time and Extraction Temperature.
Determination of Optimal Process Conditions and Model Verification
Further analysis by response surface software indicated that the optimal conditions for total flavonoid extraction were ethanol volume fraction of 60.06%, L/S ratio of 34.39:1 mL/g, extraction time 84.65 min, and extraction temperature of 45.02℃. The predicted value of TFC was 3.64%. Due to the operability of the conditions, the optimal extraction conditions of the total flavonoids were revised as 60% ethanol volume fraction, 35:1 mL/g L/S ratio, 85 min extraction time, and 45℃ extraction temperature. After three repeated tests, the TFC of THL was (3.59 ± 0.03)% under the adjusted technological conditions. The relative deviation from the predicted value was 1.39%, which has an ideal practical application value.
Selection of Macroporous Adsorption Resin
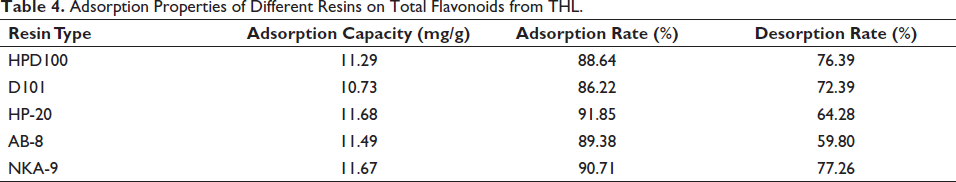
Macroporous resin is broadly used for the preliminary purification of flavonoid compounds due to its good selectivity, low cost, large adsorption capacity, fast adsorption rate, and convenient regeneration treatment (Ke et al., 2021; Wang et al., 2021). The absorption results of different resins on total flavonoids are shown in Table 4. Under the same conditions, different types of macroporous resins have different adsorption and desorption capacities. The adsorption and desorption rates of NKA-9 resins were 90.71% and 77.26%, respectively. NKA-9 is an ideal macroporous resin for the separation and purification of total flavonoids from THL.
Adsorption Properties of Different Resins on Total Flavonoids from THL.
Static Adsorption and Desorption
The research results of the factors influencing the purification process of flavonoids in THL are shown in Figure 3A–D. Within 1.5 h from the beginning of adsorption, the adsorption of NKA-9 resin increased exponentially. After 1.5 h of adsorption, the static adsorption of NKA-9 resin began to be stable. The static adsorption rate at 1.5 h was 90.40%. Within 2.0 h after desorption, the desorption rate of NKA-9 resin increased rapidly over time. After that, the desorption of NKA-9 resin stagnated, and there was little change in the overall long-term range. The results indicated that the static desorption time of NKA-9 resin was 2.0 h, and the static desorption rate was 76.82%.
Effect of Adsorption Time (A), Desorption Time (B), pH Value (C), and Ethanol Concentration (D) on the Purification Process of Flavonoids in THL.
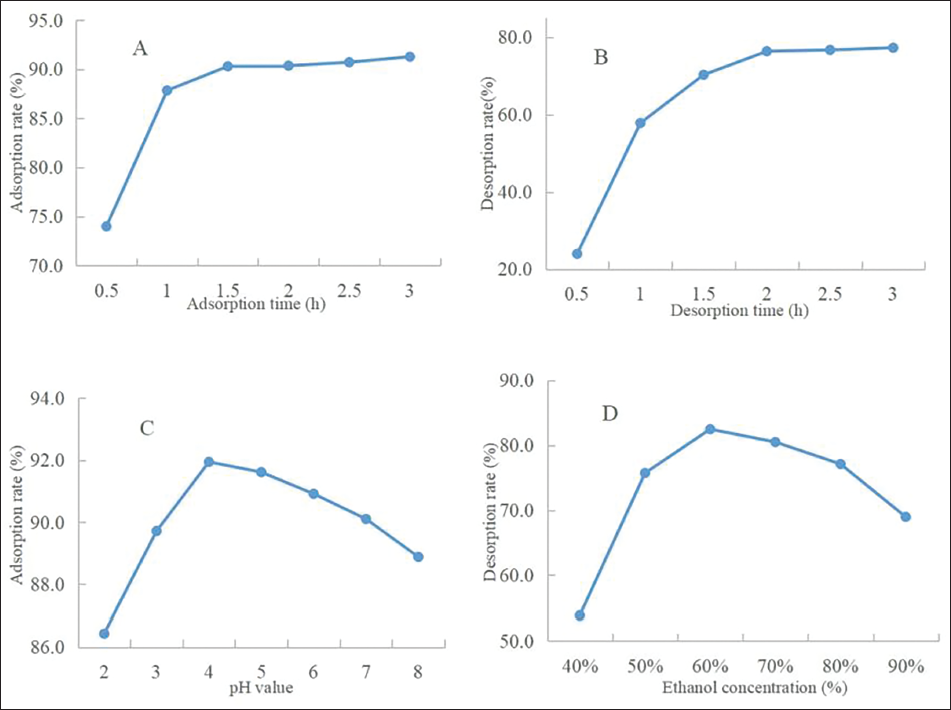
When PH increased, the adsorption rate increased at the beginning and then declined, and the maximum adsorption rate was observed when the pH was 4. When the pH increases, the phenolic hydroxyl group in the flavonoids will dissociate to H+ and the corresponding anion, which will affect the adsorption and selection performance of the macroporous resin, resulting in a decrease in the flavonoid adsorption rate. Thus the optimal pH was 4.0 (Hong et al.). The desorption rate of total flavonoids gradually increased when the ethanol concentration increased from 40% to 60%. The maximum desorption rate (81.05%) was reached when the ethanol concentration was 60%, indicating that the total flavonoids were easily eluted at this concentration. When the concentration exceeded 60%, the desorption rate decreased gradually. Thus 60% served as the eluent ethanol concentration.
Dynamic Adsorption and Desorption
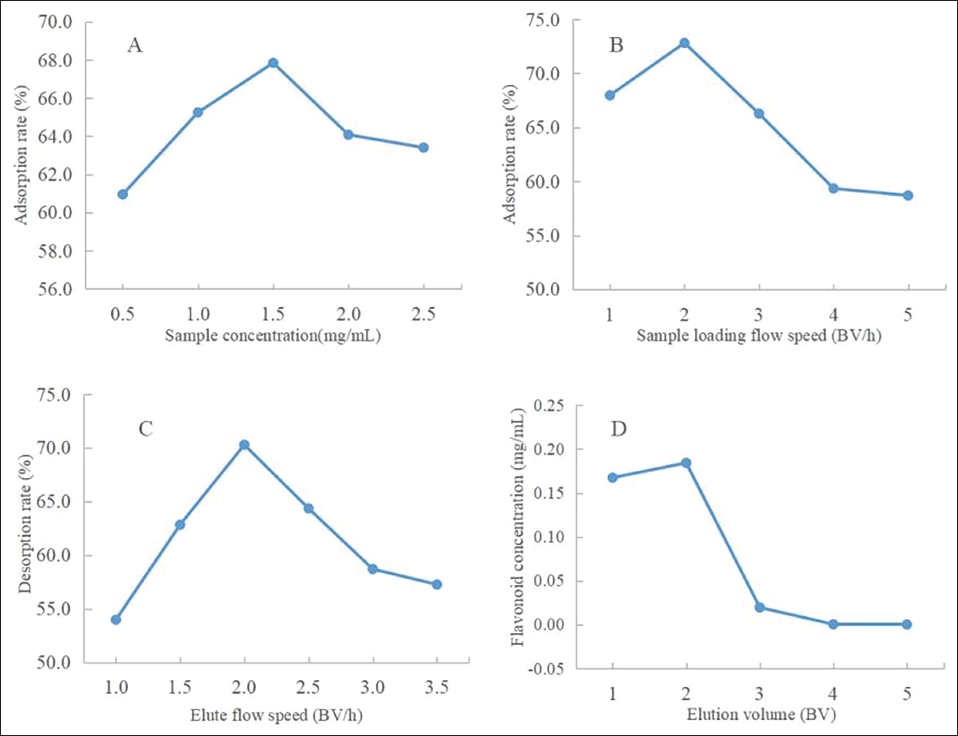
The research results of the factors influencing the purification process of flavonoids in THL are shown in Figure 4A–D. The impact of sample concentration on the adsorption rate is shown in Figure 4A. When the concentration was 0.5 to 1.5 mg/mL, the adsorption rate of the resin increased with the increase in sample solution concentration. When the sample concentration exceeds 1.5 mg/mL, the adsorption rate decreases. This was because the flow rate of low-concentration flavonoid solution was greater than the mass transfer rate when it passed through the column bed, and the mass transfer adsorption was not thorough. However, the flow rate of the carrier liquid at high concentration through the column bed slowed down, and the mass transfer rate to the interior slowed down, resulting in the leakage of some flavonoid components and not being adsorbed in time (Yang, Huang, et al., 2020). In addition, excessive concentration of the loading solution may also lead to a short service period of the adsorbent resin, increase the number of regenerations, and affect the service life of the resin. When the sample solution was 1.5 mg/mL, the adsorption rate reached 67.84%, thus the concentration of 1.5 mg/mL of the sample solution was taken in the subsequent test.
Effect of Sample Concentration (A) Sample Loading Flow Speed, (B) Elute Flow Speed, (C) and Elution Volume, (D) on the Purification Process of Flavonoids in THL.
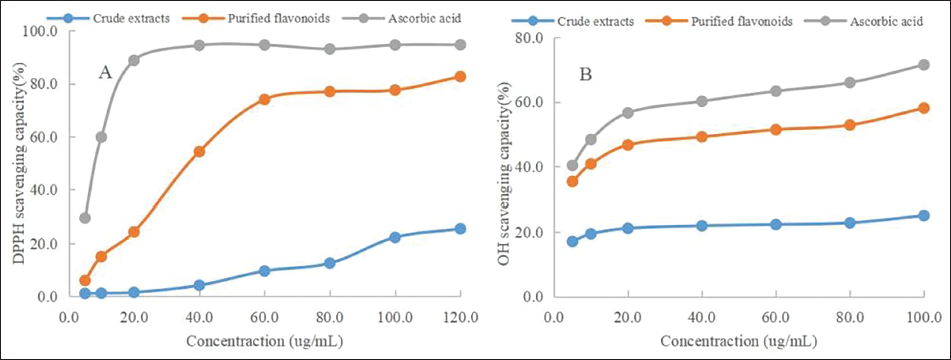
Determination of Antioxidant Activity In Vitro of Flavonoids in THL. (A) DPPH Radical Scavenging Activity, (B) OH Radical Radical Scavenging Activity.
The impact of sample loading flow speed on the adsorption rate of NKA-9 resin is shown in Figure 4B. When the loading flow speed was from 1.0 to 2.0 BV/h, the total flavonoid adsorption rate increased with the flow rate. When the loading flow speed exceeded 2.0 BV/h, the total flavonoid adsorption rate decreased with increasing flow speed. This was because when the flow speed was too low, the contact time between the solution and the resin was longer and the adsorption rate gradually increased. However, if the flow speed was too high, the active components could not be adsorbed on the resin, resulting in increased leakage of flavonoids and decreased adsorption rate (Yang, Liu, et al., 2020). Therefore, the sample loading flow speed of 2.0 BV/h was chosen for subsequent tests.
The impact of elute flow speed on the desorption rate of NKA-9 resin is shown in Figure 4C. The elute flow speed was usually required to be slow because too fast a flow rate will lead to poor elution performance, elution bandwidth, and serious tailing and incomplete elution. However, too slow a flow rate will prolong the whole elution period (Shi & Zhang, 2023). When the elute flow speed was 2.0 BV/h, the desorption rate reached the maximum value of 71.24%. To use as little solvent as possible to fully elute the flavonoids, it was necessary to explore the influence of the elution volume. The influence of volume is shown in Figure 4D. When the elution volume increased, the total flavonoid mass concentration in the eluent decreased accordingly. When the elution volume reached 4 BV, the total flavonoid concentration in the eluent was less than 0.01 mg/mL, indicating that the flavonoids on the resin had been fully eluted at this time, so the elution volume was determined to be 4 BV.
Calculation of Purity
The total flavonoids of THL were purified by NKA-9 macroporous adsorption resin. The purity was calculated as follows:

After purification by NKA-9 resin, the purity of the refined product was (58.92 ± 0.22)%, which was ideal.
Determination of the Antioxidant Activity In Vitro of Flavonoids in THL
This assessment was based on the method reported previously (Wang, 2022). The scavenging effect of crude extracts and purified flavonoids on the DPPH radical is illustrated in Figure 5A. Ascorbic acid served as a control. The results showed that the DPPH scavenging rate and flavonoid concentration were positively correlated, implying that the purified flavonoids had higher activity, which was beneficial to the scavenging capability. When the concentration reached 60.0 µg/mL, the scavenging rate became stable. When the concentration was 5.0–120.0 µg/mL, the scavenging rate of DPPH in flavonoid solution was between 6.1% and 82.7%, and its IC50 was 33.1 µg/mL; the reason was that NKA-9 adsorbed some of the nonflavonoid impurities, making the content of flavonoid in THL higher. The IC50 value of Vitamine C (VC) for the positive control was 7.2 µg/mL. The order of DPPH radical scavenging ability was ascorbic acid > purified flavonoids > crude extracts.
Hydroxyl radicals are a type of reactive oxygen species, meaning they contain at least one unstable oxygen atom, one of which has extra electrons, causing it to become too active to react with other substances. Hydroxyl radicals can react with active substances and convert them into inactive substances, thus preventing oxidation reactions. Hydroxyl radical scavenging helps to prevent cell damage caused by free radicals, protect cellular structures, and resist damage caused by oxides (Ge et al., 2023). The scavenging effects of crude extracts and purified flavonoids on the Hydroxyl radical are displayed in Figure 5B. Ascorbic acid was the control. The scavenging rate of hydroxyl radicals gradually enhanced along with the increase of flavonoid concentration. The change in the concentration of the crude extract has little effect on the scavenging of hydroxyl radicals, which may be because of the large content of impurities in the crude extract. The purified flavonoids were significantly better at scavenging hydroxyl radicals than the crude extract. When the concentration was 5.0–100.0 µg/mL, the scavenging rate of hydroxyl radicals in purified flavonoid solution was between 35.4% and 58.1%, and its IC50 was 42.7 µg/mL. The IC50 value of VC for the positive control was 12.2 µg/mL. The ability of hydroxyl radical scavenging was ascorbic acid > purified flavonoids > crude extracts.
In summary, for maximizing extraction of flavonoids from THL, the following optimum extraction conditions were determined: ethanol concentration of 60%, liquid-solid ratio of 35:1 mL/g, extraction time of 85 min, and temperature of 45℃. Under the optimized conditions, the extraction rate of flavonoids in THL could reach (3.59 ± 0.03)%. As compared with other process optimization designs (Yu et al., 2021), the extraction rate of flavonoids was significantly improved. The most suitable resin was NKA-9 resin, and the optimized purification process conditions of flavonoids in THL were mass concentration of adsorption solution 1.50 mg/mL, pH value of adsorption solution 4.0, sample loading flow rate 2 BV/h, ethanol concentration in the desorption process 60%, desorption flow rate 2 BV/h, and the elution volume 4 BV. After the extracts were purified by NKA-9 macroporous resin, the TFC increased from (21.76 ± 0.18)% to (58.92 ± 0.22)%, which was increased by 2.71 times. The results showed that flavonoids in THL have excellent antioxidant capability, with the IC50 values of 33.1 µg/mL for scavenging DPPH radical and 42.7 µg/mL for scavenging hydroxyl radical.
Conclusion
In this study, an optimized purification method for the total flavonoids from THL was explored. Based on the conditions determined, a high extraction rate was obtained. The antioxidant capability assessment indicated that it could be developed as potential antioxidants. The contents and results of this study have important reference value for the research on the active components and efficacy of THL, especially the development and utilization of the flavonoids of THL.
Abbreviations
DPPH: 2,2-Diphenyl-1-picrylhydrazyl; IC50: Half maximal inhibitory concentration; L/S ratio: Liquid-to-solid ratio; T. hemsleyanum: Tetrastigma hemsleyanum Diels et Gilg; THL: T. hemsleyanum leaves; TFC: Total flavonoid content.
Footnotes
Declaration of Conflicting Interests
The authors declared no potential conflicts of interest with respect to the research, authorship, and/or publication of this article.
Ethical Approval
Not applicable.
Funding
This work was supported by the Scientific Research Fund of Zhejiang Provincial Education Department (Grant No. Y202352997), Ningbo Public Welfare Science and Technology Plan Project (Grant No. 2019C50063), and Ningbo City Science and Technology Innovation 2025 Major Research Project (Grant No. 2019B10008).
Informed Consent
Not applicable.