
Abstract
Background
Ginseng (Panax ginseng C. A. Meyer) is a type of plant that cannot be continuously cultivated. Continuous cultivation of ginseng can lead to the deterioration of soil properties, affecting the normal growth and development of ginseng.
Objectives
Improving soil quality and breaking down the obstacles to the continuous cultivation of ginseng can help the sustainable development of the ginseng cultivation industry. We hope to improve the quality of continuous cropping soil through reductive soil disinfection (RSD), and we hope that the quality of ginseng cultivated in soil under RSD improvement conditions can be improved.
Materials and Methods
A 3-year-old ginseng field was used as a control, soybean (SOY), broccoli (BRO), alfalfa (ALF), purple perilla (PPE), and rapeseed (RAP) were used as organic carbon sources. RSD improvement technology was used to treat the soil of the old ginseng field before planting ginseng. The content of ginsenosides was determined by high-performance liquid chromatography and the total ginsenoside content was determined by perchloric acid-vanillin-acetic acid colorimetry. Soil pH, conductivity, bulk density (SBD), maximum water capacity (MWC), capillary water capacity (CWC), soil moisture content (SWC), alkali hydrolyzed nitrogen (SAN), organic matter (SOM), available phosphorus, urease activity, catalase activity, protease activity, sucrase, amylase, cellulase, and glucanase activities and acid phosphatase activity were determined based on the methods in the literature.
Results
RSD treatment significantly increased the content of ginsenosides, improved soil acidity, and increased soil enzyme activity and water-holding capacity. When PPE and BRO were used as RSD carbon sources, soil salinization could be improved. Ginsenoside Rb2, Rc, Rd, Rb3, Rb1, Ro, TG, Rg1, Re, soil nitrate reductase, soil protease, SBD, and SWC were the most active factors under RSD treatment and were also the main influencing factors for distinguishing sample differences under different RSD treatments. The results obtained by the analytic hierarchy process showed that all RSD treatments improved the comprehensive quality of ginseng and soil samples, with SOY, PPE, and RAP being the better treatments.
Conclusion
SOY was the best method for RSD processing. RSD not only improved soil properties but also enhanced the quality of ginseng, making it an effective technique for soil remediation in intensive ginseng cultivation.
Introduction
Ginseng (Panax ginseng C. A. Meyer) is a perennial herbaceous plant in the Araliaceae family. Its roots are mainly used as medicine. Ginseng is mainly distributed at 33°–48° North latitude, including China, Japan, North Korea, South Korea, and Russia. China has the world’s largest ginseng planting area and total yield, mainly distributed in forest areas such as the Changbai Mountains and the Greater Xing’an Mountains and the Lesser Xing’an Mountains in Northeast China, and the ginseng in the Changbai Mountain area of Jilin Province has the highest quantity and best quality (Jung et al., 2003; Wan et al., 2017). Like many other crops, ginseng also has continuous cropping obstacles. It grows continuously on fixed plots for 4−5 years. As the plant age increases, soil-borne diseases of ginseng become more severe, causing root rot and rust and reducing the survival rate of ginseng (Tong et al., 2023). This poses a serious threat to sustainable agricultural production. Therefore, reusing limited ginseng resources, solving the problem of ginseng having no land to grow, and completely breaking down the obstacles of continuous ginseng cultivation have become urgent matters in ginseng production.
Reductive soil disinfection (RSD), also known as biological soil disinfection or anaerobic soil disinfection (Blok et al., 2000; Shinmura, 2000), is a soil ecological treatment method before crop planting. This method creates soil environmental conditions that are not conducive to the growth of pathogenic microorganisms but are conducive to crop growth in the soil–crop microbial relationship in order to reduce the incidence of soil-borne diseases and increase crop yield (Li et al., 2016). The RSD processing steps are (1) adding organic substances; (2) flooded film covering; and (3) when the soil no longer produces a foul odor, ending the treatment, removing the film for drainage, and air drying the soil (Gafner et al., 2004). For this purpose, we designed five organic substances as carbon sources, namely soybeans (SOY), broccoli (BRO), alfalfa (ALF), purple perilla (PPE), and rapeseed (RAP). The soil of the old ginseng field was used as a control (CK), and the improvement technology of RSD was used to treat the soil of the old ginseng field. We investigated the effects of different organic substances as carbon sources on the content of ginsenosides and soil properties. We assumed that all treatments could increase the content of ginsenosides and improve the soil properties of the old ginseng field.
Materials and Methods
Overview and Experimental Design of the Research Area
The experiment was conducted at the Northern Medicinal Plant Resource Nursery in Zuojia Town, Changyi District, Jilin City, Jilin Province, China (44°02′N, 126°15′E, altitude 237 m). The area has a temperate monsoon continental climate with variable weather and distinct four seasons. The annual average temperature is 5.6°C, the annual average precipitation is 679 mm, the annual average freezing period is more than 5 months, and the frost-free period is about 120 days. The soil parent material type is dark brown soil. The soil of the old ginseng field before treatment was the soil that had been continuously planted with ginseng for 3 years.
The experiment used six treatments: (1) CK, (2) PPE treatment, (3) ALF treatment, (4) SOY treatment, (5) BRO treatment, and (6) RAP treatment. Five organic substances were dried and chopped into pieces, and the RSD treatment method was as follows: SOY, BRO, ALF, PPE, and RAP were mixed evenly (1%, w/w) with a 0−20 cm soil layer; the soil was irrigated to 100% water holding capacity, and a blue plastic film (polyethylene, transparent, 0.1 mm in thickness, and low permeability to oxygen) was covered to ensure strict anaerobic conditions in a high-temperature greenhouse. After 40 days, the plastic film was removed, and ventilation and drainage were carried out to allow the soil to naturally dry before overturning the soil. Strictly ensure that the soil temperature is 30°C−40°C during RSD treatment. Each treatment consisted of three replicates, each covering an area of 30 m2 (2 m × 15 m), using a completely randomized block design. On October 20, 2020, ginseng transplantation was carried out, and 2-year-old healthy ginseng seedlings of similar sizes were transplanted to different treatment and control plots. The experimental base was managed by the same farmer, and other field management was carried out according to local traditional methods.
Sample Collection and Processing
Due to the fact that the third year of ginseng growth is the fastest stage of ginseng growth, and the period from July to August is the peak period of assimilation of ginseng carbon and photosynthesis in the aboveground parts of ginseng throughout the year (Yin et al., 2022), this study collected ginseng and soil samples in the third year of ginseng growth (2022) as the research subjects. The sample collection periods were the early green fruit period (July 1) and the early red fruit period (August 1) of ginseng growth. Set 20 soil sampling points in an “S” shape for each treatment, and mix the five soil sampling points into a composite sample after soil sampling. This method meant obtaining four composite soil samples from each treatment, so a total of 24 soil composite samples were collected at a depth of 0–20 cm in six treatments (including CK). Subsequently, plant residues, stones, and other impurities were removed from the soil. A portion of the soil was air-dried and ground through a 2-mm mesh sieve. This portion of the soil was used for subsequent soil properties and enzyme activity analysis. The other portion was placed in sterile self-sealing bags and sent to the laboratory for storage at −20°C for future use. At the same time, six plants were randomly selected from each treatment and labeled. The sediment was slowly washed with deionized water to remove it. The surface water was gently sucked off with filter paper and then dried at a low temperature (42°C) for the determination of ginsenoside content.
Soil Property
The soil pH value was measured by a pH meter (the ratio of soil to water is 1:5). Soil conductivity (EC) was measured by a conductivity meter (soil water ratio 1:5), soil bulk density (SBD), maximum water capacity (MWC), capillary water capacity (CWC) were measured by the ring knife method, soil moisture content (SWC) was measured by the drying method, alkali hydrolyzed nitrogen (SAN) was measured by the alkali hydrolysis diffusion method, organic matter (SOM) was measured by the potassium dichromate oxidation ferrous ammonium sulfate titration method, and soil available phosphorus (SAP) was extracted by 0.5 M sodium bicarbonate and determined by the molybdenum blue colorimetric method. The indophenol blue colorimetric method was used to measure soil urease activity (SUA), the potassium permanganate titration method was used to measure soil catalase activity (SCA), the ninhydrin colorimetric method was used to measure soil protease activity (SPA), the 3,5-dinitro salicylic acid colorimetric method was used to measure soil sucrase (SSA), amylase (SAA), cellulase (SCA1) and glucanase (SGA) activities, the phenol disulfonic acid colorimetric method was used to measure soil nitrate reductase activity (SNRA), and soil acid phosphatase activity (SAPA) was measured by sodium phenyl phosphate colorimetry. The above soil indicators were determined based on the methods in the literature (Bao, 2000; Guan, 1986).
Ginsenoside Content
The content of 11 ginsenosides (Ro, Rg1, Re, Rf, Rb1, Rc, Rb2, Rb3, Rd, Rh2, and Rg3) was determined by high-performance liquid chromatography (Zhang et al., 2021). Thermo Ultimate 3000 high-performance liquid chromatography was used, and the chromatographic column was Elite Hypersil ODS2 (250 mm × 4.6 mm, 5 μm). The mobile phase was acetonitrile (A)―water (B), gradient elution (0−17 min, 12%–18% A; 17–29 min, 19%–27% A; 30–31 min, 27%–31% A; 32–52 min, 31%–35% A; 52–69 min, 35%–80% A; and 69–85 min, 80%–12% A), flow rate was 1.0 mL/min, column temperature was 25°C, detection wavelength was 203 nm, and injection volume was 10 μL. We extracted ginsenosides from ginseng by methanol ultrasonic extraction method and then determined the content of total ginsenosides (TG) by perchloric acid-vanillin-acetic acid colorimetry and absorbance at 544 nm.
Statistical Analysis
The raw data was organized in Excel 2020, and the Duncan test was used to perform multiple comparisons on the data in IBM SPSS 21.0 software (p < 0.05 was defined as a significant difference, and a, b, c, d, e, and f were used to indicate the significance of the differences; *p < 0.05; **p < 0.01; and ***p < 0.01, the differences were statistically significant). The drawing was conducted on GraphPad Prism 8.2, Principal Component Analysis (PCA) and Orthogonal Partial Least Squares-Discriminant Analysis (OPLS-DA) were performed on SIMCA 14.1, and correlation analysis, cluster analysis, and redundancy analysis (RDA) were conducted on the Lianchuan Biological Cloud Platform (
Results
Appearance and Ginsenoside Content of Ginseng
There were significant differences between ginseng treated with different RSD and control in the early period of green fruit (Figure S1). Compared with CK, the aboveground parts of ginseng were higher under SOY, PPE, and RAP treatments. The fibrous roots of ginseng were more under SOY, BRO, and PPE treatments than CK, and the transverse ring patterns of ginseng main roots were more under BRO and RAP treatments than CK. It is worth noting that there are several lesions on the main roots of ginseng under PPE treatment that were not observed in the main roots of other groups of ginseng.
The primary dissimilarities were found between the RSD-treated and untreated soil samples rather than among the different soil types. In the early period of green fruit (Figure 1a) and the early period of red fruit (Figure 1b), the content of 11 ginsenosides and TG in RSD treatment was higher than that in CK, respectively. In the early period of green fruit, only the content of ginsenoside Ro was lower than that in CK under PPE treatment (p < 0.05), and the difference in the content of ginsenosides Rb2, Rc, and Rh2 was not significant compared to CK (p > 0.05). The content of ginsenosides Ro, Rb2, Rb3, Rc, and Rh2 under ALF treatment was lower than that of CK (p < 0.05), and the difference in ginsenoside Rf content between ALF treatment and CK was not significant (p > 0.05). The content of ginsenosides Ro, Rf, Rb2, Rc, and Rh2 under BRO treatment was not significantly different from CK (p > 0.05), while the content of other ginsenosides was higher than CK (p < 0.05). Under RAP treatment, only the content of ginsenoside Ro was lower than CK (p < 0.05), and there was no significant difference in TG content compared to CK (p > 0.05).
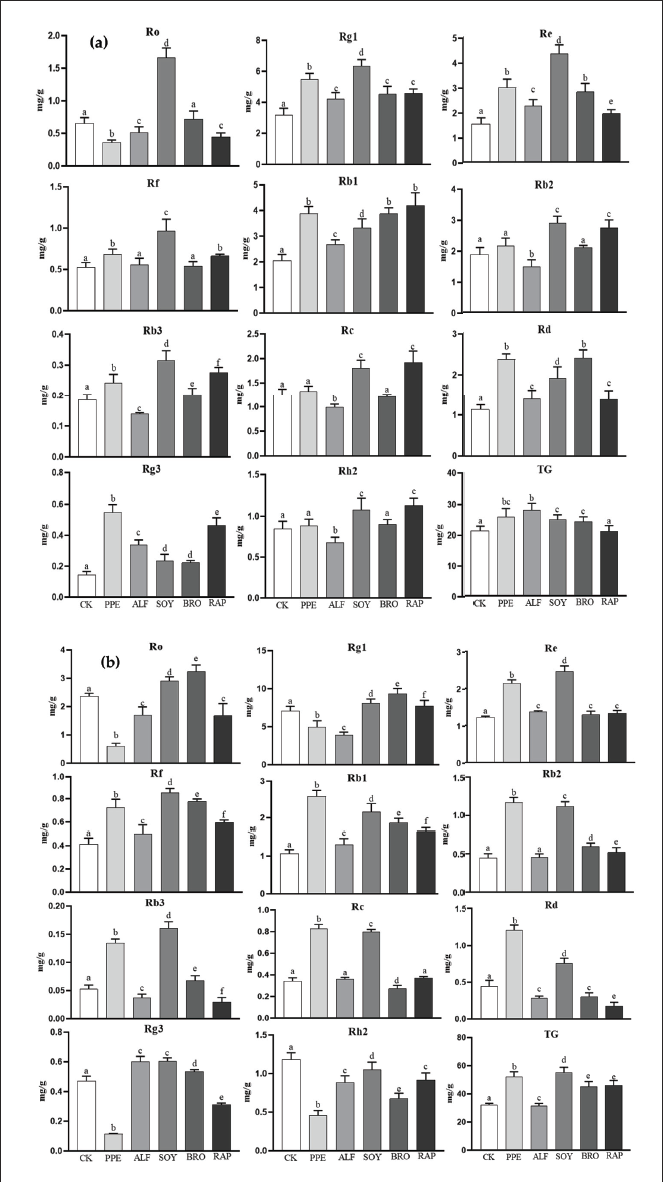
In the early period of red fruit, the content of ginsenosides Re, Rf, Rb1, Rc, Rb2, Rb3, and Rd treated with PPE was higher than that of CK (p < 0.05). Under ALF treatment, the content of ginsenosides Re, Rf, Rb1, and Rg3 was higher than that of CK (p < 0.05), while the content of ginsenosides Rb2 and Rc was not significantly different from CK (p > 0.05). The content of ginsenosides Rc, Rd, and Rh2 under BRO treatment was lower than CK (p < 0.05), while the content of other ginsenosides was higher than CK (p < 0.05). The content of ginsenosides Rg1, Re, Rf, Rb1, Rb2, and TG under RAP treatment was higher than that of CK (p < 0.05), while the content of ginsenoside Rc was not significantly different from CK (p > 0.05).
Overall, SOY treatment had the most significant effect on increasing the content of all ginsenosides (except for Rh2). The content of ginsenoside Re, Rf, Rb3, Rd, and TG in PPE treatment was significantly higher than that in CK. The content of ginsenoside Rf, Rb2, and TG in RAP treatment was significantly higher than that in CK. The content of ginsenosides Rb3, Rg3, and TG in BRO treatment was significantly higher than that in CK, while the content of ginsenoside Rg3 in ALF treatment was significantly higher than that in CK. It is worth noting that all RSD treatments can significantly increase the content of ginsenoside Re and Rb1.
Soil Properties
There were significant differences in soil properties between the early green fruit period (Figure 2a) and the early red fruit period (Figure 2b) under RSD treatment compared to CK. In the early period of green fruit, we found that after RSD treatment, SWC, SOM, and SPA were significantly lower than CK (p < 0.05), while pH, SAN, SGA, and SNRA were significantly higher than CK (p < 0.05). Second, MWC was significantly higher than CK (p < 0.05), and CWC was significantly lower than CK (p < 0.05) after four RSD treatments except for PPE. SBD was significantly lower under SOY treatment than CK (p < 0.05), EC was significantly lower under RRE and BRO treatment than CK (p < 0.05), and SAP was significantly higher under ALF and RAP treatment than CK (p < 0.05). Except for BRO, under the other four treatments, SUA was significantly higher than CK (p < 0.05), while SSA was significantly lower than CK (p < 0.05). Under ALF and SOY treatments, SCA was significantly lower than CK (p < 0.05), while SAA was significantly higher only under RAP treatment than CK (p < 0.05). SCA was significantly higher under PPE, ALF, and RAP treatments than CK (p < 0.05), while SAPA was significantly higher under PPE, SOY, and BRO treatments than CK (p < 0.05).
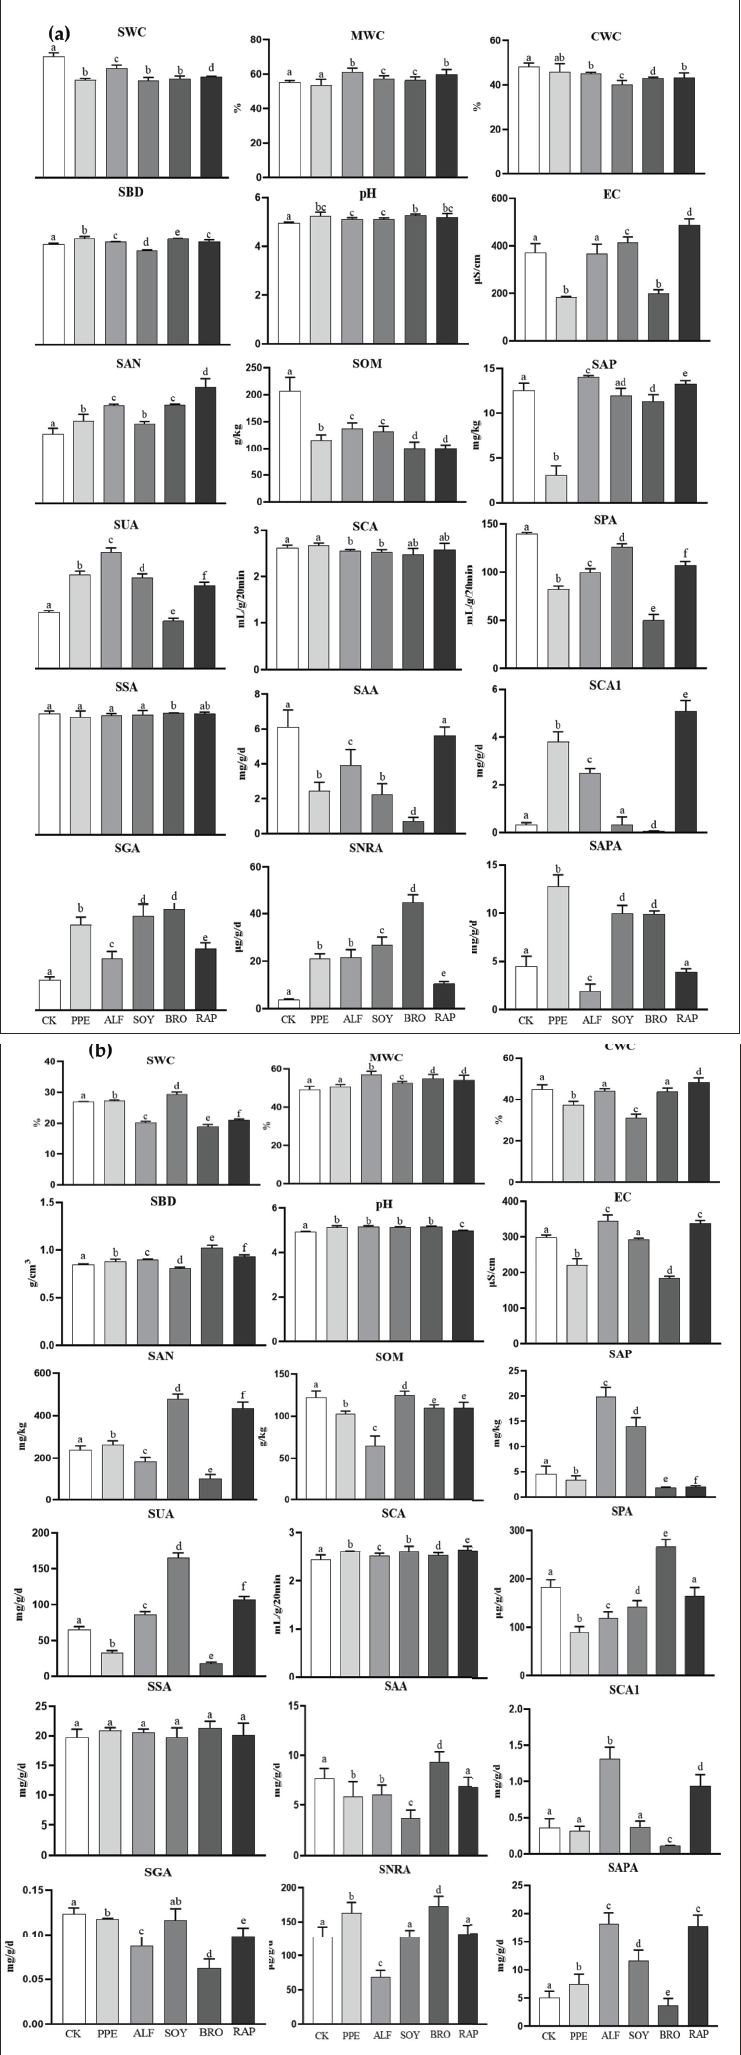
In the early period of red fruit, we found that pH and SCA were significantly higher than CK after RSD treatment (p < 0.05). Second, the results of MWC, SBD, and EC were the same as those of the early green fruit period. SWC was significantly higher under PPE and SOY treatments than CK (p < 0.05), CWC was significantly higher under RAP treatment than CK (p < 0.05), SAP was significantly higher under PPE, SOY and RAP treatments than CK (p < 0.05), SOM was significantly higher under SOY treatment than CK (p < 0.05), SAP and SUA were significantly higher under SOY and ALF treatment than CK (p < 0.05), and SAA and SPA were significantly higher under BRO treatment than CK (p < 0.05). There was no significant difference in SSA among the five RSD and CK treatments (p > 0.05). SCA1 was significantly higher under ALF and RAP treatments than CK (p < 0.05), SGA was significantly higher under SOY treatment only than CK (p < 0.05), SNRA was significantly higher under PPE and BRO treatment than CK (p < 0.05), and SAPA was significantly lower under BRO treatment only than CK (p < 0.05).
Overall, RSD treatment significantly increased pH and had little effect on SSA, while PPE and BRO treatments significantly reduced EC. Except for PPE, the other four RSD treatments significantly improved MWC, while PPE treatment significantly increased SNRA. SOY treatment significantly reduced CWC, and SBD increased SAN, SUA, and SAPA. ALF treatment significantly increased SAP, SUA, and SCA1. RAP treatment significantly increased SUA and SCA1, and BRO treatment significantly increased SPA and SAPA.
The Correlation Between Ginsenosides and Soil Properties
The study identified 11 types of ginsenosides that can be divided into two different types: damarane-type tetracyclic triterpenoid saponins and oleanol-type pentacyclic triterpenoid saponins. Among them, damarane-type tetracyclic triterpenoid saponins include protopanaxadiol type saponins (PPD-type saponins) and protopanaxatriol type saponins (PPT-type saponins) (Gafner et al., 2004; Tran et al., 2001). In our study, Ro is oleanol-type pentacyclic triterpenoid saponins, PPD-type saponins include Rb1, Rc, Rb2, Rb3, Rd, Rh2 and Rg3, and PPT-type saponins include Rg1, Re and Rf. Therefore, in addition to 11 ginsenosides and TG, we also analyzed PPD-type and PPT-type saponins. We conducted a correlation analysis between ginsenosides and soil factors (Figure 3). The results showed that Ro was significantly positively correlated with SPA (p < 0.01), Rg1 was significantly positively correlated with SPA and SNRA (p < 0.01), Re and Rd were significantly negatively correlated with SAA (p < 0.001), Rc, Rb2 and PPD-type saponins were significantly negatively correlated with SNRA (p < 0.01), Rd was significantly negatively correlated with SPA (p < 0.01), PPD-type saponins were significantly negatively correlated with SAA (p < 0.01), and TG was significantly positively correlated with SNRA (p < 0.001). In addition, there was also a significant correlation between soil properties, with pH highly negatively correlated with MWC (p < 0.01), SSA negatively correlated with SPA (p < 0.001), and SAA positively correlated with SPA (p < 0.01). There was also a significant correlation between different ginsenosides. Ro was highly positively correlated with Rg1 (p < 0.001), Rg1 was highly positively correlated with PPT-type saponins (p < 0.001), Re was highly positively correlated with Rd, Rb2 Rb3, and PPD-type saponins (p < 0.01), and Rb1 was highly positively correlated with Rb2, Rb3, Rc, Rd and PPD-type saponins (p < 0.001).
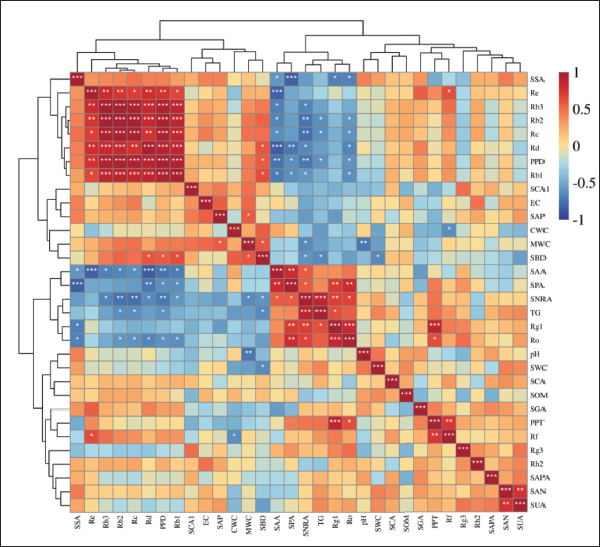
In addition, cluster analysis roughly divided ginsenosides and soil factors into four categories, namely, Class I (SSA, Re, Rb3, Rb2, Rc, Rd, PPD-type saponins, and Rb1), Class II (SCA1, EC, SAP, CWC, MWC, and SBD), Class III (SAA, SPA, SNRA, TG, Rg1, and Ro), and Class IV (pH, SWC, SCA, SOM, SGA, PPT-type saponins, Rf, Rg3, Rh2, SAPA, SAN, and SUA); the similarity of factors clustered into one group was relatively high.
Chemical Pattern Recognition Analysis
Cluster analysis was used to analyze samples from the green and red fruit periods. The content of 11 ginsenosides, PPD-type saponins, PPT-type saponins, and TG, as well as 18 soil factors, were used as the original variables. All data were standardized, and the intergroup connection method and squared Euclidean distance method were used as clustering methods. The results were as follows (Figure 4a). The samples could be roughly divided into three categories, namely, Class I (BRO8), Class II (SOY8, CK8, PPE8, ALF8, and RAP8), and Class III (CK7, PPE7, RAP7, ALF7, SOY7, and BRO7).
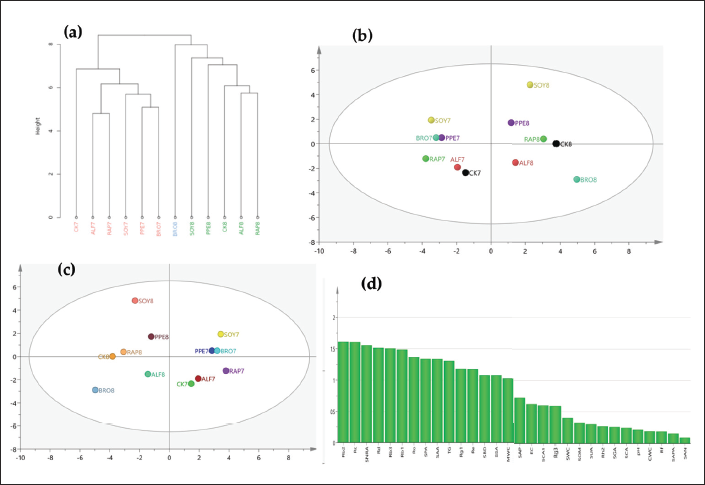
On the basis of cluster analysis, we transformed the raw data of all samples into a data matrix and imported it into Microsoft Excel. Then, the data matrix was imported into SIMCA 14.1 (Umetrics, Umea, Sweden) for mean centering and Pareto calibration, and multivariate analysis (PCA and OPLS-DA) was performed. In the PCA model (Figure 4b), R2X (cum) = 0.992, Q2 (cum) = 0.511, indicating good stability and predictive ability of the model, which could be analyzed. The result showed that the 12 batches of samples from the green and red fruit periods under different treatments were clearly divided into two categories, indicating significant differences in the samples from different periods under RSD treatment. It is worth noting that the six sample points in the red fruit period were more dispersed compared to the six sample points in the green fruit period, indicating that the differences between different RSD treatment samples were greater with the change in planting time. In the OPLS-DA model (Figure 4c), R2X (cum) = 0.964, Q2 (cum) = 0.718, and the distribution of sample points in the model was not significantly different from PCA. Variable importance projection (VIP) refers to the projection value of the importance of a variable. The larger the VIP value of a variable, the greater its contribution to sample classification (Gafner et al., 2004). It is generally believed that when the variable VIP ≥ 1, the variable has a greater contribution to group differentiation and is a characteristic component between groups (Gafner et al., 2004). The VIP values (Figure 4d) from high to low were Rb2, Rc, SNRA, Rd, Rb3, Rb1, Ro, SPA, SAA, TG, Rg1, Re, SBD, SSA, and MWC, ranging from 1.61 to 1.03. These characteristic components were mostly distributed in the first and third categories (Class I and Class III) of the clustering results of ginsenosides and soil factors in “The correlation between ginsenosides and soil properties.”.
Redundancy Analysis of Ginsenosides and Soil Properties
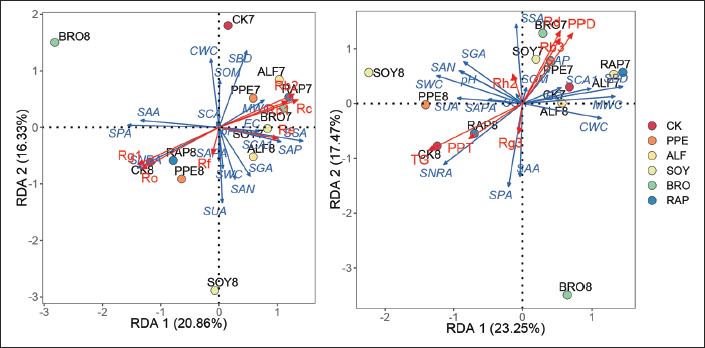
Based on the above analysis results, we used RDA to further evaluate the relationship between soil properties and ginsenosides under RSD conditions. The first and second RDA axes accounted for 37.19% (Figure 5a) and 40.72% (Figure 5b) of the variance of soil properties, which could better reflect the relationship between soil properties and ginsenosides. There was a significant correlation between Ro (r2 = 0.636, p = 0.008), Rg1 (r2 = 0.654, p = 0.007), Rc (r2 = 0.578, p = 0.013), Rb2 (r2 = 0.559, p = 0.016) (Figure 5a), Rd (r2 = 0.534, p = 0.027), PPD-type saponins (r2 = 0.573, p = 0.02), and TG (r2 = 0.738, p = 0.003) (Figure 5b) and soil properties. Ginsenoside Ro and Rg1 had a high positive correlation with SNRA, SAA, and SPA, and a high negative correlation with MWC. Contrary to Ro and Rg1, Rc and Rb2 had a higher negative correlation with SNRA, SAA, SPA, and a higher positive correlation with MWC. Rd and PPD-type saponins had a high positive correlation with SOM, SAP, SSA, and SCA1, and a high negative correlation with SNRA, SAPA, SUA, and SPA. Contrary to Rd and PPD, TG had a higher negative correlation with SOM, SAP, SSA, and SCA1, and a higher positive correlation with SNRA, SAPA, SUA, and SPA.
AHP Comprehensive Evaluation Analysis
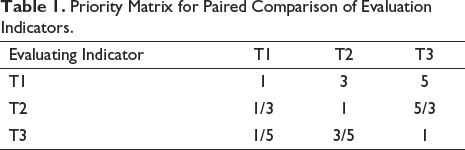
AHP is a decision-making method that decomposes elements that are always related to decision-making into levels such as goals, criteria, and plans and conducts qualitative and quantitative analysis on this basis. The characteristic of AHP is to use less quantitative information to mathematize the thinking process of decision-making based on in-depth analysis of the essence, influencing factors, and internal relationships of complex decision-making problems, thereby providing a simple decision-making method for multiobjective, multicriteria, or unstructured complex decision-making problems. Especially suitable for situations where it is difficult to directly and accurately measure decision results (Saaty & Vargas, 1982). We used AHP to comprehensively evaluate the quality of soil and ginseng samples during the two growth periods under RSD treatment compared to the control. Based on the relative importance of different ginsenosides and the role of various evaluation indicators in soil on plant growth and development, (1) ginsenosides Rg1, Re, Rb1, and TG were determined; (2) SWC, SOM, pH, and a large number of essential nutrients for growth and development (SAN and SAP); and (3) enzymes directly related to SOM metabolism (SSA and SAA), carbon metabolism cycle (SCA1), and a large number of essential nutrients (N, P, and K) for growth and development (SUA, SCA, SPA, SNRA, and SAPA) were scored as one point and labeled as T1. Add (1) ginsenosides Rb2, Rc, Rd, and Rf; (2) EC, SBD, MWC, CWC, and SGA are counted as three points and marked as T2. Counted ginsenosides Ro, Rg3, Rh2, and Rb3 as five points and labeled them as T3. Scored the relative importance of T1, T2, and T3 (Table 1).
Priority Matrix for Paired Comparison of Evaluation Indicators.
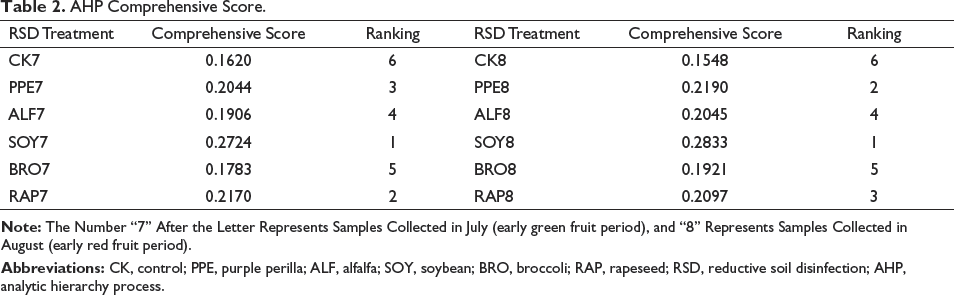
The weight coefficients of ginsenosides and soil indicators were calculated by the AHP. The 17 indicators of T1 (Rg1, Re, Rb1, TG, SWC, SOM, pH, SSA, SAA, SCA1, SUA, SCA, SPA, SNRA, and SAPA) were 4.808%, respectively. The nine indicators of T2 (Rb2, Rc, Rd, Rf, EC, SBD, MWC, CWC, and SGA) were 1.603%, and the four indicators of T3 (Ro, Rg3, Rh2, and Rb3) were 0.962%, respectively. In the consistency test results, the CI value was 0, the RI value was 1.672, and the random consistency ratio CR = CI/RI = 0 < 0.1, indicating that the calculated hierarchical ranking weight was correct and reasonable. The content and weight coefficients of ginsenosides and soil indicators were analyzed and evaluated by AHP, and a comprehensive score was obtained (Table 2). The AHP showed that all soil improvement measures contributed to the improvement of the comprehensive quality of ginseng and soil samples.
AHP Comprehensive Score.
Discussion
RSD Treatment Improved the Appearance Traits and Ginsenoside Content of Ginseng
From the appearance traits (Figure S1), the ginseng treated with RSD was superior to CK to varying degrees in terms of height above ground, number of fibrous roots, and horizontal lines of the ginseng body. Therefore, overall, the effect of SOY treatment is the best.
Ginsenoside is considered a key biomarker for evaluating the quality of ginseng, and its physiological activity determines its edible and medicinal value (Christensen et al., 2006; Shi et al., 2012; Sun et al., 2011). Our research results indicate that RSD by different organic substances as carbon sources has varying degrees of enhancement effect on the content of most ginsenosides, with SOY treatment having the most comprehensive effect on enhancing the content of ginsenosides. The significant positive correlation between different ginsenosides in the correlation analysis indicates a synergistic increase or decrease trend among ginsenosides with the same configuration, which is consistent with previous studies (Ying-Chun et al., 2014). Generally speaking, the harvesting period for cultivated ginseng is 5–6 years (Yin et al., 2022), so our research will continue to explore the effects of different RSD treatments on ginseng quality and soil quality by harvesting in the fifth and sixth years of ginseng cultivation.
RSD Treatment Improved Soil Properties
Improving soil quality and maintaining soil health through reliable management strategies is crucial for the sustainable development of agriculture. Continuous cropping leads to weakened crop growth, reduced yield, decreased quality, increased soil-borne diseases, and soil nutrient deficiencies (Tan et al., 2017); this can be reflected in many crops, including Salvia miltiorrhiza (Yang et al., 2021), Panax ginseng C. A. Meyer (Zhan et al., 2021), potato (Liu et al., 2014), Panax notoginseng (Tan et al., 2017), tobacco (Qin et al., 2023), and so on. Soil pH and EC are key properties that affect soil quality and plant health (Janvier et al., 2007; Li et al., 2017; Liu et al., 2019; Qin et al., 2023). For example, soil disease resistance is significantly inhibited when pH is below 5.0, and crops are sensitive to the toxic effects of aluminum (Watanabe et al., 2011). Ginseng grows well in soil with a pH ranging from 5.5 to 6.5; in this study, we found that the soil pH after RSD treatment did not reach the level suitable for ginseng growth. This may be due to the secretion of phenolic acid substances by ginseng roots into the soil, which acidifies the soil and leads to a decrease in pH year by year, thereby failing to reach the soil pH level suitable for ginseng growth. This is consistent with previous studies (Yanlong et al., 2021; Zhan et al., 2021). In addition, soil with high EC will increase its osmotic potential, thereby hindering the absorption of water required for healthy growth by crops. A large number of studies have shown that RSD can improve soil acidification and salinization (Li et al., 2017; Ling et al., 2014; Mondal et al., 2013; Xun et al., 2015). The results of this study are consistent with previous studies on reducing soil acidification by RSD treatment, but only PPE and BRO have significant effects on improving soil salinization. This result is unexpected and may be related to the nature of the carbon source itself. If the salt content in ALF, SOY, and RAP is high, it is likely to lead to an increase in EC value after RSD treatment (Liu et al., 2022); further research is needed on the mechanisms involved. Previous studies have shown that soil acidity and alkalinity can affect the effectiveness of soil nutrients and the activity of soil enzymes (Nakayasu et al., 2021). However, this study did not find a very significant correlation between pH and ginsenosides or soil characteristic indicators, with pH only showing a significant negative correlation with MWC. Compared with CK, the soil pH only showed a small increase of 0.04−0.30 under the five RSD treatments. We speculate that the possible reason is that this small increase did not cause significant changes in the availability of soil nutrients or the activity of soil enzymes.
Effects of Soil Factors on Ginsenosides Under RSD Treatment
After synthesizing multiple mathematical statistical results (Figures 3 and 5), we found that SPA had a positive correlation with Ro and a negative correlation with Rd. SNRA had a positive correlation with Rg1 and TG, but a negative correlation with Rb2, Rc, Rd, and PPD-type saponins. This indicates that ginsenoside Ro, Rg1, Rc, Rb2, Rd, and PPD-type saponins, and TG are most significantly affected by SPA and SNRA under RSD treatment. The VIP results (Figure 4d) indicate that under RSD treatment, Rb2, Rc, SNRA, Rd, Rb3, Rb1, Ro, SPA, SAA, TG, Rg1, Re, SBD, SSA, and MWC are the main influencing factors that distinguish sample differences under different RSD treatments. In addition, the influence of these active factors can also be reflected in the results of correlation analysis and redundancy analysis. The function of proteases is to decompose and transform SOM in the soil and release nutrients for plants to absorb and utilize. Nitrate reductase is an important driving enzyme for nitrogen cycling in soil. Nitrate reductase can convert NO3− to NO2− in the soil and further convert NO2− to NH4+ under the action of nitrite reductase. The utilization rate of NH4+ by plants and soil microorganisms is much higher than NO3− (Romero et al., 2015). Therefore, we speculate that the changes in soil enzyme activity after RSD treatment increase the utilization rate of soil nitrogen, thereby promoting the increase of ginsenoside content. However, to our knowledge, at present, there is no research to confirm the mechanism of action of SPA and SNRA on ginsenosides Ro, Rg1, Rc, Rb2, Rd, PPD-type saponins, and TG. Therefore, further research is needed to increase the robustness of these findings.
Scoring Basis and Results of Soil Factors and Ginsenosides in AHP Comprehensive Evaluation
In “AHP comprehensive evaluation analysis”, we rated the importance of soil factors and ginsenosides. Ginsenosides Rg1, Re, Rb1, and TG are representative components of ginsenosides and are included in the content determination indicators of multiple pharmacopeias. Rb2, Rc, Rd, and Rf are often referred to as common ginsenosides because they are the higher-content saponins in ginseng, but they do not appear in the content determination indicators of many pharmacopeia countries (Lee et al., 2018). Therefore, we classify these saponins into three categories for classification. Among soil factors, water is essential for plant growth and development, and pH is the most intuitive and important indicator reflecting changes in soil acidity and alkalinity. It affects the form, transformation, availability, and biological activity of soil nutrients, thus indirectly affecting the evolution process of soil fertility (Pietri & Brookes, 2008). SOM is a universal indicator of soil quality and an important component of healthy soil. The loss or reduction of SOM can lead to a decrease in soil fertility or the complete degradation of agricultural soils (Ghani et al., 2003; McBratney et al., 2014). The scoring results indicate that SOY treatment is the best RSD treatment method, and its comprehensive score differs significantly from the second-ranked PPE or RAP. According to the score results, RSD treatment can improve soil quality and enhance ginseng quality.
Conclusion
This research showed that RSD treatment increased ginsenoside content (especially ginsenoside Re and Rb1), improved soil acidity, and enhanced soil enzyme activity and water-holding capacity. PPE and BRO as RSD carbon sources improved soil salinization. Ginsenosides Rb2, Rc, Rd, Rb3, Rb1, Ro, TG, Rg1, Re, and SNRA, SPA, SBD and MWC were the most active factors under RSD treatment and were also the main influencing factors for distinguishing sample differences under different RSD treatments. Overall, SOY for RSD processing was the best among the five treatments.
Abbreviations
RSD: Reductive soil disinfection, CK: Control, SOY: Soybean, BRO: Broccoli, ALF: Alfalfa, PPE: Purple perilla, RAP: Rapeseed, AHP: Analytic hierarchy process, TG: Total ginsenoside, EC: Soil conductivity, SBD: Soil bulk density, MWC: Maximum water capacity, CWC: Capillary water capacity, SWC: Soil moisture content, SAN: Alkali hydrolyzed nitrogen, SOM: Organic matter, SAP: Soil available phosphorus, SUA: Soil urease activity, SCA: Soil catalase activity, SPA: Soil protease activity, SSA: Soil sucrase activity, SAA: Soil amylase activity, SCA1: Soil cellulase activity, SGA: Soil glucanase activity, SNRA: Soil nitrate reductase activity, SAPA: Soil acid phosphatase activity.
Footnotes
Acknowledgements
All authors are grateful to all those who helped in this study.
Availability of Data and Material
The datasets supporting the conclusions of this study are included within the article and its additional files. All materials are available from the corresponding author upon request.
Declaration of Conflicting Interests
The authors declared no potential conflicts of interest with respect to the research, authorship, and/or publication of this article.
Funding
This work was jointly funded by the Youth Foundation Project of the National Natural Science Foundation of China (82204556), Jilin Province Science and Technology Development Plan (No. YDZJ202303CGZH011), Jilin Province Natural Science Foundation (Project No. YDZJ202201ZYTS276), Jilin Province Science and Technology Development Plan (No. YDZJ202101ZYTS012), the fifth batch of Jilin Province Youth Science and Technology Talent Promotion Project (No. QT202117), and Jilin Province Major Science and Technology Special Project (No. 20200504003YY).
Statement of Ethical Approval and Informed Consent
Not applicable.