
Abstract
Background
Insulin resistance (IR) is a pathological state closely associated with various diseases, with hepatic insulin resistance playing a pivotal role. Insulin resistance can be improved by Ginsenoside Rg1 (GRg1), which is known as one of the most biologically active compounds found in ginseng. Nevertheless, the precise role and mechanisms of GRg1 in ameliorating hepatic insulin resistance are still unknown.
Objectives
We wanted to demonstrate the impact of GRg1 on hepatic insulin resistance and explore the underlying mechanisms in our work.
Materials and Methods
We mimicked insulin resistance conditions by culturing HepG2 cells in 30 mM glucose for 24 h. The effects of GRg1 on cellular glucose consumption and the key kinases of the phosphatidylinositol-3-kinase (PI3K)/protein kinase B (AKT)/glycogen synthase kinase-3β (GSK-3β) pathway were evaluated. To assess if the PI3K/AKT/GSK-3β pathway is crucial for GRg1’s protective effect against insulin resistance, the compound LY294002, which inhibits PI3K, was employed.
Results
In HepG2 cells, GRg1 markedly increased glucose uptake while exhibiting no cytotoxicity. Additionally, GRg1 activated the PI3K/AKT/GSK-3β pathway, as indicated by the increased phosphorylation of insulin receptor substrates-1 (IRS-1), AKT, and GSK-3β. Treatment with LY294002 significantly reversed the promotive effects of GRg1 on cellular glucose consumption and PI3K/AKT/GSK-3β pathway activation.
Conclusion
Taken together, our present study revealed GRg1 exerted a protective effect against hepatic insulin resistance induced by high glucose through PI3K/AKT/GSK-3β pathway, suggesting its potential as a beneficial therapeutic medication.
Introduction
Insulin resistance (IR) is a pathological state where regular amounts of insulin are ineffective in producing typical physiological responses, mainly in promoting glucose absorption and utilization in specific tissues such as adipose, muscle, and liver tissues (Xuguang et al., 2019). The liver is the main organ responsible for glucose synthesis and metabolism, and plays a pivotal role in insulin resistance, with hepatic insulin resistance being a key factor (Jia et al., 2020; Petersen & Shulman, 2018).
IR could be a complicated status and lots of studies were committed to elucidate the potential mechanisms. Although the precise etiology of IR is not yet known, any deficiency in insulin production or secretion, as well as any defectsof insulin sign pathways can reduce insulin sensitivityand lead to IR (Saltiel, 2021; Yaribeygi et al., 2019).The phosphatidylinositol-3-kinase (PI3K)/protein kinase B (AKT)/glycogen synthase kinase-3β (GSK-3β) pathway, which is a vital insulin signal transduction pathway, is closely connected with the occurrence and development of insulin resistance (Yang et al., 2017; Zheng et al., 2020). The majority of insulin signaling pathways are started when insulin binds to the transmembrane insulin receptor substrates (IRSs) (Saltiel, 2021). The activated IRSs then trigger subsequent signal transduction through the binding with PI3K. PI3K is a powerful activator of several protein kinases, particularly protein kinase B (AKT), that facilitates the transportation of glucose into cells by relocating glucose transporter type 4 (GLUT-4) (Wang et al., 2019) and phosphorylate its target kinases, including GSK-3β, a glycogen synthase inhibitor, thereby increasing glycogen synthesis while decreasing glycogenolysis (Guo et al., 2021; Liu et al., 2017; Zhang et al., 2018). Insulin also can activate signaling pathways that are not IRS-dependent through other substrates such as Son of sevenless/growth factor and heterotrimeric G protein (Yaribeygi et al., 2019). Due to the complexity of insulin signaling, which involves numerous modulatory proteins and enzymes, any deficiency in these factors may impede normal insulin signal transduction, causing IR in target tissues, such as c-Jun N-terminal kinase (JNK) and inhibitor of nuclear factor kappa-B kinase subunit beta (IKKβ)/nuclear factor kappa B (NF-κB) may phosphorylate IRSs at serine 307 (Jayaraman et al., 2021), TNF-α may potentially interfere with IRS-1’s serine phosphorylation and reduce GLUT-4 expression (Lee et al., 2022), Endoplasmic reticulum (ER) may interfere with the production of the proper insulin receptors, GLUT-4 expression and reduces autophagy (Petersen & Shulman, 2018), which impairs insulin signaling and causes IR.
Accumulating evidence shows that insulin resistance not only is a serious risk factor for type 2 diabetes mellitus (T2DM) but is also intimately linked to many other diseases, such as hypertension (da Silva et al., 2020), metabolic dysfunction-associated fatty liver disease (Sakurai et al., 2021), and polycystic ovary syndrome (Moghetti & Tosi, 2021). Therefore, it is highly crucial to investigate the molecular mechanisms of insulin resistance as well as to find drugs to ameliorate it. Multiple drugs are available to improve IR. However, some of these, such as thiazolidinediones and metformin, cause adverse effects such as weight gain, hypoglycemia, and gastrointestinal dysfunction (Greabuet al., 2021). Safer drugs from natural dietary sources are still required. Ginsenoside Rg1 (GRg1), one of ginseng’s most bioactive substances, has been demonstrated to exhibit multiple pharmacological activities, such as antidiabetic (Alolga et al., 2020; Bai et al., 2018), anti-inflammatory (Alolga et al., 2020; Gao et al., 2020), and hepatoprotective (Qi et al., 2020; Yang et al., 2021) activities. Previous studies showed that GRg1 can ameliorate insulin resistance (Fan et al., 2019b; Mo et al., 2019), but the precise role of GRg1 and whether this role was mediated by stimulation of the PI3K/AKT/glycogen synthase kinase-3β (GSK3β) pathway has remained uncertain.
The purpose of the current study was to demonstratethe protective effect of GRg1 against hepatic insulinresistance, which was identified by impaired cellular glucose consumption (Mo et al., 2019), and to provide light on the function of the PI3K/AKT/GSK3 pathway.
Materials and Methods
Materials
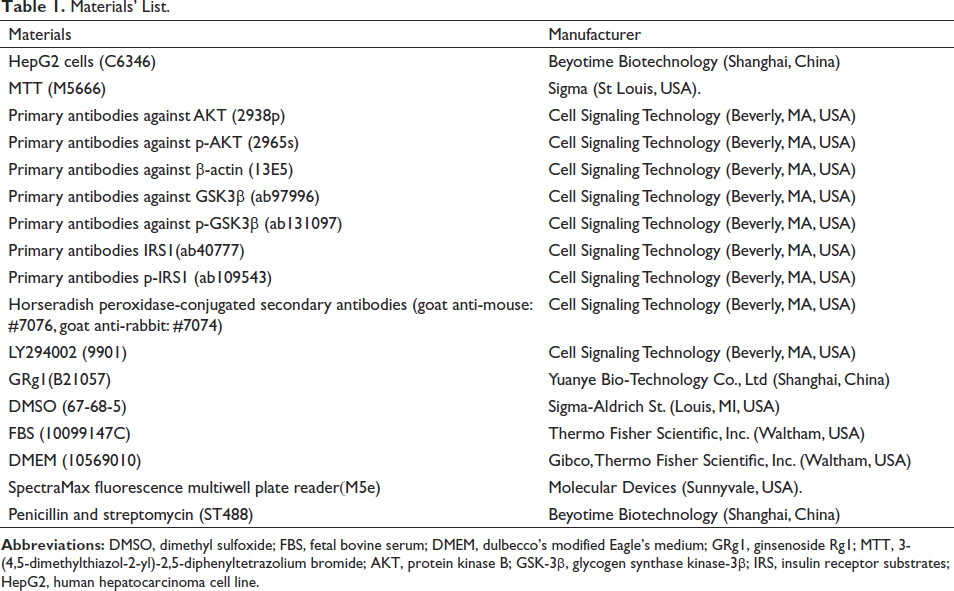
HepG2 cells (C6346) were obtained from Beyotime Biotechnology (Shanghai, China). A Cell Proliferation Kit (3-(4,5-dimethylthiazol-2-yl)-2,5-diphenyltetrazolium bromide, MTT, M5666) was provided by Sigma (St Louis, USA). Primary antibodies against AKT (2938p), p-AKT (2965s), β-actin (13E5), GSK3β (ab97996), p-GSK3β (ab131097), insulin receptor substrate 1 (IRS1, ab40777), p-IRS1 (ab109543) as well as Horseradish peroxidase-conjugated secondary antibodies (goat anti-mouse: #7076, goat anti-rabbit: #7074) and LY294002 (9901) were provided by Cell Signaling Technology (Beverly, MA, USA). Dimethyl sulfoxide (DMSO, 67-68-5, Sigma-Aldrich, St. Louis, MI, USA) was used to dissolve GRg1 (B21057, purity 98%), which was purchased from Yuanye Bio-Technology Co., Ltd. in Shanghai, China, to create a 160 M stock solution. The stock solution of GRg1 was then diluted in fetal bovine serum-free (FBS, 10099147C, Thermo Fisher Scientific, Inc. Waltham, USA) Dulbecco’s modified Eagle’s medium (DMEM, 10569010, Gibco, Thermo Fisher Scientific, Inc. Waltham, USA) to create working solutions (Table 1).
Materials’ List.
Cell Culture and Treatment
HepG2 cells were grown in a humidified chamber at 37°C with 5% CO2 and 95% humidity, with DMEM supplemented with 10% FBS, 1% non-essential amino acids, and 100 U/mL penicillin and 100 µg/mL streptomycin (ST488, Beyotime Biotechnology, Shanghai, China). Cells were kept in culture by passaging, and the media was placed every two days. For further study, Cells were planted in 96-well plates with a concentration of 1×10⁴ cells·mL−1.
To evaluate the cytotoxicity of GRg1, HepG2 cells were cultured with GRg1 at various concentrations ranging from 10 to 40 µM for different durations ranging from 12 to 48 h. The MTT assay was performed to estimate cell viability (Table 2).
GRg1 did not Exhibit Cytotoxicity in HepG2 Cells.
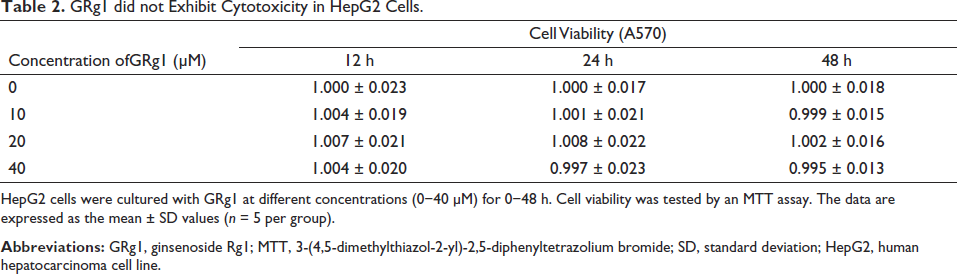
HepG2 cells were cultured with GRg1 at different concentrations (0−40 µM) for 0−48 h. Cell viability was tested by an MTT assay. The data are expressed as the mean ± SD values (n = 5 per group).
To test the utility of GRg1, insulin resistance was induced by subjecting HepG2 cells to 30 mM glucose for 24 h, as previously mentioned (Gong et al., 2020; Song et al., 2017). Cells were grown in medium supplemented with 5.5 mM glucose to represent normoglycemia or 30 mM glucose to represent hyperglycemia for 24 h (Gong et al., 2020; Song et al., 2017) and then were cultured with varying concentrations of GRg1 (0, 10, 20, and 40 µM) for different time durations (12, 24, and 48 h). Glucose consumption was measured after the cells were stimulated using 100 nM insulin for 10 min.
To detect the mechanisms underlying the beneficial effect of GRg1 against insulin resistance, HepG2 cells were cultured with 5.5/30 mM glucose for 24 h and were then pretreated with or without 10 µM LY294002 for 2 h before being cultured with or without 20 µM GRg1 for an additional 24 h. The levels of the key kinases of the PI3K/AKT/GSK3β pathway were measured by western blotting.
MTT Assay
Cell viability was tested with an MTT assay, as previously mentioned (Oliveira et al., 2020). In brief, HepG2 cells were grown at a density of 1×10⁴ cells·mL−1 with GRg1 (0, 10, 20, and 40 µM) for 12, 24, and 48 h in 96-well plates. Each well received 0.5 mg·mL−1 of MTT solution in phosphate-buffered saline (PBS) before the plates were incubated at 37°C with 5% CO2 for 4 h. The precipitate was dissolved in 150 µL of DMSO and incubated with shaking for 30 min after removing the supernatant. The absorbance was measured at 570 nm using a SpectraMax fluorescence multiwell plate reader (M5e, Molecular Devices, Sunnyvale, USA).
Glucose Consumption Assay
Glucose consumption in HepG2 cells was determined by the glucose oxidase–peroxidase method with a glucose assay kit. HepG2 cells were grown at a concentration of 1×10⁴ cells·mL−1 in 96-well plates, including five wells without cells. After the treatments described above, the glucose concentration in each well was tested. To estimate glucose consumption in the plate wells, the average glucose concentration in the blank wells was subtracted from the glucose concentration in each of these wells (glucose consumption = glucose concentration of blank wells – glucose concentration of wells with cells).
Western Blot Analysis
HepG2 cells underwent washing, followed by lysis in RIPA lysis buffer at 0°C and subsequent centrifugation at 12,000×g for a duration of 20 min. The BSA method was used to calculate the protein concentration. An equivalent quantity of cellular samples (10 µg protein) were transferred to a polyvinylidene difluoride (PVDF) membrane after being separated by 10% sodium dodecyl sulfate-polyacrylamide gel electrophoresis (SDS-PAGE). The membrane was incubated with the primary antibodies (anti-p-IRS1/IRS1, anti-p-AKT/AKT and anti-p-GSK-3β/GSK-3β) at 4℃ overnight after being blocked with 5% non-fat milk in TBS-T buffer (150 mM NaCl, 10 mM Tris-HCl, and 0.1% Tween 20) at 20℃ for 1 h and β-Actin was used as the internal control. Then, the membrane was washed with TBS-T three times, each for 5 min and treated with secondary antibodies (goat anti-mouse or anti-rabbit IgG) coupled to horseradish peroxidase at 25°C for 2 h. The membrane was observed using enhanced chemiluminescence (ECL), and the densities of the bands were measured with ImageJ software.
Statistical Analysis
Statistical analyses were conducted with SPSS 19.0 software. All results are presented as the mean ± standard deviation (SD) values, and the data were evaluated with one-way analysis of variance (ANOVA) followed by Tukey’s test. Pearson correlation analysis was performed to examine the relationship between cellular glucose consumption, p-IRS-1/IRS-1, p-AKT/AKT, and p-GSK-3β/GSK-3β. Differences with p < 0.05 were defined as statistically significant.
Results
GRg1 did not Exhibit Cytotoxicity in HepG2 Cells
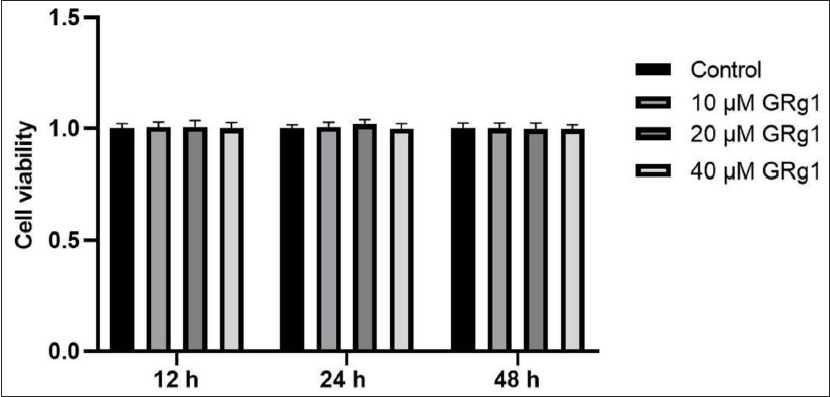
HepG2 cells were treated with GRg1 at various concentrations (0, 10, 20, and 40 µM) for varying times (0, 12, 24, and 48 h), and the cell viability was measured to evaluate the cytotoxicity of GRg1. Cell viability did not show any notable variances among the groups (Figure 1), consistent with a prior study (Mo et al., 2019).
GRg1 Improved High Glucose-induced Insulin Resistance in HepG2 Cells
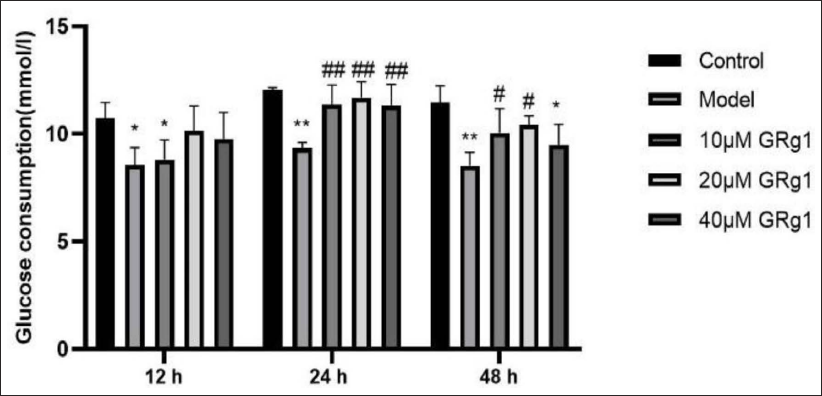
Firstly, a HepG2 cell model of insulin resistance was established. Exposure to high glucose (30 mM) for 24 h markedly decreased glucose consumption, showing that the insulin resistance cell model was successfully established (Gong et al., 2020; Song et al., 2017). In addition, treatment with GRg1 (especially 20 µM GRg1 for 24 h) significantly reversed this change (Figure 2). Based on this result, the subsequent studies set the exposure time for GRg1 as 24 h.
GRg1 Modulated the Stimulation of the PI3K/AKT/GSK-3β Pathway and Cellular Glucose Consumption was Positively Correlated with PI3K/AKT/GSK-3β pathway
After 24 h of normal or high glucose culture, HepG2 cells were exposed to varying concentrations of GRg1 for additional 24 h. Western blot analysis showed that the high glucose-challenged group exhibited significantly reduced levels of p-IRS1, p-AKT, and p-GSK3β compared to the control group. GRg1 treatment (20 and 40 µM) markedly reversed these changes. Moreover, treatment with 10 µM GRg1 markedly increased the level of p-GSK3β (Figure 3). Pearson correlation analysis revealed a positive link between cellular glucose consumption,p-IRS-1/IRS-1,p-AKT/AKT, and p-GSK-3β/GSK-3β (Table 3).
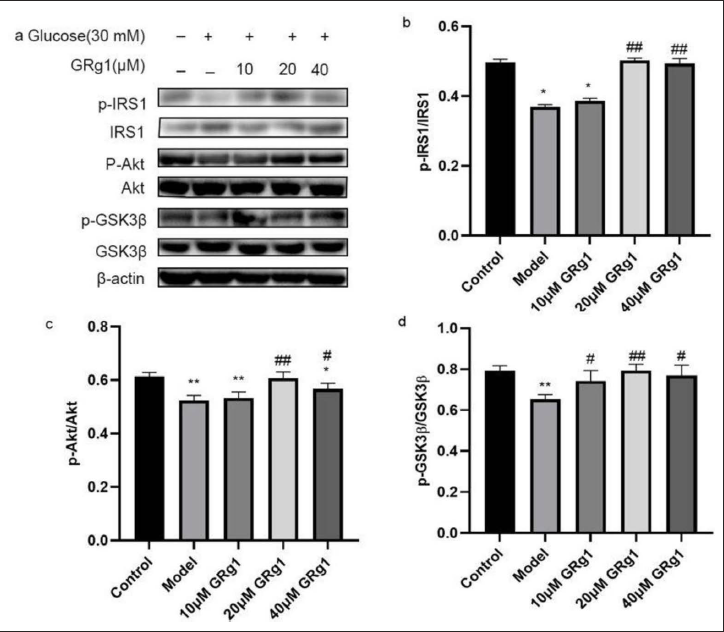
Correlation Between Cellular Glucose Consumption and PI3K/AKT/GSK-3β Pathway.
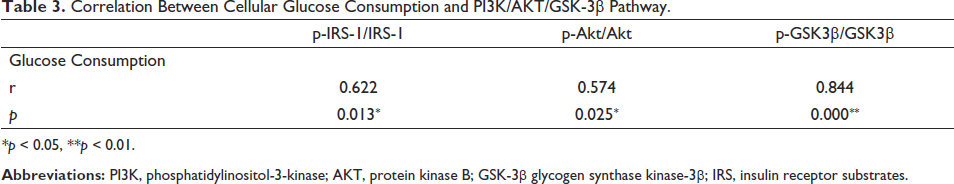
*p < 0.05, **p < 0.01.
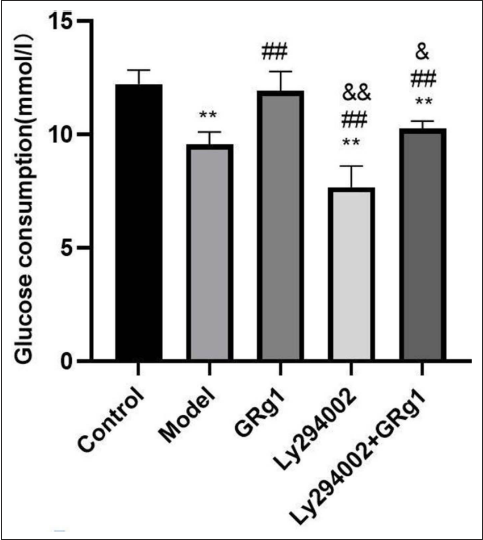
PI3K Inhibitor Treatment Attenuated the Effect of GRg1 on Insulin Resistance in HepG2 Cells
LY294002, the PI3K inhibitor, was used to treat HepG2 cells in the presence or absence of GRg1 and/or high glucose. Glucose consumption was markedly decreased after high-glucose treatment but markedly increased after GRg1 treatment in HepG2 cells. This effect of GRg1 was significantly reversed by the LY294002 treatment (Figure 4).
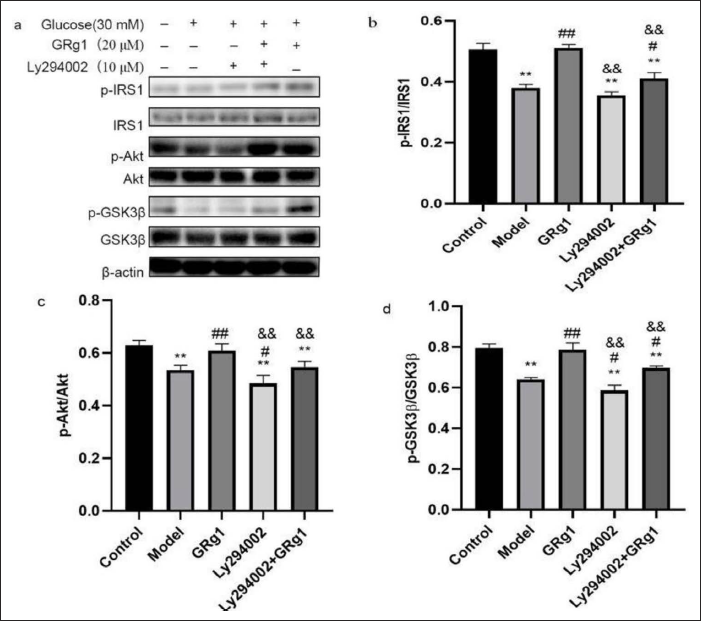
PI3K Inhibitor Treatment Attenuated the Effect of GRg1 on the PI3K/AKT/GSK-3β Pathway
Western blot analysis showed significant decreases in the contents of p-IRS1, p-AKT, and p-GSK-3β after LY294002 and/or GRg1 treatment compared with those in the group not given GRg1 (Figure 5). This result indicates that the PI3K/AKT/GSK-3β pathway is crucial to the protective effects of GRg1 against insulin resistance induced by high glucose.
Discussion
In the current study, we wanted to explore the precise role and underlying molecular processes of GRg1 in ameliorating hepatic insulin resistance in vitro. HepG2 cells were treated with high glucose to generate an insulin resistance cell model, which is characterized by reduced insulin-dependent glucose consumption (Mo et al., 2019), as described previously (Gong et al., 2020; Song et al., 2017). First, we found that GRg1 is non-toxic to HepG2 cells during culture with concentrations not exceeding 40 µM for 0−48 h (Figure 1), consistent with previous research (Mo et al., 2019). Exposure to 30 mM glucose for 24 h significantly decreased glucose consumption, while GRg1 treatment effectively reversed this change in HepG2 cells, suggesting that GRg1 improved high glucose-induced hepatic insulin resistance (Figure 2). In addition, GRg1 significantly activated the PI3K/AKT/GSK-3β pathway (Figure 3), and this change was reversed by treatment with the PI3K inhibitor LY294002 (Figure 5). Simultaneously, LY294002 treatment abolished the suppressive effect of GRg1 on cellular glucose consumption (Figure 4). We also found a significant positive relationship between the cellular glucose consumption and the components of PI3K/AKT/GSK3β pathway (Table 1). Collectively, these data suggest that GRg1 ameliorates insulin resistance through the PI3K/AKT/GSK-3β pathway in HepG2 cells.
The primary factor behind the development of T2DM is commonly believed to be insulin resistance, which is also closely associated with many diseases, including metabolic dysfunction-associated fatty liver disease (Sakurai et al., 2021), polycystic ovary syndrome (Moghetti & Tosi, 2021), cardiovascular disease (Hill et al., 2021), and Alzheimer’s disease (AD) (Berlanga-Acosta et al., 2020). Insulin resistance is a pathological disease where the response of target tissues to insulin stimulation is compromised, primarily liver, muscle, and adipose tissue (Xuguang et al., 2019; Zhanget al., 2019). The liver, which is responsible for glucose synthesis and metabolism, and hepatic insulin resistance, characterized by suppressed insulin-dependent cellular glucose consumption (Santoleri & Titchenell, 2019), plays a central role in insulin resistance (Jia et al., 2020; Petersen & Shulman, 2018). In addition, Bulbul et al. demonstrated that hepatic insulin resistance developed much faster than insulin resistance in other organs in obese individuals (Ahmed et al., 2021).Thus, it is highly important to establish a reliable hepatic insulin resistance model for studying the pathogenesis of insulin resistance and exploring safe and effective medications for its treatment in vitro. As a cell culture model retaining most morphological and biological functions of human hepatocytes, HepG2 cells are widely used to study hepatic insulin resistance (Cordero-Herrera et al., 2014; Ding et al., 2019). In this research, HepG2 cells were exposed to 30 mM glucose for 24 h, and it was found that glucose consumption was much lower than in the control group (Figure 2), indicating that the insulin resistance model was successfully established (Gong et al., 2020; Song et al., 2017).
Recently, insulin resistance and the associated diseases have become serious health problems worldwide (Huanget al., 2021; Mancusi et al., 2020; Ng et al., 2021). Despite the prolonged efforts committed to investigating the pathogenesis of and medical interventions for insulin resistance, the precise underlying mechanisms remain unclear and more effective and safer drugs are still required. Ginseng has been used traditionally as a therapeutic tonic for thousands of years and may be the most widely used herb. GRg1, a highly active compound found in ginseng, exhibits multiple pharmacological activities, including antidiabetic (Alolga et al., 2020; Baiet al., 2018), anti-inflammatory (Alolga et al., 2020; Gaoet al., 2020), and hepatoprotective (Qi et al., 2020; Yang et al., 2021) activities. Moreover, GRg1 has been reported to ameliorate insulin resistance (Fan, et al., 2019b; Mo et al., 2019). To reveal the underlying mechanisms by which GRg1 protects against insulin resistance, we mimicked insulin resistance conditions by culturing HepG2 cells in high glucose and found that GRg1 significantly increased cellular glucose consumption (Figure 2) and activated the PI3K/AKT/GSK-3β pathway (Figure 3), whereas both of these effects were reversed by LY294002 (Figures 4 and 5).
The PI3K/AKT/GSK-3β pathway, being one of the most essential insulin signaling pathways, contributes in cell metabolism, proliferation, differentiation, apoptosis, and autophagy (Fu et al., 2020; Hou et al., 2020; Liang et al., 2020). Upon insulin stimulation, IRS-1, a member of the IRS family, is activated and subsequently interacts with SH domain-containing proteins, mainly PI3K. Activated PI3K can phosphorylate and activate the serine/threonine kinase AKT. Then, AKT can phosphorylate its target kinases, including GSK3β, whose activity is suppressed due to this phosphorylation (Aziz et al., 2020; Ishii et al., 2015; Zhenget al., 2020). GSK-3β is a highly conservative serine/threonine protein kinase with multiple functions (Lauretti et al., 2020; Mancinelli et al., 2017; Martin et al., 2018). To further address the connection between the PI3K/AKT/GSK-3β pathway and the hepatic insulin resistance, we can emphasize net production of glycogen and the process of gluconeogenesis. Fan et al. (2019a) found that GRg1 can promote hepatic glycogen synthesis. Previous studies revealed that GRg1 also exerts a protective effect by maintaining the activity of the transcription factor Forkhead box O1(FOXO1) in the liver (Qi et al., 2020) and inhibits hepatic gluconeogenesis via the Akt-FOCXO1 axis (Liu et al., 2017). On the one hand, the combinationof active AKT and inactive GSK3β promotes the dephosphorylation and subsequent activation of glycogen synthase, thus promoting glycogen synthesis (Guo et al., 2021; Zhang et al., 2018). In addition, the activation of AKT can promote the dephosphorylation and subsequent inactivation of glycogen phosphorylase, thus suppressing glycogenolysis (Cai et al., 2020; Nozaki et al., 2020). In brief, the activation of the PI3K/AKT/GSK-3β pathway is crucial in controlling both glycogen synthesis and glycogenolysis, contributing to net glycogen synthesis (Petersen & Shulman, 2018). On the other hand, activated AKT can phosphorylate Thr24, Ser256, and Ser319 in FOXO1, resulting in transcriptional repression of gluconeogenic genes, thus suppressing gluconeogenesis (Sun et al., 2021; Wu et al., 2021). However, the above factors were not investigated in the present study, requiring further research.
Conclusion
The current work demonstrated that GRg1 protects against hepatic insulin resistance induced by high glucose in vitro, and it was mediated via activation of the PI3K/AKT/GSK-3β pathway. These outcomes suggest the potential therapeutic significance of GRg1 in insulin resistance and the associated diseases. However, there are still a few limitations in our study, the downstream targets within the PI3K/AKT/GSK-3β pathway such as glycogen synthase and glycogen phosphorylase were not experimented in the study. Further studies are demanded to verify the underlying mechanism of GRg1 in ameliorating insulin resistance.
Footnotes
Abbreviations
IR: Insulin resistance; GRg1: Ginsenosiderg1; PI3K: Phosphatidylinositol-3-kinase; AKT: Protein kinase; GSK-3β: Glycogen synthase kinase-3β; IRS: Insulin receptor substrates; GLUT-4: Glucose transporter type 4; IKKβ: Inhibitor of nuclear factor kappa-B; NF-κB: Nuclear factor kappa B; JNK: C-Jun N-terminal kinase; ER: Endoplasmic reticulum; T2DM: Type 2 diabetes mellitus; HepG2: Human hepatocarcinoma cell line; MTT: 3- (4,5-dimethylthiazol-2-yl)-2,5-diphenyltetrazolium bromide; DMSO: Dimethyl sulfoxide; FBS: Fetal bovine serum; DMEM: Dulbecco’s modified eagle’s medium; SDS-PAGE: Sodium dodecyl sulfate-polyacrylamide gel electrophoresis; PVDF: Polyvinylidene difluoride; ECL: Enhanced chemiluminescence; FOXO1: Forkhead box O1.
Acknowledgments
We thank Mr. Haohua Qian for his assistance during the statistical analysis.
Author Contributions
All authors contributed to the study conception and design. Xujun Shen, Yamei Jin, and Yuting Chen carried out the experiments. Xujun Shen and YameiJin drafted the first version of the manuscript. Huadi Yang performed the statistical analysis. All authors provided comments, revised the manuscript, and approved the final manuscript.
Declaration of Conflicting Interests
The authors declared no potential conflicts of interest with respect to the research, authorship, and/or publication of this article.
Statement of Informed Consent and Ethical Approval
Necessary ethical clearances and informed consent were received and obtained, respectively, before initiating the study from all participants.
Funding
This study was supported by the Research Project of Zhejiang Chinese Medical University [No. 2022JKZKTS29].