
Abstract
Background
Costus speciosus (J. Koenig) Sm. (Syn. Cheilocostus speciosus) is an ethnic anti-diabetic plant, used for its high diosgenin content.
Objectives
This study aimed to evaluate the seasonal variation of diosgenin content in Costus speciosus rhizome, quantified through validated RP-HPLC method.
Materials and Methods
The rhizomes were collected in four different seasons, such as rainy (August), autumn (October), winter (February) and summer (May), from Lucknow, India. The HPLC method validation was done in terms of linearity, precision, repeatability, accuracy, sensitivity and robustness.
Results
Diosgenin was separated under isocratic elution on an RP-HPLC column (4.6 × 250 mm, 5 µm) with a mobile phase consisting of methanol and water, eluted at retention time (Rt) of 18.396 min and content was calculated with the help of standard curve. The limit of detection and limit of quantification (LOQ) was found to be 522.68 and 1583.90 ng (nanogram), respectively. The diosgenin content varies significantly in different seasons.
Conclusion
The diosgenin content was found higher in rainy (193.97 µg/mg) season and was concluded to be optimum season for collection of rhizomes as quality raw material. Harvesting at optimal season may fulfill the commercial demand of diosgenin and may reduce the diosgenin-intended overexploitation of the species from the wild.
Introduction
Several environmental factors affect the production and accumulation of secondary metabolites by qualitative and quantitative means in the plant. In response to seasonal change, there may be variation in chemical constituents that usually causes the production and accumulation of certain secondary metabolites in different seasons. 1 Since the chemical composition directly affects its biological activities, samples of the same plant species collected in different seasons of the year can show significant differences in their chemical components. 2
Costus speciosus (J. Koenig) Sm. (Syn. Cheilocostus speciosus) is an ethnic anti-diabetic plant commonly recognized as “insulin plant” and belongs to the family Costaceae (Zingiberaceae). The species is herbaceous, rhizomatous and perennial, native to South East Asia and disseminated worldwide in the tropical and subtropical regions of Asia, America and Africa. 3 The species favors moist and sandy soil for its growth and is abundantly found in India, varying from the Himalayas to the Western Ghats and in plains. 4 The plant is erect, new stems emerge from the mother rhizome in the rainy season and bear large, soft, smooth and variegated leaves. The leaves are elliptical or oblong, spirally arranged and smooth on the lower side. The rhizome of Costus remains dormant from December to March and new stems start sprouting during April. 5 Traditionally, this plant is used to cure various ailments such as bronchitis, rheumatism, constipation, flatulence, asthma, skin disease, leprosy, anemia, pneumonia, high fever and jaundice. 6 The juice of the rhizome is used to cure hyperlipidemia, headache, inflammation, cancer and diabetes. 7
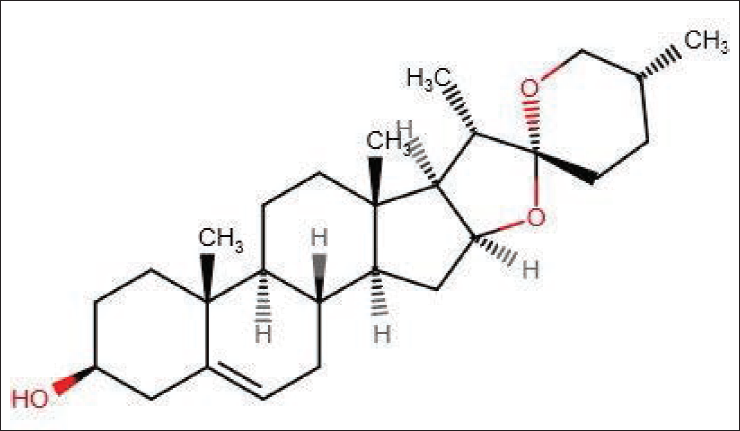
Costus speciosus contains a different class of metabolites such as steroids, flavonoids, phenolics, alkaloids, glycosides, terpenoids and sapogenins. The specific bioactive compounds present in the species are diosgenin, dioscin, β-sitosterol, gracillin, β-carotene, cyloartanol and costusosides.3, 8, 9 Besides, curcumin and curcuminoids are also present in traces. 7 In recent times, the rhizome of Costus speciosus has emerged as an alternative source of steroidal sapogenin-diosgenin and has high commercial demand due to its use in the production of steroids. Diosgenin exhibits several biological activities, such as anti-diabetic, antioxidant, anticancer, anticoagulant and antithrombic, in Alzheimer’s and Parkinson’s disease.10, 11 Use of diosgenin as a precursor for making steroidal drugs and contraceptive pills is well known. 12 The commercial demand for diosgenin is primarily fulfilled by Dioscorea sp. and there is an increase in the demand. 13 Exhaustive collection of the Dioscorea sp. from the wild source may harm the biodiversity and threaten the availability of natural source of diosgenin. Therefore, Costus speciosus (J. Koenig) Sm. emerges as an alternative source to fulfil the industrial demand for diosgenin. The collection of the medicinal plant should comply with good collection practices as there are several biotic and abiotic factors affecting the production of secondary metabolites, otherwise will lead to low-quality raw material.14, 15 In addition, the season-specific collection is crucial to attaining the desired efficacy and consistency in medicinal plants. 15 In a similar context, this study was designed to analyze the effect of season on the production of diosgenin (Figure 1) in Costus speciosus (rhizome) through the validated RP-HPLC method.
Chemical Structure of Diosgenin (C27H42O3).
Materials And Methods
Chemicals and Reagents
Diosgenin (>93 %) used as the standard for quantification was purchased from Sigma Aldrich (USA). The separation column C18 RP-HPLC (4.6 × 250 mm, 5 µm diameter) was procured by SunFire (Massachusetts, USA). Methanol and water (HPLC grade) were procured from Sisco Research Laboratories Pvt. Ltd., and all the other chemicals used were of analytical grade.
Collection of Rhizomes
Costus speciosus (J. Koenig) Sm. (rhizome) was collected in different seasons (summer, monsoon or rainy, autumn and winter) during 2020 to 2021 from CSIR-National Botanical Research Institute (NBRI garden), Lucknow, Uttar Pradesh, India. The GPS coordinates of collections are 26°51’21" N, 80˚56’53" E at an elevation of 113 m above sea level. All the samples were collected in the first week of the month in their respective seasons, to maintain uniformity in the collection. The collected samples were identified by Dr Sharad Srivastava, Senior Principal Scientist, Pharmacognosy division, CSIR-NBRI, Lucknow. Herbarium specimens were prepared for each sample and deposited in the institute’s herbarium for further reference (LWG No. 265402-265405). The collected samples were washed, chopped, shade dried (25°C ± 3), pulverized to coarse powder and stored in an airtight container for further analytical work.
Pharmacognostical Evaluation
Fresh rhizomes were washed under tap water and preserved in 70% ethanol for anatomical study. Transverse sections of rhizome were cut by free-hand sectioning with a very thin slice (0.2 mm). After staining with safranin (50%, ethanol), the samples were mounted in glycerine. The slides were analyzed and the picture documentation was done by the digital microscope (Nikon, Model-Eclipse Ci). The physicochemical parameters, such as moisture content or loss on drying, extractive values (alcohol and water-soluble extractive) and ash values (total ash content and acid insoluble ash content) were analyzed by the standard protocol of Ayurvedic Pharmacopoeia of India (API) to evaluate the quality of the collected plant samples.16, 17
Preparation of Hydrolyzed Plant Extract
The powdered sample (2 g) of rhizome was refluxed on a water bath with 2.5 N HCl (50 mL) for 4 hr at 80°C to hydrolyze the sample. 13 The refluxed sample was filtered with filter paper and the residue was allowed to cool and then washed with hot double-distilled water until pH reached neutral. The remaining residue was then collected and dried in a hot air oven at 100°C for 2 hr and followed by cold extraction with HPLC grade methanol (100 mL) with permanent shaking for 6 to 8 hr and allowed to stand for 18 hr at the room temperature (27°C ± 2). The samples were filtered with Whatman paper (No. 4) and the residue was resuspended with fresh methanol, this procedure was repeated three times and the pooled filtrate was concentrated in a rotatory evaporator (Buchi, Switzerland) under low temperature (35°C ± 2) and pressure (40 mbar). The concentrated extract was lyophilized and the extractive yield was calculated in percentage and the dried residue was stored at 4°C for further studies. 18 The methanolic extracts of C. speciosus were coded as CS1, CS2, CS3 and CS4 for monsoon or rainy, autumn, winter and summer, respectively.
RP-HPLC-PDA Quantification of Diosgenin
Standard and Sample Solution Preparation
The standard solution of diosgenin was freshly prepared (1 mg mL−1) in HPLC-grade methanol and stored at 4°C in dark. Aliquots of the standard and the samples were diluted in a volumetric flask with HPLC-grade methanol to obtain a working dilution of 0.1 mg mL−1 and 10 mg mL−1. Working dilutions and solvents were filtered through a 0.22 µm membrane filter (Pall, USA) and sonicated for 15 min before HPLC analysis.
Instrumentation and Chromatographic Condition
The HPLC-PDA quantification of diosgenin was done with a binary low-pressure gradient HPLC system by Waters (Massachusetts, USA), consisting of a pump for delivering the mobile phase (Waters-1525), autosampler (Waters-2707) with a 30 µL loop for sample injection, photodiode array detector (Waters-2998) and column heater (Waters-1500) for maintaining the optimum temperature of the column. All these units were operated and monitored on the Empower Quickstart software.
Chromatographic separation of diosgenin was achieved on the C18 RP-HPLC column (4.6 × 250 mm, 5 µm), supplied by SunFire (Massachusetts, USA). The mobile phase consisted of methanol (A) and water (B), and analytes were eluted under an isocratic system (80:20 v/v; A:B) with the flow rate of 1 mL min−1, and thermostated at 35°C. The injection volume of standard and samples were 10 µL and the total run time was 30 min. Identification of peak was done by comparing the retention time (Rt) and spectra of the standard peak with the sample peaks. Quantification of diosgenin was performed at a maximum wavelength of 210 nm.
Validation of the Proposed Analytical Method
The proposed method for quantification of diosgenin was validated as per the International Conference on Harmonization (ICH) guidelines for various parameters, such as linearity, sensitivity, precision, recovery as accuracy and robustness to validate the performance. 19 Aliquots of diosgenin (0.1 mg mL−1) were diluted in five different dilutions, prepared to evaluate the limit of detection (LOD) and limit of quantification (LOQ) having concentrations of 100, 200, 300, 400 and 500 ng (nanogram), were used for HPLC-PDA. A calibration curve was constructed between the standard concentration (ng) versus the respective peak area and the result was subjected to regression analysis (XLSTAT, 2010, Microsoft Corporation, USA). The LOD and LOQ were calculated by using a standard deviation of y-intercepts of the regression line and the slopes. The inter-day and intra-day precisions were evaluated through the three replicate injections of standard (2, 4, and 6 µg). For intra-day, each injection was measured three times a day and three injections per day for the upcoming 5 days (inter-day). Accuracy was expressed in the terms of recovery (%) of an analyte, after spiking the standard at four different concentrations (10, 20, 30 and 40 µg). Robustness was also performed to check the effect of a variable on the method.
Statistical Analysis
All the results are in the form of mean ± standard deviation (SD) of three replicates. Data were subjected to one-way analysis of variance (ANOVA) to test the significance (p > 0.05) (XLSTAT, 2010, Microsoft Corporation, USA).
Results And Discussion
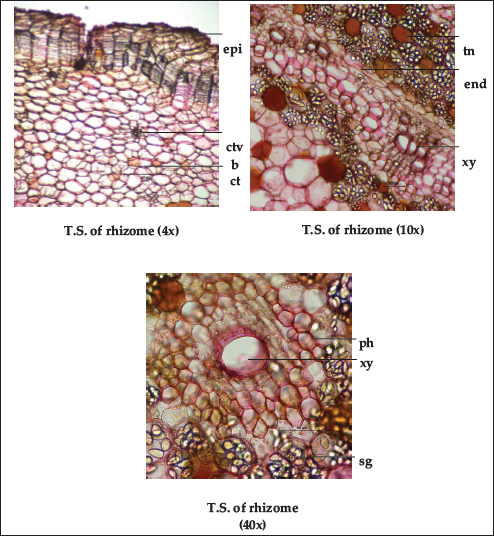
The morphological appearance of fresh rhizome is irregular, curved or sometimes straight, elongated and cylindrical, and several rootlets arise from the entire surface. The detailed structure in the transverse section of the rhizome shows epidermis, followed by multi-layered thin-walled cork cells; cortex and wide central ground tissue and stealer vascular bundle are scattered throughout the ground tissue. Steles are collateral, non-lignified fibro-vascular, more numerous adjacent peripheral region of endodermis. Stellar vascular bundles were well developed and composed of 2 to 5 vessels associated with narrow phloem. Oval to pear-shaped starch grains were present throughout the ground tissue; numerous in the peripheral region of endodermis and stealer vascular bundle with variable sizes ranging from 287.83 to 514.10 µm 2 as reported in the previous study (Figure 2).20, 21 The entire samples had similar anatomical features; however, differences were seen only in the distribution of starch grains. CS-1 and CS-3 show an abundant amount of starch in comparison to CS-4 followed by CS-2.
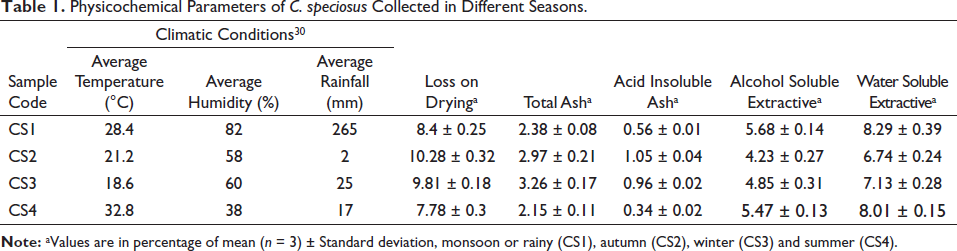
For evaluation of the quality of the collected plants, the sample was evaluated with various physicochemical parameters such as moisture content or loss on drying, extractive values (alcohol and water-soluble extractive) and ash values (total ash and acid-insoluble ash). As the samples were collected according to good collection practice guidelines (GCP) and the holy approach, foreign organic matter was nil. Moisture content in the samples ranged from 7.78% to 10.28%. The total ash value of the plant sample was found to be higher than acid-insoluble ash. The samples were extracted with alcohol and water, and values ranged from 4.23% to 5.68% and 6.74% to 8.29%, respectively (Table 1). All the physicochemical parameters were in accordance with API.
Physicochemical Parameters of C. speciosus Collected in Different Seasons.
Development and Optimization of RP-HPLC Method
Steroidal sapogenins are mainly reserved in plant tissue in a pharmacologically less-active form, such as glycosidic forms, and the glycosidic bond need to be broken in order to obtain its active form. Therefore, acid hydrolysis of plant material is an essential step for obtaining the optimum amount of these types of compounds. The extractive yield of hydrolyzed samples was 5.8%, 2.6%, 8.3% and 3.25% for CS1, CS2, CS3 and CS4, respectively.
The proposed method aimed to develop a simple but sensitive method for the separation and quantification of diosgenin in hydrolyzed extracts of Costus speciosus rhizome. There are several previous reports available for the quantification of diosgenin in different samples and formulations but their sensitivity was too high.22, 23 Therefore, in the attempt made for improving the sensitivity for diosgenin detection, several mobile phase combinations were tried based on previously available literatures. The final separation of the standard was done when acetonitrile was replaced by methanol as the mobile phase. The mobile phase consisting of methanol (A):water (B) (80:20 v/v; A:B) with the flow rate of 1 mL min−1 was found as the best-suited combination for separation of diosgenin in samples based on peak area vs height, UV-spectra and Rt.
Quantification of Diosgenin
Several studies were conducted to determine the effect of season on secondary metabolites. Khatoon et al. 15 reported the variation of three biomarkers viz. β-sitosterol, lupeol and rotenone in Tephrosia purpurea and suggested that the rainy season was an optimum condition for collection to achieve high metabolite content. Seasonal variations of reserpine and ajmalicine in two species of Rauvolfia were also studied by Irshad and Khatoon. 24 Moreover, the change in the composition of phenolic compounds in different plants with the seasons25–27 was also studied. However, in the present context, variation of diosgenin content Costus speciosus (rhizome) due to season was not reported as per our knowledge.
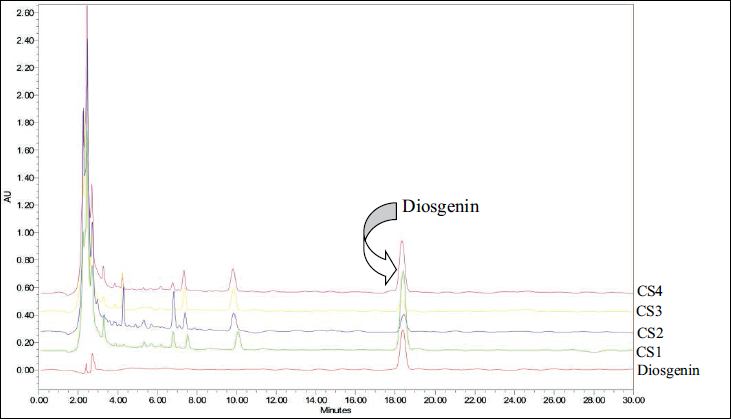
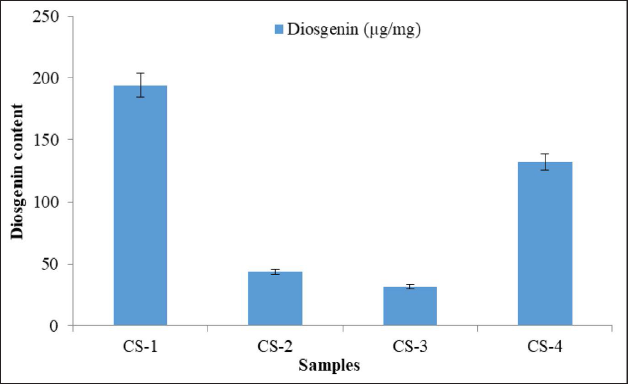
RP-HPLC-PDA chromatogram reveals that the diosgenin was identified at 18.396 min and coincides with the peak of the sample. The spectra of the sample peak at corresponding Rt were found comparable to the standard and further confirm the presence of diosgenin (Figure 3). The amount of diosgenin in the plant sample was calculated by using a linear regression curve plotted between concentration and peak area. Diosgenin content in the collected four samples varies from 31.41 to 193.47 µg mg–1 of methanolic extracts (Figure 4), minimum content was found in the sample collected during autumn and winter season; and maximum amount was found in the rainy season (germination time) followed by summer season (pre-germination).
Overlay (3D) HPLC Chromatogram of Standard Diosgenin and C. speciosus Rhizome Collected in Four Different Seasons Scanned at 210 nm. Seasons: Monsoon or Rainy (CS1), Autumn (CS2), Winter (CS3) and Summer. (CS4).
Seasonal variation has a huge impact on the production and accumulation of secondary metabolites in medicinal plants, 28 and may lead to fluctuation inefficacy of finalized product. Therefore, the season of plant collection is of serious concern to maintain the quality and batch-to-batch consistency of raw material/finished products in the herbal drug industry. 15 Also, to obtain the desired amount of the targeted metabolite, often large-scale collection of medicinal plants is done irrespective of the season/time due to lack of knowledge about optimal season for collection. Therefore, the study becomes vital in preventing metabolite-intended overexploitation of the species from the wild. The HPLC quantification of diosgenin indicates that the maximum content was found in the samples harvested during the rainy season followed by the summer season. The plant part harvested was rhizome, and it remains in the dormant stage for a long time, that is, from October/November to March/April. During this time, the enzymatic activity is slowed down and this might have reduced the production and accumulation of secondary metabolites, that is, diosgenin. However, once the tuber receives its favorable condition due to change in weather, the enzymatic activity restores to its normal rate and leads to the production of metabolites in higher content. Seasonal alteration is not only the case, whereas several other environmental factors such as temperature, humidity, nutrition and soil type will also play a crucial role in the production of secondary metabolites. 29 Hence, this study suggests that the rainy season is the optimal time for harvesting C. speciosus rhizome, having high diosgenin content followed by summer, autumn and winter season.
Validation
Linearity, LOD, and LOQ
The linearity and sensitivity of the proposed method were checked by constructing the calibration curve between the concentration and peak area of diosgenin. The linear regression equation was used to calculate the slope (a), intercept (b) and correlation coefficient (r 2 ). The LOD (3.3 × SD/slope) and LOQ (10 × SD/slope) of the linear equation were calculated with the formula using standard deviation and slope. The linearity of the standard was obeyed in the range 100 to 500 ng/run with LOD and LOQ was 522.68 and 1583.90 ng (nanogram), respectively. The other statistical parameters of linear equation are within the limit of ICH guidelines (Table 2).
Statistical Parameters for the Calibration Curve of Diosgenin.
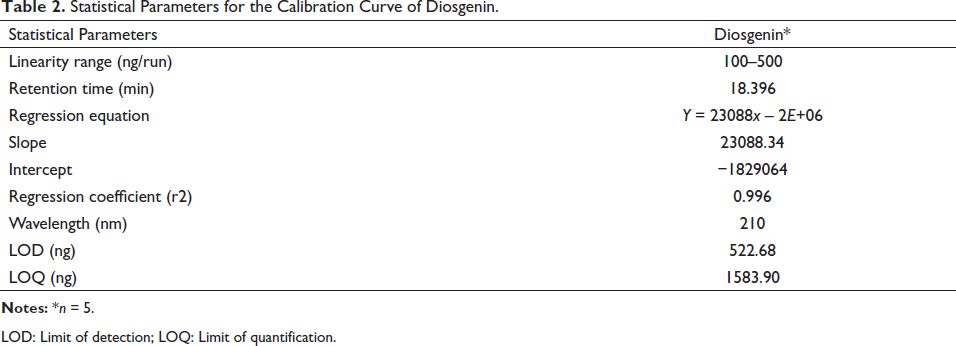
LOD: Limit of detection; LOQ: Limit of quantification.
Precision
The repeatability (inter-day and intra-day) were assessed by the same analyst, with the same instrument through three replicate injection of diosgenin during the same day (intra-day) and also three injections per day for the upcoming 5 days with the same standard as mentioned above (inter-day). The peak purity was determined by comparing the spectra at three points, viz., peak start, apex and end. The intra- and inter-day RSD (%) ranged from 0.737% to 1.56% and 2.81% to 3.65% (Table 3), which is well within the limits of ICH guidelines.
Inter-day and Intra-day Precision Study of Proposed HPLC Method.
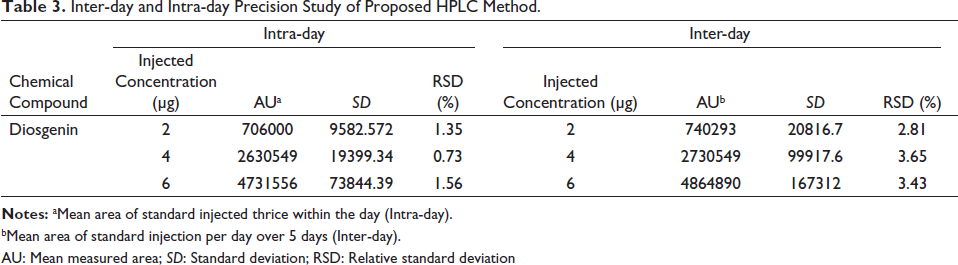
bMean area of standard injection per day over 5 days (Inter-day).
AU: Mean measured area; SD: Standard deviation; RSD: Relative standard deviation
Recovery
The accuracy of the proposed method was also accessed through recovery investigation by adding a known amount of standard in the plant sample. The recovery of the method was determined by spiking at four different levels of 10, 20, 30 and 40 µg. The recovery (Table 4) of target analytes was found to be satisfactory and accurate as it is within the acceptance limit of 97.26% to 103.97%. Hence, the proposed method was found to be accurate.
Recovery as Accuracy Studies of Diosgenin in Spiked Plant Sample.
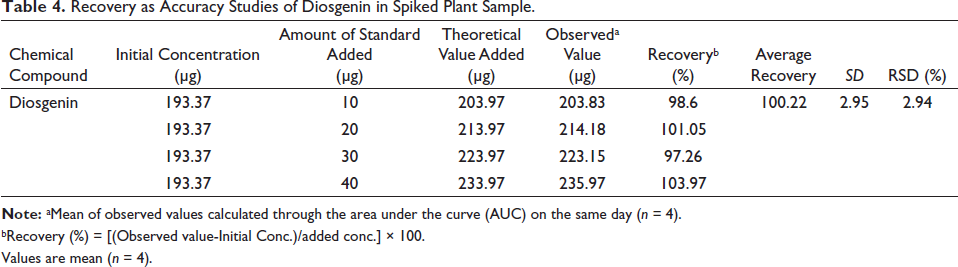
bRecovery (%) = [(Observed value-Initial Conc.)/added conc.] × 100.
Values are mean (n = 4).
Robustness
The robustness of the proposed method was tested by making deliberate changes in flow rate, mobile phase composition as well as detection wavelength (Table 5). The proposed method was found to be robust when deliberate changes were made in the proposed method.
Analyzed Robustness Parameters.
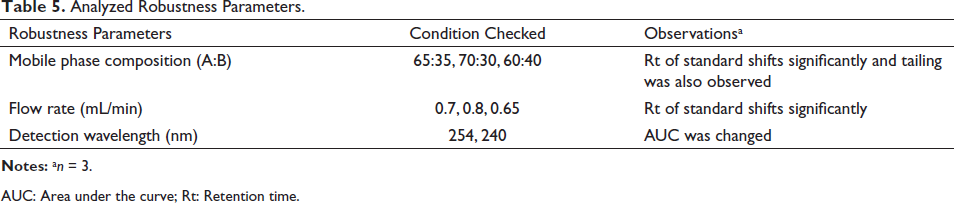
AUC: Area under the curve; Rt: Retention time.
Conclusion
In this study, C. speciosus rhizome was harvested in four different seasons and the diosgenin content was estimated through the validated RP-HPLC method. Significant variation was recorded in diosgenin content among the samples and it was concluded that during the rainy season, the content was maximum followed by summer, autumn and winter season. Also, the developed method precisely separates the targeted metabolite from various other unknown metabolites in the extract and was found rapid, precise, accurate, specific and robust under standardized conditions. However, the study needs to be validated further under controlled conditions as various other factors such as temperature, humidity, soil macro-micronutrient, and soil type will also play a vital role in the production of secondary metabolites. The outcomes of the study will aid in developing the suitable collection and agronomic practices for sustainable availability of quality raw material having high content of diosgenin, as well as preventing the overexploitation of the species from the wild. The developed RP-HPLC method will also help in regulating the QC and batch-to-batch consistency of diosgenin-containing raw material and/or finished formulations.
Footnotes
Abbreviations
LOQ: Limit of quantification; LOD: Limit of detection; ng: Nanogram; Rt: Retention time; API: Ayurvedic Pharmacopoeia of India; ICH: International Conference on Harmonization; HPLC: High-pressure liquid chromatography; GCP: Good collection practice guidelines; SD: Standard deviation.
Acknowledgments
The authors are grateful to the Director, CSIR-National Botanical Research Institute, Lucknow for providing essential amenities. The NBRI manuscript number is “CSIR-NBRI_MS/2022/02/04.”
Declaration Of Conflicting Interests
The authors declared no potential conflicts of interest with respect to the research, authorship, and/or publication of this article.
Funding
Mridul Kant Chaudhary is grateful to University Grant Commission, New Delhi, India, for providing financial support (Ref. No. 843/(SC) (CSIR-UGC NET DEC. 2016).
Statement of Informed Consent and Ethical Approval
Necessary ethical clearances and informed consent was received and obtained respectively before initiating the study from all participants.
Summary
Rhizome of Costus speciosus was collected in four different seasons from north India.
The biomarker diosgenin was quantified through a validated RP-HPLC-PDA method.
Diosgenin was found maximum in rainy season (August).