
Abstract
Background
Meditation using the “OM” mantra is the most widely used practice in India. Though reports have been published about the relaxation effect during both verbal “OM” chanting and listening to “OM” chanting, there is a paucity of literature concerning the cortical areas activated/deactivated after verbal “OM” chanting and listening to “OM” chanting using quantitative electro-encephalography (qEEG).
Purpose
The objective of this study was to compare the effects of verbal “OM” chanting and listening to “OM” chanting on cortical sources as compared to baseline, as assessed by qEEG.
Method
Twenty adult male subjects with a mean age of 27.5 ± 7.5 years and no past or present history of psychiatric, neurological, or auditory disorders or previous exposure to yoga and meditation were recruited from the undergraduate and postgraduate student population of AIIMS, New Delhi. Subjects were given a paradigm designed using E-prime for both verbal and listening to “OM” chanting of 5 min each and a 5-min relaxation period in between the tasks. Electroencephalography recording was done using a 128-channel geodesic sensor net with band-pass filtered at 1–70 Hz, and 20-sec data of eyes-closed condition, post-verbal “OM”, and post-listening to “OM” chanting were segmented and pre-processed. Further, source analysis was performed on the data using standardized low-resolution electromagnetic tomography.
Result
The pre (baseline) versus post-verbal “OM” (p < .05) and post-listening to “OM” (p < .05) chanting showed significant differences in similar cortical areas in both verbal “OM” and listening to “OM” chanting except the three areas, that is, the orbital gyrus, the rectal gyrus, and the sub-callosal gyrus, which were additionally activated post-listening to “OM” chanting. Both verbal and listening to “OM” chanting induced activation of similar cortical areas, which were classified as the nodes/hubs of specific resting-state networks (RSNs) such as the attentional network, frontoparietal control network, and default mode network.
Conclusion
The study results suggest that “OM” chanting could facilitate flexible switching between various RSNs to induce a relaxed state and could improve attention simultaneously.
Both verbal and listening to “OM” chanting induced common activated areas that are classified into frontoparietal, dorsal attention, and default mode network areas. And it is hypothesized that flexible switching between these RSNs could induce a relaxed state and improve attention simultaneously with the possible role of the frontoparietal network.
Introduction
Mental stress in day-to-day life has become a socioeconomic burden that can result in several disorders such as hypertension, diabetes, and many lifestyle diseases. Chronic stress disrupts nearly every system in the human body. It can make humans more vulnerable to anxiety, depression, and other psychological issues. 1 Psychotherapy, pharmacological therapy, yoga, and meditation are a few that are being used to manage mental stress.1–3
Meditation is a process of self-regulating the mind and body. To assess the effects of meditation, many researchers have used different types of meditation, like focused attention meditation, open monitoring meditation, Zen meditation, transcendental meditation, and mindfulness meditation. 2 The effects of meditation using various types of chanting, such as mental repetition of “OM” or a neutral word “ONE”, listening to the sound “OM”, a meaningful word like “AAM” or the non-meaningful word “TOM” have been reported in the literature in both naive and experienced meditators.4–6
Stress reduction and facilitation of a peaceful mental state, along with an increase in physiological alertness, have been reported as the effects of “OM”.1, 5, 6 Most of the studies have executed “OM” chanting in two ways, either by verbally chanting “OM” or by listening to the sound of “OM” chanting, and have noticed that these two methods could have different effects on autonomic and respiratory variables such as respiratory rate, heart rate, and skin resistance level.5, 6
The neural correlates of “OM” chanting have been explored in the literature using various neuroimaging tools such as electroencephalography (EEG) and functional magnetic resonance imaging (fMRI). 7 A recent fMRI study reported that listening to “OM” (LOM) sound versus a meaningful word “AAM” results in cortical activation in the left dorsal medial frontal gyrus (DMFC), bilateral cerebellum, right supramarginal gyrus (SMG), and right precuneus. 7 Whereas listening to the meaningful sound “OM” versus the non-meaningful sound “TOM” results in activation of cortical areas such as the right superior middle frontal gyrus, bilateral middle frontal, right angular gyrus, SMG, and middle temporal gyrus. The authors concluded that the commonly activated areas, that is, DMFC, are responsible for the emotional understanding of the “OM” sound, whereas SMG implies the linguistic processing of the “OM” syllable. 7 In another fMRI study during verbal OM (VOM) chanting, a significant deactivation of the amygdala, orbitofrontal cortex, insula, hippocampus, anterior cingulate gyrus, thalamus, and parahippocampal gyrus was observed. 1 The authors proposed that the auricular branches of vagal nerves might be mediating limbic system deactivation due to “OM” chanting, which could potentially be valuable for managing stress, depression, and epilepsy. 1 A recent EEG study has reported on the temporal dynamics of “OM” chanting. The authors found an increase in theta amplitude post-“OM” chanting at 10 brain regions, which were taken from 16 electrodes, as follows: bilateral frontal (Fp1, Fp2, F7, F8, F3, and F4), bilateral parietal (P4 and P3), bilateral central (C4 and C3), bilateral occipital (O2 and O1), and bilateral temporal (T4, T3, T7, and T8), compared to pre-“OM” chanting, suggesting that the increase in theta amplitude post-“OM” chanting could reflect a reduction in the cortical arousal. 8
To the best of our knowledge, no previous study has defined the duration of exposure to VOM and LOM chanting, which could have affected the results and interpretation of previous studies. Further, there is a paucity of literature on the cortical sources of VOM and LOM chanting using high-density EEG, which has improved spatial resolution along with its inherent high temporal resolution. Therefore, a feasibility study was planned to compare the effects of VOM chanting and LOM chanting in naïve healthy male volunteers on cortical sources using high-density EEG.
Methods
Twenty right-handed, healthy male subjects with a mean age of 27.5 ± 7.5 years participated in this study. Participants with any past or present history of psychiatric, neurological, or auditory disorders or previous exposure to yoga and meditation were excluded. Subjects were recruited from the undergraduate and postgraduate student population of AIIMS, New Delhi. This study was conducted at Stress and Cognitive Electro-Imaging Laboratory (SCEL), AIIMS, New Delhi. Ethical clearance was obtained from the Institutional Ethical Committee of the All India Institute of Medical Sciences, New Delhi (IECPG-22/28.02.2018).
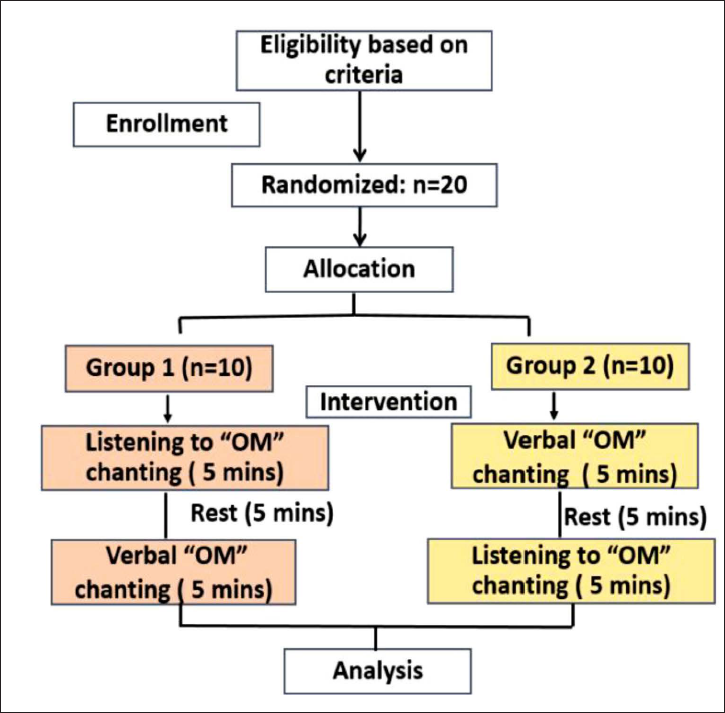
The subjects were randomly allocated to either Group 1 or Group 2 (10 subjects each) by simple randomization. On the day of recording, in Group 1, the subjects were first exposed to listening to “OM” chanting for 5 min, followed by a 5-min rest period, and then asked for “VOM” chanting for 5 min. In Group 2, vice versa was performed (Figure 1). EEG data were recorded throughout the session. For each group, instruction for eye closure was given both pre and post “OM” chanting. Analysis was done between eye-closed state pre-OM chanting and post-OM chanting for both VOM chanting and LOM chanting separately. Also, before the day of recording, a practice session was given to the subjects to make them familiar with the task.
Study Design.
OM Chanting Tasks
Both the “VOM” and the “LOM” chanting tasks were designed using E-Prime v2.0, and the JBL Jembe Wireless v2.0 speaker system was used for stimulus presentation. Tasks were performed as follows:
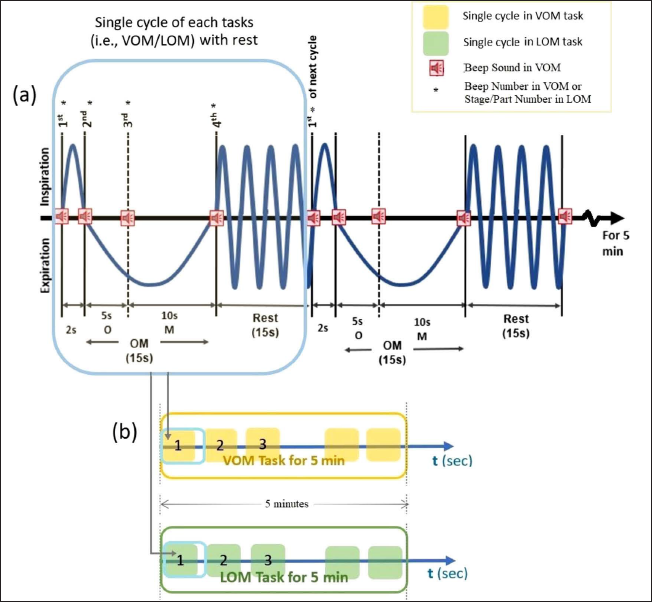
VOM task: In this task, four successive beep sound stimuli were used, as shown in Figure 2(a), in which the first beep sound indicated to the subject the phase of deep inspiration for a duration of 2 sec. At the second beep sound (initial expiration phase), the subject was instructed to start chanting the vowel sound of “OM,” that is, “O” for 5 sec. At the third beep sound (late expiration phase), the subject had to transit to the consonant part of “OM,” that is, “M” for 10 s. On the fourth beep sound, the subject stopped chanting and rested for 15 s. Again, the same cycles were repeated for 5 min and completed the VOM task as shown in Figure 2(b) (yellow outlined box). LOM task: In this task, recorded audio of “OM” chanting was similar to the paradigm of verbally “OM” chanting in terms of duration as well as intervals of O… and M… sounds, including the portion of rest (shown in Figure 2(a)). To complete the LOM task, the same cycles were repeated in the same manner as mentioned in the VOM task for 5 min, as shown in Figure 2(b) (as yellow outlined box).
EEG Acquisition Setup
The EEG signal was acquired throughout the task, that is, in the 3-min eye closed condition pre-OM chanting, during the OM chanting protocol, and in the 3-min eye closed post-OM chanting condition, using a 128-channel Hydrocel Geodesic Sensor Net (Electrical Geodesics, Inc., Eugene, USA). The sampling rate was 1,000 Hz (24-bit precision, bandwidth: 0.05–100 Hz), and the vertex electrode (Cz) served as a recording reference. EEG data acquisition was performed in a silent, dimly lit, electrically noise-free room, and before the acquisition, each sensor’s impedance was kept below 50 kΩ.
EEG Pre-processing
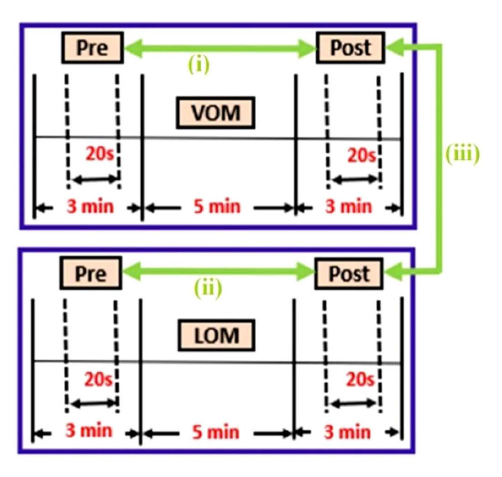
Raw EEG data were bandpass filtered at 1–70 Hz and further processed after exporting the data into the EEGLAB toolbox. Then, 20 sec of EEG data were segmented from both pre and post of VOM and LOM, as shown in Figure 3. The segmented data was further pre-processed for artifact detection and replacement of bad channels. Independent component analysis was performed in the EEGLAB toolbox with the Runica algorithm. Artifactual components such as line noise (50 Hz), muscle artifacts, eye blinks, eye movements, and cardiac artifacts were identified and removed. EEG data were then downsampled to 250 Hz for further analysis.
Electrical Source Imaging
Standardized low-resolution electromagnetic tomography (sLORETA) was used to calculate the intra-cortical electrical sources generated from the scalp-recorded activities in frequency bands for source localization. sLORETA uses an algorithm that solves the inverse problem and computes electric neural activity as a standardized current density (unit: nanoamperes per square meter, nAm/m2). 9 The finite difference head model was used for solving the forward problem.10, 11 The probabilistic location of gray matter in the average MRI atlas of the Montreal Neurologic Institute (MNI) Atlas 12 was used to constrain the location of 6239 cubic voxels of 5 mm. Three orthogonal dipole moments (x, y, and z) were defined and solved for each of the source voxels and were assigned to 66 gyri using craniocerebral correlations.
Statistical Analysis
In the present study, cortical source activity in 66 gyri of post-VOM and LOM was compared with their respective baselines (pre), as shown in Figure 3. Also, post-VOM was compared with post-LOM, as shown in Figure 3 (comparisons shown as a green bold arrow). sLORETA software was used, and the significantly activated gyri were plotted on six-dimensional orthogonal views of the cerebral cortex. The difference in source localization of cortical activity between the pre and post of both VOM and LOM, as well as the post segments of both VOM and LOM, was assessed by a log of F-ratio tests. From the obtained sLORETA images and using statistical nonparametric mapping randomization, significant differences were identified. This randomization method determined the values of the critical probability threshold for the observed t-values, with correction for multiple comparisons across all voxels. To determine the significance of randomization tests, a total of 5,000 permutations were used. The significance of clusters of voxels activity was assessed by exceedance proportion tests and was based on their height threshold and spatial extent. Thus, clusters of supra-threshold voxels were obtained.13, 14
Results
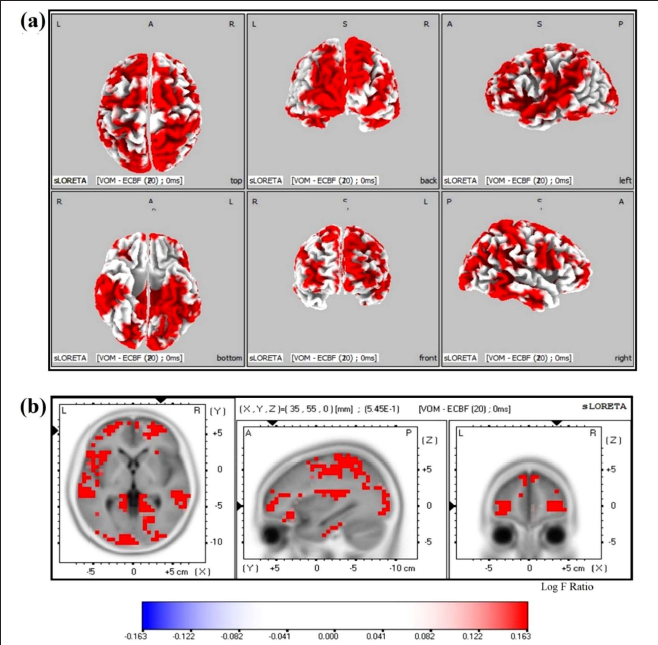
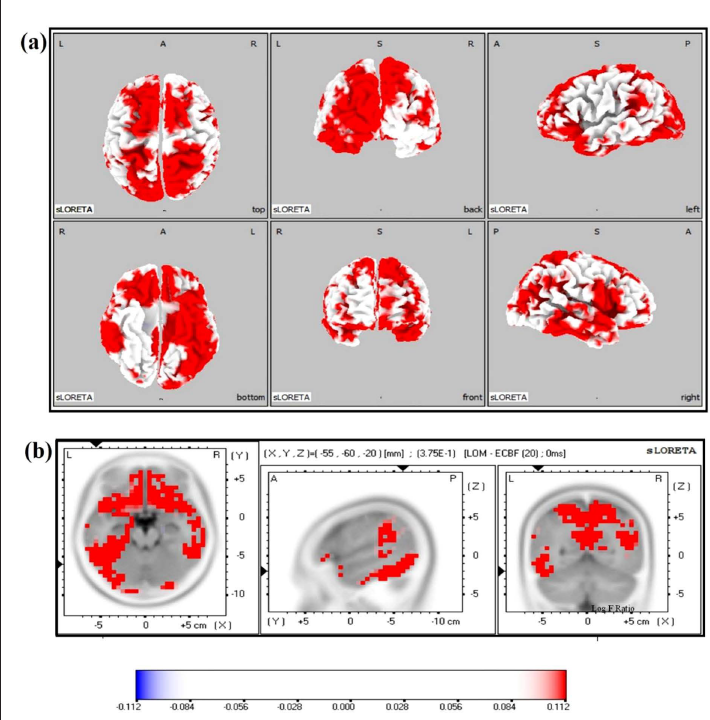
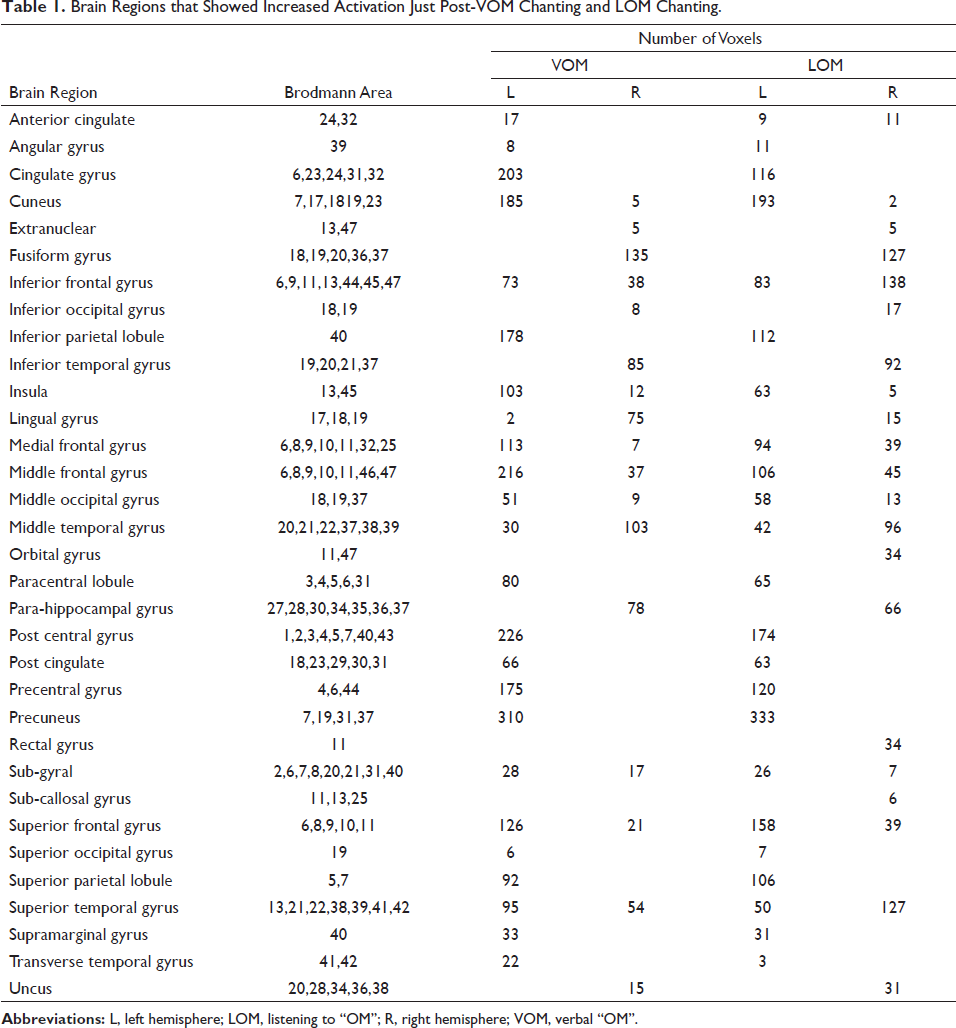
Statistical analysis on sLORETA images of post-VOM versus pre-VOM showed significant activations in 29 gyri at different current source densities (MNI coordinates of maximum: 35,55,0, Log-Fmax −0.163, p = .04) (Figure 4), and post-LOM versus pre-LOM showed significant activations in 33 gyri at significantly different current source densities (MNI coordinates of maximum: −55, −60, −20, Log-Fmax −0.112, p = .05) (Figure 5). The increased activations in these areas are listed in Table 1. The post-VOM versus post-LOM comparison showed no significant difference.
Brain Regions that Showed Increased Activation Just Post-VOM Chanting and LOM Chanting.
Areas Activated in VOM
In the “VOM” chanting task, activation in the various areas has been found, as shown in Table 1. These are as follows: anterior cingulate, angular gyrus, cingulate gyrus, medial frontal gyrus, middle frontal gyrus, cuneus, extranuclear, fusiform gyrus, inferior frontal gyrus, inferior parietal lobule (IPL), inferior occipital gyrus, inferior temporal gyrus, lingual gyrus, insula, middle occipital gyrus, middle temporal gyrus, precentral gyrus, precuneus, paracentral lobule, para-hippocampal gyrus, postcentral gyrus, post cingulate, sub-gyral, superior frontal gyrus, superior parietal lobule, superior occipital gyrus, transverse temporal gyrus, superior temporal gyrus, SMG, and uncus.
Areas Activated in LOM
In the “LOM” chanting task, in addition to the above-mentioned areas, the rectal gyrus, orbital gyrus, and sub-callosal gyrus were activated.
Discussion
In the present study, both “VOM” and “LOM” chanting tasks were designed based on the previously mentioned literature. In Group 1, the subjects were asked to verbally chant “OM” for 5 min, followed by the rest of 5 min, then asked to listen to the “OM” chanting for 5 min and vice versa in Group 2. EEG data of 20 sec from pre and post of verbal and listening to “OM” chanting tasks were compared.
Areas Activated in VOM and LOM
In the “VOM” chanting task, activation was found in various areas, which are shown in Table 1. Whereas in the “LOM” chanting task, in addition to the above-mentioned areas, the rectal gyrus, orbital gyrus, and sub-callosal gyrus were activated. The rectal and orbital gyri are part of the orbitofrontal gyrus. The sub-callosal gyrus is an area connected to the limbic system. So, LOM chanting additionally causes orbitofrontal and limbic system activation, which contrasts with the study by Kalyani et al., which suggested limbic deactivation due to OM chanting. This was probably due to the fact that the method used in the study was “VOM” chanting. 15 So, the “LOM” chant might have an additional effect on the limbic system as compared to VOM.
The comparison of current source density obtained in pre- versus post-OM chanting task conditions showed significantly increased activity in the frontal and parietal cortical areas of the brain. Recent studies of fMRI analysis have shown that LOM sound recruits commonly activated areas, that is, DMFC, which is responsible for the emotional understanding of the “OM” sound, whereas SMG implies the linguistic processing of “OM” syllables, which were activated in our study as well. 7 Another neuroimaging study on “VOM” chanting suggested limbic system deactivation. 15 On the contrary, in our study, we found activation of limbic areas such as the anterior cingulate and para-hippocampal areas during OM chanting.
The significantly higher activity in the inferior frontal gyrus, as per the literature, has been correlated with the attentional control, restructuring of problem representation, and also reflects a relaxed mode of mental activity.16, 17 Significantly higher activity in the middle temporal gyrus and superior temporal gyrus (STG) is associated with general attentive control and problem understanding and is also involved in word comprehension. 16 The significantly higher activity in the insula, bilateral superior occipital gyrus, and STG has been seen to be involved in attention, reward, affective, and cognitive processing, along with the perception of sensory integration. 16
On observing the global areas, activation patterns such as emotional processing, attentional processing, and problem understanding along with the simultaneous sensory integration in OM chanting, it appears that several functions were ongoing post-exposure to 5 min of OM chanting. So, on reviewing the literature, the cortical areas that got activated in both the “VOM” chanting and “LOM” chanting could be classified into the RSNs. The RSNs were classified into frontoparietal control network (FPCN), ventral attentional network (VAN), dorsal attentional network (DAN), and default mode network (DMN). 18
The areas activated in both “VOM” and “LOM” chanting were categorized as follows:
FPCN, which included the ventrolateral prefrontal cortex (vlPFC), dorsal anterior cingulate cortex, dorsolateral prefrontal cortex, anterior IPL, dorsomedial prefrontal cortex, and frontopolar cortex. In the literature, FPCN has been seen to be associated with the salience and execution networks; it is also considered a hub that rapidly and flexibly switches with either of the resting state networks.19, 20 The DAN included the superior parietal lobule, middle temporal area, inferior parietal sulcus, and frontal eye fields, which are involved in sustained attention and were activated by the FPCN.
21
The VAN, which includes the vlPFC, STG, and IPL, was involved in the reallocation of attention.
21
DMN included the posterior cingulate cortex, ventromedial and dorsomedial prefrontal cortex, posterior IPL, rostral anterior cingulate cortex, insula, and lateral temporal lobe. DMN, which leads to mind wandering, gets activated by FPCN in the resting condition.22, 23 The regions of DMN were relatively deactivated in experienced meditators, indicating less mind wandering in meditative states.
24
So, in the present study on short-term exposure to “OM” chanting, several areas contributing to FPCN, DAN, VAN, and DMN were simultaneously activated. This implies that FPCN areas might be performing the rapid switching between DMN areas and attentional areas such as DAN and VAN. And this switching suggests that short-term exposure to the OM chant simultaneously induces the subjects into a state of DMN, that is, mind wandering and attentional network areas. So further, we hypothesize that on long-term consistent exposure to “OM” chanting, FPCN would switch the balance more towards attentional network areas, indicating the efficient sustained attention due to “OM” chanting meditation, as suggested by research on long-term meditators.25, 26
Conclusion
The present study attempted to study the effects of “VOM” chanting and “LOM” chanting. “VOM” chanting and “LOM” chanting were processed by similar cortical areas that could be identified as parts of specific RSNs. These networks included the attentional network, the FPCN, and the DMN. We propose through our study that there is simultaneous activation of frontoparietal, attentional, and DMNs with FPCN flexibly switching between these networks that could induce a relaxed state. This could eventually improve the attention simultaneously as the OM chanting duration increases, such as in long-term meditation, where there would be more sustained attention networks and less DMN activation which could be the goal to be achieved in future studies.
Limitations and Future Directions of the Study
The present study has explored the various cortical areas during “OM” chanting by using quantitative EEG. The “OM” chanting task has been standardized in the present study for both VOM and LOM chanting, which helped in both the recording and the analysis of the data. To standardize, with the support of literature, we have limited the actual effects of “OM” chanting by restricting the duration of “OM” chanting. Also, it differs from the “OM” chanting done traditionally in India that does not have such restrictions as those in the present study. As in testing the efficiency of “OM” chanting meditation, the traditional structuring of “OM” chanting might show a different pattern or different dynamics of resting-state network activation. These are some of the probable reasons for getting such mixed types of results and, thus, the proposed mechanisms of the present study. Another limitation of the study is that the effect of the sequence followed in groups 1 and 2 might itself have an effect on the area activation, which needs to be studied separately.
Merits of the Study
This is the first study to explore the cortical areas activation patterns in OM mantra chanting which is a widely practiced meditation technique.
The study design for OM mantra chanting used in this study is structurally defined in time durations of Omm… and Mmm... sounds, thus maintaining uniformity in exposure to OM chant across subjects.
Footnotes
Abbreviations
VOM, verbal “OM” chanting; LOM, listening to “OM” chanting; sLORETA, standardized low-resolution electromagnetic tomography; qEEG, quantitative electroencephalography; RSNs, resting-state networks; fMRI, functional magnetic resonance imaging; MRI, magnetic resonance imaging.
Acknowledgements
This work was supported by All India Institute of Medical Sciences (AIIMS). The authors wish to thank CMET, AIIMS, New Delhi for their expert assistance in recording the audio stimulus used in this study. We thank the combined effort of our colleagues at Stress and Cognitive Electro Imaging Laboratory at AIIMS, New Delhi.
Authors’ Contribution
Ms. Manorma Saini wrote the original draft of the study. Mr Ankit Gurjar helped in paradigm designing. Dr Muthukrishnan SP, Dr Simran Kaur, and Dr Ratna Sharma contributed to the conceptualization and interpretation. Dr Prashant Tayade contributed to supervision, writing draft, conceptualization, analysis, and overall supervision.
Statement of Ethics
The study was ethically approved. The ethical clearance was taken from the Institutional Ethical Committee of All India Institute of Medical Sciences, New Delhi (IECPG-22/28.02.2018).
Declaration of Conflicting Interests
The authors declared no potential conflicts of interest with respect to the research, authorship, and/or publication of this article.
Funding
The authors received no financial support for the research, authorship, and/or publication of this article.
ICMJE Statement
We take complete responsibility that the data is integrated and accurate. And we have full access to the data in this study.