
Abstract
This study uses a difference-in-differences approach to examine the influence of market-maker agreements on liquidity alterations in Boursa Kuwait. Our research indicates that signing a market-maker agreement augments the number of executed trades, turnover, and trading volume while decreasing instances of zero trades, bid–ask spread, and Amihud Illiquidity within the first week. Interestingly, these agreements do not affect stock return volatility.
Our study extends the knowledge about the role of market makers in emerging markets.
1. Introduction
The rise and global integration of emerging markets have been key features of the economic landscape in the twenty-first century. These fast-growing economies are becoming essential players on the international stage, providing lucrative opportunities for investors and a range of investment options (Huidrom et al., 2020). As a result, strategically investing in these markets can significantly benefit investors by diversifying their portfolios. Nevertheless, these markets’ complicated and idiosyncratic nature poses multifaceted challenges to scholars and industry professionals. A key challenge is the need for a detailed understanding of how market makers (MMs) influence the development of these growing markets.
MMs in mature markets are key drivers in promoting market liquidity, efficiency, and stability. They are crucial in influencing liquidity, efficiency, and stability (Menkveld & Wang, 2013; Nimalendran & Petrella, 2003; Venkataraman & Waisburd, 2007). On the other hand, MMs have been shown to have disadvantages such as increased firms’ liquidity co-movement, reduced market stabilization, and increased bid–ask spread due to collusion (Christie & Schultz, 1994; Coughenour & Saad, 2004; Huang, 2002).
For example, Charitou and Panayides (2009) address this void by offering guidelines for implementing market-making systems in such markets based on insights garnered from established models in developed economies. While the initial aim was prescriptive, the study ultimately emphasizes the importance of foreign investors’ familiarity with market design in facilitating foreign capital inflows. In this context, Kuwait is a valuable case study of an emerging market, offering insights into the significant impact that MMs have on its equity market, especially when there is a mixed result on whether the Kuwaiti market is efficient (Abdmoulah, 2010; Almujamed et al., 2018).
The Kuwaiti financial market has recently witnessed exponential reforms through the relatively newly formed Capital Markets Authority (CMA) in 2010 and the newly formed Boursa Kuwait (BK) in 2016. The successful evolution of the market led to Kuwait being recognized as an “Emerging Market” by the global index provider MSCI in 2020, reflecting its progress in reforming market practices and enhancing foreign investors’ accessibility, which should increase foreign direct investment as documented by Eissa and Elgammal (2020). After the upgrade, BK experienced $3.1 billion in inflows from foreign investors, which adds to the importance of studying the role of MMs. By investigating the implications of MM in the context of BK, this research enhances our understanding of the market microstructure in emerging financial landscapes.
MMs are crucial for the efficiency of financial markets, playing vital roles in price discovery and liquidity provision. However, implementing MMs in emerging markets such as Kuwait encounters distinct challenges and may exacerbate negative impacts such as price manipulation found in Pakistan (Khwaja & Mian, 2005). While extensive research explores regulatory frameworks in emerging markets and their influence on market development and investor protection (Bekaert & Harvey, 2000; Porta et al., 1998), there is a relative scarcity of studies focusing on MMs in the Gulf Cooperation Council (GCC) region, particularly Kuwait. The evolving regulatory environments in emerging markets necessitate a closer examination of MMs’ impact on liquidity, trading efficiency, and market stability.
Articles from Kuwait’s local Aljareeda newspaper have frequently criticized the role of MMs in Kuwait, arguing that replicating frameworks from other markets does not necessarily guarantee success. 1 One of the primary obstacles is cultural resistance; there is a significant lack of understanding and trust in the role and benefits of MM, which hampers their acceptance and effectiveness. Additionally, the infrastructural setup of BK may not fully support the activities of MMs, limiting their effectiveness. Moreover, the costs associated with maintaining an MM, including fees and operational burdens, may also deter their use, especially when companies have alternative methods for managing price stability, such as stock buybacks.
Research insights on this topic are valuable for BK’s regulators and policymakers in formulating policies that enhance market development and attract a broader investor base, both locally and internationally. Since engaging an MM in BK is voluntary and occurs only when the listed firm and the MM mutually agree, research insights can influence whether firms choose to utilize these services. Depending on empirical findings, listed companies may be encouraged to seek MM agreements to enhance liquidity or avoid such services if the expected benefits do not align with their market needs.
We employ a difference-in-differences (DiD) approach to explore the effect of companies signing MM agreements on liquidity dynamics in BK. The DiD approach is well-suited for this analysis as it allows us to control unobserved, time-invariant factors that may affect liquidity across firms. By comparing the changes in liquidity between firms that sign MM agreements and those that do not, before and after the agreement, DiD helps to isolate the causal impact of these agreements, reducing the risk of bias from firm-specific characteristics (Angrist & Pischke, 2008).
Our findings indicate that MM agreements increase executed trades, turnover, and trading volume, decrease the occurrence of no-transaction days, and reduce bid–ask spread and Amihud Illiquidity. MM agreements do not influence stock return volatility, which suggests that MMs primarily assist investors with liquidity needs rather than engaging with the activities of technical traders (Zhu et al., 2009).
The MM’s impact is most evident during the “post-COVID” period, suggesting that MMs were less effective amid the heightened uncertainty of COVID-19. Another factor limiting their impact on liquidity from 2020 to 2021 could be the novelty of MM services in BK, as MMs likely required time to adapt to the legal framework and optimize their performance.
Furthermore, 10% of the MM agreements in our sample conclude with deregistration. Interestingly, when we consider deregistration as an event, there is no reversal in the impact of MMs. None of the liquidity variables are affected by deregistration. This suggests that firms strategically terminate their association with MMs when they no longer benefit from their services.
The research is particularly novel as it represents one of few, if any, empirical studies conducted on MMs in the GCC region. What sets this study apart is the distinctive context provided by BK’s market structure and segmentation. The lack of analyst coverage, which challenges market participants, paradoxically offers a unique advantage to our study. It allows us to isolate and measure the impact of MMs more accurately, devoid of the potentially confounding influence of analysts’ opinions often present in other markets (Easley et al., 1998; Irvine, 2003).
Our empirical evidence illustrates that MMs can improve liquidity even within the challenges commonly faced in emerging markets. The study also explores how the impact of MMs varies across different types of firms, revealing that their influence is more significant on less liquid firms in the Main Market segment than more liquid firms in the Premier Market segment. This finding adds a new dimension to our knowledge of where MM interventions are most effective.
Importantly, our findings show that MM agreements do not significantly impact return volatility. This contrasts with Venkataraman and Waisburd (2007), who found that MMs reduced volatility in a clearing auction mechanism. The discrepancy highlights the critical role market microstructure plays in shaping the effects of MMs on outcomes like volatility, suggesting that different market environments influence how MMs affect trading dynamics.
2. Setting
2.1. Market Makers
Market liquidity is essential for the efficient functioning of financial markets. It refers to the capacity to trade assets quickly and in substantial volumes without significantly impacting their price (Glosten & Milgrom, 1985; O’Hara & Oldfield, 1986). Efficient liquidity ensures market participants can execute trades seamlessly, contributing to overall market efficiency and price stability (Ho & Stoll, 1981; Madhavan & Smidt, 1991). MMs are pivotal in this process, continuously providing buy and sell quotes that facilitate trading and reduce price fluctuations.
Without MMs, markets can experience various adverse effects, including diminished liquidity, heightened price volatility, and reduced market efficiency. These issues are particularly pronounced for smaller stocks and during periods of market stress, where the absence of dedicated liquidity providers can exacerbate market instability (Al-Awadhi & Alhashel, 2020).
Researchers have documented the positive role of MMs in developed markets. Research by Nimalendran and Petrella (2003) and Venkataraman and Waisburd (2007) has shown that MMs contribute to narrower bid–ask spreads and higher trading volumes, enhancing market efficiency. Anand et al. (2009) and Menkveld and Wang (2013) further established that MMs provide immediate execution, reduce liquidity risk, and contribute to firm value by absorbing order imbalances. Perotti and Rindi (2010) emphasized their role in facilitating price discovery and promoting trading efficiency, which is vital for maintaining market stability.
Emerging markets, characterized by lower liquidity, higher volatility, and evolving regulatory frameworks, present unique challenges for MMs. Charitou and Panayides (2009) critically analyze the implementation of market-making systems in such markets, emphasizing the need for a tailored regulatory approach. They identify vital factors regulators must consider, including exchange design, restructuring costs, investor sentiment, and market size.
The regulatory framework is a significant determinant of MMs’ effectiveness. While extensive literature examines regulations in emerging markets and their effects on market development and investor protection (Bekaert & Harvey, 2000; Porta et al., 1998), there is limited focus on how these frameworks shape the role of MMs in the GCC region. Regulatory support has enabled MMs to provide liquidity and maintain market stability in developed markets. However, emerging markets often face challenges in establishing supportive regulatory environments due to evolving legal structures and varying levels of market maturity.
Despite the recognized importance of MMs in enhancing market efficiency, there is a distinct gap in the literature concerning their role in the GCC region. Most existing studies focus on developed markets, leaving the unique dynamics and challenges of market-making in emerging economies like Kuwait underexplored. Unlike developed markets, where regulatory frameworks and market structures are more conducive to supporting MMs, emerging markets may lack such support, affecting the MMs’ ability to operate effectively. Therefore, this study aims to address this gap by examining the impact of MM agreements on liquidity and trading behavior in BK, offering insights into market-making in an emerging market context.
2.2. CMA and Boursa Kuwait
Boursa Kuwait, previously known as the Kuwait Stock Exchange (KSE), is a prominent entity in the GCC region. KSE’s establishment traces back to 1977. KSE’s decline in the aftermath of the 2008 crisis highlighted weaknesses in Kuwait’s financial regulatory framework. While several regulatory bodies were overseeing different parts of the financial sector, there was a lack of coordination among them, and they were not equipped to deal with a crisis of this magnitude. This situation underscored the need for a more robust and unified regulatory body to oversee the country’s financial markets, ultimately leading to CMA’s creation in 2010. 2
The CMA goal is to foster market integrity, transparency, and investor confidence, which requires altering the market structure. In line with CMA’s broader financial reform agenda, the decision to rebrand KSE as BK and transfer control from the government to a private entity was a strategic move aimed at modernizing the exchange, increasing its competitiveness, and aligning it with international best practices. The CMA decided to create BK partly due to the desire to improve the efficiency of the exchange and to encourage the introduction of new products and services, such as MMs.
BK immediately started updating the infrastructure and business landscape of the Kuwaiti capital market to comply with international standards. Market Development Plan 1 was launched in 2017, covering the settlement cycle of T + 3 and tick sizes. Market Development Plan 2 was launched in 2018, dividing the market into three sectors: “Premier,” “Main,” and “Auction,” which provided listing rules and introduced circuit breakers. BK is the first regional exchange to implement market segmentation. Market Development Plan 3.1 was launched in 2019, which included the incorporation of real estate investment trusts, the authorization of short selling, and the facilitation of stock swaps. As a result of the multiple reforms, in June 2019, MSCI classified Kuwait’s capital markets as an “Emerging Market,” after both FTSE Russell and S&P Dow Jones Indices had already classified Kuwait as an “Emerging Market.”
2.3. Market Makers in Boursa Kuwait
Before introducing MMs, BK primarily operated as an order-driven market with no MM system. BK facilitated trading activity by matching buy and sell orders in an order book. A lack of regulation and modern trading mechanisms delayed the introduction of MMs.
Liquidity was a major concern for all stakeholders. The CMA and BK aimed to improve market liquidity to meet MSCI’s requirements for the “Emerging Market” classification, which would help attract foreign investment. At the same time, listed firms focused on upgrading to a higher segment or avoiding a downgrade. A key determinant of a firm’s segment—whether “Premier”, “Main”, or “Auction”—is its average daily trading volume in Kuwaiti Dinar (KD). The Premier Market is designated for Boursa Kuwait’s largest and most liquid companies, while the Main Market includes those that fall short of the Premier Market’s size and liquidity criteria. 3
Although BK introduced the MM model in December 2016, the first company to receive an MM license did so in December 2019. BK had to complete Market Development Plans 1, 2, and 3.1 to establish the infrastructure for MMs to function effectively. Similar to designated market makers at the Paris Bourse, Amsterdam Euronext, and the Stockholm Stock Exchange (Anand et al., 2009; Menkveld & Wang, 2013), BK does not require listed firms to engage with an MM. Firms can allow MMs to provide services through mutual agreement, with contracts established on a case-by-case basis, similar to Anand et al. (2009) setting, allowing each listed firm to sign its contract at a different time.
Nevertheless, MMs in BK face various requirements and costs. MMs must obtain a license from the CMA and register with BK before engaging with any security. They must also sign an MM agreement before commencing activities and cannot request a waiver from fulfilling their obligations within the first three months. MMs must adhere to critical responsibilities, including minimum presence requirements and maximum bid–ask spreads. They can work with multiple firms, while firms can hire several MMs to optimize liquidity.
MMs operate within the order-driven market structure by enhancing liquidity and stability. Although supply and demand primarily drive the market, MMs actively improve liquidity and reduce price volatility for securities listed on BK. MMs ensure investors can buy and sell shares even when no immediate counterparties exist, preventing significant price swings. MMs complement the order-driven system by stabilizing prices and reducing volatility while adhering to the exact matching mechanisms of other market participants.
Operating within BK, MMs confront both potential challenges and opportunities. One distinctive hurdle arises from the relatively shallow market depth that may hinder MMs from maintaining liquidity and managing their inventory effectively. Furthermore, inherent volatility, economic shocks due to the dependency on oil, and regulation changes impose additional challenges. MMs face challenges navigating the market during periods of high volatility but seize the opportunity to maximize profits from bid–ask spreads.
Thus, MMs generally need financial stability, infrastructural capacities, and trading experience. Incurred charges encompass membership fees, transaction costs, operational expenses, and compliance costs. Despite these, MMs benefit from fees offered by the firm, bid–ask spread, and incentives or rebates offered by the exchange to offset some of these expenditures.
Furthermore, the MM system in Kuwait can benefit firms by enabling them to enter global indices, facilitating upgrades from the Main Market to the Premier Market, and maintaining their Premier Market presence. Some companies have rescinded MM agreements due to failure to achieve liquidity goals, the appointment of better MMs, expense reduction, or the MM’s underperformance during periods of market turmoil. Despite these cancellations, current trends indicate growing interest from listed companies.
3. Data and Empirical Methodology
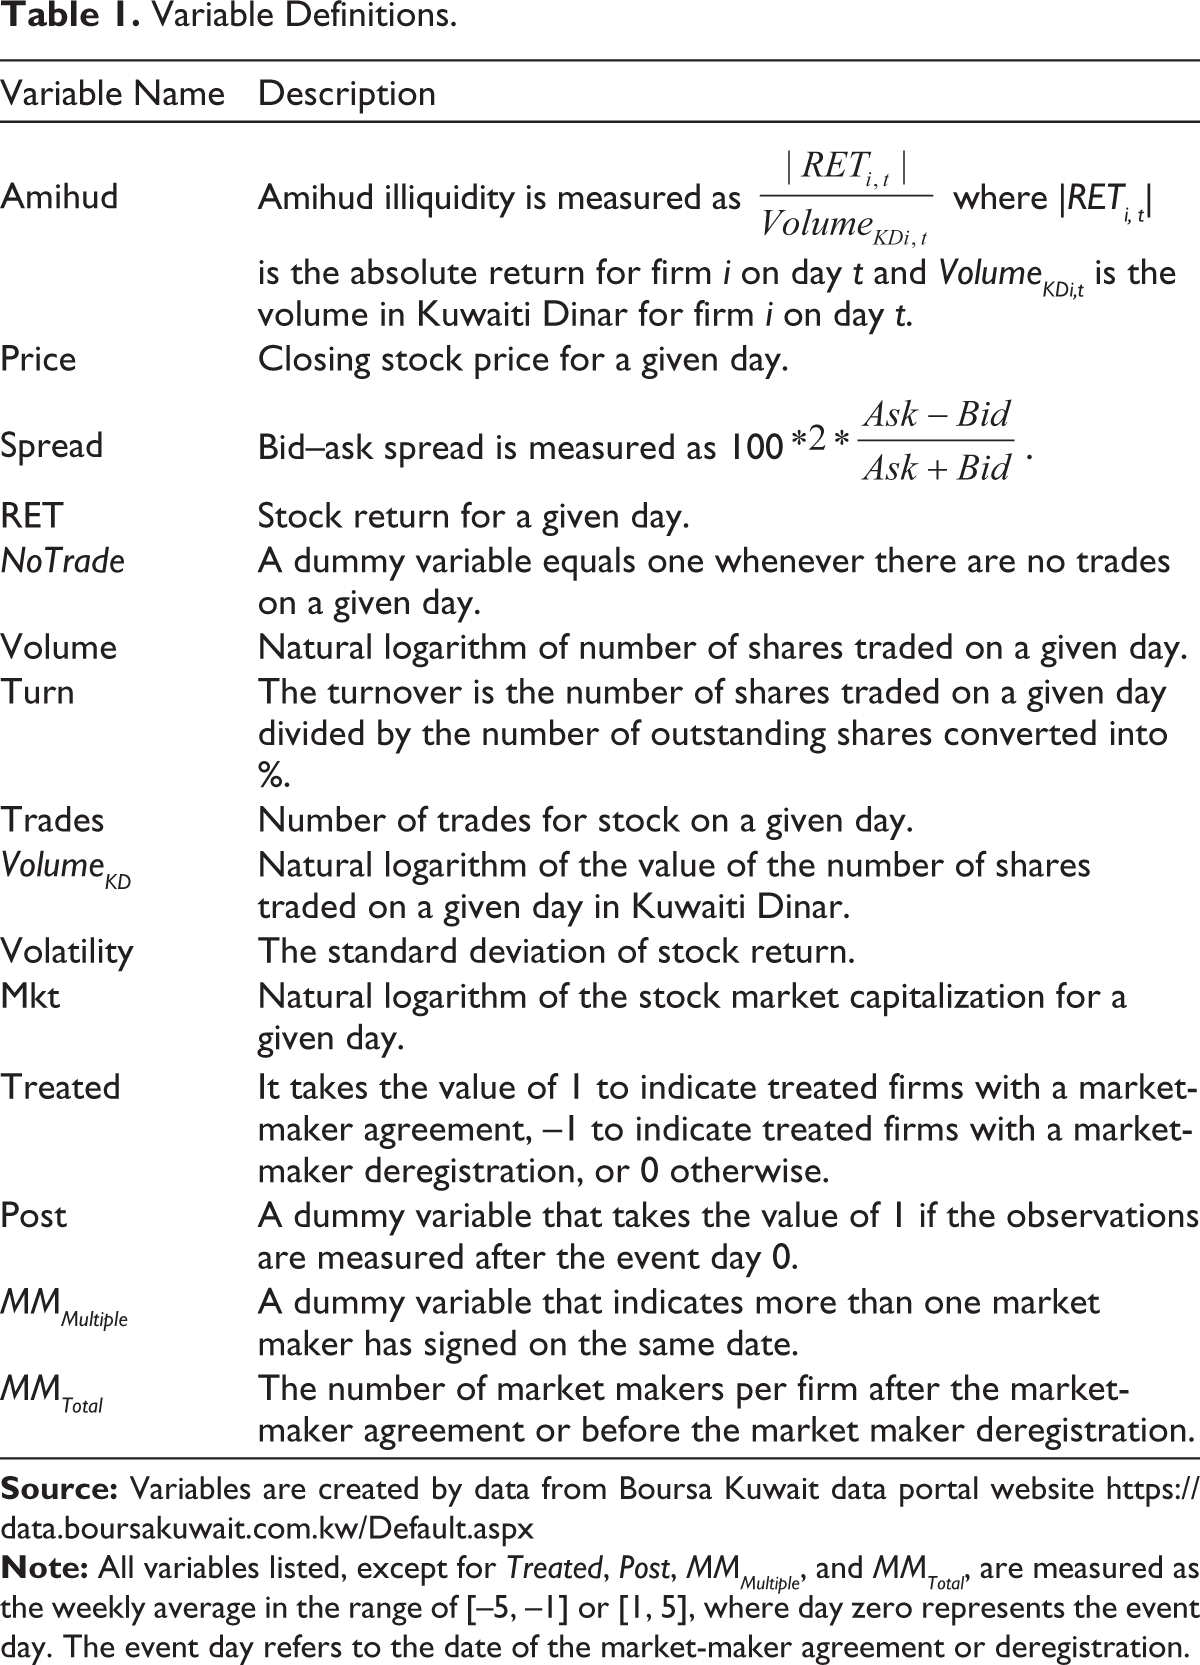
Table 1 defines all variables. We manually collect the dates of all MM agreements from BK’s website. An event date is when a firm registers or deregisters with an MM. We identified 71 MM agreements with 66 event dates since five firms signed with two MMs on the same date. We added seven MM deregistrations in our sample, which brings the total to 73 event dates. Our first event date is on December 29, 2019, and our last event date is on February 20, 2023. We document the number of MMs the firm is contracted with (MMTotal) after (before) the agreement (deregistration) date for each event.
Variable Definitions.
Our sample consists of seven unique MMs and 47 unique firms. There has been a noticeable upward trend in MM adoption. In 2019, only 1.7% of firms had an MM agreement. By the end of our sample in 2023, 27.7% of the listed firms had at least one active MM agreement, indicating a growing recognition of MMs’ value in enhancing liquidity and market efficiency.
We merge the MM agreement dates with the daily equity data from BK’s database. 4 We exclude daily data when firms are suspended from the exchange, as it incorrectly suggests that the firm is illiquid. From the BK’s data, we retrieve daily close price (Price), ask price (Ask), bid price (Bid), firm security code (ID), firm sector, volume (Volume), turnover (Turn), volume value in KD (VolumeKD), number of trades (Trades), and market cap (Mkt).
Volume represents the number of shares traded, which differs from Trades since one trade could represent 10 shares or 10,000. NoTrade is a dummy variable equal to one whenever Volume is zero. The firm security code (ID) serves as a unique identifier for a firm, as the ticker or company name may change over time. The firm sector indicates which industry the firm belongs to. 5
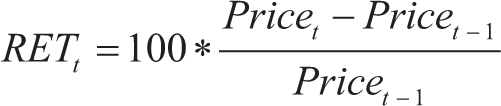
We calculate the daily return by taking the difference between today’s closing price and the previous day’s closing price, dividing it by the previous day’s closing price, and converting it into a percentage. The formula is as follows:
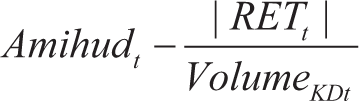
We use the bid–ask spread (Spread) and Amihud Illiquidity (Amihud) as proxies for liquidity. Spread indicates the cost of trading a stock, with more liquid stocks typically having narrower spreads. Amihud measures the absolute price change in percentages per KD of daily volume traded, as proposed by Amihud (2002). We calculate these two variables as follows:
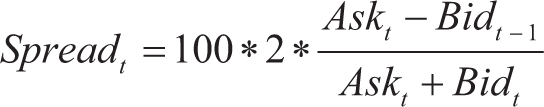
We convert Spread into percentages. Return volatility, Volatility, is used as a proxy for risk, and it is the standard deviation of returns over five days, generating a weekly value. We calculate the following variables—Price, Volume, Turn, VolumeKD, Trades, Mkt, NoTrade, Spread, and Amihud—weekly as follows:
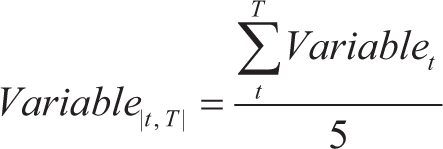
We calculate the variables twice for each MM agreement event: once before the event date as the average of days [–5, –1], and once after the event date as the average of days [1, 5], where day 0 represents the event date. We estimate Spread and Amihud even if some daily values are missing—due to zero Bid, Ask, or Volume—whenever there is at least one estimated value out of the five days. 6 We convert Volume, VolumeKD, and Mkt using the natural logarithm to reduce skewness. We standardize Turn by dividing Volume by the total shares outstanding, then multiplying it by 100 to express the value as a percentage. We winsorize Price, Trades, Spread, and Amihud at the 99% level to minimize the impact of any outliers.
We measure the variables weekly, so each event includes every day of the week. Alsabah and Alsabah (2023) find evidence of the day of the week’s return and different trading trends based on the day. Furthermore, a week is relatively short, limiting any impact from confounding events while allowing sufficient time to observe any MM impact.
We implement a DiD approach to estimate the impact of an MM on a firm’s liquidity. We match each firm with an MM agreement, treated firms, to a firm without an MM agreement, control firms. 7 We precisely match firms on the event date, sector, and market segment. Next, we match on Mkt such that treated and control firms are the nearest neighbors regarding market capitalization.
We chose the DiD approach because it estimates causal effects in a quasi-experimental setting by comparing liquidity changes between treated and control firms. This approach mitigates the risk of bias arising from firm-specific factors that remain constant over time and might otherwise confound the results. Additionally, the DiD approach automatically accounts for time-specific shocks that could affect both the treated and control groups, such as macroeconomic events. Since these shocks impact both groups similarly, DiD measures the difference between them, thus isolating the true effect of the treatment (Angrist & Pischke, 2008).
Furthermore, DiD’s parallel trends assumption holds that the treated and control firms would have experienced similar liquidity trends over time in the absence of MM agreements (Blundell & Dias, 2009). This assumption is reasonable in our context, as both groups of firms operate under the same market conditions in BK and share similar characteristics. By satisfying this assumption, we can attribute any differences in liquidity changes to the effect of the MM agreements rather than to external shocks, omitted variable bias, or firm-specific developments.
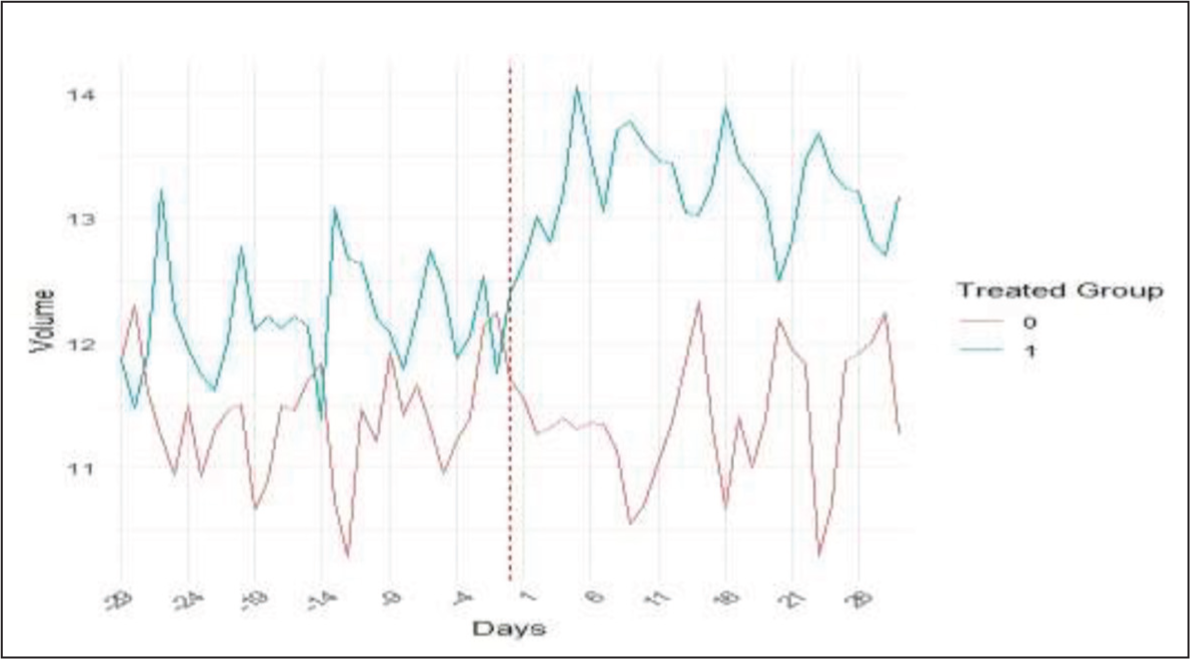
Figure 1 demonstrates the Volume for the treated and control groups over time, with the vertical dotted red line marking the event date. The pre-treatment trajectories fluctuate within similar ranges for both the treated and control groups, indicating that both groups would likely have followed similar trends without treatment satisfying the parallel trend assumption. Following the event, the treated group’s Volume increases relative to the control group. This change provides visual evidence of the treatment’s impact, further justifying the use of the DiD approach in our analysis.
Second, the stable unit treatment value assumption, which asserts that one firm’s treatment status does not influence others’ outcomes, is expected to hold in our context. One firm’s MM agreement is unlikely to directly affect the liquidity of other firms. Third, this setting has perfect compliance, as firms that sign an MM agreement are guaranteed to receive MM since MM cannot request a waiver from fulfilling their obligations within the first three months.
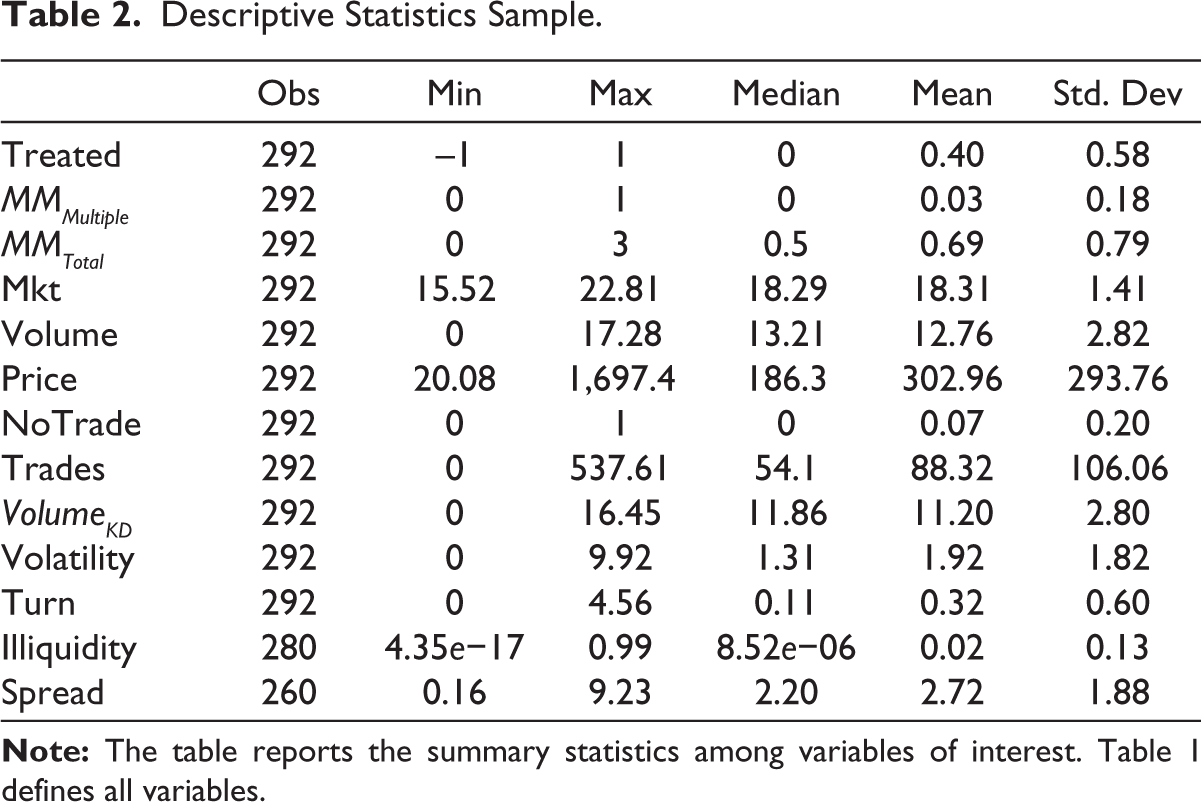
Table 2 presents the summary statistics for the observations in our sample, while Table 3 shows the covariate balance during the pre-period, allowing us to assess differences between control and treated firms. Most treated events involve MM agreements (Treated = 1), with only seven being deregistrations (Treated = −1), leading to a Treated mean of 0.81. Five treated events feature multiple MM agreements (MMMultiple = 1), and on average, treated firms have 1.38 MMs after (or before) the agreement or deregistration date (MMTotal). As expected, Treated, MMMultiple, and MMTotal statistically differ between the treated and control groups, as control firms do not have MMs.
Descriptive Statistics Sample.
Covariant Balance.
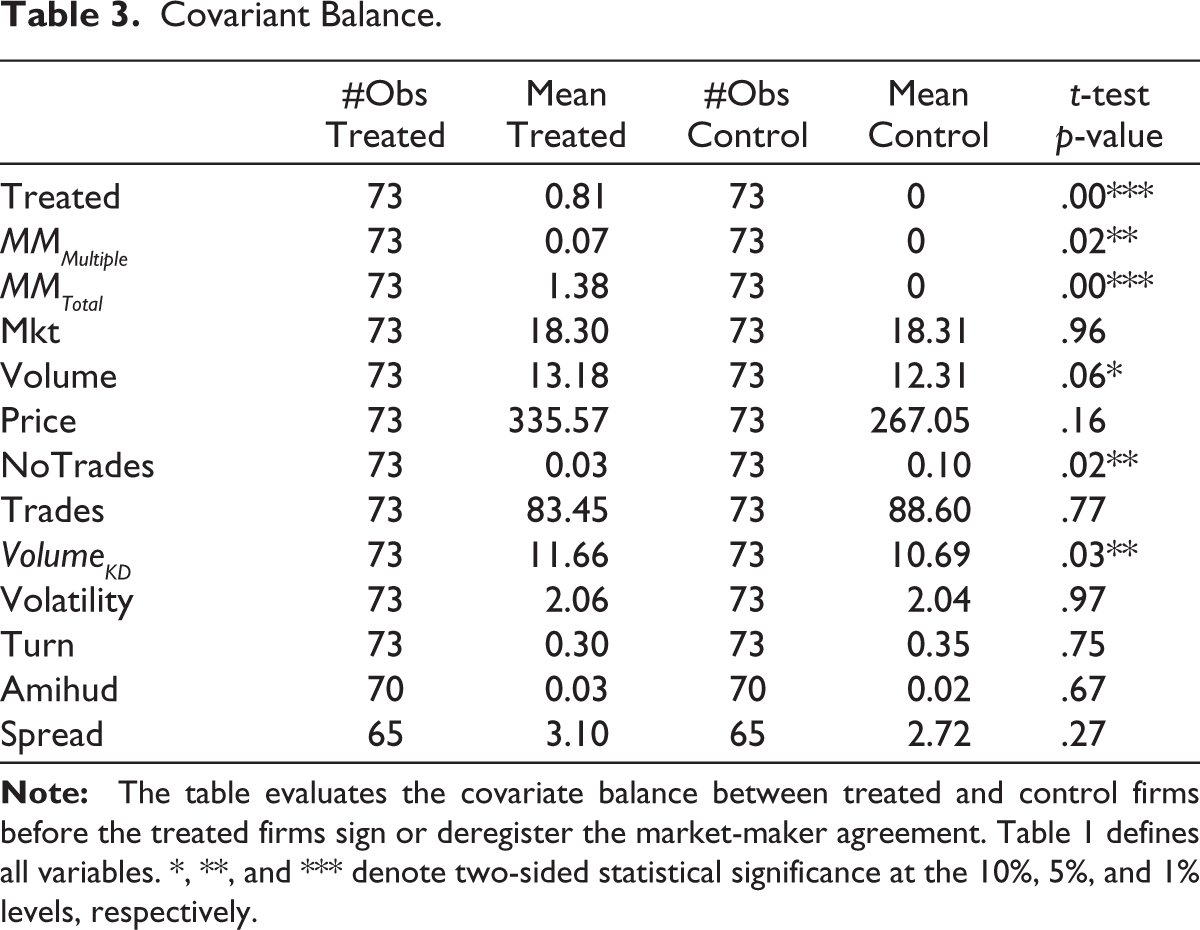
The average market capitalization (Mkt) for treated firms is 357 million KD, slightly higher than the 339 million KD for control firms. 8 Treated firms also have a higher average closing price (Price) of 335 Fils, compared to 267 Fils for control firms. 9
The average turnover (Turn) for treated firms is 0.3%, slightly lower than the 0.35% for control firms. Control firms generally exhibit lower bid–ask spreads and Amihud Illiquidity. However, none of the previous variables are statically different between the two groups.
Table 3 indicates statistically significant differences between the treated and control groups for NoTrade, Volume, and VolumeKD. The difference in NoTrade suggests that MMs and firms are more likely to enter agreements when firms do not face severe liquidity issues, as treated firms report zero trades only 3% of the time, compared to 10% for control firms. 9 Given the high correlation between NoTrade, Volume, and VolumeKD, it is unsurprising that Volume and VolumeKD also show differences. Interestingly, more liquid firms seem more inclined to engage with MMs after controlling for size, which contrasts with Nimalendran and Petrella (2003) and Venkataraman and Waisburd (2007), who suggest fewer liquid firms benefit more from MMs. This paradox may arise from MMs’ preference for more liquid firms to maximize profitability when bid–ask spreads are similar. Additionally, treated firms have more outstanding shares, as indicated by higher Volume despite lower Turn.
4. Empirical Results
Our sample consists of 292 observations, with half representing treated firms and the other half controls. We record two observations for each of the 73 events: one pre-event, calculated as the average of [–5, –1], and one post-event, calculated as the average of [1, 5]. Our primary model is as follows:
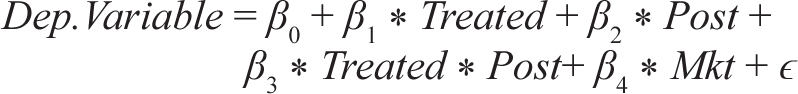
The coefficient β1 measures the difference between treated and control firms before the event; the coefficient β2 measures the difference between post- and pre-event periods, while the coefficient β3 estimates the impact of adding an MM, as it indicates whether Treated firms behave differently during the Post period. Table 4 shows that within the first week of signing up with an MM, a firm’s Volume, Turn, Trades, and VolumeKD increase, while NoTrade, Amihud, and Spread decrease. Overall, the results indicate that MMs have a positive impact on liquidity.
Columns 1 and 5 of Table 4 show that an MM causes the treated firm’s Volume to increase by 41.5%, equivalent to 144,426 shares. VolumeKD rises by 42.7%, equal to 31,102 KD. 10 Column 2 indicates that Turn increases by 0.144% for treated firms after the event, which is economically significant, representing 24% of Turn standard deviation. Column 3 shows that NoTrade decreased by 5% for treated firms after the event. Column 4 indicates that Trades increased by 20 trades, which is economically significant, representing 18.8% of the Trades standard deviation. Our results differ from the findings of Wahal (1997), which showed that the volume did not change following the entry of an MM. Unlike BK, Wahal (1997) focuses on the NASDAQ National Market (NNM), a dealer market, between 1982 and 1993. In his study, each stock had at least two MMs, and the NNM featured low barriers to entry for MMs, a key difference from our study’s more regulated MM environment.
Market-maker Impact.
Our event window spans from December 29, 2019, to February 20, 2023, covering 73 event dates. We calculate each event’s pre- and post-event variables for treated and control firms, resulting in 292 observations. We match treated firms with control firms based on identical event dates, market segments, and industry sectors, then pair them with the nearest neighbor in terms of Mkt. Standard errors are clustered by firm. *, **, and *** denote two-sided statistical significance at the 10%, 5%, and 1% levels, respectively. T-statistics are shown in parentheses. Table 1 defines all variables.
Column 6 reveals that signing with an MM does not affect Volatility, indicating that it does not exacerbate stock risk associated with noise traders. Contrarily, Venkataraman and Waisburd (2007) report that Volatility is lower for firms with MMs. It is important to note that our study is set in a different context, BK, unlike Venkataraman and Waisburd (2007), which focuses on the auction clearing mechanism of the Paris Bourse. Zhu et al. (2009) suggest that MMs can destabilize markets when technical traders dominate over fundamental investors. Although Abul (2019) reports that 30% of investors in Kuwait rely on technical analysis, our findings indicate that MMs do not destabilize BK, as measured by Volatility. This difference may arise because firms are less likely to enter an MM agreement if they anticipate increased stock volatility. Under BK’s framework, the listed firm and the MM must mutually agree to the terms. As a result, firms may avoid such agreements when they expect heightened volatility.
Columns 7 and 8 demonstrate that MMs enhance liquidity and reduce information asymmetry, as evidenced by reductions in both Amihud and Spread for the treated firm’s post-event. The decreases are economically significant: Amihud falls by 0.04, 30% of its standard deviation, and Spread decreases by 0.335, representing 18% of its standard deviation. Our results align with previous studies in developed markets, such as those by Nimalendran and Petrella (2003), Venkataraman and Waisburd (2007), and Menkveld and Wang (2013), which found that MMs significantly enhance liquidity and narrow bid–ask spreads.
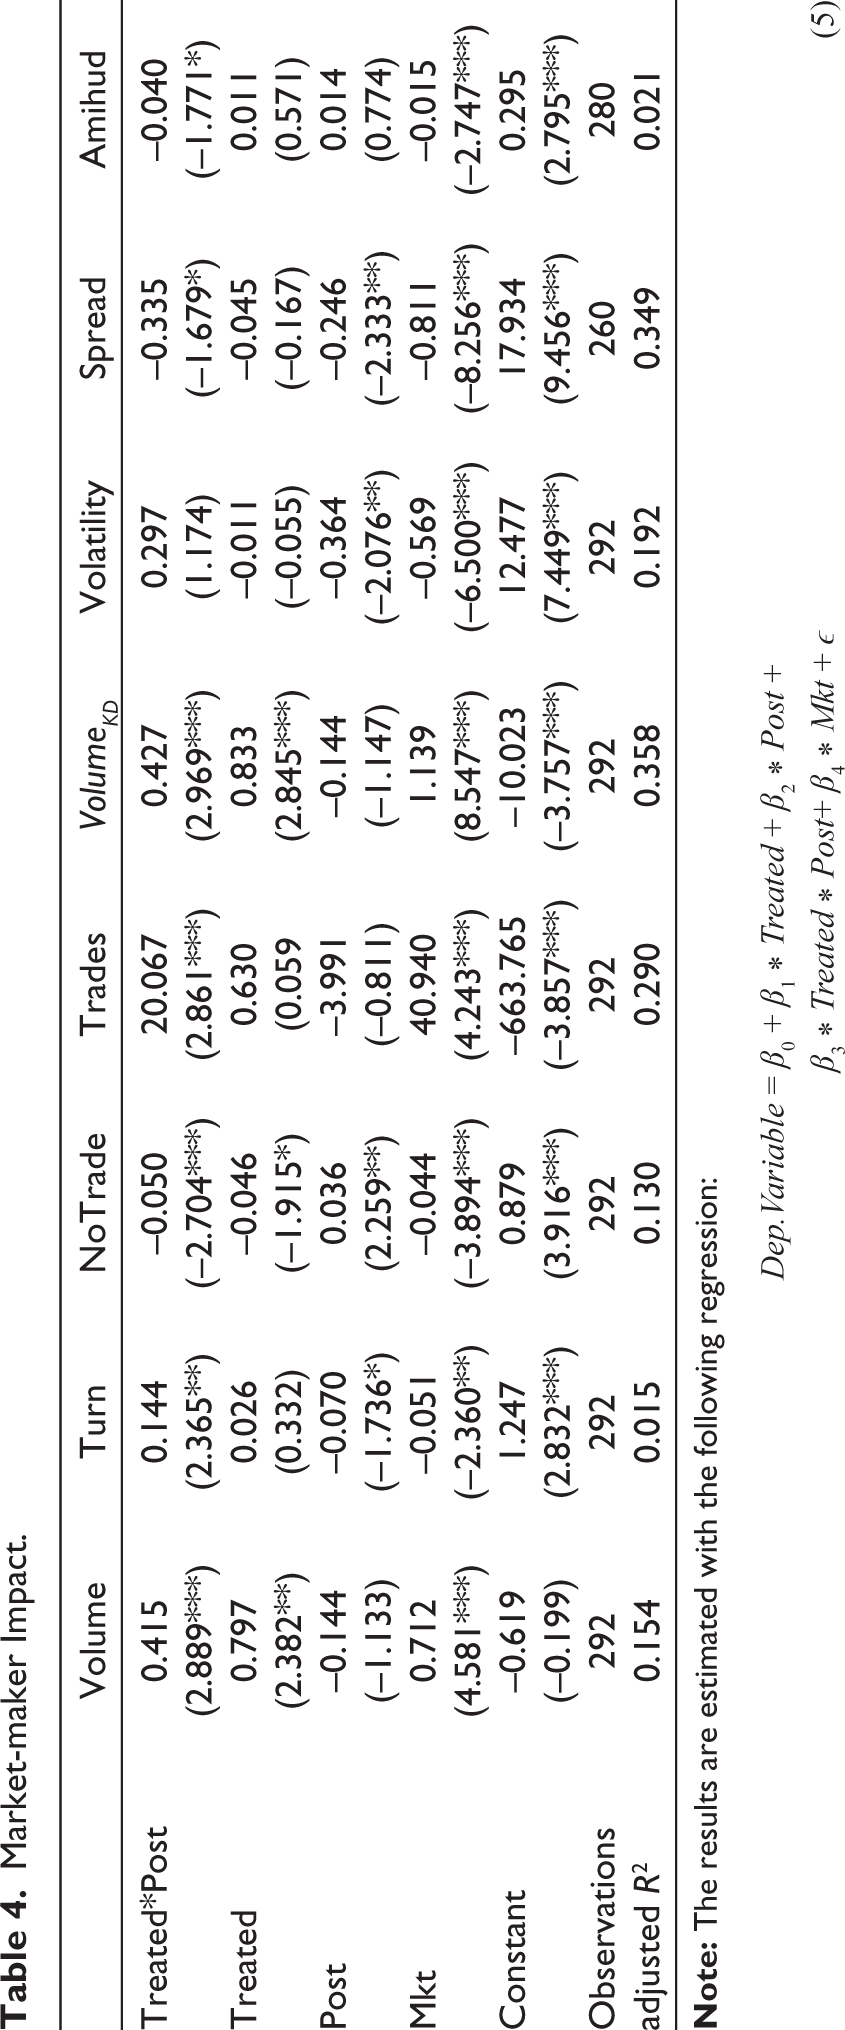
Next, we investigate how each market segment is impacted by signing with an MM. We would conjecture that firms in the Main Market would benefit the most, as they are less liquid. As shown in Panel A of Table 5, the impact of MM on the Premier Market is null, as the results are no longer statistically significant. 11 The impact of MM on Main Market firms, as shown in Panel B of Table 5, is greater in magnitude relative to our base case presented in Table 4. Firms in the Main Market may benefit more from MMs due to the segment’s lower transparency and liquidity level. Although Grossman and Miller (1988) predict that MMs are more attracted to larger stocks, as supported by Anand and Venkataraman (2016), this does not necessarily result in greater liquidity improvements for larger stocks, as shown in Table 5 for BK. While MMs favor larger stocks due to higher volumes and lower inventory risk, the liquidity benefits are not always proportionately greater, as market dynamics and MM regulations may also affect outcomes.
Market-maker Impact on Each Market Segment.
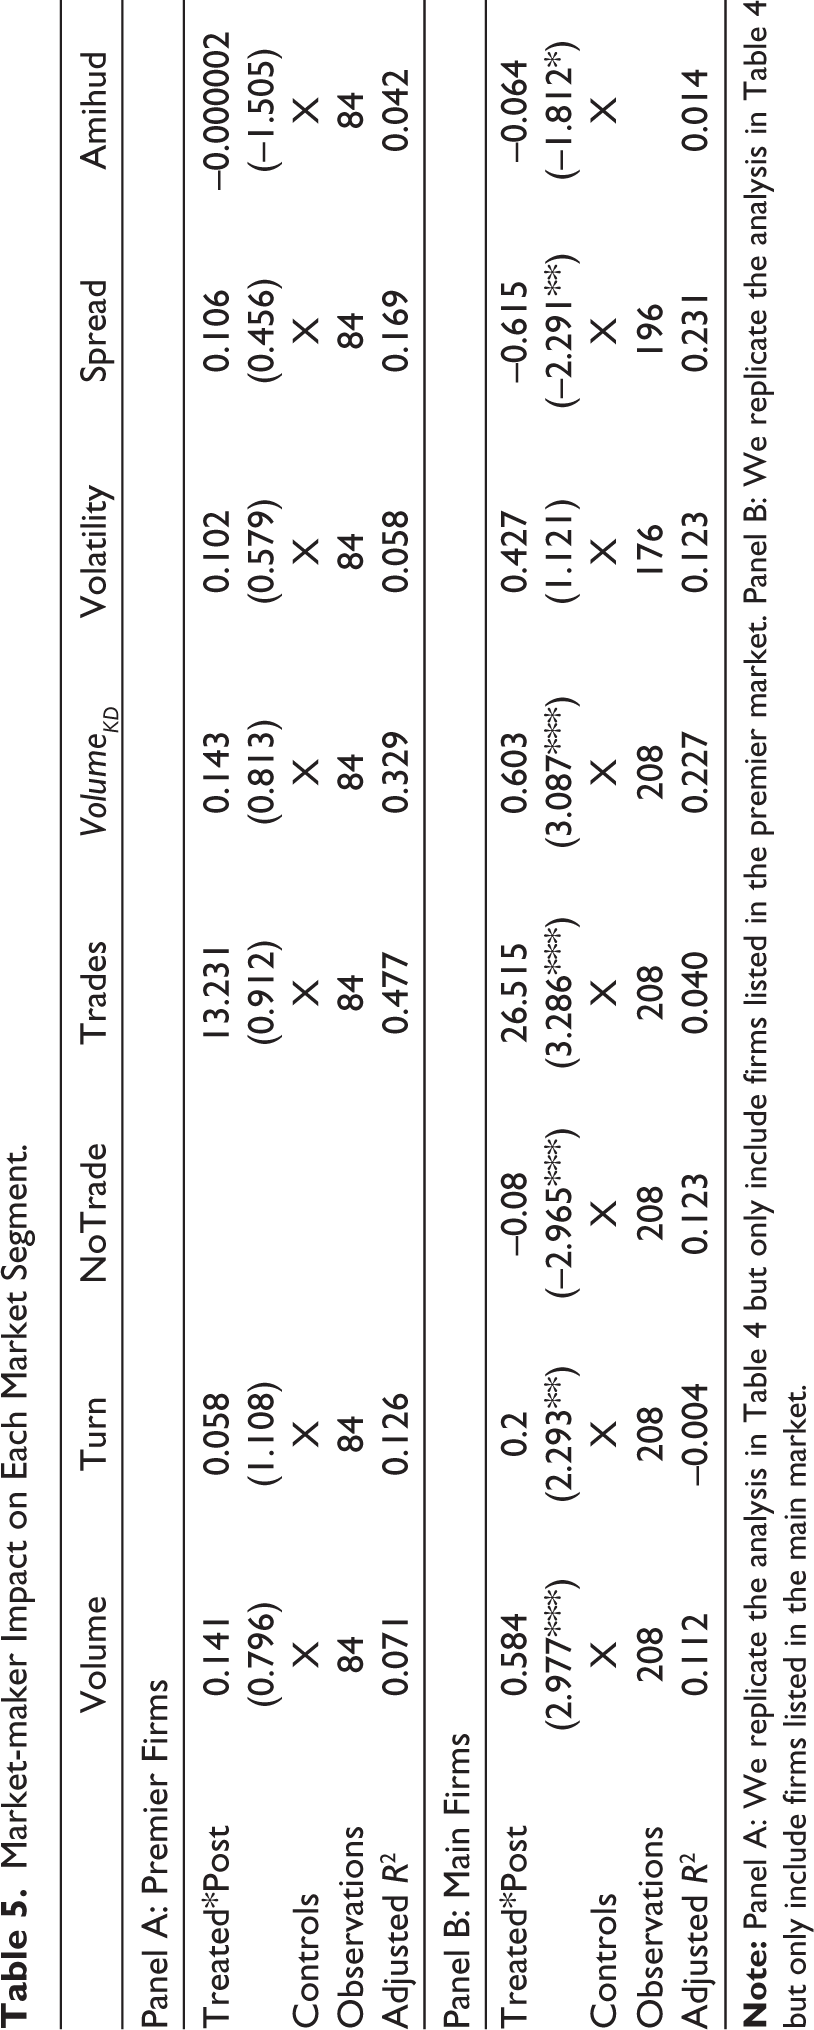
Additionally, we perform two auxiliary regressions: one on a sample of firms that sign agreements with two MMs on the same date, as shown in Panel A of Table 6, and another on firms that terminate their contracts with their MM, as shown in Panel B of Table 6. For Panel A, the effects on Volume, Turn, Trades, and VolumeKD more than double compared to the base case in Table 4. This suggests that firms may strategically choose the number of MMs they sign with based on their needs.
Market-maker Impact Based on Intensity and Exit.
In Panel B, firms that end their contracts with MMs do not exhibit any significant changes compared to the control group, suggesting that firms strategically disengage from MMs when they perceive no additional value. This differs from the findings of Wahal (1997), which showed that volume decreased following an MM exit. This difference may stem from the distinct market microstructures. In the NNM, MMs can exit at their discretion, while in BK, MMs must provide 30 days’ notice to withdraw, and listed firms can also cancel the contract. These differences in exit protocols may influence liquidity outcomes differently in the two markets.
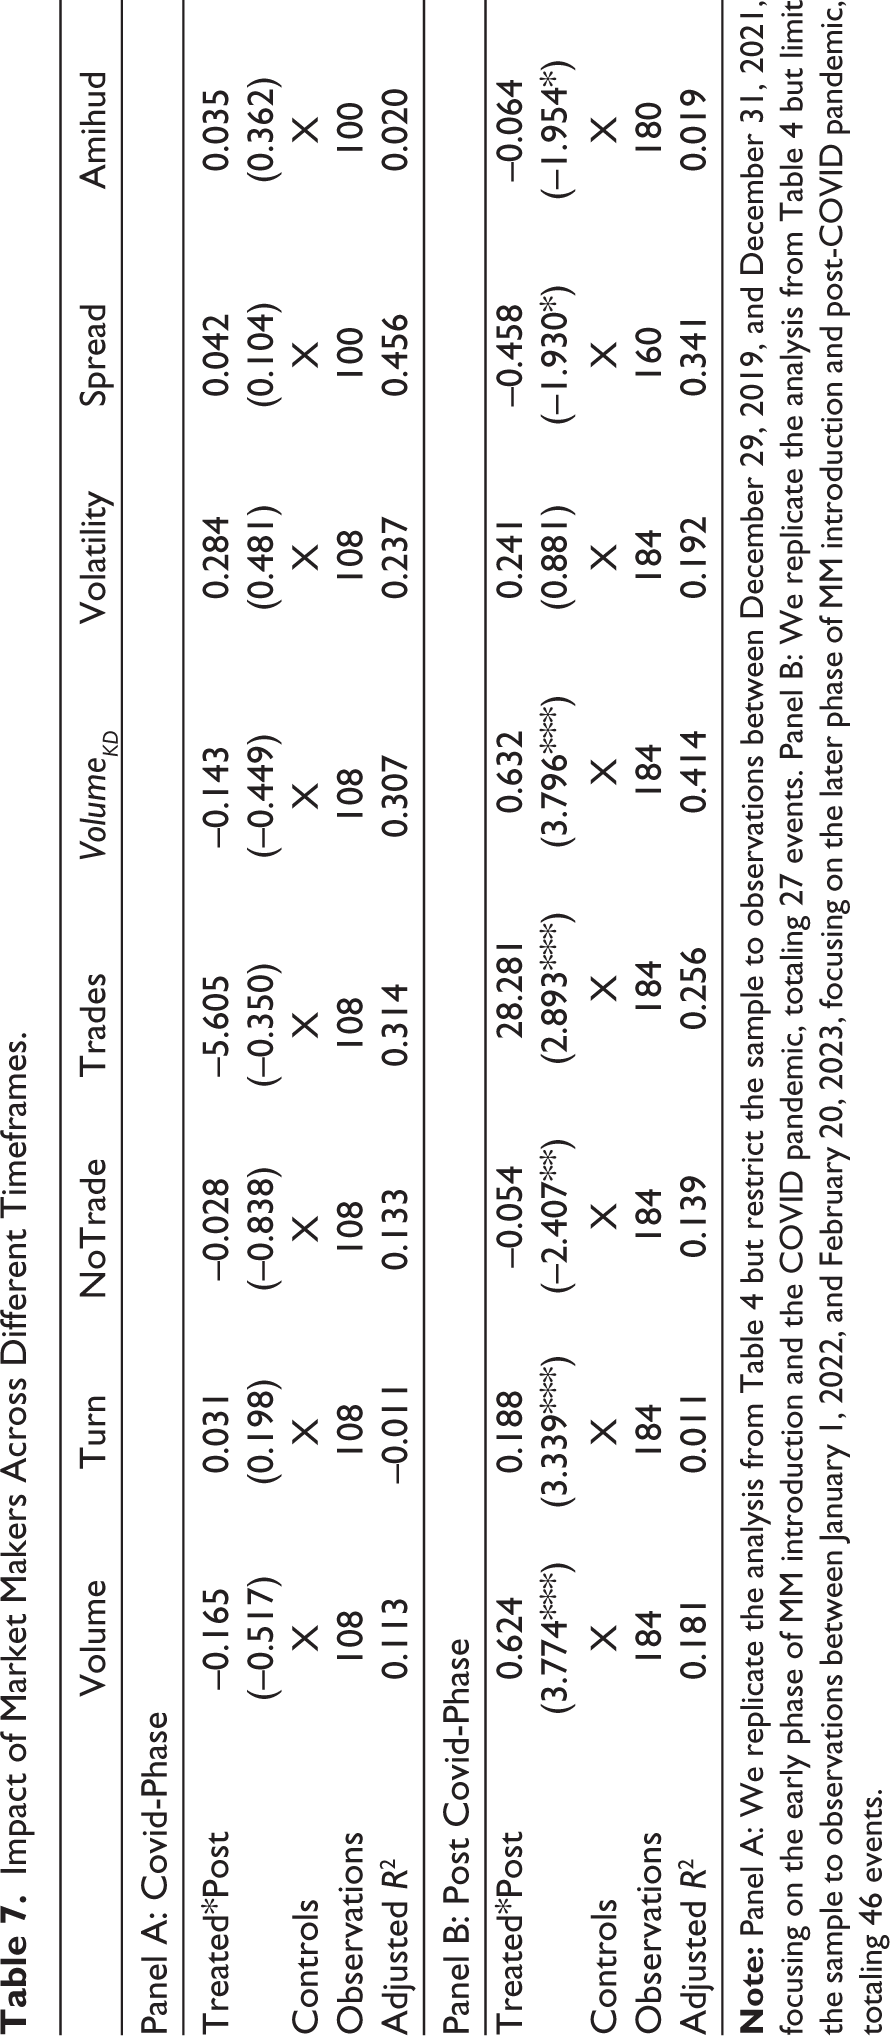
Finally, we divide our sample into two sub-periods: the “COVID phase,” covering observations from December 29, 2019, to December 31, 2021, and the “Post-COVID phase,”, covering observations from January 1, 2022 to February 20, 2023. The impact of MMs during the COVID phase may be lower than in the post-COVID phase for two key reasons. First, MMs were relatively new to this role and likely required time to gain experience and refine their performance. Second, the COVID phase posed significant challenges to optimal market operation due to changes in market structure dynamics (Cox & Woods, 2023), making it harder for MMs to function effectively during this period. Additionally, Anand and Venkataraman (2016) find that Endogenous Liquidity Providers (ELPs), such as high-frequency traders, are more likely to engage during periods of high volatility due to greater profit opportunities. This increased participation by ELPs can reduce the need for MMs, as ELPs help supply liquidity in volatile markets, often diminishing the role of MMs in such environments.
Table 7 confirms our conjecture: MMs had no significant impact on liquidity during the COVID phase, as shown in Panel A, while they had a more pronounced effect on liquidity during the post-COVID phase, as shown in Panel B, compared to our baseline results in Table 4. The absence of impact during the COVID phase may result from the disruptions caused by COVID-19, the MMs’ initial lack of experience, or a combination of both factors.
Impact of Market Makers Across Different Timeframes.
5. Conclusion
Our research provided novel insights into the role and influence of MMs in emerging markets, utilizing BK’s unique financial landscape as a case study. Through a DiD approach, our study offered empirical evidence that MMs successfully enhance liquidity. We demonstrated that this effect persists even after controlling for pre-existing firm differences. The impact of MMs is particularly evident among Main Market firms and the timeframe that followed COVID, contributing to the broader understanding of MMs’ role in emerging financial markets.
Our research also investigated the effects of MM agreements on market volatility. Our findings suggested that these agreements do not significantly contribute to return volatility, indicating that MMs do not induce noise trading. This discovery opens new avenues for research into the factors influencing market volatility in emerging economies.
Our research findings underscore the necessity for regulatory bodies to adapt and refine their frameworks to better support the functionality of MMs in emerging markets like Kuwait. Since MMs enhance liquidity without significantly increasing market volatility, policymakers should consider incentives that could encourage more firms to engage with MMs. For instance, relaxing certain stringent requirements, such as reducing the capital transaction thresholds for MMs, could make it more feasible for smaller or less liquid firms to benefit from market-making services. Also, reducing or removing the requirement for an MM to trade at least 10% of the total capital of a stock within a month might induce the MM to engage with more Premier Market firms.
While our study provides detailed insights into the role of MMs in Kuwait, its focus on a single country may limit the generalizability of the findings, naturally suggesting an extension to replicate the analysis across other GCC countries to enhance the scope and applicability of our results. Different GCC markets may present varied characteristics in terms of market structure, regulatory environments, and economic conditions, which could influence the effectiveness and roles of MMs. Such comparative studies could provide deeper insights into the systemic impacts of MMs across emerging markets, potentially informing more tailored and effective market regulations.
Footnotes
Declaration of Conflicting Interests
The authors declared no potential conflicts of interest with respect to the research, authorship, and/or publication of this article.
Declaration of Generative AI and AI-assisted Technologies in the Writing Process
While preparing this work, the authors used ChatGPT to improve its readability. After using this tool/service, the authors reviewed and edited the content as needed and take full responsibility for the publication’s content.
Funding
The authors received no financial support for the research, authorship and/or publication of this article.