
Abstract
This research article investigates the impact of big data usage on firm performance in the dynamic context of Indian organizations. With a focus on understanding how these organizations leverage big data techniques to enhance various functional areas and the role of strategic planning within this framework, the study contributes to bridging existing knowledge gaps. The study employs the dynamic capability view theory to explore the intricate relationship between big data resources, data analysis capabilities, and competitive advantage in the Indian business ecosystem. Through a comprehensive analysis of empirical data from diverse Indian organizations, the research aims to provide practical insights into the relationship between big data usage and firm performance. The findings not only guide Indian firms in optimizing their utilization of big data but also offer valuable information for policymakers and industry stakeholders. The study further delves into the mediating role of strategic planning in the relationship between big data usage and firm performance. This research article not only contributes to the theoretical foundations of big data analytics and strategic planning but also offers practical guidance for Indian organizations seeking to harness the full potential of these capabilities for enhanced firm performance. The findings underscore the transformative power of big data and emphasize the need for strategic planning to fully capitalize on this transformative potential in the Indian business context.
Keywords
Introduction
In recent years, the utilization of big data analytics has emerged as a game changer for organizations across various industries. The unprecedented growth of data, coupled with advancements in analytics techniques, has provided organizations with new opportunities to gain valuable insights and make data-driven decisions. This has led to a paradigm shift in how businesses operate and strive for enhanced performance. In the context of Indian organizations, leveraging big data analytics has the potential to transform business operations, improve decision-making, and ultimately enhance firm performance (FP).
The primary objective of this article is to empirically examine the impact of big data usage (BDU) on FP in the Indian business landscape. Specifically, the study aims to understand how Indian organizations are harnessing big data analytics to drive performance improvements across various functional areas and the role of strategic planning (SP) therein.
FP serves as a crucial indicator of an organization’s success and competitiveness. It encompasses a range of dimensions, including performance in financial terms, operational efficacy, satisfaction of customers, and market share. By leveraging big data analytics effectively, organizations can gain actionable insights, optimize their operations, identify new market opportunities, and deliver superior products and services. Understanding the relationship between big data usage and FP is essential for Indian organizations seeking to maximize the potential of their data assets.
The Indian business landscape provides a compelling context for this study. With a vibrant and rapidly evolving economy, Indian organizations are increasingly adopting big data analytics to gain a competitive edge. However, the adoption and implementation of big data analytics come with their own set of challenges, including data quality, talent acquisition, and privacy concerns. Exploring these challenges and their impact on FP is crucial for devising effective strategies and frameworks to maximize the benefits of big data analytics.
To achieve the objectives of this study, a comprehensive analysis is been conducted, drawing upon empirical data from a diverse range of Indian organizations. By examining the extent of BDU, the specific applications of big data analytics, and the resulting impact on FP, this research article aims to contribute to the existing literature on the subject. Digitalized big data form the foundation of all digital technologies (Verhoef et al., 2021), drive productivity, foster earnings growth, and increase enterprise value (Boston Consulting Group, 2021). Nevertheless, the gap between the potential of big data and organizations’ readiness to harness it may impede their ability to respond to market dynamics, thereby constraining growth opportunities and jeopardizing their competitive edge.
Scholars in information systems have emphasized the advantages of utilizing big data analytics (Wang et al., 2018) and big data to enhance operational efficiency through enterprise resource planning and customer relationship management systems (Matarazzo et al., 2021). However, its role in SP remains relatively unexplored (Dubey et al., 2019). This knowledge gap is significant and, further, given the diverse social, economic, political, technical, and cultural contexts of developing and emerging economies, firms in these regions often exhibit distinct behaviours. Therefore, examining the usage of big data within firms operating in such economies could significantly enhance current knowledge. It is important to note that findings from studies conducted in other contexts may not directly apply to firms in emerging economies like India.
Further, the insights derived from this study can offer valuable guidance to Indian organizations seeking to optimize their utilization of big data analytics and improve their FP. Additionally, the findings can inform policymakers and industry stakeholders about the importance of fostering an enabling environment for the effective utilization of big data analytics in the Indian business ecosystem. Overall, this research article seeks to bridge the gap in knowledge regarding the empirical relationship between BDU and FP in Indian organizations. By shedding light on this relationship, it aims to provide practical insights, inform decision-making, and contribute to the advancement of big data analytics in the Indian business landscape.
Literature Review
Big Data
The term “big data” describes the vast amount, diversity, speed, and validity of data that can be gathered, saved, examined, and utilized for a variety of purposes. If businesses can use big data successfully and efficiently, it can be viewed as a resource that can give them a competitive edge. Big data may assist businesses in enhancing their performance, innovation, customer satisfaction, and operational efficiency (Dubey et al., 2019). Big data, however, may not be equally advantageous to all businesses. Big data sources such as social media, sensors, and internet transactions may be more accessible to some businesses than others. Big data processing, analysis, and interpretation skills may vary among businesses. Big data utilization may be supported by organizational cultures that are stronger in some businesses than others. When it comes to big data resources and competencies, these variables may lead to heterogeneity among businesses (Chen et al., 2022; Dubey et al., 2019). Initially, the term Web 2.0 was introduced and immediately after one year Roger Mougalas from O’Reilly Media first coined the term “big data” (Diebold, 2012; Sangeetha & Sreeja, 2015). Interestingly, the term “big data” lacks a specific and fixed definition, leading scholars and researchers to describe it as a “dynamic concept” whose meaning evolves with the ever-expanding nature of this phenomenon (Gupta et al., 2018; Sheng et al., 2017). Consequently, formal definitions of big data have been elusive, resulting in conflicting interpretations (Mauro et al., 2017). Big data has ignited significant interest and curiosity across various sectors, including academia, businesses, and research communities. This enthusiasm is rooted in the anticipation of the potential value that big data technologies can offer to organizations (Akter & Wamba, 2016). Moreover, the notion of what constitutes “big” data has evolved, with the concept of scale undergoing continuous refinement. The uncertainty surrounding the quantitative aspect has contributed to considerable confusion within the field.
The term “big data” was soon reframed by researchers, and it is now defined by the five Vs: volume, velocity, variety, veracity, and value. Here “volume” is used to display the enormous data quantities, which are growing exponentially. The term “velocity” refers to how quickly data are gathered, processed, and further analysed in real time. While “variety” refers to the various sorts of data that are gathered in big data environments. Veracity serves as a representation of a data source’s dependability. Value is the last benefit of big data, and it represents the transactional, strategic, and informational advantages (Akter et al., 2016).
The challenge arises as data are gathered from various sources, arrive in different formats, and exhibit varying levels of quality, making these more challenging to comprehend and manage (Sivarajah et al., 2017). This diversity pertains to the nature of the data within the dataset, encompassing whether it is semi-structured, structured, or unstructured (Gandomi & Haider, 2015; Sivarajah et al., 2017).
Ertz et al. (2023) assumed that organizational processes might be enhanced by big data analytics to the extent that these enhancements could considerably enhance a company’s financial performance. The findings emphasized that business performance is significantly and broadly impacted by big data analytics, whereas prescriptive analysis favourably affects performance in both revenue and profit aspects, and descriptive analytics positively affect performance-related profit (i.e., share price). Additionally, compared to other industries, the manufacturing industry’s revenue performance benefits more from big data analytics. Moreover, the findings by Razaghi and Shokouhyar (2021) indicate that the management capability of big data analytics positively influences both global sourcing and performance of the firm, both directly and through its mediating role in integration. The findings of Marchena Sekli and De La Vega (2021), recognizing compatibility, establishing suitable corporate data surroundings, and securing peripheral support emerge as essential factors for embracing big data. The examination of their favourable association is undertaken in relation to processes of knowledge management and firms’ performance. For those in charge of developing the big data analytics implementation plan in higher education institutions, this research provides useful insights. This study will also view BDU from the perspective of socio-materialism because it will be constructed on a delicate concoction of technology, management, and talent (Akter, 2016; Kim & Park, 2017; McAfee & Brynjolfsson, 2012).
Firm Performance
Despite the quick development of cutting-edge technology like big data analytics and despite the advancements in AI, there remains uncertainty regarding the influence of integrating business analytics on the performance of the firm (Akter et al., 2016; Dubey et al., 2019). Kornelius et al. (2021) investigated the connections between strategic arrangements, strategic manoeuvrability, and company performance. They concluded that strategic manoeuvrability, encompassing firms’ agility, flexibility, and responsiveness, exerts a positive and significant direct and indirect influence on various dimensions of FP. These dimensions include performance in terms of finances, customers, internal processes, and learning and development. Al-Matari et al. (2014) examined the metrics associated with corporate governance and divided those metrics into indicators depending on markets and accounting. Since only measurable items can be managed, performance measurement is crucial to an organization’s efficient management and process improvement. Measuring the impact of organizational effectiveness levels on business performance is, therefore, necessary to improve organizational performance. The research by Fadhilah and Subriadi (2019) was centred on examining how infor- mation technology influences different aspects of FP. This includes financial performance, operational efficiency, and strategic effectiveness. Information technology achieves these improvements by optimizing processes and reducing costs, enabling more informed decision-making through the provision of precise and timely information to managers, and enhancing customer service and satisfaction through personalized services and improved communication channels. In this study, market and operational success are just two of the many metrics that may be used to assess a firm’s performance. Operational performance is a company’s efficiency and effectiveness in managing its internal processes and resources, whereas market performance is a company’s potential to generate returns for its shareholders by selling its goods or services in the market.
Strategic Planning
The challenges and choices confronting individuals, groups, and businesses in today’s modern society are often described as more intricate than at any previous time. These challenges encompass the everyday planning required by individuals, groups, and corporations. Navigating through the unpredictable landscape and striving for the quality of SP processes is considered a crucial element of management for every contemporary organization. The study by Hasan Rakib et al. (2022) focused on how organizational behaviours and ideas are influenced by SP’s features. It is found that in comparison to the other two, SP has a greater impact on the knowledge type of the organization. In order to develop SP within the organizations through innovation, the analysis offers a thorough grasp of organizational behaviour. Furthermore, the study offers pertinent findings that impact how management strategies and adaptive performance empower the inner atmosphere to enhance individual performance. Ben Messaoud (2022) stated that the purpose of a firm’s SP and management is to identify its enduring purposes and identify its potential. Prior to engaging in SP, which mostly involves marketing and financial issues, it is usually necessary to conduct extensive research and take other necessary measures. Jayawarna and Dissanayake (2019) found an inconsistent association between SP and performance, although the study has been done majorly on enterprises in industrialized countries. Another study introduced a model for the development of the SP process aimed at enhancing the quality of business performance in small and medium-sized firms (Valjevac et al., 2018). The model includes the vision, mission, and strategic objectives. By developing a strategic plan, which is a requirement for assessing the calibre of a company’s business performance, the conditions for setting quantifiable business objectives are created. This study’s initial part included defining the term and the strategic management approach. The process of creating a strategic plan for a chosen organization is shown in the second step. Mission statements, trend analysis, competition analysis, long-term annual goals, short-term action plans, and ongoing evaluation have all been named as important markers of SP in this study.
Dynamic Capability View
Drawing upon the theoretical foundations of dynamic capability theory, the study investigates how organizations can develop and deploy dynamic capabilities to effectively harness the potential of big data in SP processes. Dynamic capability view (DCV) theory provides a theoretical framework for understanding how organizations can adapt and innovate in response to changing environments. The theory emphasizes the importance of organizational processes and routines in building capabilities that enable firms to seize, sense, and reconfigure resources to meet evolving market demands. In the era of big data, where organizations are inundated with vast amounts of data, the application of dynamic capabilities becomes crucial in leveraging data-driven insights for SP and performance improvement.
Prior research has highlighted the role of dynamic capabilities in enabling firms to exploit emerging opportunities and navigate competitive landscapes effectively, but the majority of studies are from the perspective of Western countries (Akter & Wamba, 2016; Merendino et al., 2018). Only a few articles and papers are addressing these issues in upcoming and emerging economies. Given the diverse social, economic, political, technical, and cultural landscapes in developing and emerging economies, firms within these regions often exhibit unique behaviours. Therefore, examining the utilization of big data among firms in such economies could significantly enrich our existing knowledge base.
Scholars have emphasized the dynamic nature of capabilities, emphasizing the need for organizations to continuously evolve and adapt in response to environmental changes. In the context of big data analytics, dynamic capabilities such as sensing, seizing, and reconfiguring resources become particularly relevant, as organizations seek to extract value from data to inform strategic decision-making. DCV theory posits that firms with the ability to sense changes in the environment, seize opportunities, and reconfigure resources are better positioned to achieve sustained competitive advantage. In the context of big data, dynamic capabilities enable organizations to effectively capture, process, and analyse data to derive actionable insights for SP. By integrating big data analytics into their decision-making processes, firms can enhance their responsiveness to market dynamics and drive performance improvements.
This article underscores the theoretical support of dynamic capability theory in the context of leveraging big data for SP and performance enhancement in Indian organizations. By elucidating the mechanisms through which dynamic capabilities enable firms to harness the potential of big data analytics, the study contributes to our understanding of how organizations can adapt to the challenges and opportunities presented by the digital age. With the widespread adoption of big data and SP within the framework of the dynamic capability theory, there is now an opportunity to establish a connection between these elements and a firm’s overall performance. This research puts forward a framework that views big data usage as a dynamic capability capable of exerting a positive influence on a firm’s performance. We posit a hypothesis suggesting that firms that incorporate SP into their operations will experience improved outcomes from their big data initiatives. Furthermore, we propose that a firm’s BDU will improve SP since it will make it easier to find fresh perspectives on the firm’s position in its environment and its internal potential.
Hypothesis
Big Data Usage and FP Performance
There is already some proof from academic studies that BDU and firms’ performance are positively correlated. Gupta and George (2016) investigated the relationship between BDU and FP from a DCV and discovered a favourable relationship between the two. Based on the dynamic capabilities theory, the conceptual model developed by Côrte-Real et al. (2017) similarly shows a favourable correlation between big data and FP. Thus, the hypothesis formed as follows:
H1: BDU has a positive effect on firms’ performance.
Strategic Planning as a Mediator Between Big Data Usage and Firm Performance
Various studies have yielded divergent results concerning the connection between SP and FP. While some scholars identify a favourable correlation, others note the absence of a significant influence or even the possibility of an adverse consequence (Boyd & Reuning-Elliott, 1998). The utilization of big data is poised to affect firms by providing novel insights, necessitating the reallocation of resources for optimal advantage (Chen et al., 2014). Consequently, businesses and organizations are likely to employ SP as a means to facilitate this resource reallocation, giving rise to the following hypothesis:
H2: The positive effects of BDU and FP are significantly mediated through SP.
Conceptual Framework
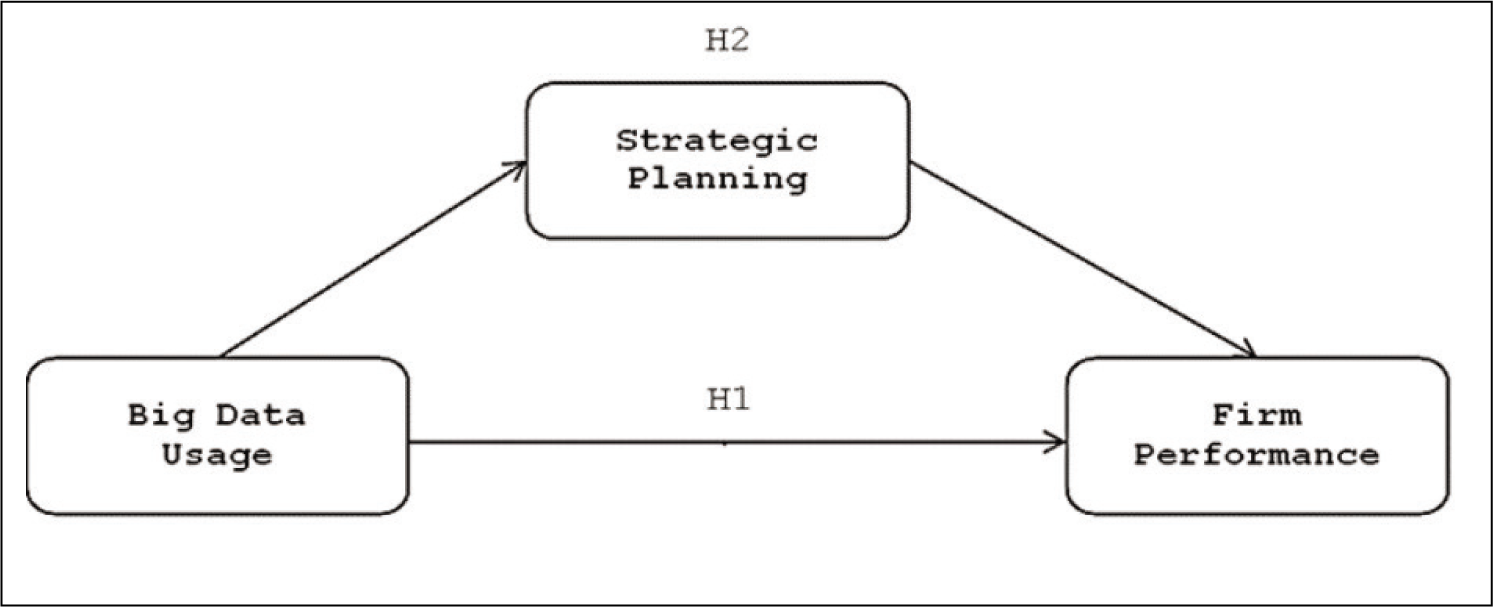
The conceptual model for this research encompasses elements of BDU, FP, and SP. Figure 1 provides a visual representation illustrating the interconnectedness of these constructs and their corresponding hypotheses, demonstrating their coherence.
Conceptual Framework.
Methodology
The research is designed with observable and measurable constructs. The necessary data for this explanatory analysis were gathered using a quantitative, cross-sectional survey approach. The period for this research is restricted, and as a result, a cross-sectional survey would be the most practical method to use. The proposed model is based on the relationship between BDU and a firm’s performance, and the role of SP. In the context of the study, we focused on the sampling frame for Indian-based firms operating in various sectors, including information technology, manufacturing, finance, telecommunications, and other industries. Measurement scales for each variable are described in further sections. Purposive sampling was used in non-probability surveys because of the short-term nature of research and the undefined population being studied.
Measurement Scale
All core constructs used in this research were measured using multi-item scales and are derived from prior vali- dated studies, increasing the reliability and validity of the measures on the phenomena of interest. The complete questionnaire is presented in the Appendix. Further, primary constructs are measured in an understandable 5-point Likert scale. The dependent variable in this research is the firm’s performance. According to the dynamic capabilities framework, an organization that has a competitive edge in resources will perform better than its competitors. To measure the same, a scale introduced by Gupta and George (2016) will be used. This scale consists of two individual constructs, namely, market performance and operational performance (Gupta & George, 2016). The independent variable in research is BDU. To measure BDU, constructs and scales proposed by Akter et al. (2016) and Wamba et al. (2017) are used. The three individual constructs are management, technology, and talent. SP is a mediating variable. The construct of SP consists of seven individual indicators of common planning activities introduced by Boyd and Reuning-Elliott (1998), Babafemi (2015), and Song et al. (2011), namely, a mission statement, trend analysis, competitor analysis, long-term plans, annual goals, short-term action plans, and ongoing evaluation. The choice of control variables in our study aims to enhance the generalizability of our findings across different groups and contexts. We adopted a scale introduced by Gupta and George (2016) to measure the following four control variables:
Years of BDU experience: This variable captures the extent of respondents’ experience in utilizing big data technologies and techniques. Respondents were asked to indicate the number of years they have been actively involved in using big data within their organizations. Industry: This variable reflects the industry or sector in which the respondent’s organization operates. Respondents were asked to specify the industry to which their organization belongs, allowing for the examination of potential differences across different sectors. Business type: This variable categorizes respondents based on the type of business or organization they belong to. Respondents were asked to indicate whether their organization is a public company, private company, nonprofit organization, or other business entity type. Firm size: These variables measure the size of the respondent’s organization in terms of factors such number of employees.
By including these control variables and measuring them using the scale developed by Gupta and George (2016), we aim to control for potential confounding factors and ensure that our findings are robust and applicable across various demographic and organizational characteristics. This approach enhances the validity and generalizability of our research outcomes.
Data Collection
The pilot test was conducted on the questionnaire by surveying 50 respondents. The main part of the questionnaire is composed of 5-point Likert-scaled items to measure BDU, FP, and SP. For data collection, respondents were contacted personally as well as through digital mode. After going through all responses received, only 562 valid responses were taken into consideration.
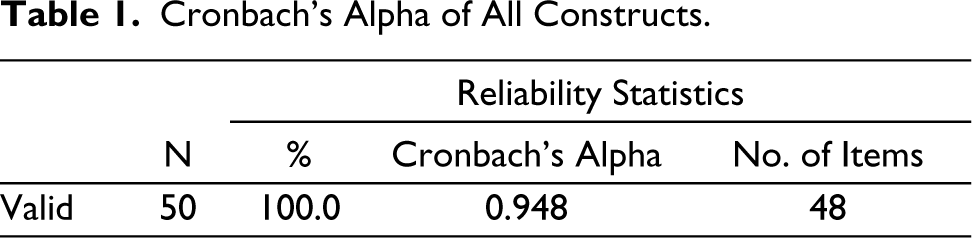
To address the potential issue of common method variance in the study, several steps were taken to ensure the reliability and validity of the data collected from a one-time survey administered to a common source. Established scales and constructs that have been previously validated in the literature were employed. Specifically, the reliability of the items and related constructs pertaining to BDU, SP, and FP were rigorously tested using Cronbach’s alpha coefficient. This analysis, conducted during the pilot study, revealed high levels of internal consistency for all constructs, as indicated by Cronbach’s alpha values ranging from 0.841 to 0.978.
The high Cronbach’s alpha values obtained for each construct suggest strong internal consistency among the items within each variable. This indicates that the items are measuring the same underlying constructs reliably and consistently. Additionally, the use of established scales and constructs with high levels of internal consistency enhances the validity of our findings by ensuring that the measured constructs accurately reflect the concepts they intend to assess. By addressing common method variance through rigorous reliability testing and utilizing validated constructs, we have bolstered the credibility and robustness of our study’s findings.
The initial dataset included responses from 595 participants. After removing all incomplete surveys, 562 surveys were left. The characteristics of the final sample are presented:
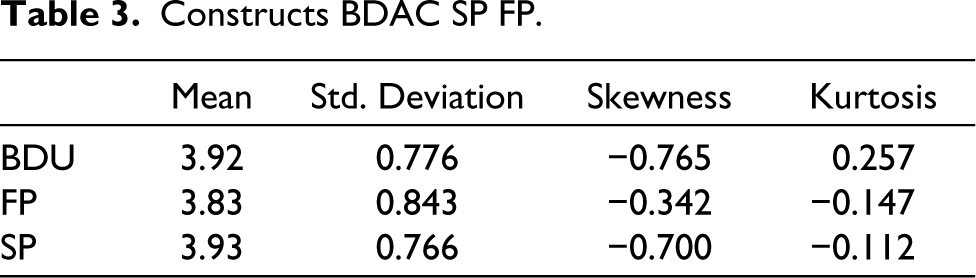
Normality checks were conducted for all measurement variables encompassing BDU, SP, and FP. Skewness and kurtosis values falling within the range of −2 to 2 are considered acceptable. The results, presented in Table 3, indicate that all variables satisfy the prescribed skewness and kurtosis criteria for a normal distribution.
Cronbach’s Alpha of All Constructs.
Sample Characteristics.
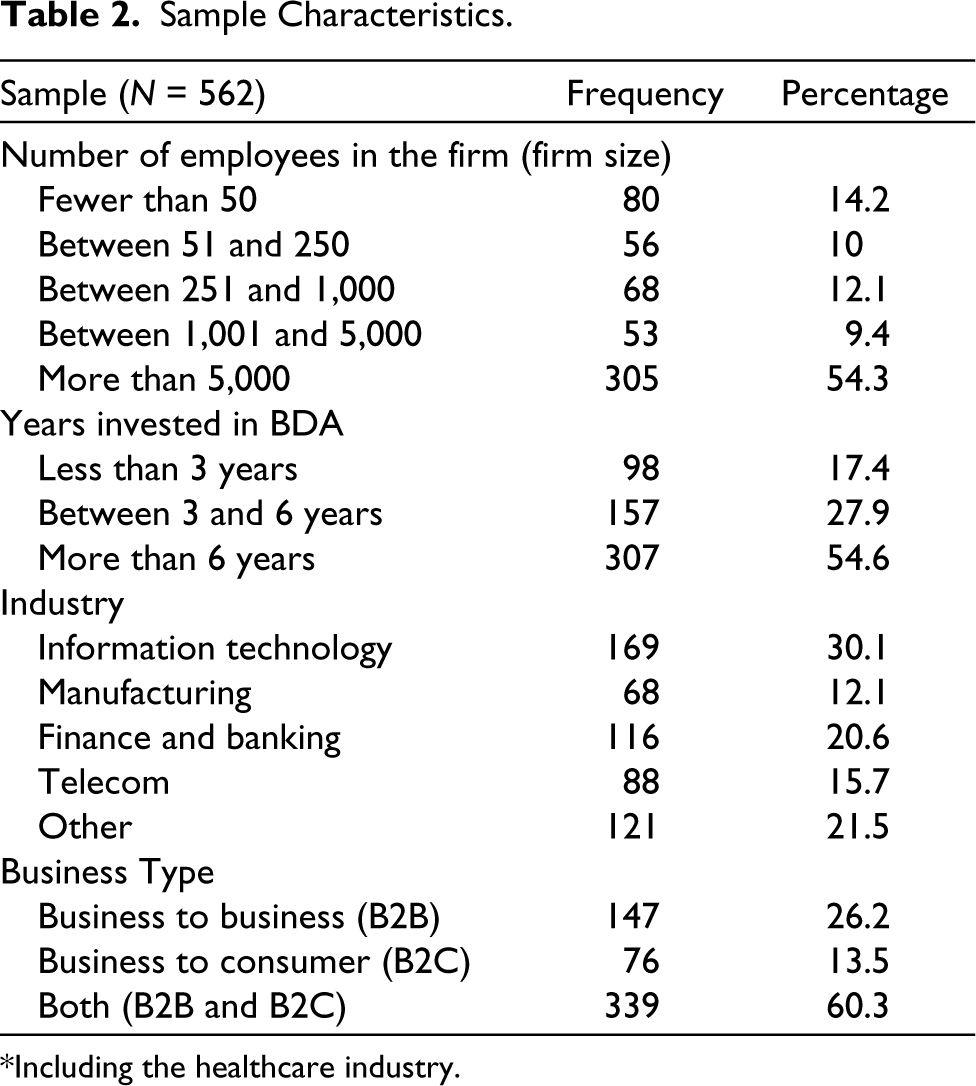
*Including the healthcare industry.
Constructs BDAC SP FP.
Following the assessment of within-subject reliability, new variables were generated based on the mean scores of the scales. When a construct includes five Likert-type measurements, the mean of the combined scores can be considered as an interval measurement scale, this characteristic makes these constructs suitable for regression analyses.
However, it is crucial to recognize that measurements related to organizational size, industry, business type, and BDU experience do not meet this criterion, as they consist of single-item constructs. Therefore, they should be treated as categorical data and require recoding into dummy variables when utilized in linear regression analyses. Before the recording of these dummy variables, a descriptive statistics analysis was conducted on the newly computed scales, specifically BDU, SP, and FPFP. The outcomes of this analysis are presented in Table 4.
Means, Standard Deviations, and Correlations.
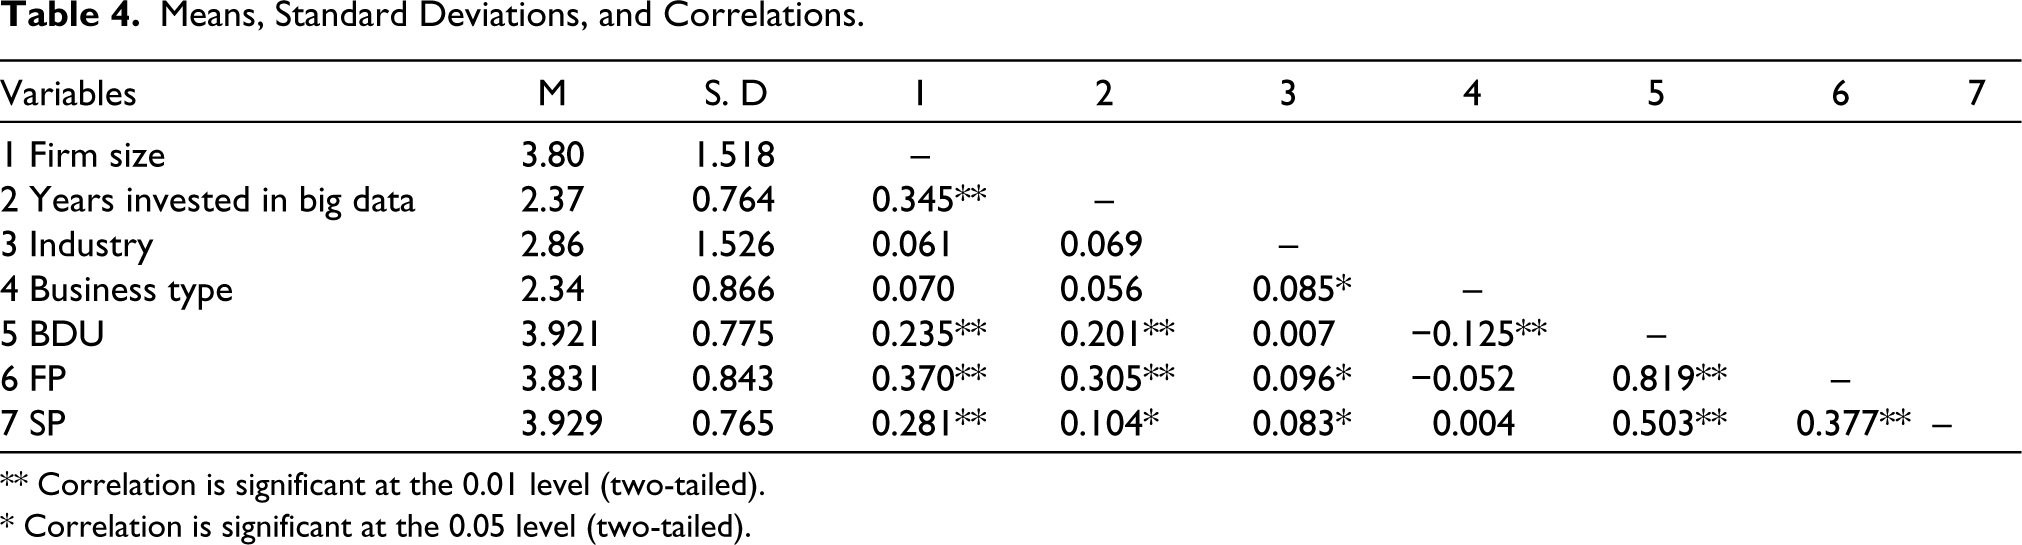
** Correlation is significant at the 0.01 level (two-tailed).
* Correlation is significant at the 0.05 level (two-tailed).
The descriptive analytics in Table 4 show that all three main variables score high on their scales: BDU (M = 3.92, SD = 0.77), SP (M = 3.93, SD = 0.76), and FP (M = 3.83, SD = 0.84). The correlations of the three main variables show that BDU and SP are significantly correlated, r = 0.503, p = .01. Also, BDU and FP are significantly correlated, r = 0.819, p = .01. Lastly, SP and FP are significantly correlated, r = 0.377, p = .01.
For control variables, firm size and years invested in big data (r = 0.345, p < .01), there is a moderately positive correlation between them. This suggests that larger firms tend to have invested more time in big data initiatives. However, for years invested in big data and business type (r = 0.085, p < .01), there is a weak positive correlation between the two, indicating that certain types of businesses tend to invest more time in big data than others. In terms of BDU and firm size (r = 0.235, p < .01), there is a moderately positive correlation between BDU and firm size, suggesting that larger firms tend to use big data more extensively.
Hypothesis Testing
Two separate linear regression analyses are conducted to test the direct effects of BDU and SP on FP. Also, for the direct effect between BDU and SP, a linear regression analysis is used.
Direct Effects of Big Data Analytics’ Capability Towards Firm Performance
H1: BDU has a positive effect on firms’ performance.
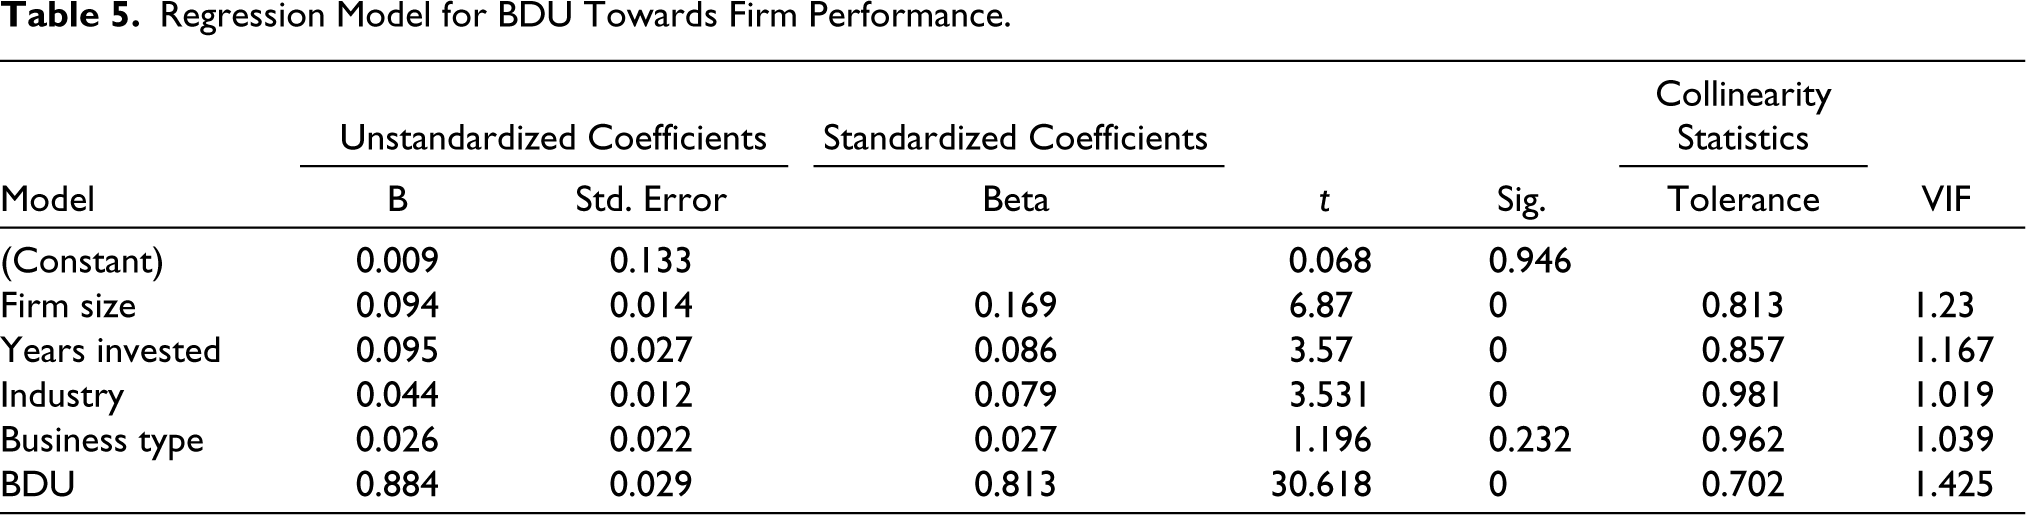
The regression model shows BDU has the highest positive standardized coefficient (β = 0.813), indicating that it has the most substantial positive effect on FP. This supports hypothesis H1, suggesting that BDU positively influences FP. Other variables, such as firm size, years invested in big data and the industry also have positive standardized coefficients, indicating positive effects on FP.
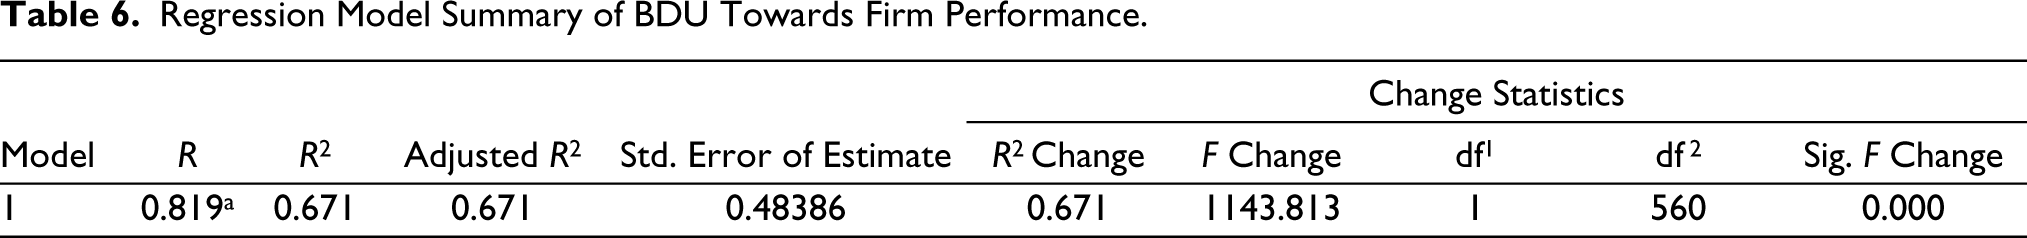
The multiple correlation coefficient (R = 0.819) relationship between the variable BDU and FP, indicates a strong positive correlation between BDU and FP. The p-value is .000, indicating that adding BDU significantly improves the model’s fit. Table 6 provides evidence that BDU has a strong and statistically significant positive effect on FP. Approximately 67.1% of the variance in FP can be explained by BDU, and this relationship is highly significant. This information supports the idea that firms benefit from leveraging BDU to enhance their performance.
Regression Model for BDU Towards Firm Performance.
Regression Model Summary of BDU Towards Firm Performance.
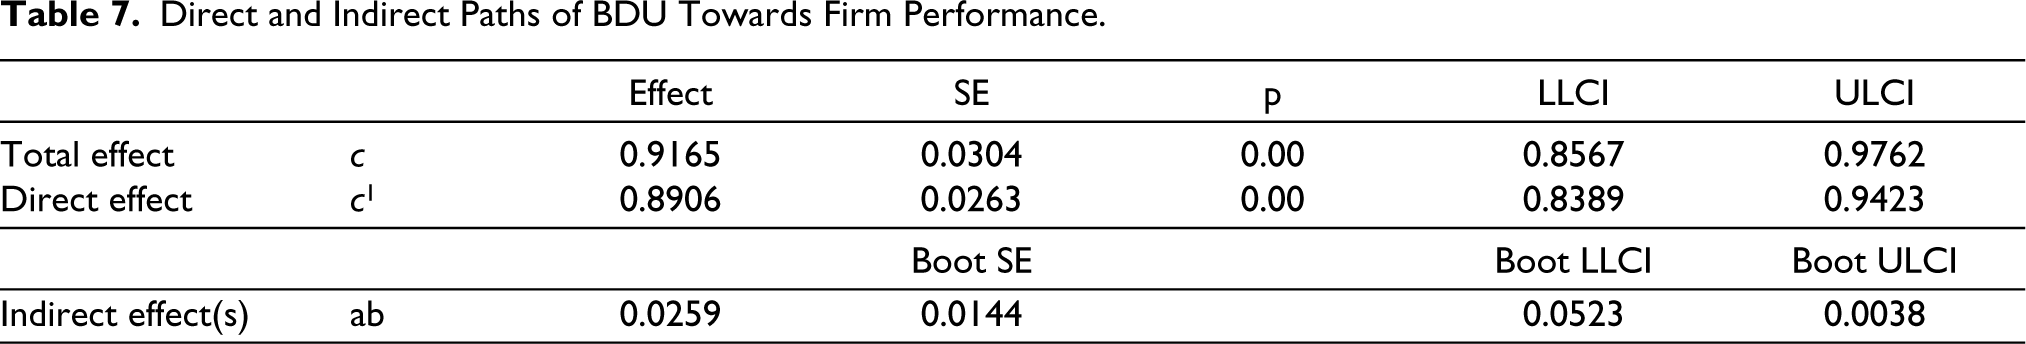
Direct and Indirect Paths of BDU Towards Firm Performance.
Both tables support hypothesis H1, indicating that BDU has a strong and statistically significant positive effect on FP. BDU is the most influential predictor in the model, and its inclusion significantly improves the model’s ability to explain variation in FP.
Mediation Test
H2: The positive effects between BDU and FP are mediated through SP.
A bootstrap analysis was performed to test the mediation effect of SP on the relationship between BDU and FP. For this bootstrap analysis, the add-in PROCESS for SPSS software is used. A bootstrap analysis is a statistical method used to estimate the sampling distribution of a statistic by resampling with replacement from the dataset. It helps in assessing the uncertainty of the mediation effect. In Table 7, the direct effect of BDU on FP is found to be significant (p < .05), with a coefficient of c 1 = 0.8906 and a standard error (SE) of 0.0263. This indicates that there is a significant positive relationship between BDU and FP even without considering the mediating role of SP. Further, the total effect of BDU on FP is also significant (p < .05), with a coefficient of c = 0.9165 and a SE of 0.0304. This indicates the overall impact of BDU on FP, including both the direct and indirect effects through SP.
The indirect effect (ab) of BDU on FP through SP is significant (p < .05), with a bootstrapped standard error (boot SE) of 0.0259 and bootstrapped confidence intervals (boot LLCI and boot ULCI) ranging from 0.0144 to 0.0523. This suggests that SP partially mediates the relationship between BDU and FP, as the indirect effect is statistically significant and the confidence intervals do not include zero. This means there is evidence that the relationship between BDU and FP is partially mediated by SP.
Overall, these findings provide support for hypothesis H2, indicating that SP plays a mediating role in the relationship between BDU and FP. The results suggest that firms can enhance their performance through effective SP processes that leverage the insights derived from big data analytics.
Conclusion
The primary objective of this research is to empirically examine the impact of BDU on FP in the Indian business landscape. Furthermore, the study was crafted to elucidate the role of SP within this identified relationship. A theoretical framework has been formulated rooted in dynamic capability theory, integrating elements such as BDU, SP, and FP. Two hypotheses were formulated and subjected to correlation and regression analyses to assess their alignment with the collected data. The outcomes of these analyses provided affirmative support for all hypotheses under consideration. These results underscore the significance of BDU as a critical dynamic capability, enabling firms to uncover new insights, reallocate resources, and adapt their strategies as necessary. Moreover, SP emerges as pivotal in orchestrating these reallocations and adjustments facilitated by BDU.
Theoretical Implications
This study has yielded several noteworthy theoretical implications that enhance the existing body of knowledge in the realm of BDU. Theoretical implications highlight the pivotal role of the DCV in shaping the strategies and outcomes of firms concerning BDU. This underscores the critical importance of adaptability, learning, agility, and long-term competitiveness. By emphasizing the significance of dynamic capabilities, the study suggests that firms can gain a competitive advantage by effectively leveraging big data. It further indicates that firms must dynamically adjust their strategies, particularly in terms of SP, to harness the potential of big data. This alignment with the DCV theory is essential in understanding the relationship between dynamic capabilities and competitive advantage, as measured by a firm’s performance.
Theoretical implications derived from the study underscore several key points regarding the significance of dynamic capabilities in the context of big data utilization. First, firms must enhance their adaptability to technological changes, ensuring they remain at the forefront of emerging opportunities within the big data landscape. Second, continuous learning and knowledge integration are vital for extracting meaningful insights from big data and fostering innovation, thereby improving performance and gaining a competitive advantage. Third, agility in SP is essential, allowing firms to respond promptly to insights derived from big data and align their strategies with dynamic market conditions. Fourth, resource flexibility and reconfiguration are critical for optimizing the utilization of big data, enabling firms to allocate resources effectively for improved performance. Finally, BDU contributes to a firm’s long-term competitive advantage, particularly in dynamic and data-intensive business environments, thus supporting sustained competitive success.
Practical Implications
This study holds significant practical implications that can inform decision-makers and managers within firms. It offers fresh perspectives on the utilization of BDU in businesses. The practical implications of this study highlight several key points for businesses aiming to leverage big data effectively. First, understanding the influence of big data on SP enables firms to optimize decision-making processes, aligning with market trends and opportunities identified through data analysis. Second, strategically leveraging big data allows firms to identify and capitalize on competitive advantages, optimizing operations and enhancing customer experiences. Third, by comprehending how big data impacts performance, organizations can allocate resources more efficiently, ensuring investments align with strategic goals. Furthermore, incorporating big data insights into decision-making processes enhances effectiveness and drives data-driven outcomes, contributing to improved organizational performance. Lastly, recognizing the impact of big data on performance, firms are encouraged to invest in developing in-house analytics capabilities or collaborating with external partners to harness the full potential of data for SP.
Footnotes
Declaration of Conflicting Interests
The authors declared no potential conflicts of interest with respect to the research, authorship and/or publication of this article.
Funding
The authors received no financial support for the research, authorship and/or publication of this article.
Questionnaire Used in the Study
How many employees does the organization count?
Fewer 50 Between 51 and 250 Between 251 and 1,000 Between 1,001 and 5,000 More than 5,000 For how many years has the organization been investing in big data analytics?
Less than 3 years Between 3 and 6 years More than 6 years The industry that the organization operates in:
Information technology Manufacturing Finance, insurance, banking Telecom Other The business type of the organization is:
Business to business (B2B) Business to consumer (B2C) Both (B2B and B2C)
Please indicate the emphasis placed on each activity within your organization: