
Abstract
The intense competition is forcing the business entities to continually change their processes, systems, technology, skills, and products. Operations management (OM) as a field is replete with lots of mathematical decision support models with sufficient data availability. Yet literature shows that OM studies till recently have neglected “human resources” who are critical to efficiency and throughput in production processes. Literature suggests that the performance of a worker changes during the execution of tasks due to the variation of numerous factors affecting human behaviour. The success of OM tools, techniques, and theories relies heavily on how well we are able to understand human behaviour. This article undertakes an experimental study of behavioural factors that affect worker’s productivity in production processes. Initially, 15 factors affecting human performance are selected. Using failure mode and effects analysis, six factors are shortlisted and later classified in two groups using the affinity diagram. Our study uses the design of experiments (DOEs) method to analyse the data collected. Finally, Taguchi’s DOE is conducted on the basis of the outcomes of the first two experiments. We then predict significant factors and their levels to achieve the desired outcome. A confirmatory test is also done to confirm the results. Understanding and modelling the behavioural factors in a complex environment can be quite a challenging task. Our work demonstrates that instead of using complicated experiments, researchers can obtain meaningful insights by adopting relatively simpler tasks with the benefit of savings of cost and time while conducting behavioural studies. The results and findings highlight significant implications for researchers, practitioners, and managers to re-design and improve workplaces besides improving processes and productivity. The significant theoretical contributions include proposing a modified learning and decision-making model for building better behavioural OM models.
Keywords
Introduction
In the pursuit of continually upgrading their processes, technology, skills, and products, the firms require prohibitively high financial investments with high risks of equally high losses in case of failures (Bendoly et al., 2006). A lot of effort has been put to improve process efficiency in manufacturing, services, and other major operations; yet, till recent times, one aspect which can have a phenomenal impact on efficiency has been clearly neglected: “human resources” (Bendoly et al., 2006). Hence, there is of late more emphasis on improving the processes by incorporating workers’ behaviour as realistically to the extent possible. Though the behavioural issues are not new, they were not considered serious enough until the late 20th century (Loch & Wu, 2005). Human beings have remained central and critical to the functioning as well as the performance of the majority of operating systems (Gino & Pisano, 2008).
According to Siebers (2007), the performance of workers changes during the execution of tasks. This variability in human factor performance can be related to variables like sleep time, age, temperature, etc. Jay et al. (2007) and Lamond and Dawson (2002) identified several impacts on the performance of the human factor due to lack of “adequate sleep” as one variable. Since there can be numerous factors that affect human behaviour, it can be appreciated how much the worker is subject to variability in performance. The understanding and modelling of the behavioural factors in an ambiguous and intricate environment are considerable challenging tasks (Son et al., 2013). To improve the reliability of any simulation model, it is very important to represent in the best possible manner, the behaviour and subsequent performance of the operator (Vilela et al., 2020). Srivastava and Chaturvedi (2014) analysed that understanding the underlying psychological reactions of the employees can affect the performance of an organization. Sharma (2020) in a book review article stated that the key relationship between brand and consumer still needs the “human touch.” So, there is a necessity of studying the human elements in the processes as well for overall betterment. In this context, the objective of this article is to investigate the impact of behavioural factors on process performance in production world settings.
Operations management (OM) is a field that is replete with mathematical models in well-understood situations with sufficient data availability. Donohue et al. (2020) stated that behavioural operations are an established research field related to understanding how the behaviour of management, staff, and customers influences the different levels of decisions and their outcomes. Behavioural issues impact as much as all decisions that we may face during our lifetime. The success of OM tools and techniques and the accuracy of its theories rely heavily on how well we are able to understand human behaviour. In practice, affordable experiments are the most affordable approaches to study behaviour. The behavioural operations which investigate people’s issues in OM gain more relevance under the circumstances. A behavioural approach to OM can lead to a better understanding of underlying drivers of operating system performance and the causes thereof and also the appropriate managerial interventions. One such very common example of an operational phenomenon is the bullwhip effect observed in supply chains which was better explained through this approach (Gino & Pisano, 2008). According to Joo et al. (2013), it is a very challenging task to understand and model the factors of people’s behaviour in an uncertain and complex environment.
Since the behavioural OM (BOM) as a field of research started in the 2000s, the authors intuitively believe that the whole OM researcher community may have missed the bus in realizing the importance of people’s behaviour in the OM. Literature suggests that till the previous century, men were heavily involved in production and operations in large numbers where algorithms and automation were not predominant. We can find a lot of research taking place in analysing customer behaviour in a variety of fields. One such work by Saji and Paul (2018) investigated the factors influencing the adoption behaviour of mobile technology in banking. But in the present context, it becomes more important to analyse the behavioural aspects of people involved in manufacturing and services operations. To be a frontrunner and beat the business competition, organizations must adapt simple solutions to analyse complex interactions arising from multiple factors. This article undertakes an experimental study of behavioural factors that affect productivity at the workplace. To implement the objective of this article, a simple manual task is performed by participants (workers) in an assembly line environment simulating production settings. This experimental study derives its foundation from the pillars of BOM, and the data so generated are analysed using the DOEs method. The results and findings of this experiment give useful insights for the practitioners and managers as to how the workplace can not only be designed but also improved to make potential gains besides improving productivity.
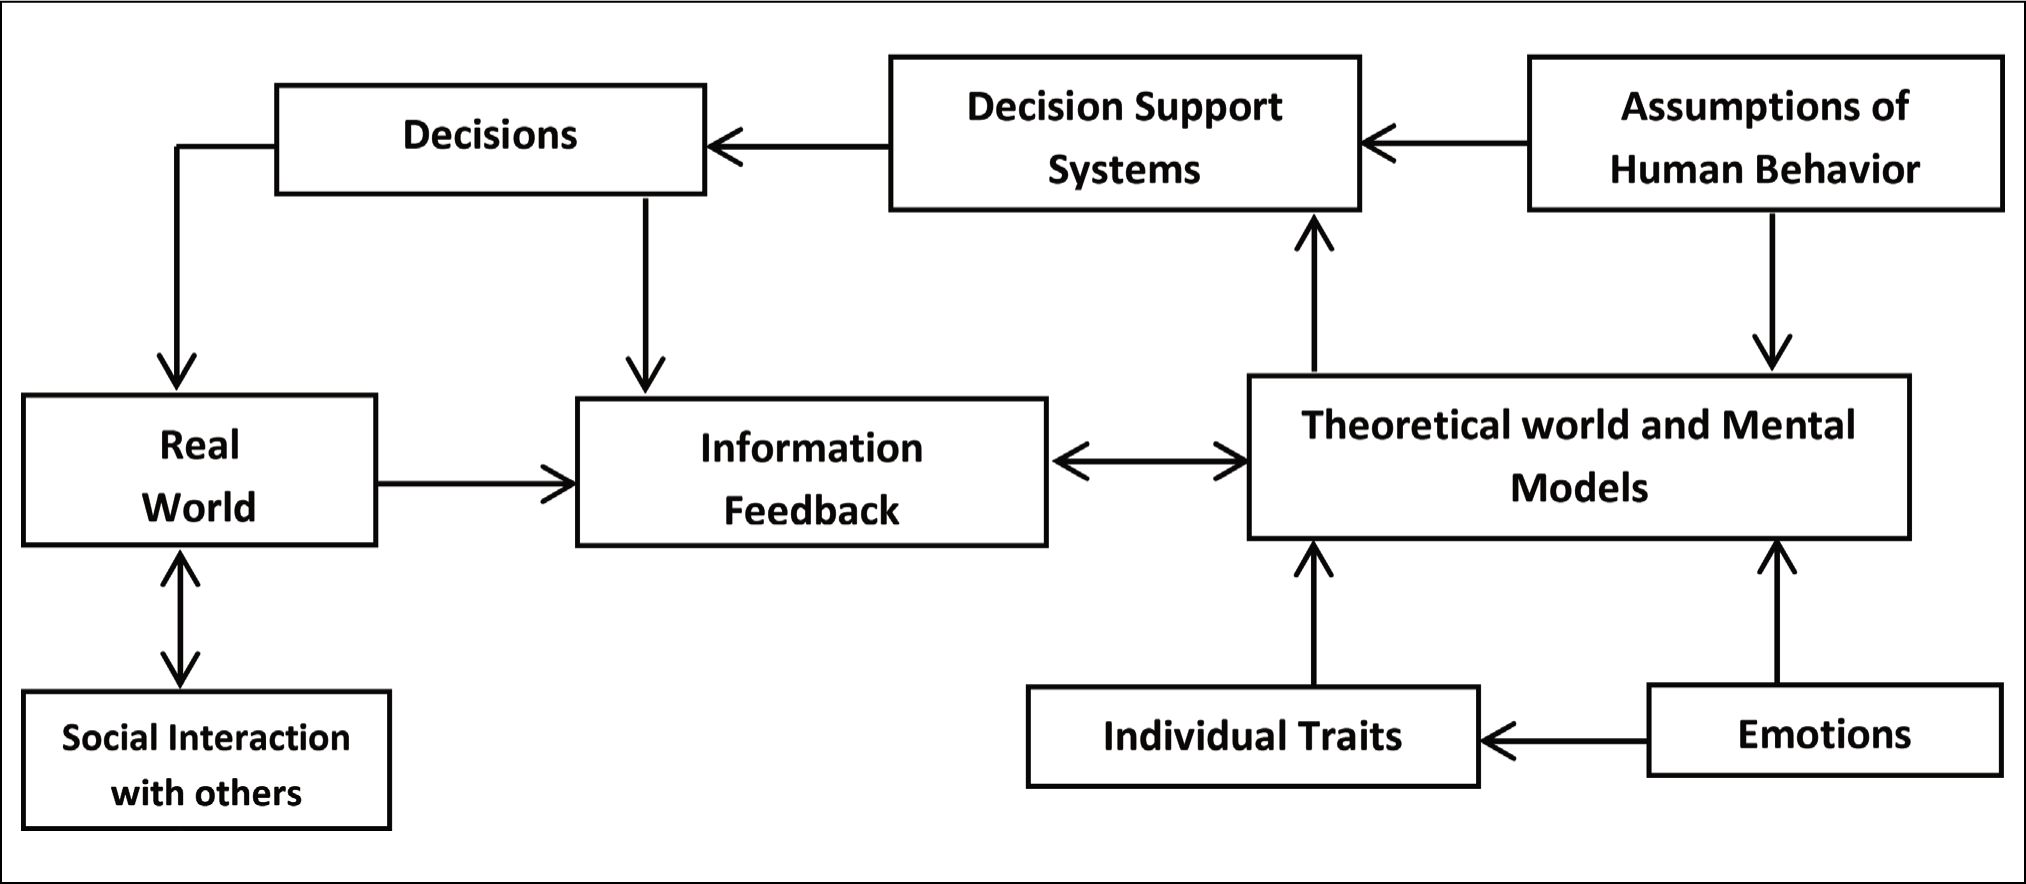
Literature Review
In the past many definitions have been given, Gino and Pisano (2008) defined behavioural OM as “the study of attributes of human behaviour that impact the design, management and improvement of operating systems, and of the interaction between such attributes and operating systems and process” (Donohue et al., 2020). Further, it mentioned the four key goals of behavioural operations research (a) to describe and predict more accurately how people make operational decisions, (b) to utilize the resulting knowledge of behaviour, (c) to improve the operating systems design and decision-making, and (d) through the iterative pursuit of these goals. Sterman (1994) described an advanced decision-making model depicting the various components of the decision-making process which links the real world with the mental (theoretical) models. This shows how the emotions (frustration, helplessness, panic, etc.) and individual traits (like personality, age, experience, etc.) also impact the mental models that are converted to decisions which ultimately impact real-world problems. Social interactions with others like trust, information exchange, communication and coordination, etc. keep happening in real-world scenarios. Hence, there is a need to take feedback from the real world and modify the models, assumptions, and mental models which ultimately leads to a change in decision-making. Bendoly et al. (2006) identified comprehensive assumptions related to behavioural issues in the OM context and listed them according to tasks like product development, inventory management, quality management, sourcing, supply chain management, etc. The assumptions should necessarily be taken into account when attempting to study the behavioural OM models in order to achieve improved performance and better designs of the operating systems. We have proposed a modified model by including the “assumptions pertaining to human behaviour” in the earlier model (Sterman, 1994).
Behavioural studies can help to strengthen the information feedback and improve the frameworks or conceptual models and various other uses in the world of not only operations but other allied fields wherever human behaviour finds any footprints. Figure 1 explains the modified learning and decision-making model. This literature review is classified under three sections, the review on the role of laboratory experiments in behavioural science, the role of processes in behavioural analysis and the DOEs.
Role of Behavioural Lab Experiments
Behavioural experiments as research methodology have been used quite well for studying people’s issues in disciplines like economics, psychology, sociology, and medical research (Bendoly et al., 2006). Barbosa et al. (2022) mentioned that studying behaviour is also one of the most affordable experimental approaches. However, the number of trials per subject and the number of subjects impact the length and cost of the experiment, as well as its statistical power. A typical human behavioural experiment should require a relatively inexpensive set-up and a working hypothesis. Behavioural experiments on workers are usually quicker and cheaper (Katok, 2011). A case study by Ravichandran (2005) highlighted the importance of formal methods and modelling techniques for achieving efficiency improvement in the context of a process industry.
The advantages of experiments include the following: (a) they can be conveniently conducted in the laboratory or in the field as well, (b) permit the researcher to clearly distinguish among possible explanations making them more meaningful without making them more rigorous, and (c) complement other methods by bridging the gap between analytical models and real-world problems, thereby give researchers a greater deal of control which help build better OM models (Katok, 2011). One research gap as observed by Donohue et al. (2020) is regarding the absence of a unifying theory to describe why people behave differently from what the normative theory predicts. It is certain that people are most likely to be irrational when it comes to planning under demand uncertainty. Further, it emphasized the need of more research in this direction in order to understand whether, when, and how humans’ decisions and automation will co-exist to provide breakthrough operational results. One of the questions that are often asked about laboratory experiments is about whether their results can be carried over into the real world. The answer would depend on the set of assumptions made in the experiment that is how realistic they were in terms of the real-world settings.
Process Performance
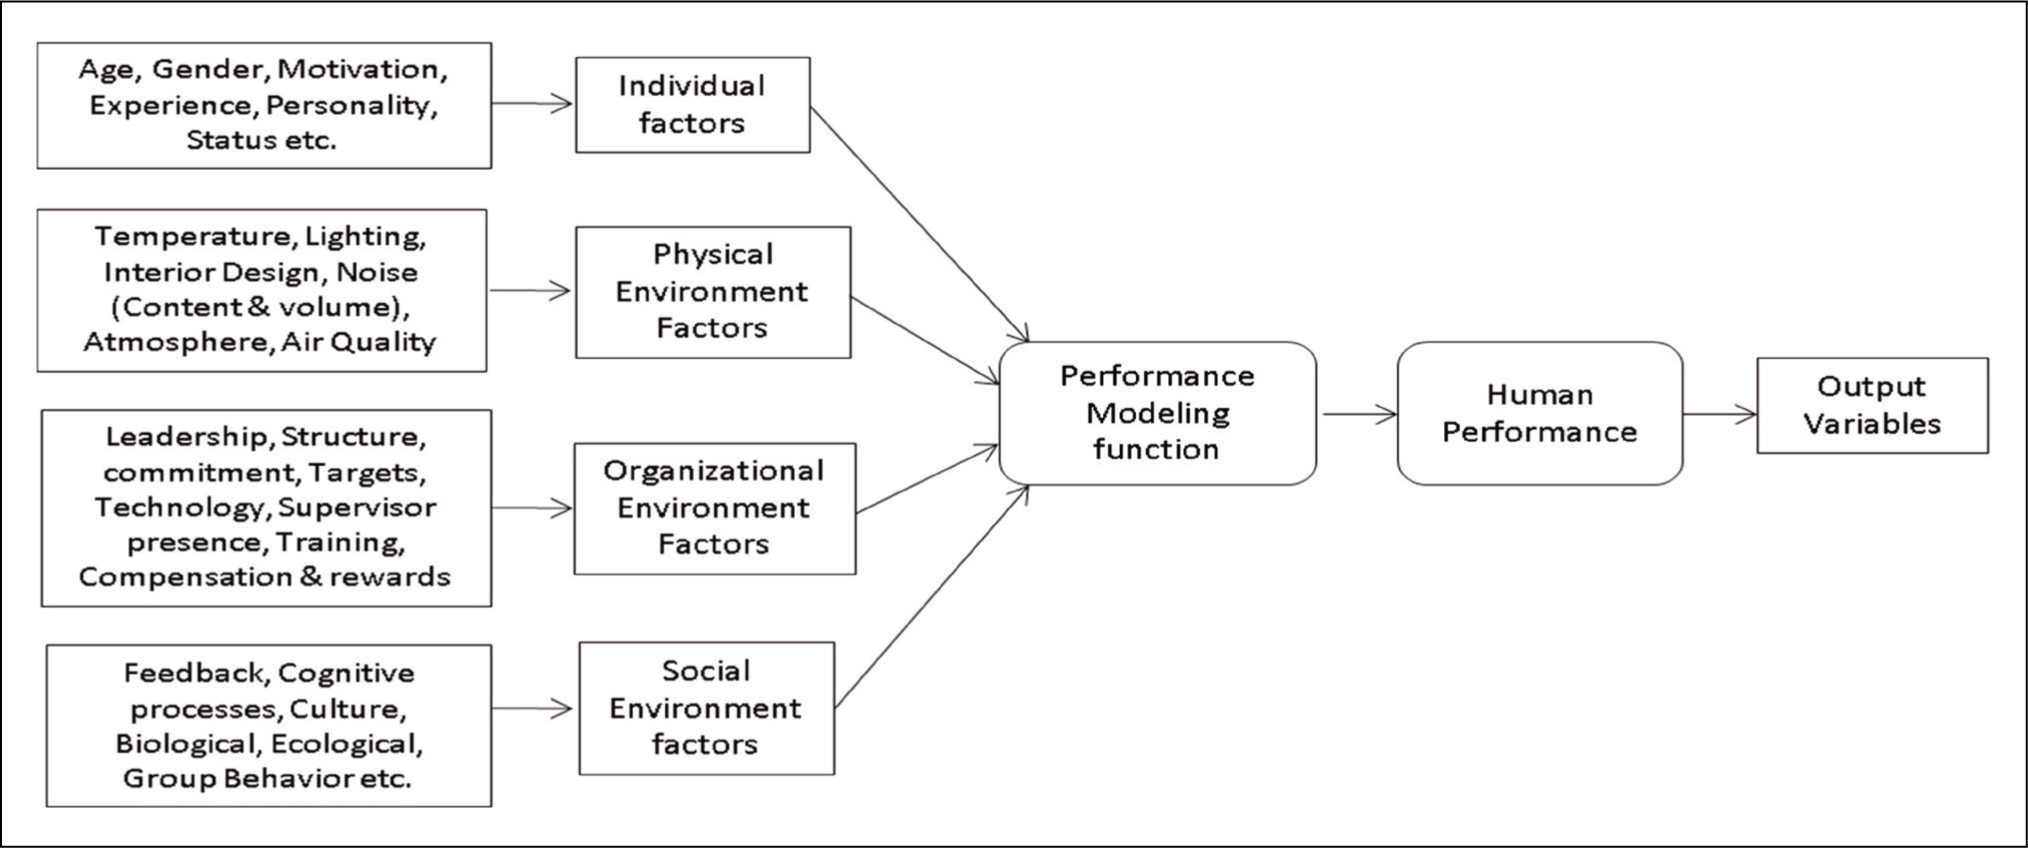
For the sake of simplicity in this behavioural experimental study, we focus only on the process performance. Every process whether in services or production will inevitably experience variations resulting from different factors responsible during the process. According to the framework suggested by Baines et al. (2005), variations could come from different individual characteristics of the workers, physical environment factors, and organizational factors. The individual factors include factors like age, experience, personality, motivation, job satisfaction, commitment, etc. of the workers. The physical environment factors include material, noise, temperature, pressure, ventilation, lighting, etc. The organization factors include factors like maintenance, job patterns, shifts, diversity, climate and structure, etc. Human labour plays a central role in modern manufacturing systems (Digiesi et al., 2009). Their study also identified that apart from the above-discussed three factors, human behaviour can also be impacted by social factors (human relationships and communication, etc.) and the nature of the task. Vilela et al. (2020) in a study of productivity of a manual assembly line in the production of boards concluded that work shift has a significant impact on human performance.
On the contrary, some studies have shown that variation in fact may be good also in the overall run. Identifying the factors responsible for such variations is the main concern for the managers, so that variation can be controlled. However, controlling such variations is not only time-consuming but also very expensive. Thus, the aim is to identify the sources of such variations and control them within their lower and upper limits with the help of statistical process controls. This will help in reducing the sensitivity of the process and improving output quality (Kackar & Shoemaker, 1986). This requires three types of information: (a) measurable functional characteristics of the outcome product/service, (b) factors responsible for variation which can be controlled in their standard settings, and (c) uncontrollable external environmental sources. Thus, the objective in an experiment is to identify control factor settings that minimize the noise factor effect on the functional characteristics of the final output (Antony & Roy, 1999).
These ultimate end results of such variations are mainly rejections or failures, thereby impacting the quality of product and service. Growing competition and the increasing need for adaptability often require organizations to switch and transform themselves according to the demands of circumstances. In the process of reformation, employee performance gets affected by many aspects (Bhatia & Arora, 2021). In the service sector, the quality of people working at the operational level plays a crucial role in delivering a satisfactory customer experience. The service organization stands to be greatly benefited by measuring the people’s quality periodically (Gupta et al., 2023). Process quality management is one of the most vital areas of the operations manager who plans and monitors the quality in every process and stage of production of each component to achieve the intended quality to satisfy the customer (Choudhury, 2016). Our work derives the theoretical guidance from the existing literature of BOM which is considered to be slightly more than two decades old. So, from the above discussion, it is clear that laboratory experiments have great potential and can help in BOM studies especially in BOM studies to improve the efficiency and quality of processes.
About Design of Experiments
DOE is a statistical toolkit, a set of guidelines that offers several statistical tests for variations in input variables on a process and assessing the quantum of their impact on the desired outputs (Montgomery, 2017). It is a cost-effective and time-saving quality improvement technique to manage and optimize the modelling of various factors and response variables simultaneously and thereby achieve improvements in product quality and process efficiency (Hecht et al., 2016). DOE was developed by Sir R. Fisher in the early 1920s as an effective process improvement tool and remains relevant today also to determine the root causes of complex real-world problems in terms of variability (Montgomery, 2017). Also using DOE makes it easier to conduct the experiment with data generated by researchers within budget constraints. DOE is commonly used in different industries for finding optimal solutions to processes. Further DOE is also being used to test and build mental models related to improving the performance of systems. Various DOE models proved successful in identifying a complicated relationship between experimental factors and the desired output. The skill of designing good experiments lies in creating simple environments which can capture the core of real-world problems while filtering out the irrelevant details. The stepping stone in doing experimental work is to start with an interesting theory which has empirical implications that are worth testing. Ideally, it should be able to explain a phenomenon that is real and interesting so that learning about it contributes to knowledge (Katok, 2011).
The first step in DOE is to set the objectives of an experiment and identify the factors for the study. Next is making the choice of experimental design in order to consider all possible interactions and combinations of factors (n) and their levels (k). The fractional factorial designs use only a part (fraction) of the full factorial kn runs. These designs are constructed under a set of assumptions which may vary contextually. Though the researchers can use the desired levels of factors, two-level factorial designs are widely used for the construction of linear regression models. The advantage of a full factorial design is that it provides the cleanest evidence for the effect of each variable, as well as all possible interaction effects. But the disadvantage is that with experiments having a large number of factors, a full factorial design becomes very expensive and time-intensive. So the best way out is to use fractional factorial design instead of full factorial design.
The following broad steps are needed to implement the DOE:
Set the objectives of the experiment in terms of a working hypothesis with a valid RQ. Identify the response factors (performance metrics) for the study. Create design space in terms of the number of factors that are considered important and the levels of factors to ensure all possible interactions. Conduct the experiments and collect the desired data related to the final product/service. Run the main experiments and analyse results for full factorial design for the chosen factors. Use a model for the prediction of results under a given set of values of factors and levels to validate the model.
DOE can show how to carry out the fewest number of experiments while maintaining the most significant information. The most important step in DOE is to determine the significant factors for which a limited number of experiments can be conducted. The improved DOE proposed by Taguchi simplified and standardized the factorial designs with a lesser number of factors which when used to conduct experiments could produce more consistent results. Antony et al. (2021) stated that DoE is central to not only understand the anatomy of a process but also provides a means to achieve significant improvements in product quality and process efficiency. Kim et al. (2008) applied DOE to study the impact of operator factors in micro-drilling operations and concluded that “feed rate” is the most important factor to minimize the thrust. Alessio et al. (2023) applied DOE to hot forging simulations to increase die life expectancy with production managers and designers as possible stakeholders. We assume that the task so selected to conduct the behavioural experiment is a part of the operation in a manufacturing process. The basis of our assumption is supported by the fact that the involvement of humans in this task is 100%, that is, there is no involvement of tools or machines, etc. The task is accomplished in experiments under a set of stimuli which are individual, physical, social, or organizational, and there is no scope of any aid from the machines in any sense. So, from the above discussion done as part of the literature review and the theoretical evidence in support thereof, it is clear that DOE can be a very useful technique to conduct BOM studies.
Research Questions
The following research questions (RQs) partly motivate this study being related to the importance of experiments and especially DOE in the context of studies pertaining to behavioural operations.
RQ1: Do lab experiments help in behavioural operation management studies?
RQ2: Do the design of the experiments method complement the behavioural operations studies?
The next section is about the identification and selection of factors under study. This is followed by a discussion on the data collection and conducting two rounds of experiments with partial factorial design which are followed by the final trial with Taguchi’s DOE. The next section contains a discussion on the results and findings of the different experiments, followed by theoretical contributions and managerial implications. The article concludes by summarizing the work in conclusions, limitations, and scope for future research.
Discussion on the Experiment
In this section, we discuss the experiment conducted to study the role of behavioural factors on process performance in production world settings.
Participants for the Experiments
Three participants who possess rich managerial experience (>15 years) in academics and industry including diversified work experience in government and other sectors, respectively, were considered for this study.
Procedure of the Experiment
The task is straightening the article clips (henceforth called product(s)) in a time duration of 3 min (180 s) during each trial. The number of products after straightening falling short of the cut-off length will be the defects, which includes any products which the participant failed to attempt. All the participants were given products of the same make and specifications and were briefed about the experiment and procedure in detail. Briefing also included the set of precautions that were to be adhered to rule out any inadvertent sources of bias, errors, variability or lack of standardization, etc.
Identification and Selection of Factors for Study
It was decided to consider the behavioural factors impacting human performance at the workplace in the production processes. Often, running experiments requires researchers to carefully control and measure variables of interest in experiment. Figure 2 depicts the modified human performance framework which has been adapted from integrating the earlier frameworks suggested by Baines et al. (2005) and Digiesi et al. (2009), respectively. This framework provides the concepts, ideas, and identifies relationships of factors which constitute the flow from input parameters to output variables. The output variable can be the desired variable of interest for the researchers in their experimental study which they want to control by varying the input parameters. Here in our study, the output variable refers to the “number of defective products” produced by the participants (workers) during the process. On the basis of the modified framework, FMEA (failure mode and effects analysis) was carried out by a cross-functional team of the three participants owing to their rich managerial work experience and diversified backgrounds. During the process, potential factors were identified from all four categories mentioned in the framework. We propose to study the impact of all four categories of factors, that is, individual, physical, social, and organizational characteristics that can be varied in this experimental study. These factors could impact the behaviour at the workplace, especially in service settings in accordance with the importance of each factor.
On the basis of the literature review and also as per the suggestions coming from the three participants, the following 15 behavioural factors were selected that impact people’s behaviour especially in manufacturing processes:
Sound-volume in the background: The range of decibel level for any particular sound present in the workplace that may cause a disturbance. Sound-content in the background: Different types of sound present in the workplace played at the same volume can have different impacts on workers. Movie played on a screen: Presence of graphical content which is not intended for the participant, but is present in the visual area of the participant which can impact behaviour. Atmosphere: The overall general environment of the workplace can have an impact on general conduct of the worker. Uniform of people: The uniform of the workers at the workplace can have an impact on conduct and other individual factors that impact productivity. Rest: The quantum of rest as well as timing of the rest day given to workers before performing a given task. Temperature of room: The range of hotness or coldness of the workplace environment while performing a given task. Target: A pre-decided condition related to output expected from a worker in a given time frame can have different impacts on different workers. Age of worker: The age of the workers is a physical attribute that can impact productivity and efficiency while performing tasks. Supervisor presence: The physical presence of the supervisor around the worker can impact the behaviour. In the service industry, customer presence is more critical. Lighting: It is a physical factor with different levels of luminous intensity under which the task is performed. Interior design: The aesthetics of the room where the task is performed have the potential to impact worker’s behaviour. Motivation: A positive stimulus given to workers to perform the experiment is an individual factor that can affect the behaviour of workers. Compensation and rewards for good performance: The material benefit given to the worker in lieu of his good performance can also have a behavioural impact on the worker. Punishment for falling behind the target: The penalty awarded to the worker for not meeting the Target criteria of the task can also impact the behaviour.
Each of the factors as discussed above can have multiple levels (attributes) which can be either discrete or continuous. The DoE analysis can be used to understand how output variables are influenced by input variables and how the latter interact to impact the desired output variable in a process. Even if we consider two levels for each of the selected factors (e.g., for factor “Target,” we selected low-level as “easy” and high-level as “stringent”), the total number of experiments required 2 15 = 32,768 (multiplied by replications) which is practically infeasible. So, it was decided to shortlist a few factors in order to reduce the number of experiments.
Selection Factors of DOE
For DOE to be successful, careful selection of key performance-independent variables along with their levels and managing and controlling the noise variables are critical. The participants were asked to give their ratings (on a scale of 0–10). This was used for severity and occurrence analysis (i.e., SxO analysis) by giving risk priority numbers to each factor, so as to prioritize the top six factors having the highest cumulative scores. The detection number was not considered for this analysis, as it can be easily seen that this value will remain constant for all the factors (criteria) considered. A number of social, organizational, and physical environment variables as discussed in earlier sections were analysed using the FMEA scales to consider the relative importance of their impact, causes, and effects as per the participants’ understanding. Six factors shortlisted were (a) sound (content) in the background, (b) lighting, (c) temperature of the room, (d) rest, (v) target, and (e) supervisor’s presence. Two discrete levels for each factor were also identified.
With six process variables (factors) present, the required number of experiments to be performed by a participant is 2 6 = 64 (multiplied by replicates). So, these six factors were to be divided further in two groups of three factors each using affinity diagram analysis, such that we have to conduct two experiments with each group. With each group consisting of three factors with two levels each, the required number of experiments to be performed becomes 2 3 = 8 for a group. The participants also agreed to do a brainstorming session as a precursor to creating an affinity diagram to categorize the top six factors in two groups. The three factors in each group will be used to conduct the first and second experiments using DOE.
Discussion on the Experiments and Their Results and Findings
As explained earlier, in case we had used all six factors together then the total number of experiments required would be 2 6 = 64 (multiplied by replicates) which would be a time-consuming task. So, we were able to reduce the total experiments from 64 to just 24 experiments in three separate experiments with just eight experiments in each trial (experiment). The input factors for the third trial with Taguchi’s DOE will be decided based on the results of the first two experiments. The three experiments are discussed in detail in the following sections.
The First Experiment
The first group of three factors includes background sound, lighting, and temperature as the process variables with their levels. All three factors had two levels: low and high.
For the low level of “sound content (background)” a YouTube video of “Raga Brindabani Sarang of Pandit Hariprasad Chaurasia” was played which was “instrumental” having a pacifying impact on worker’s behaviour. For the high level of background sound, a YouTube video titled “Far too loud-Drop the bomb 1 hour” was played which was “Disco” being extremely opposite to the other.
For low level of “lighting,” the experiment was conducted using a 0.5-W small LED bulb similar to a 0-W bulb or night bulb and was termed as “dim” lighting. For high levels of lighting, the experiment was done in the presence of a 10-W LED Bulb and was called “bright” lighting.
For the high level of “temperature” variable, the experiment was conducted in the presence of a room heater (With Heater) when the temperature was 10°C, while no external aid was used for low level of temperature variable.
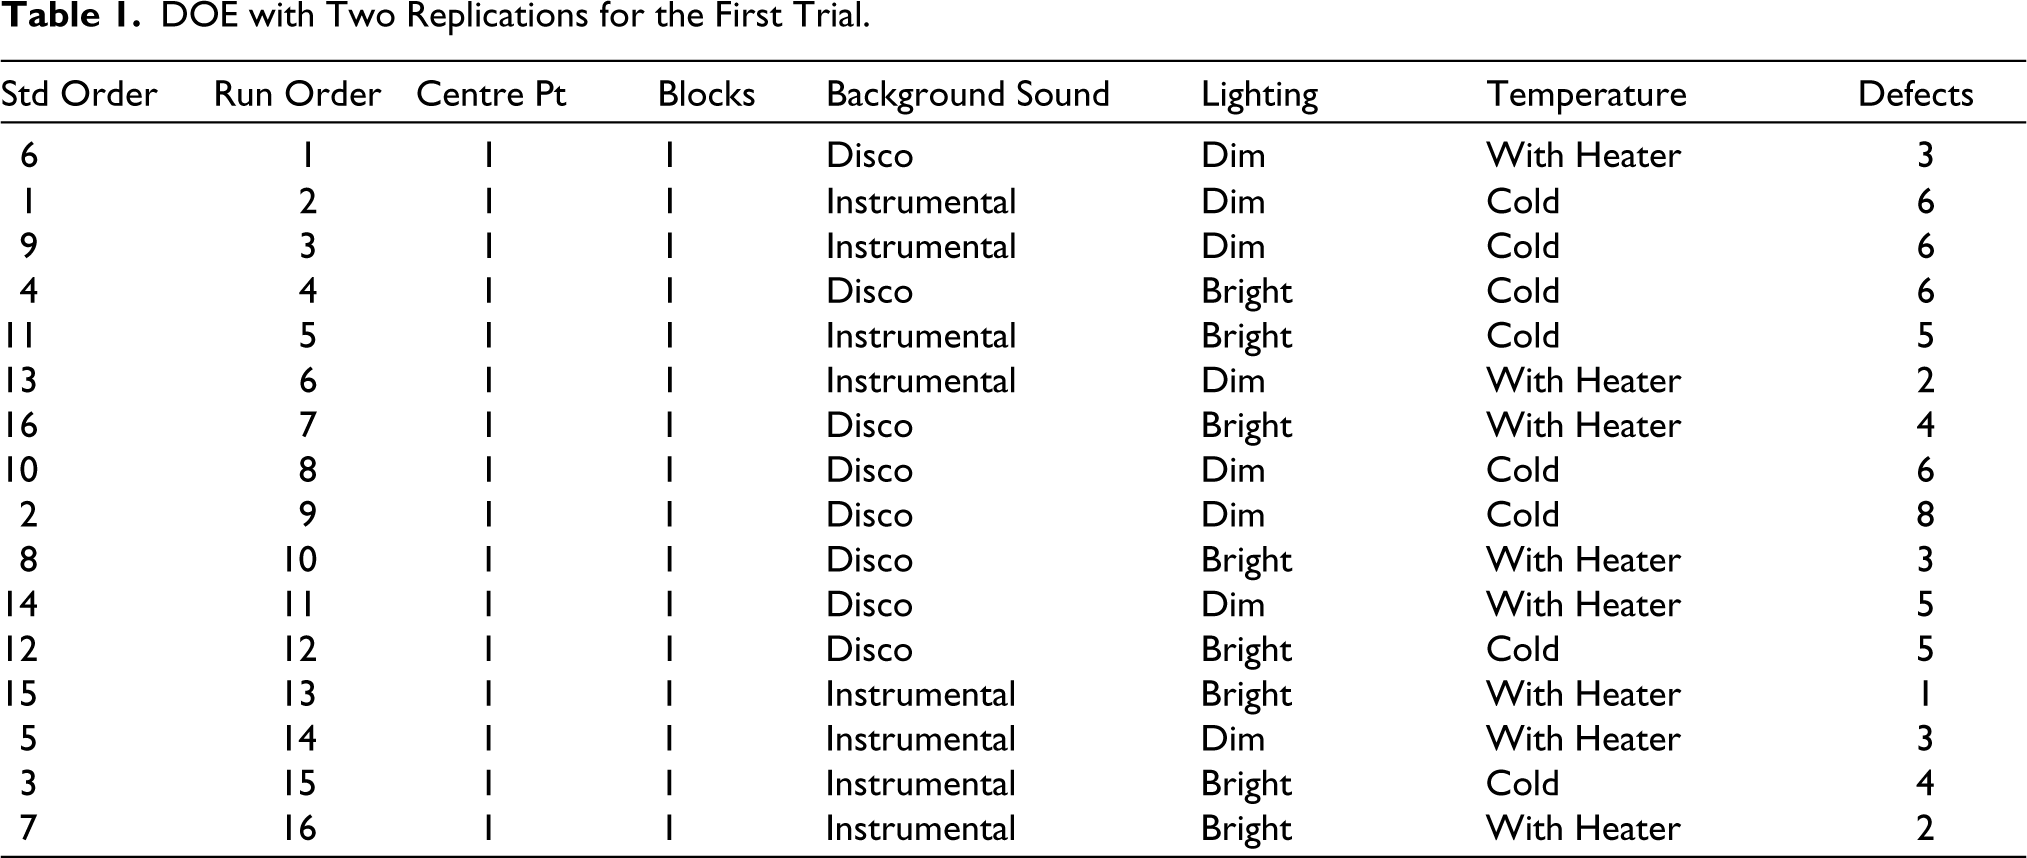
The experiment was conducted using DOE in MINITAB 17 Software. The design for the experiment was created using the earlier mentioned three factors along with their high and low levels by using a full factorial design. The experiments were conducted by two participants under the controlled laboratory settings as per the combination of factors along with their corresponding levels. The desired outcome of the experiments was the number of defects, that is, the number of products found short of pre-decided length products and also those products which were un-attempted during each trial. The results of the number of “defects” in each trial were entered in the columns corresponding to their combination set of process variables and their levels. The factorial design was then constructed using two replications as depicted in Table 1. This design would effectively result in a set of random 16 runs at a stretch in the experiment.
DOE with Two Replications for the First Trial.
The “defects” were then analysed with the help of DoE at 95% significance level. The Pareto chart in Figure 3 for the first group experiments reflects that all three individual factors affect the “defects” in a significant manner, that is, the main order effects are more significant as their values are higher than the critical value of 2.306. The “temperature” factor has the highest effect on the desired output (i.e., minimum defects) followed by “background sound (content).” The third factor “lighting” is also found to be significant though its impact is the least among all three factors. The result also reveals that none of the interaction effects whether it is second-order (B*C, A*C, A*B) or third-order interactions (A*B*C) between the factors are found to be significant. The p value for temperature, background sound, and lighting are .000, .016, and .037, respectively; thus, corroborating the significance of the individual factors as shown in the Pareto chart. It is found that p values of the second-order (B*C, A*C, A*B) and third-order interaction (A*B*C) are higher than the significance level of 0.05, indicating that these interactions are not significant. The model shows an R2 value of 87.84% which can be considered to be quite a good result.
Pareto Chart Results for First DOE Experiments.
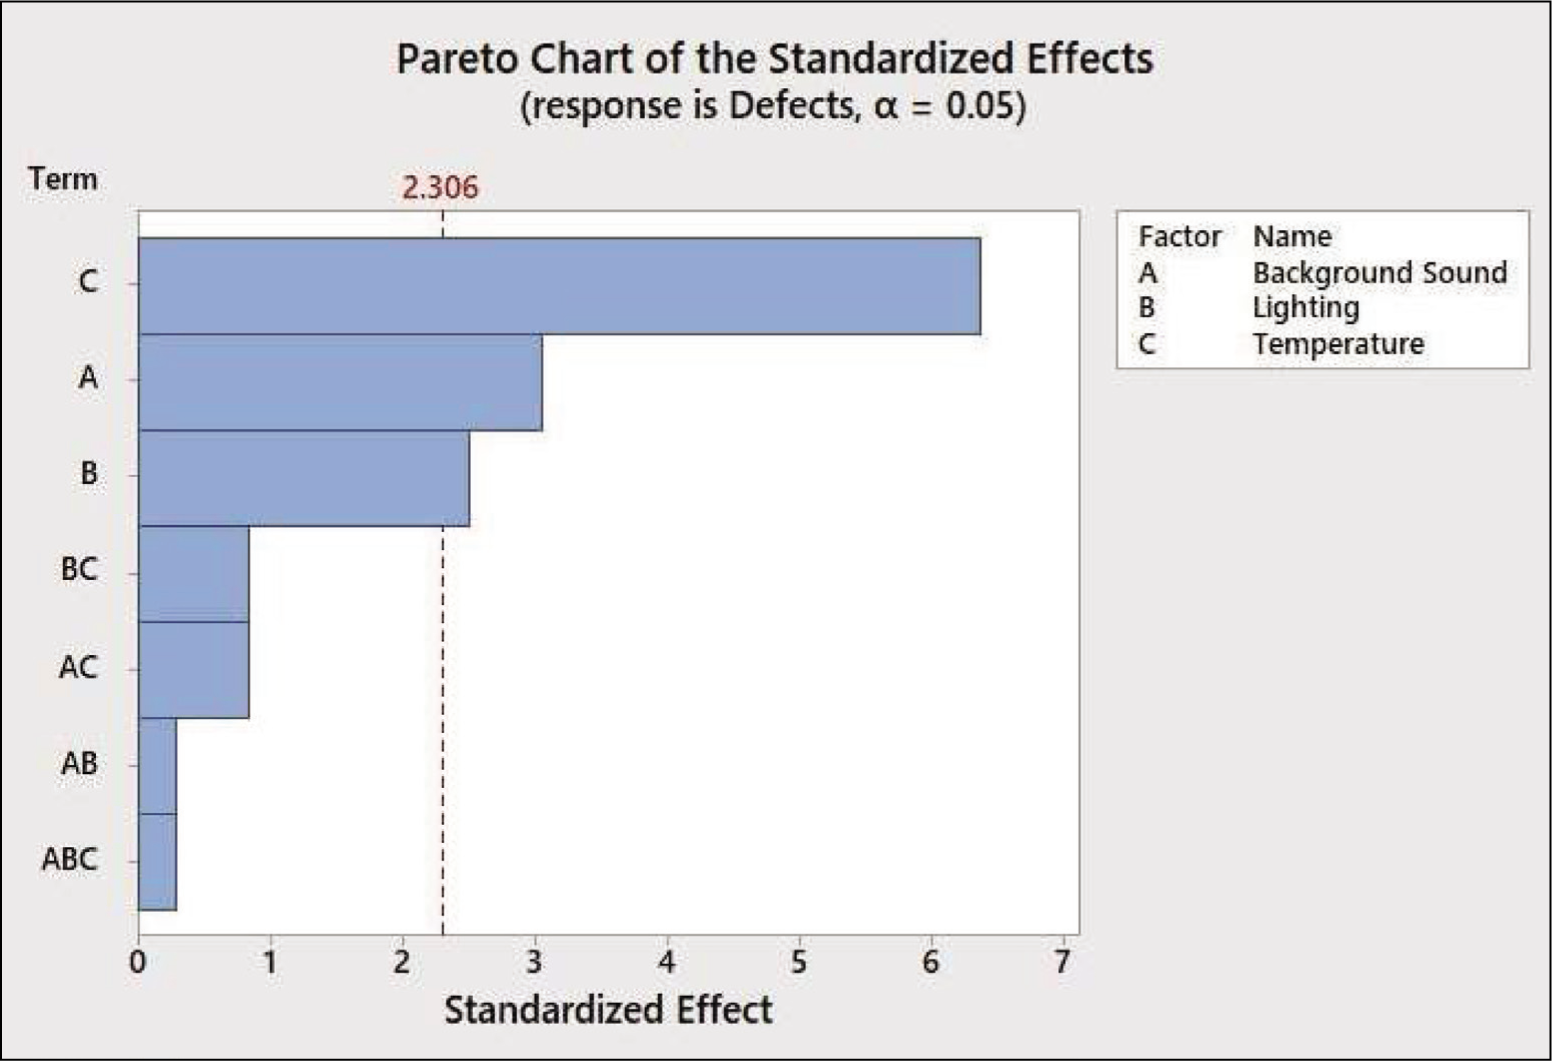
Since the results were found to be conclusive, hence all three significant factors (C: temperature, A: background sound, and B: lighting) from the first trial are selected for the next round of experiment, that is, third set of experiments (Taguchi’s DOE) to be conducted upon completion of the second set of DOE. However, before that in the next section, we will discuss the experiments to be conducted in a second trial with a second group of factors.
The Second Experiment
The second group of factors involves rest, supervisor presence and target as the process variables (factors). All three factors had two levels: low and high. For the levels of rest, it was decided to select Sunday and Friday to conduct the experiments. Friday was selected on the premise that since Friday is the last working day of the week, it would be strenuous on the participant and would result in a low level of rest. Similarly, since Sunday follows the regular weekly off day (Saturday) of the participant, the participant would have their full quota of rest and the participant would be performing the experiment after availing a high level of rest. The levels of supervisor presence were “present” and “not present” while the levels of target were “stringent” and “easy.”
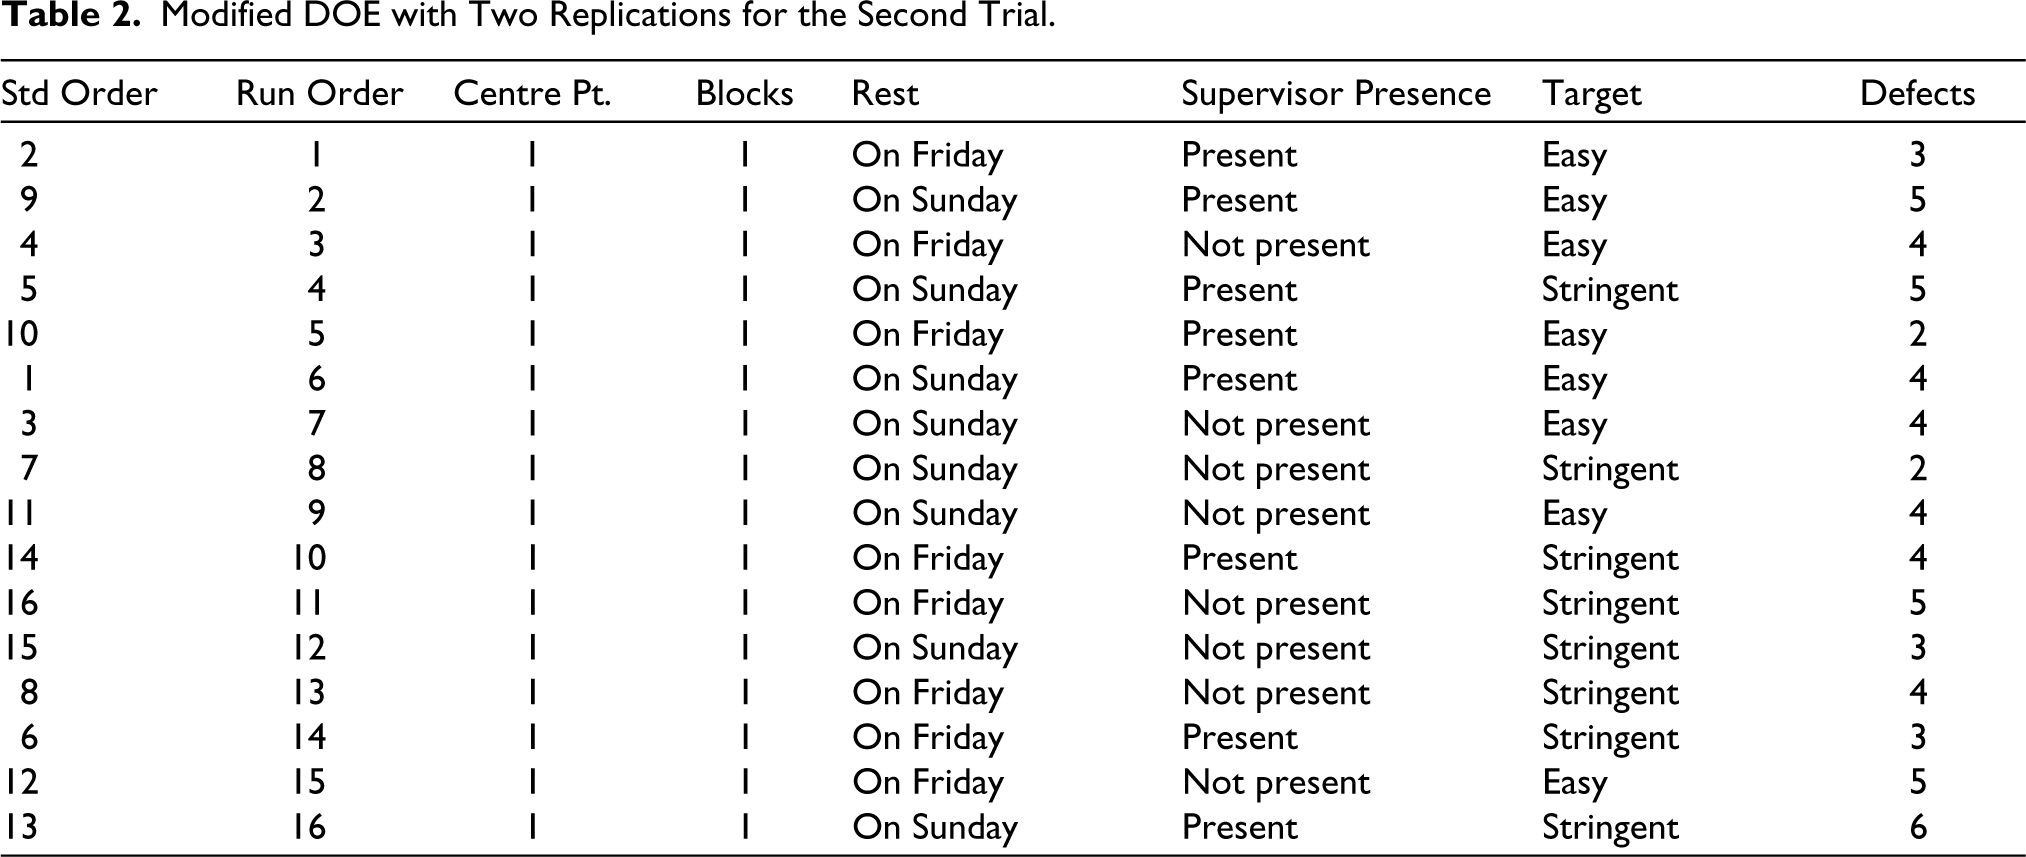
A full factorial design using the above three factors was created and the experiment is then performed by the participants under the controlled settings as per the factors and their levels. The factorial design was then constructed using two replications as depicted in Table 2.
Modified DOE with Two Replications for the Second Trial.
The “defects” were analysed with the help of DoE at 95% significance level. The Pareto chart of the standardized effects (Figure 4) for the second group of experiments reflects that two factors, namely “target” and “supervisor presence” affect the defects in a significant manner. Also, one of the second-level interactions between “supervisor presence” and “rest” affects the defects in a significant proportion. The values for all these factors and interactions are found to be more than the critical value of 2.306. The remaining factors and interaction parameters do not have any significant impact on the defects as the values of these are less than the critical value of 2.306.
Pareto Chart Results for Second DOE Experiments.
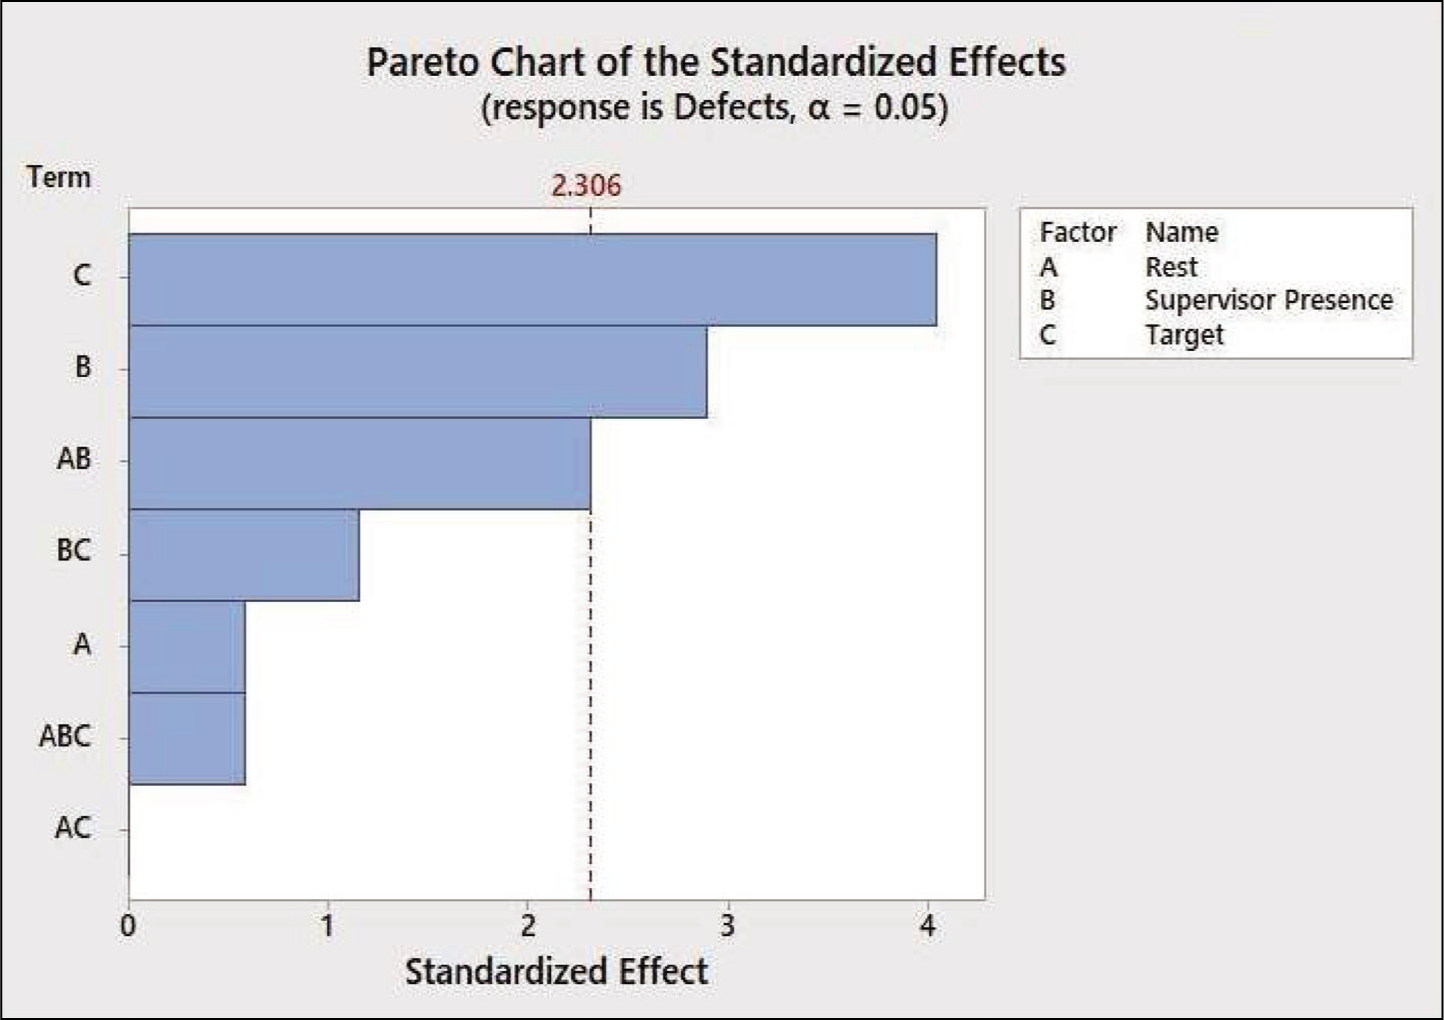
Thus, from the second trial, it can be inferred that the “target” and “supervisor presence” factors have a significant impact on defects. In addition, the second-order interaction between “rest” and “supervisor presence” also plays a significant role in the number of defects. Thus, combining the results of both groups’ experiments, it is observed that five out of the total six individual factors have a significant impact on the defect rate. It is also seen that third-order interaction has no significant impact on minimizing the defect rates. So, the significant main effects and interaction effects are selected for the third round of the experiment, along with those from the first round. Since there was little influence of higher order interactions in the analysis carried out so far, we decided to consider a partial factorial (Taguchi’s experiment) in order to study the impact by considering all the six main effects and one interaction effect.
Taguchi’s Design of Experiment
In the “The First Experiment” and “The Second Experiment” sections, we have discussed the impact of a group of factors in respective experiments to identify and select the significant factors and interactions resulting in a minimum defect rate during the experiment. The results indicated that all individual factors other than “rest” and one interaction factor between the “rest” and “supervisor presence” are significant. Since the individual factor “rest” has a significant impact in the presence of “supervisor presence,” it can be said that all the factors have a role to play in determining the defect rate. However, the objective of the experiment is to predict the best set of variables of the environment in behavioural aspects to keep the defects rate to be minimum. Hence, all six factors along with their two levels are considered while forming Taguchi’s DoE in the form of orthogonal array design having eight experiments, that is, L8 orthogonal array design.
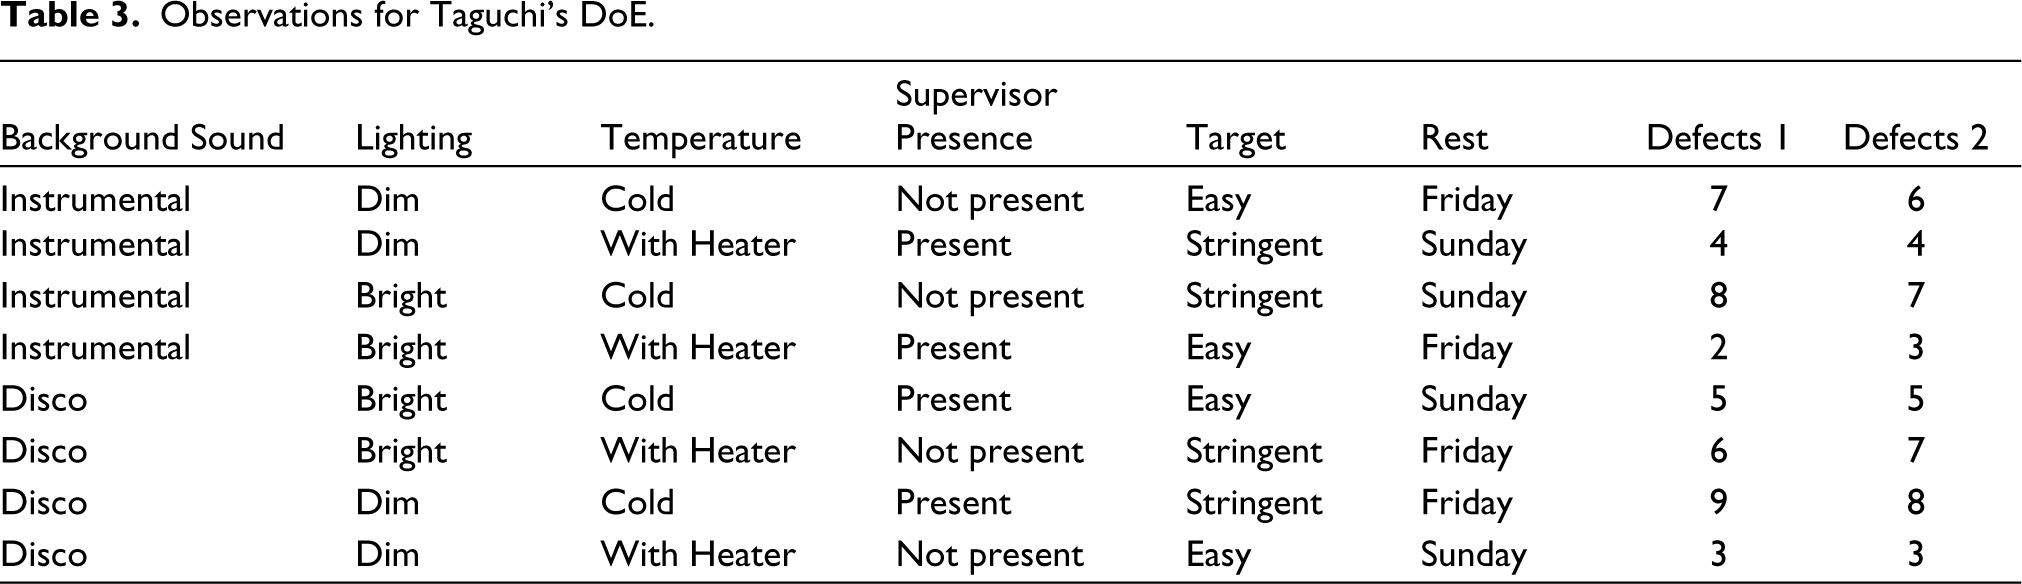
The experiments for Taguchi’s DoE were performed by two participants and their reported results for “defects” were stored in the columns corresponding to their set of process variables and their levels (Table 3).
Observations for Taguchi’s DoE.
Based on the values of defects reported by both the participants, the main effects plots and for mean and SN ratio (with minimum the better criteria) for all the six individual factors are plotted (Figure 5(a) and (b)). The analysis of mean effects plots for means shows that individual factors have different mean values for different levels. It is also noticed that factors have varied differences in the value of means for different levels. As noticed the “temperature,” “target” and “rest” factors have a considerable difference between the values of means for different levels, thereby indicating the significant impact of these variables whereas the difference between the levels for the “lighting” factor was minimum showing that this factor is the least significant among all the factors. The main effects plots for SN ratios of the individual factors show the mean of signal-to-noise ratio of all the individual factors. It was noted that the interaction effect was insignificant and therefore was ignored from further analysis.
(a) Main Effect Plot for Mean (Taguchi’s Experiment) and (b) Main Effect Plot for S/N Ratio (Taguchi’s Experiment).
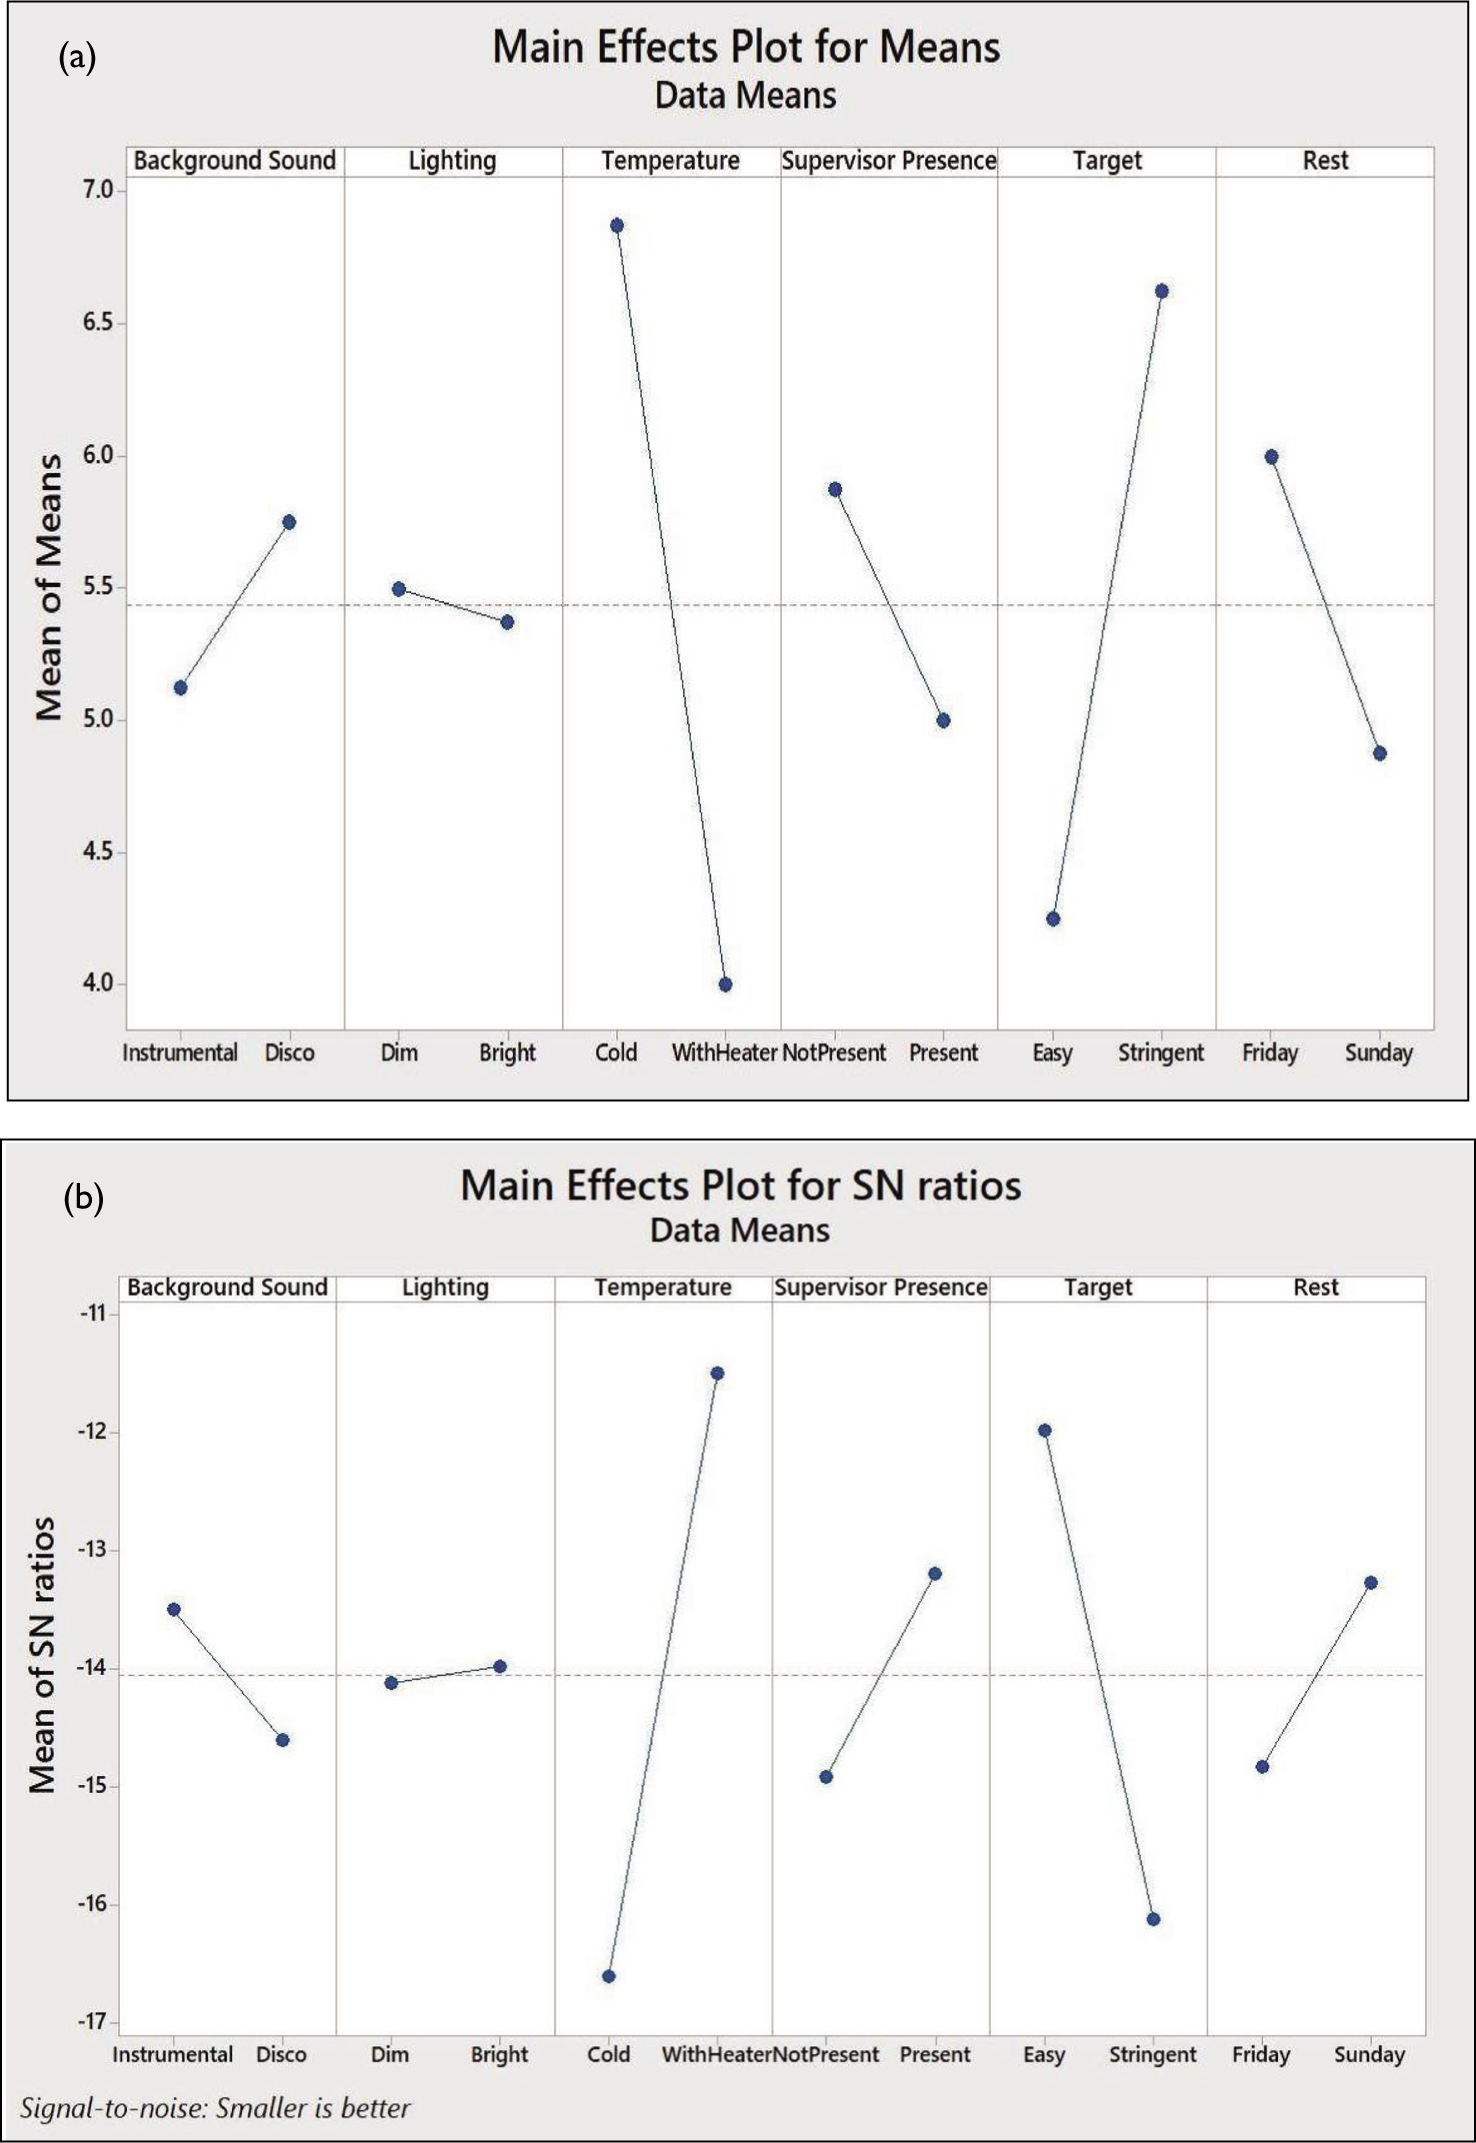
It could be observed from the mean effects plots that each factor has a level where the defects are low; for example, defects in the case of background sound are lower in the case of instrumental level than disco level. Similarly, the mean effects plots for SN ratios also show that SN ratios are lower in case of certain levels. For example, an S/N ratio for defects in With Heater temperature is lower than cold temperature. The analysis of main effect plots for means and SN ratios has provided information about the optimum level of individual factors based on which the minimum defect rate of the complete experiment can be decided. Thus, it is observed that a background score as instrumental will result in a lesser number of defects in comparison to the disco background score. Cold temperatures will result in more defects than a scenario where a Heater is present. Similarly, when easy targets are given to participants, lesser defects are observed. Through this work, it is possible to recognize the sequence of the most influential factors for the desired output. Overall, the optimum scenario for the experiment to achieve minimum “defects” as per Taguchi’s DoE is background sound (instrumental), lighting (bright), temperature (With Heater), presence of supervisor (present), target (easy) and rest (Sunday). Taguchi’s DoE predicts that when the same two participants perform the experiments under the levels as analysed under the Taguchi’s DoE for all the individual factors the lowest mean value of the defects for optimum levels of the individual factors will be 1.5. This predicted mean value of the defects is the lowest value of defects considering the most favourable combination of levels and factors.
Since Taguchi’s DoE analysis does not require performing all the experiments. But since the expected experimental setting was not a part of Taguchi’s experimental set-up, an experiment with this setting [background sound (instrumental), lighting (bright), temperature (With Heater), presence of supervisor (present), target (easy) and rest (Sunday)] is conducted as a confirmatory check. We also used the software to predict the results for the expected settings. The obtained results are shown in Figure 6.
Taguchi’s DOE Predicted Values Output Report.
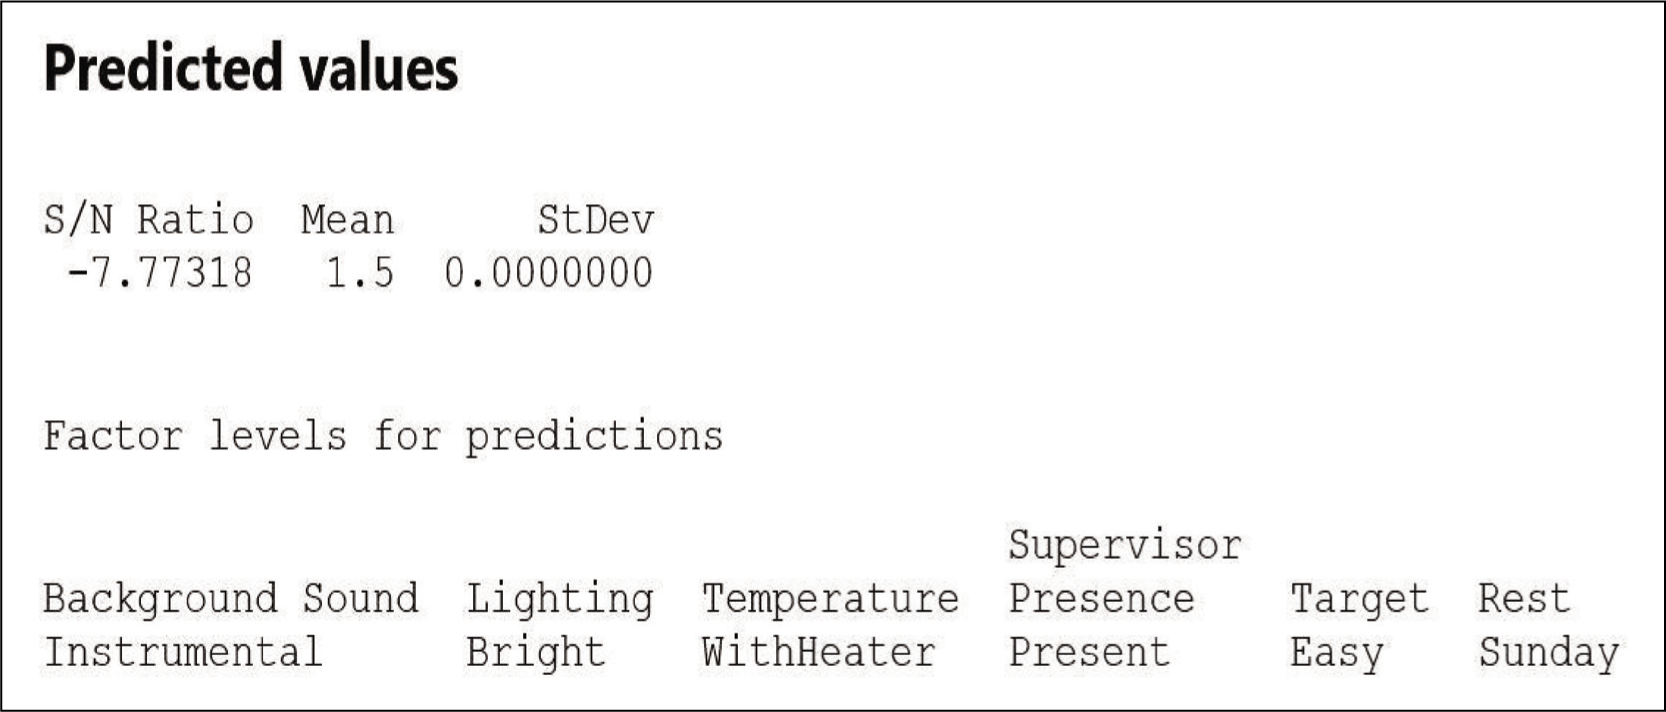
We conducted two replications of the experiment. It is done to verify the mean value of defects, under the scenario that the experiments conducted did not constitute the said composition of levels. It is expected that the mean value of the defect should be around the value of 1.5 as suggested by Taguchi’s DOE. In this confirmatory trial, we found that the value of defects was 2 and 1 from each of the two replicated experiments, whose average comes to 1.5. This confirms with the average value of 1.5 obtained from Taguchi’s predicted values. Moreover, the above experimental study conducted under a lab setting simulating the actual production environment has immensely helped in the desired objectives of evaluating the role of behavioural factors on process performance. We also demonstrate that DOE helps to identify the significant factors which impact the desired output variable (here number of defects) with a minimum number of trials under the combination of selected factors. Therefore, this experimental study has helped to answer both RQs along with the evidence in the literature as discussed earlier.
Contribution and Implications
This article has made sincere attempts to make the following contributions:
The work presents a modified learning and decision-making model (Figure 1) and modified human performance framework (Figure 2) by incorporating the assumptions regarding human behaviour, to contribute towards better theoretical BOM models, in order to achieve improved performance and better designs of processes in operating systems. The statement that the whole OM research community may have been late in identifying the importance of human behaviour in manufacturing and OM. It is felt that the whole impact would have been altogether different if this discipline had come up at least three decades back until when manufacturing was manpower intensive. The authors emphasize that in the pursuit of managerial excellence, it may not be necessary to always go for financially prohibitive changes. Rather smaller baby steps can also result in much-needed incremental benefits, for which experiments and studies of behavioural aspects can also be explored. The researchers, in their pursuit towards strengthening BOM theory, need not select complicated tasks as their experiments. Significant investigations can be undertaken by using relatively simpler tasks, which can be cost and time saving also, as we have used in this article. When using DOE, careful selection of the minimum number of relevant factors and their levels is a must to ensure less rigorous yet meaningful work. Theory suggests that DOE has not been used significantly in the services sector though it finds good use in manufacturing. If the factor “supervisor’s presence” is replaced by “customer’s presence” in experiments in the services sector, then it could help to study people’s behaviour in services where services are produced and consumed simultaneously in the customer’s presence. Careful selection of participants is very critical to the success of a behavioural experiment as the participants should remain engaged and motivated throughout the study in an unbiased manner. Managers can also use their wisdom in the selection of equipment and environment so as to provide a measurable variable of interest to the study. The levels of such factors need to be identified and should be detectable. Also, the levels can be selected to be discrete or continuous, besides deciding upon the number of levels of factors. The data generated in lab experiments may not be normally distributed; hence, the statistical analysis can have altogether different statistical implications when the findings of results are carried over in real-world settings. The conclusions are limited to the type of process studied in this work, which simulates an assembly line work with high-volume production, in a process that relies on manual activities performed mostly by workers. Managers can make use of findings and carry out similar work in their organizations to find out the factors impacting productivity on account of behavioural issues.
Conclusions
Behavioural issues impact as much as all decisions that we may face during our lifetime. The whole emphasis of research in the past century has been to make algorithms and automated systems more powerful. Most formal analytical models of operations assume that the people who participate in operating systems are fully rational or at least can be induced to behave rationally. But when it comes to implementation, the success of OM tools and techniques, and the accuracy of its theories, rely heavily on how well we are able to understand human behaviour. Human beings are not only central to the functioning of the majority of operating systems but also impact their performance. So the authors see that the role of BOM studies will always be challenging yet interesting in future as well. This article has sufficiently demonstrated that laboratory experiments aided with simple statistical tools like DOE can be used in conjunction with relatively simpler tasks (involved in making a product in our study) to conduct behavioural studies effectively. The results and findings also affirm the answers we obtained from the literature review to both of the RQs as discussed earlier.
The findings reflect that only main order effects were found to be significant, with none of the interaction effects of factors found to be significant in any of the experiments. Thus, it was observed that when the experiment was conducted in a room where the heater was present (during months of January when it is very cold in parts of northern India), the output variable, that is, “number of defective products” was much lower than the condition where the experiment was conducted in a cold environment without the presence of the heater. In the same way, it became apparent from the results of the experiment that when the targets given to the participants were “easy,” there were fewer defects vis-à-vis when the targets given to participants were “stringent.” Similarly, the “presence of supervisor” resulted in a lesser number of defects (workers tend to become more attentive) in comparison to the scenario where the supervisor was “not present.” In the case of other factors, namely rest, background sound, and lighting, a similar pattern was observed where one level of the factors resulted in a higher number of defects when compared to the score of defects obtained under the other level. Hence, experiments performed on “Sundays” resulted in less defects than the ones performed on “Friday,” “instrumental music” being played in the background resulted in a lesser number of defects (may be attributed to the soothing effect on the mind) in comparison when the sound in the background was a “disco music.” Similarly, the “bright lighting” resulted in a lesser number of defects (helped in the better concentration of workers) than the condition where the experiment was conducted in the “dim lighting.” We observed that out of the two differentiating levels for all the six factors, one of the levels resulted in a lesser number of defects.
Thus, it was observed in the experiment that all factors had some effects on the output variable, that is, the number of defects and different levels even produced different results in the experiment. Taguchi’s DOE is conducted on the basis of significant factors selected from the outcomes of the first two experiments. Taguchi’s DOE predicts the final set of significant factors and their corresponding levels to achieve the desired outcome, that is, minimizing the rate of defects. A small confirmatory test is done which confirms the results with predicted values. We obtained pretty useful insights which can be utilized by practitioners and managers in their pursuit of looking for simple solutions to complex interactions arising from multiple factors. These simple solutions can not only help redesign and improve the workplace but also achieve potential gains besides improving productivity. The work also highlights the significant theoretical contributions and managerial implications, which have immense potential towards a unifying theory of BOM. The results and findings of this experiment give useful insights for the practitioners and managers as to how with help of simple solutions can arise from complex interactions arising from multiple factors. Thus, the managers can make use of findings and carry out similar work in their organizations to find out the factors impacting productivity on account of behavioural issues.
Limitations and Directions for Future Research
We have identified 15 factors out of which we only selected the six factors for the experiment. The future research can make use of a higher number of factors to study their impact on behavioural operations. Also, this study involved just two participants for the sake of simplicity being the initial study in this direction. Future studies can involve more participants of varied demographic factors for more inclusive findings that have increased generalizability. Most of the factors were considered to have just two aspects of variation under discrete conditions. Our study has considered only discrete levels of the factors, so future studies can consider the continuous levels for some of the factors for better analysis of behavioural factors. This study deployed the DOE method but the researchers can also make use of statistical tools for conducting similar experimental studies. In future similar studies in the services industry where the services are normally produced and consumed simultaneously in the presence of the customer, the behavioural factor “supervisor’s presence” can be replaced by “customer’s presence” to study people’s behaviour in the services sector. Also, future studies can be done in real-world industrial settings to evaluate the impact of behavioural factors on performance.
Footnotes
Acknowledgements
The authors are thankful to Professor Shailendra Singh, editor-in-chief for his constructive feedback. The authors also thank anonymous reviewers for providing valuable comments on this manuscript. Further, the authors hereby take this opportunity to express sincere thanks and gratitude to the Indian Institute of Management Lucknow, Research Designs, and Standards Organization, Lucknow, and Rajasthan State Road Transport Corporation, Jaipur, for providing the necessary technical support and all motivation and guidance to complete this research work.
Declaration of Conflicting Interests
The authors declared no potential conflicts of interest with respect to the research, authorship, and/or publication of this article.
Funding
All the authors hereby declare that for this research work, we did not receive any form of funding or grant whatsoever from any agency or institution. It is hereby also declared that no funding was received to conduct this study or assist with the preparation of this manuscript. This work has been done purely on account of academic interest only.