
Abstract
This article examines the various forms of basic resource gap (BRG) and fiscal dependency in a long-term panel framework, comprising 14 major Indian states from 1981–82 to 2016–17. Further, it decomposes the level and extent of states’ fiscal dependence on transfers and borrowings, which together constitute the total non-own source of revenue on a disaggregated level into three different phases to gain a thorough understanding of the states’ vulnerability and the quality of dependence. The findings show that among the 14 states, Odisha, Karnataka, Tamil Nadu and Uttar Pradesh are leading the way in reducing the BRG during the third sub-period. Odisha’s fiscal dependency has decreased faster and has been sustained to a greater extent than in the other states. In contrast, the accumulation of unsustainably higher levels of debt and guarantees is an issue of concern in West Bengal, Punjab and Kerala, where discretionary sources of revenue have increased significantly in recent decades. The study finds that, despite several incentive-based reform measures, the BRG persists, with mounting fiscal challenges besides a decline in non-debt capital receipts across the Indian states.
Introduction
India is a federal country with asymmetric (both vertical and horizontal) levels of development. An asymmetric federalism may be accorded through the constitutional provisions (Reddy & Reddy, 2019). Indian constitution provides for the division of powers and responsibilities between the central and the state governments. The seventh schedule of the Constitution assigns functional responsibilities under three lists—union, state and concurrent—providing for the division of power among different layers of the government. Generally, governments experience mismatches in their functions and finances.
According to existing literature, in the Indian context, it is evident that subnational governments have narrow revenue streams, and even their major sources of revenue, which are elastic in nature, fluctuate during economic ups and downs (Rao & Shah, 2009). Besides, an increase in the coefficient of variation of per-capita own-source revenues (OSR) has resulted in a growing divergence between per-capita OSR and per-capita expenditure, creating a resource gap (Chakraborty, 2010). In the structure of public spending, states shoulder the greater responsibility of providing public services of socio-economic importance. 1 In the total combined (central and state) expenditure, the relative share of the states has remained at more than 50% of the total, resulting in a larger resource gap between revenue and expenditure (Tables A1 and A3 in Appendix). Such inherent fiscal imbalance (resource gap) not only continued to persist but also remained high and intense among the states. For instance, as per the 15th Finance Commission (FC) report, in 2018–19, the central government has raised 62.7% of total revenue, while it spends about 37.6% of the total expenditure. In contrast, at the subnational level, their share in total expenditure has remained about 62.4%, while their OSR accounts for about 37.3%. Hence, the most remarkable feature of widening the resource gap is the rapid upward trend in total spending amid growing non-debt revenue crunch and debt servicing across multi-tier governments. As per existing literature, several factors, such as growing subsidies, pension outgo, pay revisions, increase in the volume of interest rate to revenue receipts, competitive reduction in taxes, reluctance to raise non-tax revenue, loss-making public sector units (PSUs) and higher debt servicing obligations, have together contributed to the escalation of fiscal risk since the 1990s. Further, from 2005 to 2016, a constant upward shift in the revenue expenditure from 6% to 14% of GDP has further contributed to the fiscal stress scenario, which continues to exist in the majority of the states according to the RBI study of state budgets, 2002–03 (Panda et al., 2019). This has increased the cost of expenditure obligations; besides, inadequate rise in revenue receipts necessitates states’ dependency on external sources of revenue.
In bridging the existing resource gap, 2 the states receive financial assistance from Finance Commissions (formula-based statutory devolution), which constitute the major non-obligatory revenue source. Besides the FC, two other channels—the Planning Commission (now NITI Aayog 3 ) and central ministries—provide non-statutory transfers. 4 In addition to these transfers, states receive financial assistance for development projects in the form of central loans, subject to certain conditions. 5 Meanwhile, states borrow funds from internal sources (bounded by rules – Article 293(3) of the Constitution 6 ), which is an obligatory source of revenue used to finance the growing resource gap. Overall, in the due course of time, states’ dependency on non-OSR 7 has constantly increased. Notwithstanding, since the mid-1990s, several states have become more dependent on various capital receipts, particularly debt capital receipts. Meanwhile, as the states experienced steep deterioration in their finances, funds eventually received were increasingly diverted to servicing interest obligations, which could have been used for development services; this has imposed an additional financial burden on state finances (Gurumurthi, 2002).
Against this fiscal backdrop, a bottom-up approach to fiscal discipline reform has been initiated, followed by the recommendations of the subsequent FCs. Accordingly, states have undertaken several fiscal adjustments-cum-reform measures (Value-Added Tax [VAT] 2005; Fiscal Responsibility and Budget Management [FRBM] Act, 2003; debt swap; debt consolidation; improvement in tax administration; Goods and Services Tax [GST] 2017, etc.; see Table A4 in Appendix) to improve their fiscal position according to RBI’s study of state budgets. Meanwhile, an increase in central assistance also enabled states to achieve revenue surplus, which contributed to positive growth at the subnational level. However, with the onset of the COVID-19 pandemic, states have experienced larger revenue crunch amid an increase in committed spending. It distorted states’ budgetary allocation and deteriorated their economic scenario.
Against this backdrop, the fiscal health of state finances has undergone a compositional shift, followed by several structural and institutional changes over the decades. The motive of this study is to examine the overall redistributive impact of different sources of obligatory and non-obligatory sources of revenue on expenditure, which reflects the extent of fiscal prudence at the subnational level. Gross Fiscal Deficit (GFD) reflects the borrowing requirements of the government budget 2020–21 as a whole. The decomposition of GFD segregates revenue and capital deficits, and its financing pattern involves the percentage contribution from different sources of revenue individually. However, the basic resource gap (BRG) reflects total expenditure (revenue and capital) minus OSR, which shows the difference between total expenditure and the state’s own revenue collected from tax and non-tax revenue sources. Further, fiscal dependency ratio (FDR) represents how much revenue is required for the state to finance its inevitable expenditure. In other words, the BRG leads to fiscal dependency. Such dependency may be transfer or borrowing based. Hence, further extension and bifurcation of FDR (into FDR2 and FDR3) helps to assess the proportion of the state’s fiscal dependence on transfers and borrowings, which together constitute total non-OSR (non-obligatory and obligatory sources of revenue). This paves the way to comprehensively understand the extent of vulnerability and the quality of dependence of the states. Overall, GFD measures the total resource gap. However, the methodology adopted in this article helps in disaggregating the relative share of different sources of revenue in the total revenue.
In this context, this article contributes to the existing literature in several ways considering the attempts made by Bajaj and Joshi (2000) and later by Pattnaik (2019), covering the period from 1980–81 to 1996–97 and from 2014 to 2016, respectively. First, this article examines the different forms of BRG and fiscal dependency in a long-term panel framework comprising 14 major Indian states for the period from 1981–82 to 2016–17. Second, this article further decomposes the level and extent of states’ fiscal dependence on transfers and borrowings, which together constitute the total non-OSR at the intra-state and inter-state-wise disaggregated levels in three different phases. This enables us to thoroughly understand the extent of vulnerability and the quality of dependence of the states.
This article is structured as follows. A review of the literature is followed by an analysis and discussion on different forms of FDR, while the final section summarises the study’s findings.
Brief Review of Literature on State Finances
As stated earlier, one of the most difficult tasks of the government is to generate adequate revenue for an uninterrupted public service delivery, in which the relative share of alternative revenue sources reflects the fiscal health of the states. Hence, to comprehensively understand the extent of fiscal performance, existing literature on state finances must be reviewed with a multi-dimensional approach. This approach includes a critical review of literature on state fiscal capacity and fiscal adjustment, fiscal sustainability and fiscal dependency of states in the Indian federal structure.
State Finances, Fiscal Dependency, Debt Sustainability and Resource Gap
The existing research on state finances reveals two main factors. As per the RBI Annual Reports, one is a constant decline in states’ OSR and the other is a growing dependence of states on the central government to finance their growing expenditure. According to existing literature, in the Indian context, a significant part of the state’s revenue is still derived from their own revenue sources. Meanwhile, increasing the revenue gap is a major concern for the states (Kurian & Dasgupta, 2004). As per the existing empirical literature, the average tax effort by the states has not only been unsatisfactory but also deteriorating over time (Karnik & Raju, 2015). States were having a narrow tax base due to the dominance of taxes on commodities and services, with three major taxes, such as sales tax, excise and taxes on transport, together contributing about 78% of the overall own-tax revenue of the states (Raju, 2011). Sales tax, a dominant source of revenue, alone contributes to nearly one-third of the total expenditure. State excise and stamp duties are the second and third largest source of own-tax revenue, which contribute to nearly 12% and 10% (0.87% of Gross State Domestic Product [GSDP]) of own-tax revenue, respectively (Mukherjee, 2019; Nayudu, 2019). Revenues from sales as well as stamps and registration are relatively more elastic and show fluctuations with economic ups and downs (Rao & Shah, 2009). On the one hand, empirical studies on tax efficiency and potentiality of excise and stamp duties noticed a marginal improvement in tax potential due to the gap between predicted tax revenue and frontier tax revenue despite several policy measures at the subnational level. Besides the insignificant role of non-tax revenue sources, empirical studies observed a minimal recovery rate in some of the major services such as education, health, major and minor irrigation, and roads compared to other services such as education, water supply, and sanitation (Purohit & Purohit, 2009). Some studies also noticed the practice of soft budget constraints by the state governments, with increased dependency on central transfers and bailout practices, which further enhanced the fiscal burden on states (Singh & Vasishtha, 2004).
Differences in fiscal capacities and fiscal needs among the subnational governments resulted in varying resource gaps. Meanwhile, persistent spending pressure combined with insufficient revenue generation has further increased states’ reliance on intergovernmental transfers. According to the FC reports, the proportion of revenue gap bridged by the central transfers steadily increased from 2.53% of GDP during the Ninth FC to 2.93% of GDP during the Thirteenth FC and further to 3.89% of GDP during the Fourteenth FC period (Finance Commission, 2015). In other words, from the Thirteenth to Fourteenth FC, the share of devolution of transfers as a percentage of the revenue gap of the states has increased from 50.36% to 52.51%. As a percentage of GDP, during the award period of the Fourteenth to Fifteenth FC, shared taxes accounted for 3%–4% of GDP, which was higher compared to the award period of the previous three FC reports. Likewise, Rao and Srivastava (2014) examined the pattern of dependence of states by using an index of the dependence of states on the different components of central transfers. Based on a state-wise decomposition, the study reveals that high-income states rely on transfers at a rate of 6%–18%, middle-income states at 15%–23%, and low-income states at 21%–58%. Overall, the dependency of states on transfers has raised concerns about fiscal decentralisation. Further, several studies have examined the allocation of discretionary transfers from the political economy perspective or distributive politics along with economic variables (Khemani, 2007). Studies also found an increase in the volume of non-formula-based grants and an increase in the share of off-budget transfers within the total non-formula transfers as compared to on-budget transfers (Chakraborty et al., 2010).
With the widening of the BRG, states have borrowed funds from internal and external sources to finance their current budgetary deficit. Also, even those obligatory borrowings are allocated towards committed spending, which further worsens the fiscal situation. States that are more dependent on obligatory sources of revenue with expensive borrowing faced a higher level of fiscal deficit with a rising share of debt/GSDP and interest payment/revenue receipt ratio. In the process of fiscal adjustment, central loans, National Small Savings Fund (NSSF), public account borrowings (PAB) and market borrowing continue to exist as predominant obligatory sources of revenue for states during different periods, which indicates heterogeneity across the states. According to Gurumurthi (2002), the root cause of states’ indebtedness lies in the planning process. Central loans during the 5-year plans account for the bulk of states’ indebtedness. In accordance with the Gadgil formula for central aid to states, 70% of the assistance was given in the form of loans to states without any assessment regarding the repayment of the loan component, which resulted in a growing debt burden among states. On the other hand, states used borrowed funds not only for investment purposes but also to cover part of their revenue expenditure. State expenditure on government enterprises has put a burden on the state budget due to their poor performance. Meanwhile, the growing level of contingent liabilities and the gap between available resources and plan outlay are the other sources of fiscal risk to the states in the near future.
As per existing literature, compared to the 1990s, the changed fiscal scenario and fiscal correction measures implemented in the last decade (such as the FRBM Act, 2003) have assisted the states in improving their tax as well as non-tax revenue in the post-reforms period to some extent according to various issues of Medium-Term Fiscal Plan, but such improvement has failed to remain stable for a longer period. It has been observed that the coefficient of variation with regard to per-capita own revenues has persisted over the years (Chakraborty, 2010). Further, since 2004–05, states started accumulating surplus cash balances to avoid resorting to ways and means advances (WMA) during the repayment obligation period. 8 Another stage of tax reforms has been the implementation of the GST since 2017, which has replaced several indirect taxes levied by the states and made the states more reliant on the central government for revenue (Mukherjee, 2019). As a result, in this period of transition with respect to GST, limited freedom to raise revenue through borrowings and slowdown in the economy with persistent spending pressures will keep deficits at a higher level. Meanwhile, COVID-19 has further tested the credibility of the rules, as majority of the states have relaxed and are unable to sustain their fiscal prudence for a longer period. Further, in the recent past, in the post-pandemic period from 2020–21 to 2023–24, the share of central loans in total transfers has increased under the scheme for special assistance to states for capital investment/expenditure (2020–21). As a result, states continue to depend on central loans to boost capital expenditure at the subnational level. Altogether, the signs of fiscal stress persist with a resource gap at the subnational level.
It can be summarised from the above-reviewed literature on multi-dimensional issues that the source of revenue has a greater influence on the pattern of spending. Hence, an attempt was made in this direction by Bajaj and Joshi (2000) and later by Pattnaik (2019) to examine the extent of the BRG and fiscal dependency among the Indian states. According to the studies, nearly 50% of the resources are derived from dependent and stressed sources; of which 28% are out of stressed sources to finance states’ spending obligations.
As there are very few studies on the measurement of different forms of BRG and fiscal dependency at the subnational level in India, this study will be a valuable addition in this context, to assess the fiscal performance of the 14 major Indian states.
Measuring Resource Gap and Fiscal Dependency
For adequate revenue generation, proper management of the revenue structure with a diverse set of revenue sources is essential. At the subnational level, the total revenue sources, which are used to finance their expenditure, can be classified into non-OSR and OSR. Under Indian fiscal federalism, the major sources of financing (excluding OSR) available to the states include PAB, market borrowings and WMA from RBI, shared taxes and non-plan grants, high-cost central loans from the central government and financial institutions (FIs). States also receive external assistance, routed through the central government as part of plan assistance, which is another major source of funding for the development activities of states. The non-statutory grants, which are subject to the central government’s discretion are costlier from an economic as well as political perspective. It is important to note that statutory transfers do not reduce the fiscal autonomy of states, while non-statutory transfers reduce the state’s fiscal autonomy.
Basic Resource Gap: Meaning and Composition
For a meaningful analysis of the nature of the dependency of states on different sources of revenue, this study makes use of three different forms of the BRG:
BRG1—Total expenditure minus OSR. BRG2—Total expenditure minus OSR and some components of capital receipts comprise recovery of loans and advances, net public accounts, internal debt excluding market loans, WMA from RBI and central loans. BRG3—BRG2 + statutory transfers.
BRG3, the difference between BRG1 and BRG2, depicts the extent of expenditure financed by a proportion of capital receipts on which the state has more control. Further, the difference between BRG2 and BRG3 shows the extent of expenditure financed through statutory transfers.
Following Pattnaik et al. (1994), FDR is measured as the ratio of the BRG to total expenditure. FDR shows the level of dependency on revenue sources such as market loans, non-statutory transfers, high-cost central loans, WMA from RBI, which are costlier, pre-fixed limit with short-term repayment and need for central government consent and discretion.
FDR1 = BRG1/total expenditure
FDR2 = BRG2/total expenditure
FDR3 = BRG3/total expenditure
In a decomposition analysis, this study examines the nature of fiscal dependency in three parts: FDR1, FDR2 and FDR3. Such bifurcation of FDR into FDR2 and FDR3 depicts the relative role of capital receipts and federal transfers in bridging the resource gap, which have become the major sources of revenue in recent years.
Based on an inter-temporal examination of the devolution of transfers, implementation of new economic policies and fiscal adjustment measures, the period of the study from 1981–82 to 2016–17 has been divided into three sub-periods. This bifurcation helps track the impact of policy measures on macroeconomic variables across different time periods.
Period I: from 1981–82 to 1991–92
Period II: from 1992–93 to 2002–03
Period III: from 2003–04 to 2016–17
For the analysis, 14 major states have been considered. They include Andhra Pradesh undivided (AP), Bihar undivided (BIH), Gujarat (GUJ), Haryana (HAR), Kerala (KER), Karnataka (KAR), Madhya Pradesh undivided (MP), Maharashtra (MHR), Odisha (ODS), Punjab (PUJ), Rajasthan (RAJ), Tamil Nadu (TN), Uttar Pradesh undivided (UP) and West Bengal (WB). The data required for the study were compiled from the various issues of RBI Bulletin. The current study is restricted to the years 2016–2017 due to data constraints and to ensure comparability. However, this provides a good potential for future studies.
Fiscal Dependency (FDR1)
The BRGs explain the varying extent of dependency of states on different sources of revenue. FDR1 indicates how much revenue the states can mobilise on their own to finance their growing spending obligations. Since FDR1 is the initial point to measure the extent of the resource gap, it provides a clear indication of the resources needed to finance the spending obligations of states.
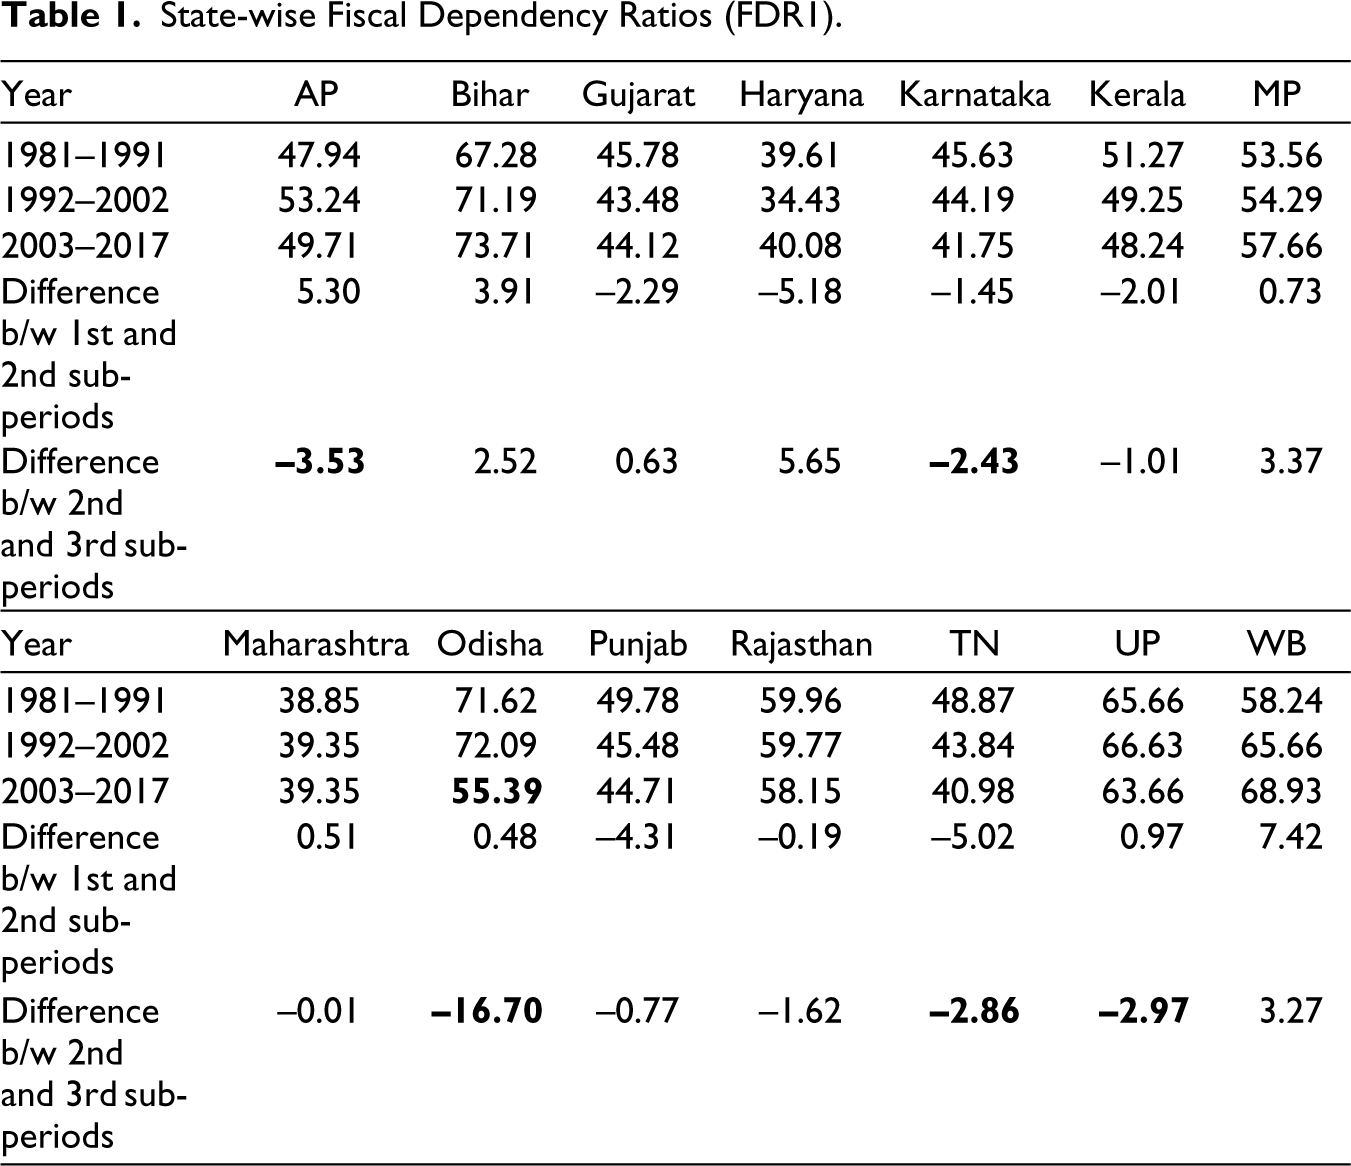
Table 1 depicts that in the phase-wise analysis of the intra-state comparison, the extent of the BRG has decreased in more than half of the 14 major states. However, the changing pattern in the resource gap creates wider disparities across the states. For instance, the ratio of fiscal dependency has continued to be more than 50% of their expenditure financed by resources that they do not generate on their own in Bihar, UP, MP, Odisha, Rajasthan and West Bengal. The extent of the resource gap remained comparatively low in Maharashtra, Tamil Nadu, Haryana and Karnataka. Meanwhile, the extent of fiscal dependency has decreased at a faster pace in Odisha, whereas it increased at a slower pace in Gujarat and Maharashtra. The progressive trend in the resource gap can be noticed in the post-reform period with improved fiscal performance in Odisha (with a 16% fall), Tamil Nadu, Karnataka and Uttar Pradesh. Of the 14 states, Karnataka, Tamil Nadu, Odisha and Haryana are in the lead to reduce the BRG during the third sub-period.
The states made several corrections to address fiscal imbalances in subsequent years of the mid-2000s, which led to a change in their fiscal scenario. In the post-FRL period, more than half of the 14 states (Odisha, Bihar, Gujarat, Karnataka, Tamil Nadu, Punjab, Maharashtra, Haryana, AP, Rajasthan, MP and UP) have experienced a surplus in their revenue account for nearly 8–10 years, with significant fiscal correction in their revenue side rather than expenditure contraction measures. Meanwhile, such a fiscal consolidation roadmap has provided a cushion to enhance spending on development activities. In contrast, fiscal correction remained slow in Kerala, Punjab and West Bengal and has failed to wipe out their revenue deficits (Reserve Bank of India, 2016).
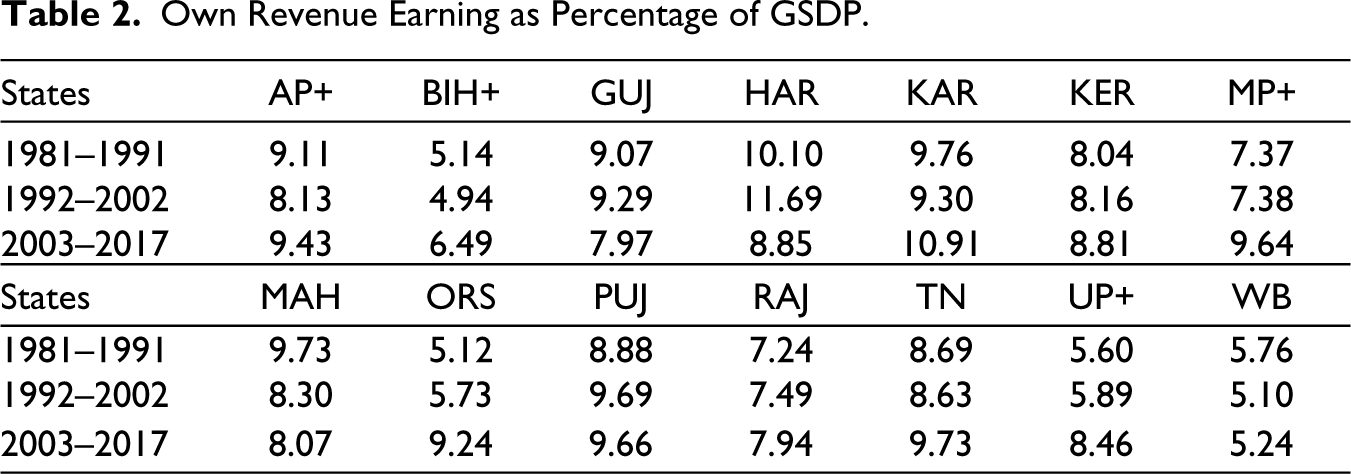
Tables 2 and 3 substantiate the above argument regarding the trends in the components of states’ own revenue receipts and expenditure. In majority of the states, own-tax revenue has remained one of the major sources of revenue. State-wise own revenue earning has remained more progressive in Odisha, Bihar, Karnataka, MP and UP during the third sub-period. Conscious effort by states to improve revenue mobilisation is evident in the aftermath of the Twelfth FC and with several policy initiatives introduced in the 2008–09 budget. Reform measures such as rationalisation of sales tax rates and tax administration, implementation of VAT and accelerated economic growth have collectively contributed to a rise in the level of states’ own revenue in addition to increased fluctuations in the mobilisation of non-tax revenue (Ravishankar et al., 2008).
State-wise Fiscal Dependency Ratios (FDR1).
Own Revenue Earning as Percentage of GSDP.
States’ Total Expenditure as Percentage of GSDP.
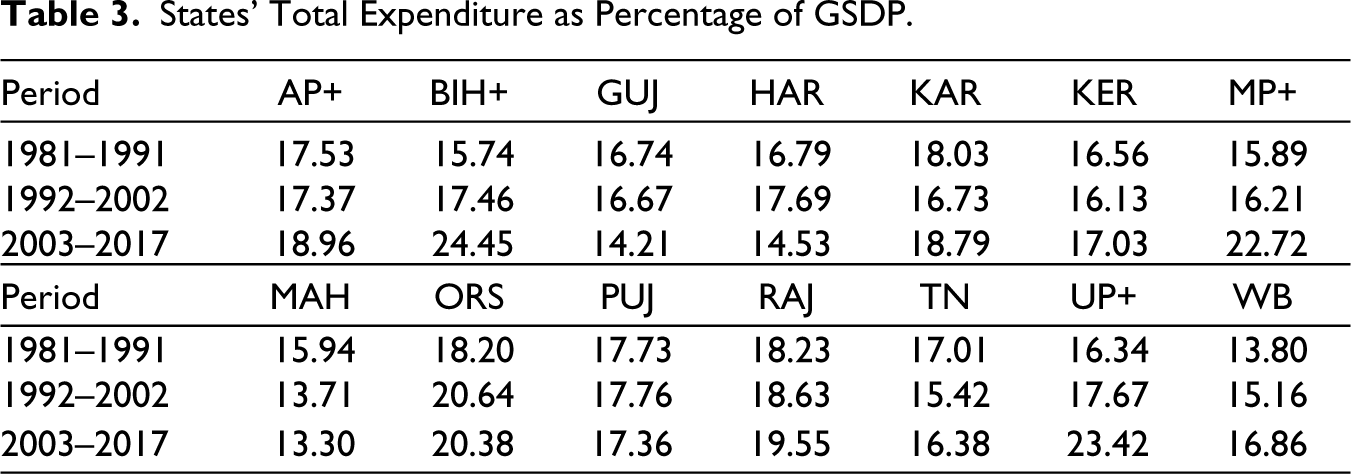
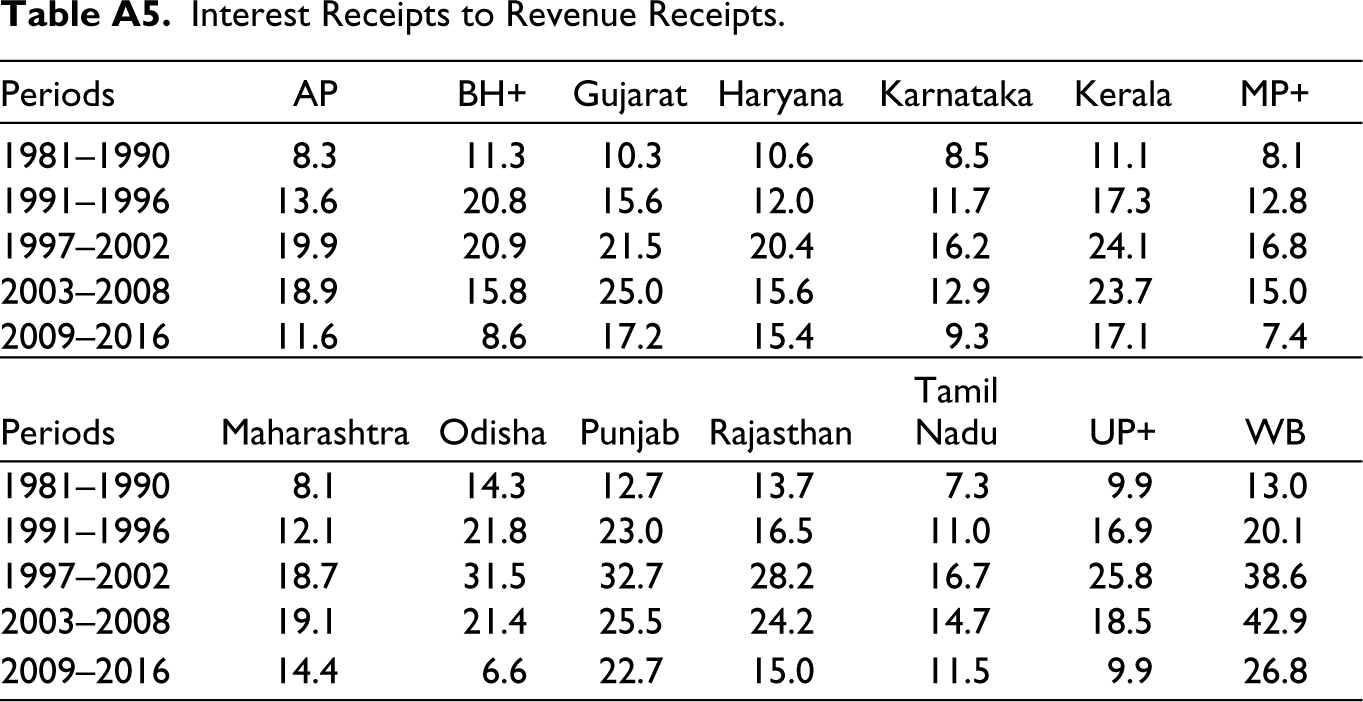
On the spending side, despite post-FRBM expenditure compression measures, total expenditure has been driven by committed expenditure, which constitutes a substantial segment of revenue expenditure. It is also evident that a sharper increase in capital expenditure due to debt repayment, followed by reform measures, increased capital outlay in the post-FRBM period, and larger borrowing of funds through PABs, led to a higher level of fiscal deficit. On the revenue account spending side, administrative services and pension burden have remained high, despite the fall in the share of interest payment. Interest payment on central loans has registered a drastic fall from 2002 to 2003, but the mounting repayment of interest on internal debt in the third sub-period has led to an increase in revenue expenditure (Tables A3 and A5 in Appendix).
The quality of states’ spending has improved in the immediate aftermath of the enactment of the FRBM Act, but consistency could not be sustained for a longer period (Reserve Bank of India, 2017). Since 2014–15, there has been an increase in revenue gap, which was worsened by the COVID-19 crisis. The pay revision by the Seventh Central Pay Commission has also placed an enormous fiscal burden on states’ revenue and expenditure.
An in-depth analysis of state-wise fiscal health reveals that the fiscal situation has improved in majority of the states in the post-FRBM period. Several states relied largely on revenue-led rather than expenditure-led fiscal correction. For instance, among the 14 states, Bihar and Odisha have performed better due to the structural measures adopted by the respective states. Increases in revenue mobilisation, upturns in central transfers, fiscal incentives to debt-deficit reduction, positive structural changes, constant fall in committed spending and drastic fall in the share of repayment of public debt (Asian Development Research Institute, 2007) have contributed to an improved fiscal situation. Odisha has improved its fiscal situation by adhering to both revenue-and-expenditure-led fiscal adjustment measures as well as reducing fiscal vulnerabilities to achieve the most sustainable form of correction. Bihar’s revenue expenditure has remained stagnant with a comparatively low rise in capital spending. In contrast, Kerala, Haryana, Punjab, Rajasthan, MP and West Bengal have slowed their fiscal correction and failed to wipe out their revenue deficits (Reserve Bank of India, 2016).
According to the phase-wise analysis, compared to the 1990s, in the wake of reform initiatives, the states’ own revenue as a percentage of GSDP has witnessed a progressive trend, but since 2011–12, no such progress has been noticed. With a constant rise in expenditure and stagnant growth in revenue receipts, the fiscal deficit continued to grow since 2011–12. Aggregate expenditure as a proportion of GSDP increased for all the states. The states’ total expenditure has increased by an average of 20.6% between 2012 and 2017 (Suhag & Tiwari, 2018). Among the major states, Punjab, West Bengal, Kerala, Haryana and Jharkhand spend a larger proportion of total expenditure on repayment of loans compared to their counterparts. Meanwhile, capital expenditure was comparatively high in Bihar, Uttar Pradesh, Odisha and Madhya Pradesh. In Tamil Nadu, Karnataka, Gujarat, MP and AP, a disproportionately large amount has been spent on committed services and capital expenditure. Poor tax buoyancy, negligible share of non-tax revenue, and exogenous factors with enhanced expenditure requirements have put a disproportionate fiscal burden on the states, which could have further contributed to an increased resource gap and higher dependency on obligatory sources of revenue. Even with an increase in expenditure, states’ efforts towards revenue generation have not been satisfactory despite the introduction of several tax reforms (VAT and GST) in the post-FRBM period.
It is evident from the analysis of FDR1 that states tend to invariably depend more on non-own revenue sources. Hence, it is essential to further examine the significance of the role of federal transfers and borrowings in reducing the resource gap using other types of fiscal dependency (FDR2 and FDR3).
Fiscal Dependency (FDR2)
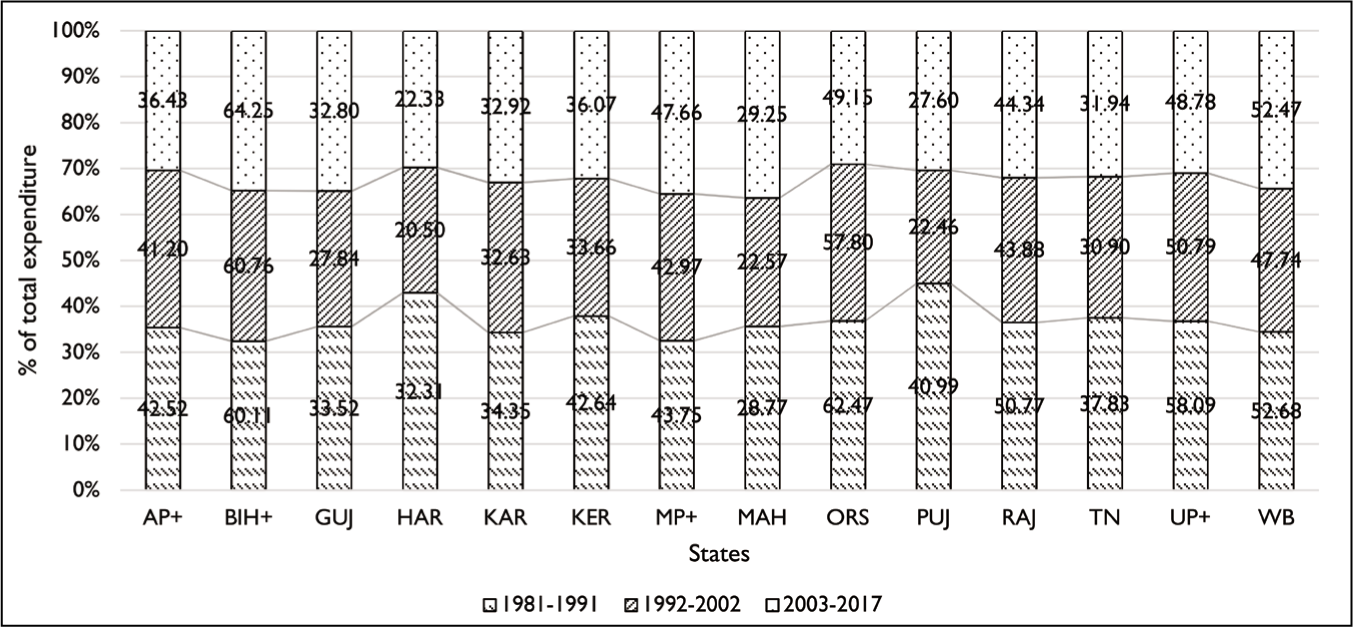
Figure 1 depicts the state-wise fiscal dependency ratios (FDR2) including own-source revenue and some components of capital receipts in a phase-wise manner.The difference between FDR1 and FDR2 indicates the crucial role played by capital receipts in reducing the resource gap with a major contribution from PABs, NSSF loans and so on (Figure 2). The pattern of financing GFD by states has undergone a drastic change in the aftermath of the recommendations of the Twelfth FC. Compared to the 1980s and 1990s, in the last decade, preference among different components of internal borrowing has varied across the states.
State-wise Fiscal Dependency Ratios (FDR2).
State-wise Fiscal Dependency on Internal Borrowings (FDR1–FDR2).
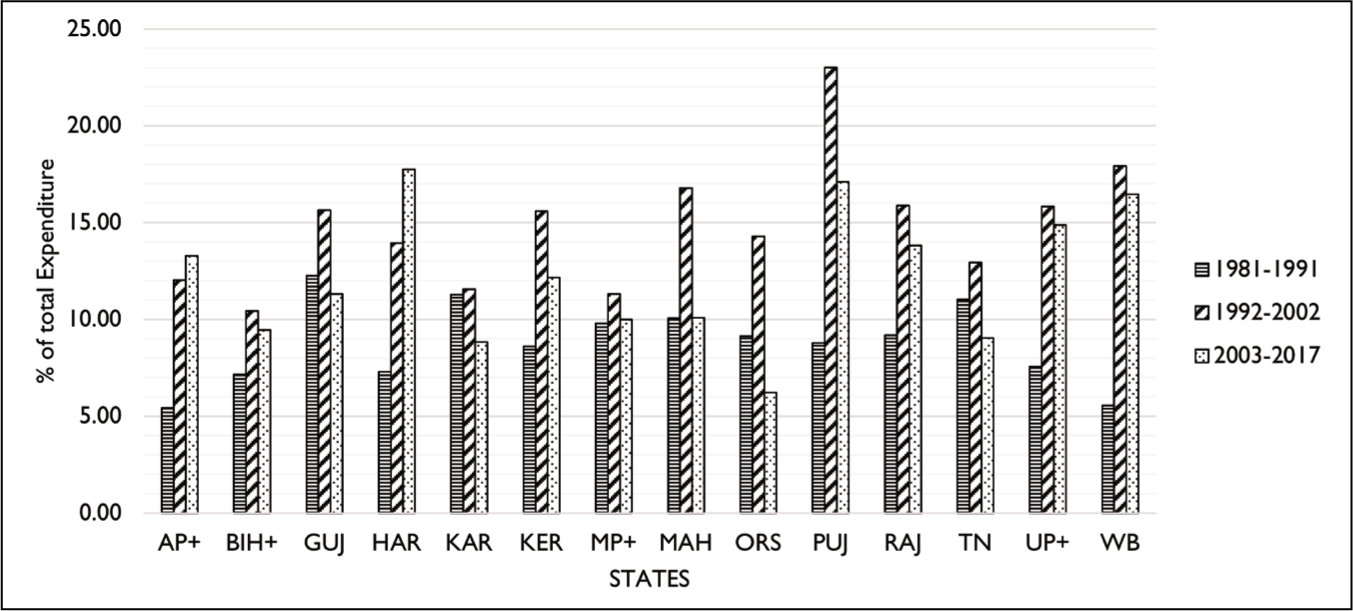
In the process of fiscal adjustment, central loans, which formed the major obligatory source of revenue for states, were replaced by national small saving funds in the late 1990s and remained a dominant source of revenue till 2004–05. After the enforcement of several debt-relief schemes, a drastic fall in the dependency on central loans and lower volume of NSSF borrowing is noticeable, though its proportion varies across the states. Market borrowing is emerging as a major obligatory source of revenue with a corresponding phasing out of NSSF. However, the share of provident funds and other deposits, which is the major component of PABs, continues to be a major obligatory source for the states. The share of deposits and advances, small savings and state provident funds in PAB has not changed. Even after a decline in the dependency on NSSFs, a huge quantum of surplus cash balance remains with the states due to continued dependency on PABs, loans from financial institutions, small savings and provident funds, and market borrowings.
States have experienced a significant structural change in their dependence on different components of total debt. Among the 14 states, Punjab and Maharashtra are less dependent on capital receipts such as PABs, FIs and NSSFs, while Punjab, Haryana, Kerala, Gujarat and West Bengal are more dependent on external sources of revenue to finance their spending. Uttar Pradesh, followed by AP, Rajasthan, Kerala, Maharashtra and Karnataka, continues to be more dependent on PABs, while a significant fall has been observed in Odisha, Tamil Nadu, Gujarat, Maharashtra and Haryana. Besides, Kerala, Punjab, Haryana, Odisha, Madhya Pradesh, West Bengal and Uttar Pradesh have remained relatively more dependent on state provident funds. However, West Bengal, Gujarat, Bihar, Maharashtra, Kerala, Punjab, Haryana, Odisha, MP and UP are more dependent on NSSFs. Even after the enactment of FRBM Act and debt reform measures as part of fiscal adjustment, despite the heterogeneity in the extent of dependency on various components of capital receipts, majority of the states continue to be highly dependent on them (Rao & Shah, 2009).
A comparison of FDR1 and FDR2 provides a clear picture of how the pattern of borrowing from different sources for financing states’ spending has changed over time. Further, the extension of FDR also helps to understand the proportion of the states’ dependency on central statutory transfers.
Fiscal Dependency (FDR3)
Inadequacy of own revenue receipts collected by states is supplemented by federal transfers in the form of grants and shared taxes. The difference between FDR2 and FDR3 shows the ratio of expenditure financed by central funds, which are statutory in nature, has increased significantly in the third sub-period, as against the first two sub-periods (Table 4).
State-wise Fiscal Dependency Ratios (FDR3).
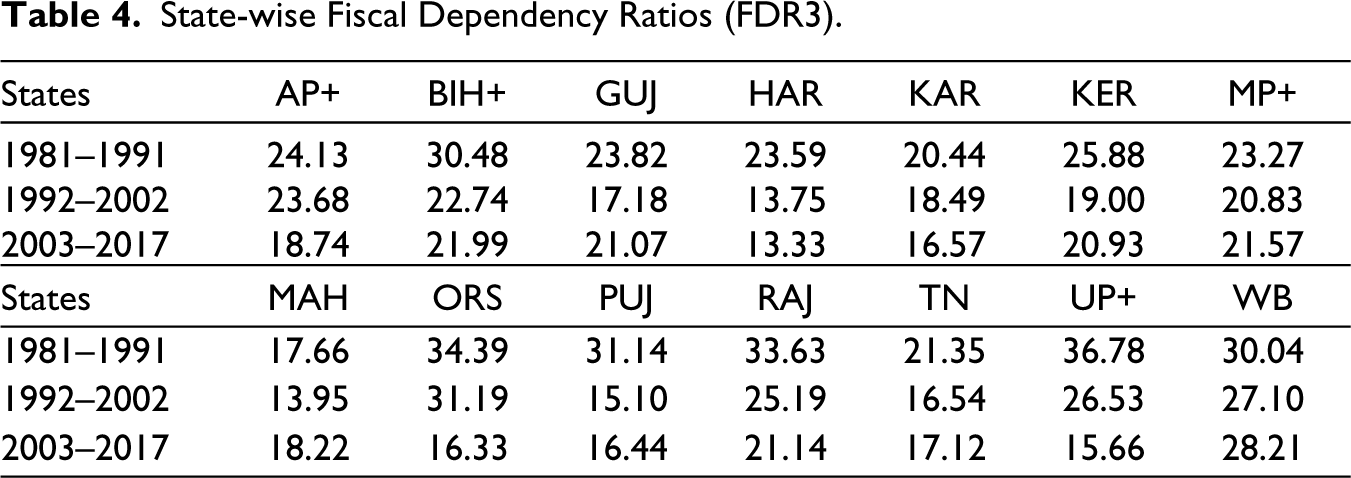
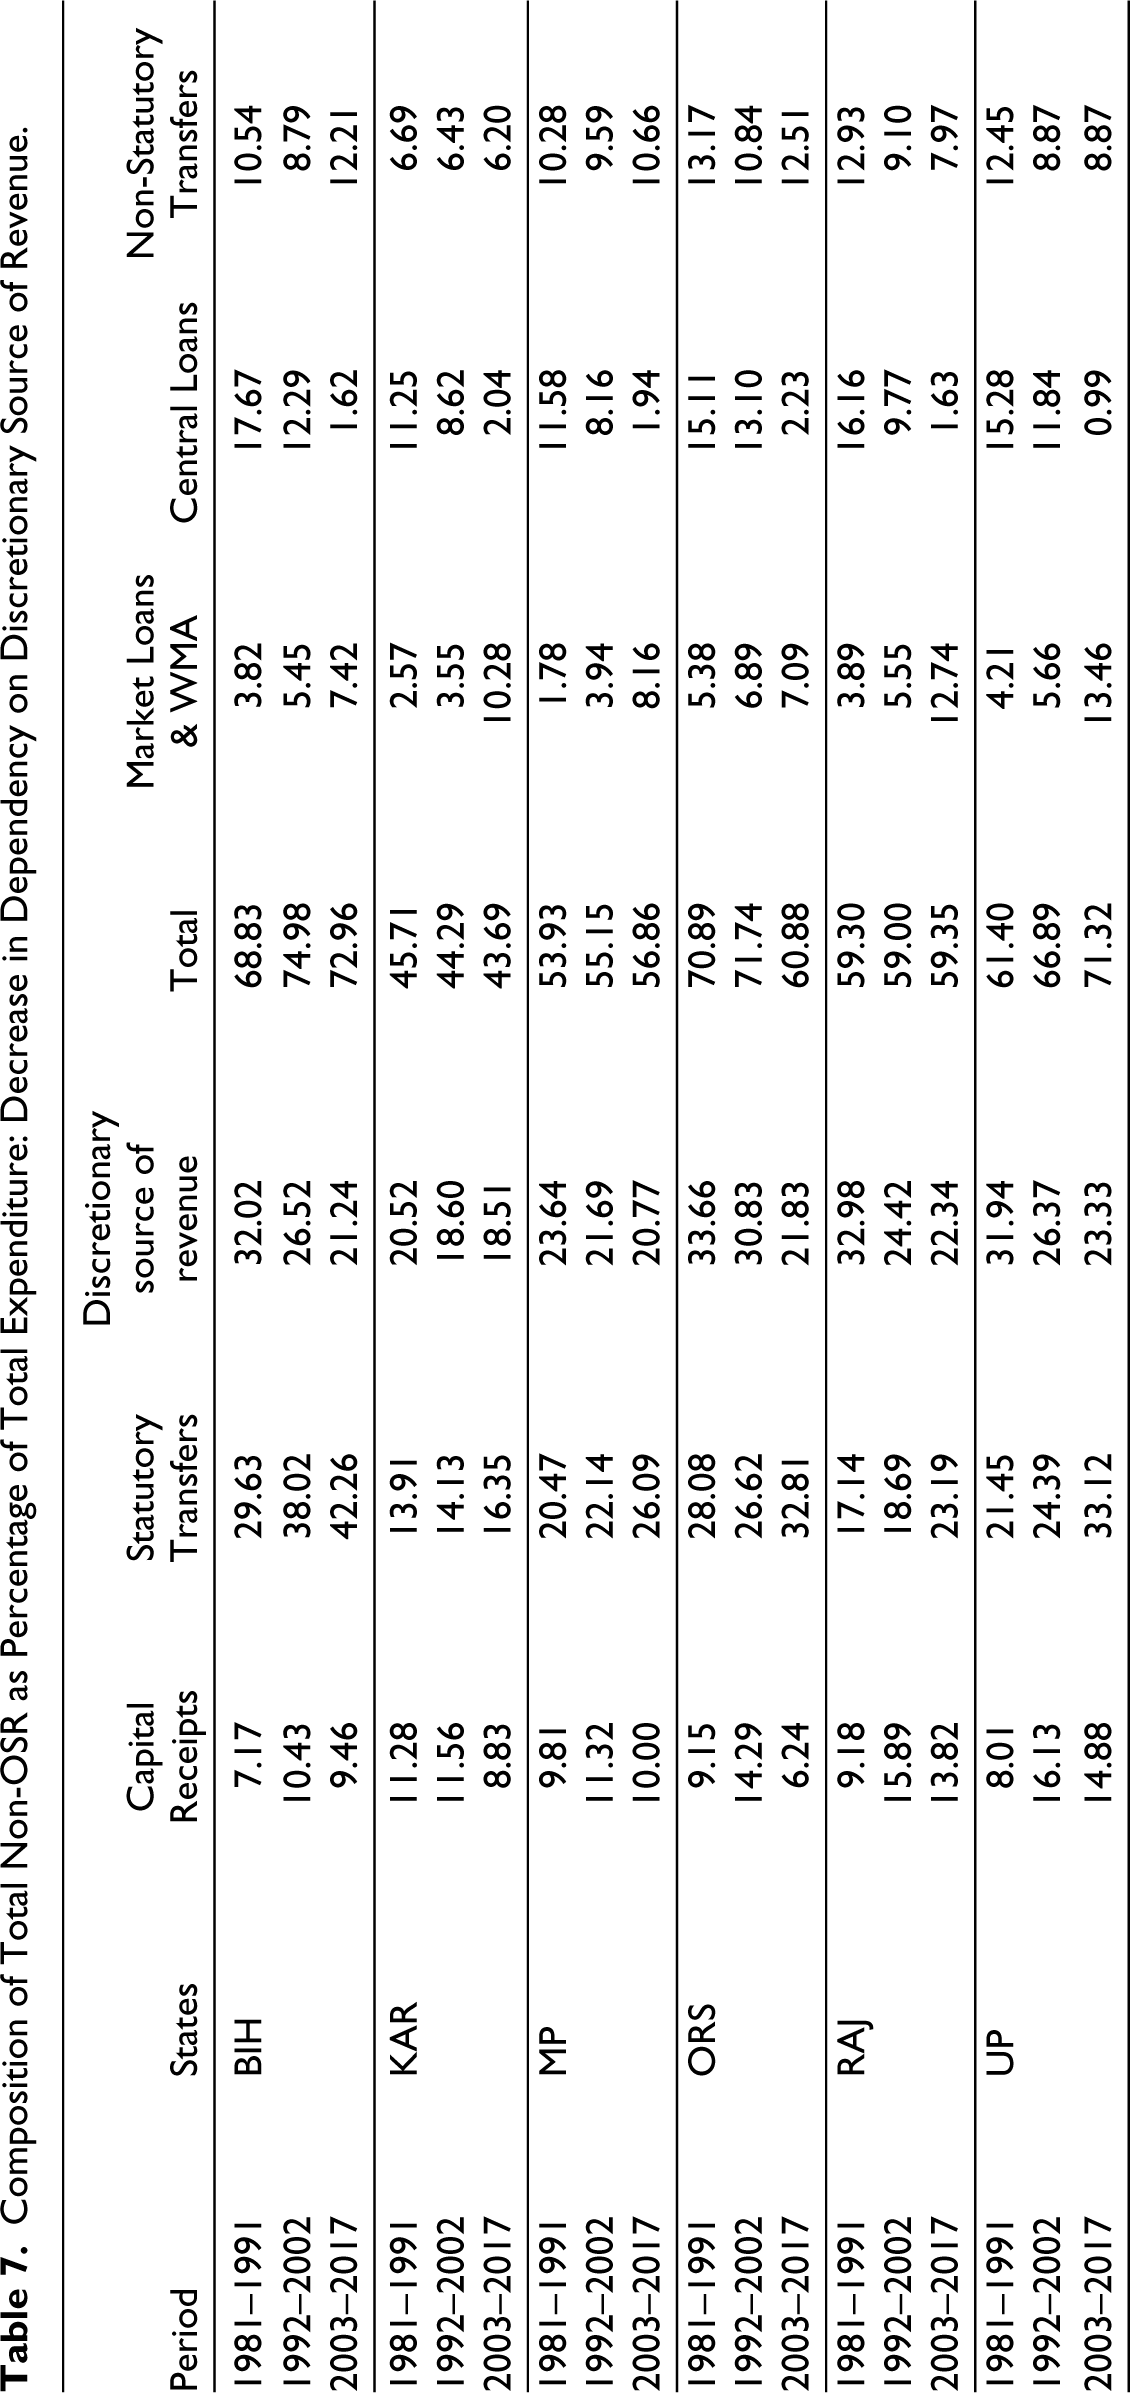
The share of transfers to total expenditure witnessed a progressive growth in almost all the states, particularly resulting from the awards of the Eleventh and Twelfth FCs. Bihar, Uttar Pradesh, Madhya Pradesh, West Bengal and Odisha have a larger share in total transfers (Table 7). During the Fourteenth FC, states that have maintained revenue surplus and fiscal discipline at the cost of social and economic development were less benefitted and even penalised for their good fiscal response, whereas high-income states were able to receive a larger share in grants even though they failed to follow the FRBM norms.
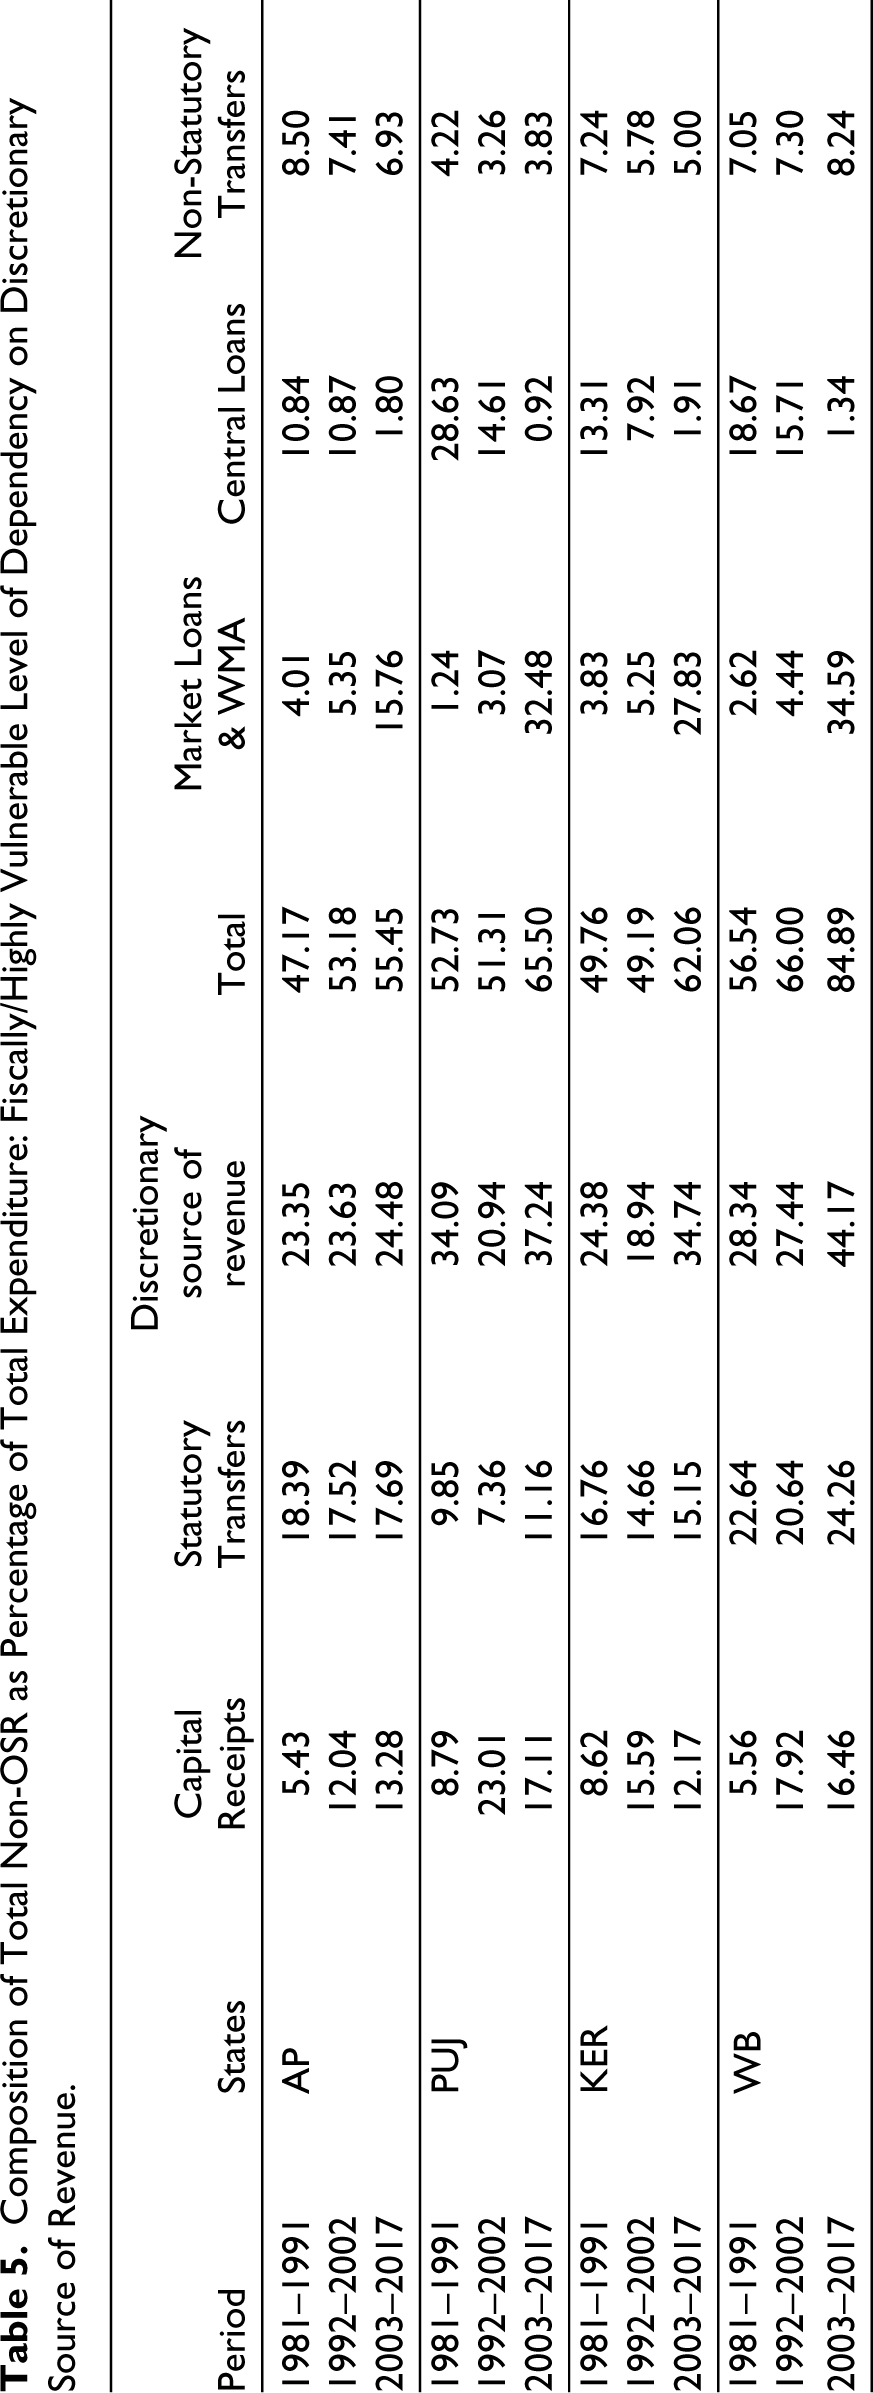
Composition of Total Non-OSR as Percentage of Total Expenditure: Fiscally/Highly Vulnerable Level of Dependency on Discretionary Source of Revenue.
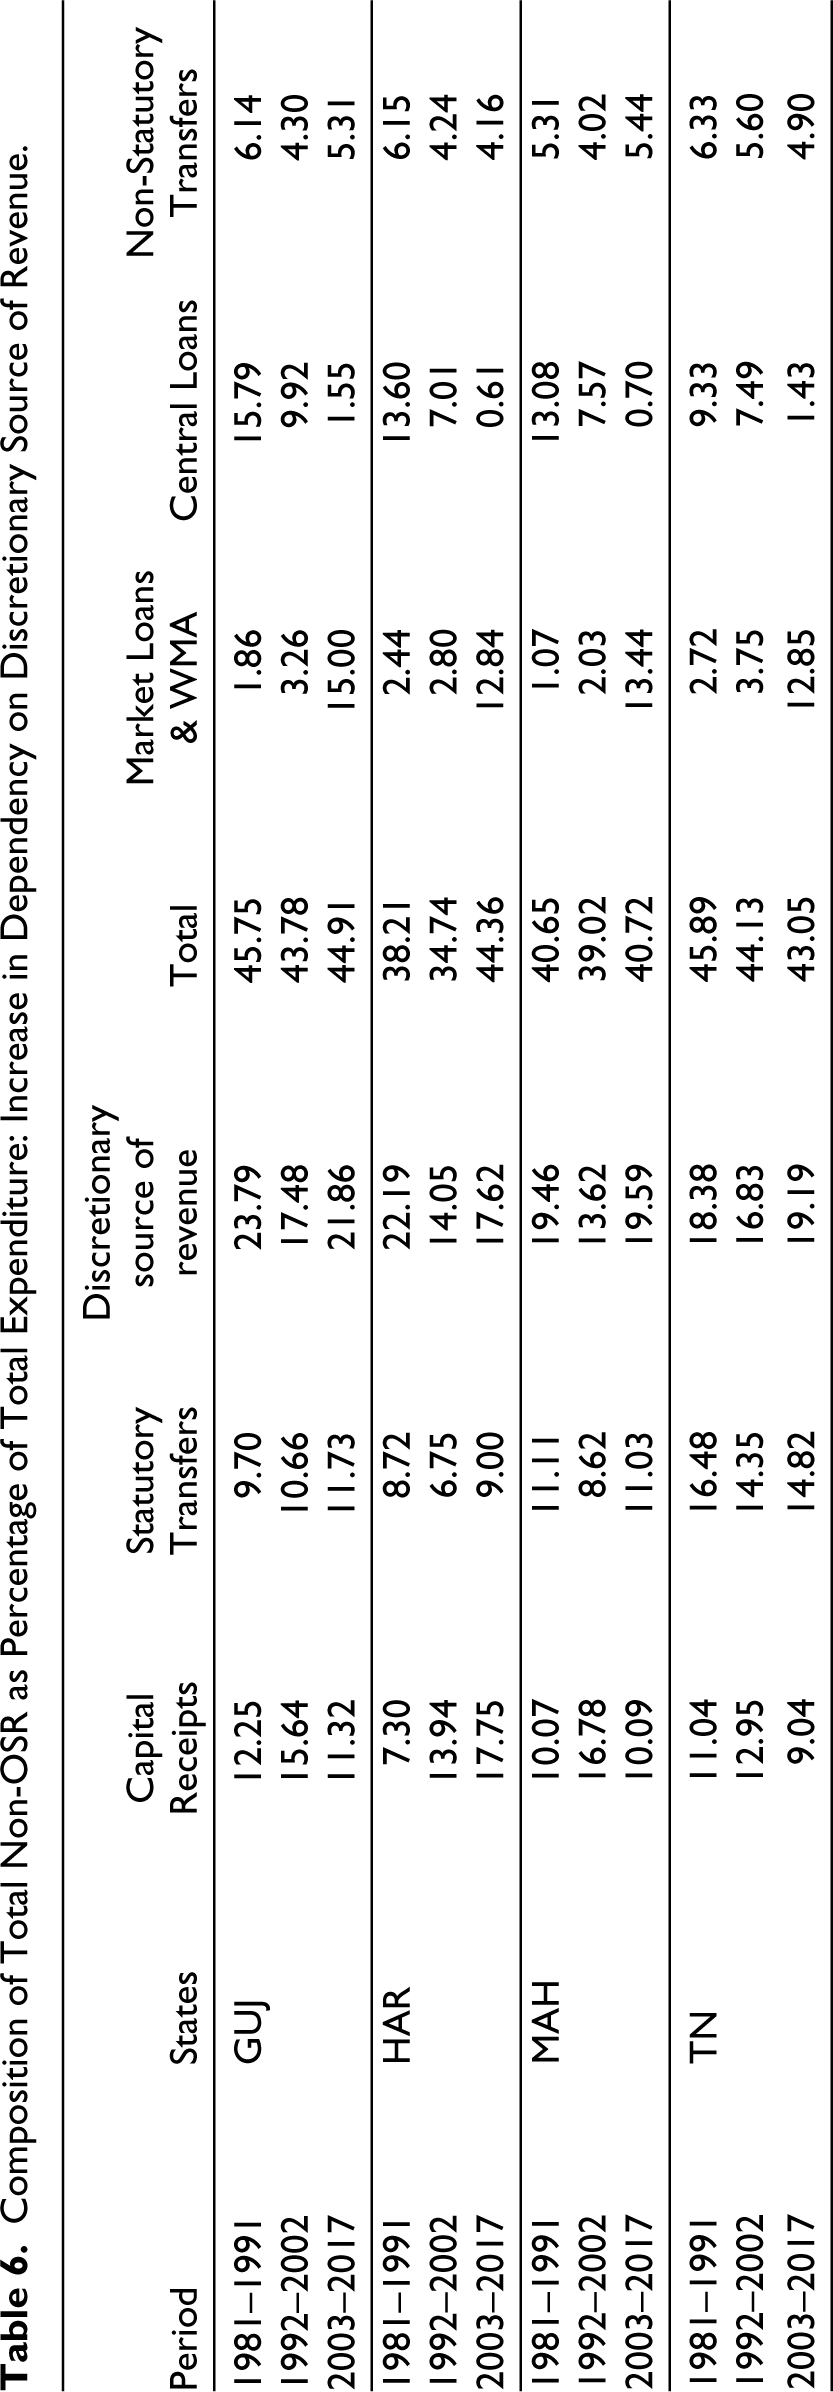
Composition of Total Non-OSR as Percentage of Total Expenditure: Increase in Dependency on Discretionary Source of Revenue.
Composition of Total Non-OSR as Percentage of Total Expenditure: Decrease in Dependency on Discretionary Source of Revenue.
FDR3 reveals the remaining fiscal gap that needs to be financed through obligatory sources of revenue (market borrowing, WMA, central loans and non-statutory transfers), which are costlier and come under central government discretion (Table 4).
Overall, the above analysis indicates that the inadequacy of own revenue receipts collected by states is supplemented by federal transfers and different forms of capital receipts. As revealed by the analysis of FDR, states have insufficient revenue to match their growing service obligations and have become heavily transfer-dependent and borrowing-dependent in the due course of time. Keeping this in mind, the extension of analysis on states’ fiscal dependence on transfers and borrowings, which together constitute total non-OSR on the disaggregated level, allows for an in-depth understanding of the extent of vulnerability and the quality of dependence. To decompose the level and extent of states’ fiscal dependence on total non-OSR on the disaggregated level, we followed the methodology adopted by Rao and Srivastava (2014). 9 Of the three major components of the total non-OSR, discretionary source of revenue (market loans, WMA, central loans and non-statutory transfers) is costlier and requires central government consent and discretion. However, capital receipts (recovery of loans and advances, net public accounts, internal debt excluding market loans, WMA and central loans) are relatively less costly and do not require central consent. Finally, statutory transfers are non-obligatory in nature.
The decomposing analysis of non-OSR as a ratio of total expenditure (from Tables 5 to 7) provides a useful assessment of the fiscal health of states across the three sub-periods under study. The classification of states is backed by the nature of their dependency on different components of non-OSR, which shows substantial heterogeneity across the states in the means of dependency on various components of revenue. On average, overall dependency on non-OSR remained above 50% of the total expenditure in UP, Bihar, Kerala, Punjab, West Bengal, MP and AP. However, it remained above 60%–80% in Kerala, Punjab, UP, Bihar and West Bengal. In contrast, in Karnataka, Haryana, Maharashtra, Tamil Nadu and Gujarat, it remained less than 50%. The inter-state comparison shows that Odisha, Bihar and Karnataka have remained relatively less dependent on total non-OSR. Nonetheless, Punjab, Haryana, Kerala, and West Bengal have recorded the highest levels of dependency and even continued to be more reliant on discretionary sources of revenue than their counterparts in the due course of time.
Of the three components of non-OSR, dependency on capital receipts has decreased in the third sub-period in almost all the states except Haryana and AP. Apart from these two states, dependency on capital receipts is relatively higher in Punjab, UP, West Bengal, Kerala and Rajasthan. Meanwhile, dependency on statutory transfers and discretionary source of revenue has continued to dominate in the majority of the states.
In the 1990s, relative share of discretionary source of revenue was higher in Odisha, Bihar, UP and West Bengal. Over time, Odisha, Bihar and UP were able to constantly decrease their dependency on discretionary transfers, followed by fiscal correction measures during the post-reform period compared to their counterparts. Parallelly, they also remained major beneficiaries of central statutory transfers, which further contributed to being less reliant on market borrowings. In contrast, the fiscal performance of majority of the states under middle- and higher-income categories has deteriorated, and these states have been more dependent on borrowings to finance their financial obligations. Of the 14 states, Haryana, Maharashtra, Tamil Nadu and Gujrat have steadily increased their dependency on discretionary transfers, which indicated their fiscal indiscipline, though their overall dependency on non-OSR remained less than 50%. Meanwhile, their share in federal transfers remained stagnant. Besides, the accumulation of unsustainably higher levels of debt and guarantees is an issue of concern in West Bengal, Punjab and Kerala, which have remained fiscally burdened even in the post-reform period.
Overall, the intra-state and inter-state disaggregated analysis of the different components of non-OSR indicates that the strength of fiscal correction has not remained uniform across the states and time. Poor-income states have shown better fiscal performance than higher-income states. Among the 14 states, very few states, such as Odisha and Bihar, have remained fiscally prudent and been consistent in fiscal management/empowerment for a longer period. Despite heterogeneity in the extent of dependency on various sources of revenue, majority of the states continue to be heavily dependent on discretionary sources even after FRBM Act, and debt reform measures were introduced as part of fiscal adjustment. With increasing revenue crunch and debt servicing obligations, to plug such revenue gap, states are becoming increasingly dependent on market borrowings. Severe setback in revenue mobilisation amidst the economic crisis followed by COVID-19 pandemic has forced states to increasingly depend on discretionary source of revenue in recent years. Despite the overall compositional shift in the borrowing and extent of reliance on different sources of capital and revenue receipts, states are likely to face upwards pressure to meet interest payment obligations on their market borrowing, besides crowding out of the private-sector borrowing, which may hamper the revival of the economy.
Conclusion
This analysis decomposes the level and pattern of fiscal dependency on the different components of revenue for 14 major Indian states from 1981–82 to 2016–17. As the key objective of the study, this article explored the level and changing trends in the process of states’ dependency on different components of revenue across the states.
It is evident from the comparative phase-wise analysis of FDRs that, even after the post-fiscal adjustment measures, the revenue gap persists with growing expenditure needs and dismal revenue performance in majority of the states. Overall, the pattern of financing states’ expenditure has undergone significant changes since the 1990s. An in-depth analysis of state finances reveals that the introduction of fiscal reform initiatives since the 1990s has improved the efficiency of revenue mobilisation in the states, although not uniformly across the states and time.
Following the COVID-19 pandemic crisis, the enormous fiscal burden on states’ exchequer, daunting fiscal challenges due to low tax buoyancy, tax restructuring initiatives (such as SGST in 2017) and huge current commitments on expenditure have led states to increasingly resort to off-budget borrowings to finance growing expenditure obligations. The states’ commitment towards hard budget constraints has not been progressive, as they increasingly resorted to off-budget borrowings and central funding for deficit financing to meet growing expenditure obligations. The most sustainable form of fiscal correction is fiscal adjustment through fiscal empowerment in addition to expenditure contraction measures without compromising the efficiency of spending. Hence, there is an urgent need to undertake a thorough expenditure review to weed out redundant and duplicative programmes to enhance fiscal space and to sustain it for a longer period. When the states get additional elbow room by way of enhanced resource availability through central assistance and external assistance, they must judiciously prioritise their spending pattern based on growth requirements even while allotting adequate funds to basic services of national priority. Overall, prudent fiscal management is crucial to sustain the process of growth. The path of fiscal adjustment needs to be appropriate and well planned to retain fiscal space and to pave the way for further development. The extent of dependency on various revenue sources, strategies that are adopted to mobilise more revenue, extent of borrowing, share of federal transfers and pattern of spending influence economic growth.
Footnotes
Acknowledgements
The authors are grateful to the anonymous referees of the journal for their insightful comments and valuable suggestions which have greatly contributed to the improvement of this paper.
Declaration of Conflicting Interests
The authors declared no potential conflicts of interest with respect to the research, authorship and/or publication of this article.
Funding
The authors received no financial support for the research, authorship and/or publication of this article.
Appendix
Interest Receipts to Revenue Receipts.
| Periods | AP | BH+ | Gujarat | Haryana | Karnataka | Kerala | MP+ |
| 1981–1990 | 8.3 | 11.3 | 10.3 | 10.6 | 8.5 | 11.1 | 8.1 |
| 1991–1996 | 13.6 | 20.8 | 15.6 | 12.0 | 11.7 | 17.3 | 12.8 |
| 1997–2002 | 19.9 | 20.9 | 21.5 | 20.4 | 16.2 | 24.1 | 16.8 |
| 2003–2008 | 18.9 | 15.8 | 25.0 | 15.6 | 12.9 | 23.7 | 15.0 |
| 2009–2016 | 11.6 | 8.6 | 17.2 | 15.4 | 9.3 | 17.1 | 7.4 |
| Periods | Maharashtra | Odisha | Punjab | Rajasthan | Tamil Nadu | UP+ | WB |
| 1981–1990 | 8.1 | 14.3 | 12.7 | 13.7 | 7.3 | 9.9 | 13.0 |
| 1991–1996 | 12.1 | 21.8 | 23.0 | 16.5 | 11.0 | 16.9 | 20.1 |
| 1997–2002 | 18.7 | 31.5 | 32.7 | 28.2 | 16.7 | 25.8 | 38.6 |
| 2003–2008 | 19.1 | 21.4 | 25.5 | 24.2 | 14.7 | 18.5 | 42.9 |
| 2009–2016 | 14.4 | 6.6 | 22.7 | 15.0 | 11.5 | 9.9 | 26.8 |