
Abstract
While the role of education in fostering social stability and increasing a country’s human capital is well recognised, there are debates on policies and institutional arrangements in this regard. In particular, parents’ choice of schools appears to be a critical issue as it can influence both educational outcomes and inclusiveness. Given that there is a broader homogeneity in infrastructure facilities available at both household and school levels, one would expect that household-related factors will influence the choice of schooling of children. This article examines such household-level factors that influence households’ choice of schools for children in selected areas of Kottayam District, Kerala. A primary survey was conducted in December 2021 comprising 300 households. Based on the results of the estimated binary logit and probit models, this article reports that the choice of school for children is significantly influenced by households’ ethnic background and economic status, and sex, education, and primary occupation of the family head. There is a higher likelihood of choosing public schools by households from the Scheduled Caste/Scheduled Tribe category, those living below the poverty line, or those with agriculture as the primary occupation. On the contrary, this likelihood is less for households with educated and male heads. However, the choice of school for children does not differ significantly between rural and urban households. Further, there is no gender inequality in choosing schools. The findings suggest that future government policies should emphasise infrastructure development and quality improvement in government schools to promote socio-economic inclusion in education.
Introduction
Attaining education is vital for human development (Mallick et al., 2016; Nayyar, 2008). It is widely recognised that education plays a crucial role in fostering social stability, enhancing productivity and facilitating economic progress (Barro, 1979; Lucas, 1988; Ravallion & Chen, 1997). Education also enhances the well-being of individuals and generates positive externalities for society. 1 Education, through human capital formation, stimulates economic expansion and productivity by endowing individuals with knowledge and abilities (Teixeira & Queirós, 2016). Therefore, it is imperative to prioritise advancements in education and nurture human capital by means of infrastructure development and the provision of diverse support services. Educational institutions, in particular schools, play a crucial role in providing educational outcomes through the provision of organised learning environments, high-quality teaching and extensive support services to students.
Parents are important stakeholders in a country’s educational system since they are actively engaged in their children’s education (Pandey et al., 2009). It is imperative to recognise the inherent inequality in the opportunities and resources accessible to parents regarding their capacity to support their children’s education. Decision-making pertaining to the choice of school is a complex process that is affected by a multitude of factors, such as the socio-economic, cultural and educational environment (Chaturvedi, 2021). According to Lohan et al. (2020), infrastructure has a significant impact on educational outcomes, and parents prefer schools with a high-quality infrastructure and better education. 2 It is perceived that learning outcomes in private schools are better compared with others (ASER Centre, 2022; Ministry of Education, 2021). Some studies (Kumar & Choudhury, 2021; Singh, 2015) also found that private schools provide better learning outcomes than government schools. Hence, parents, especially those with higher income, choose private schools to provide their children with quality education (Ministry of Statistics and Programme Implementation [MoSPI], 2020).
Despite considerable expenditure made by the government, enrolment in government schools in India has declined (Kingdon, 2020), whereas that in private schools has increased (Chaturvedi, 2021). However, Kerala is an exception to this trend: students’ enrolment in government schools in Kerala has increased from 2018–19 onwards (State Planning Board, 2019). The Public Education Rejuvenation Campaign of the state government of Kerala in 2016 seems to have been instrumental in the revival of public education and the improvement in enrolment in public schools. This programme was designed to increase enrolment in public schools throughout the state through an emphasis on the equivalent role of teachers, parents and students in education.
However, government schools have a proportionately higher presence of Scheduled Castes (SC) and Scheduled Tribes (ST) 3 students compared with aided and private schools in Kerala (State Planning Board, 2021). In 2007–08, enrolment of SC and ST students in unaided schools was less than 3% and 0.40%, respectively, and remained around 4% and 0.46% in 2021–22 (Directorate of General Education, 2021). Hence, households from economically and socially disadvantaged groups rely heavily on government schools. On the contrary, among households with higher income, preference for government schools has declined and that for private schools has increased (Narwana, 2019).
The existing studies have focused primarily on the dynamics of the increase in the preference for private schools in India (e.g. Chudgar & Creed, 2016; Härmä, 2009; Kingdon, 2020), fee structure therein (e.g., Chattopadhay & Roy, 2017; Mousumi & Kusakabe, 2019), and the role of socio-economic and demographic factors influencing parents’ choice of schools (Kaur, 2017; Singh, 2015). However, given the overall homogeneity of infrastructure facilities at both school and household levels (State Planning Board, 2021), differences in the choice of schools seem to be influenced by household-level factors.
In this context, the objective of this article is to identify the factors that influence the decision-making of households regarding the choice of school in the selected areas of the state. This study has special significance in designing appropriate intervention strategies as Kerala stands out from other states in terms of its high literacy rate and gender equality in education according to the National Family Health Survey (NFHS) (Ministry of Health and Family Welfare, 2021). The following section discusses the specifications of econometric models, sources of data, and estimation techniques used in this study. The subsequent section presents and analyses the results and major findings, whereas the last section summarises the findings with a conclusion and policy recommendations.
Methodology and Study Area
Description of Study Area
This article uses primary data collected from sample households and schools from selected areas of Kottayam District of Kerala, India. Table 1 shows that the proportion of educational expenditure among total expenditure is higher in Kerala than in other major Indian states and the national average. Similarly, the proportion of educational expenditure among the social sector expenditure has also been consistently higher in Kerala than that at the national level (Figure 1).
Share of Educational Expenditure in Total Expenditure in Major Indian States (%).
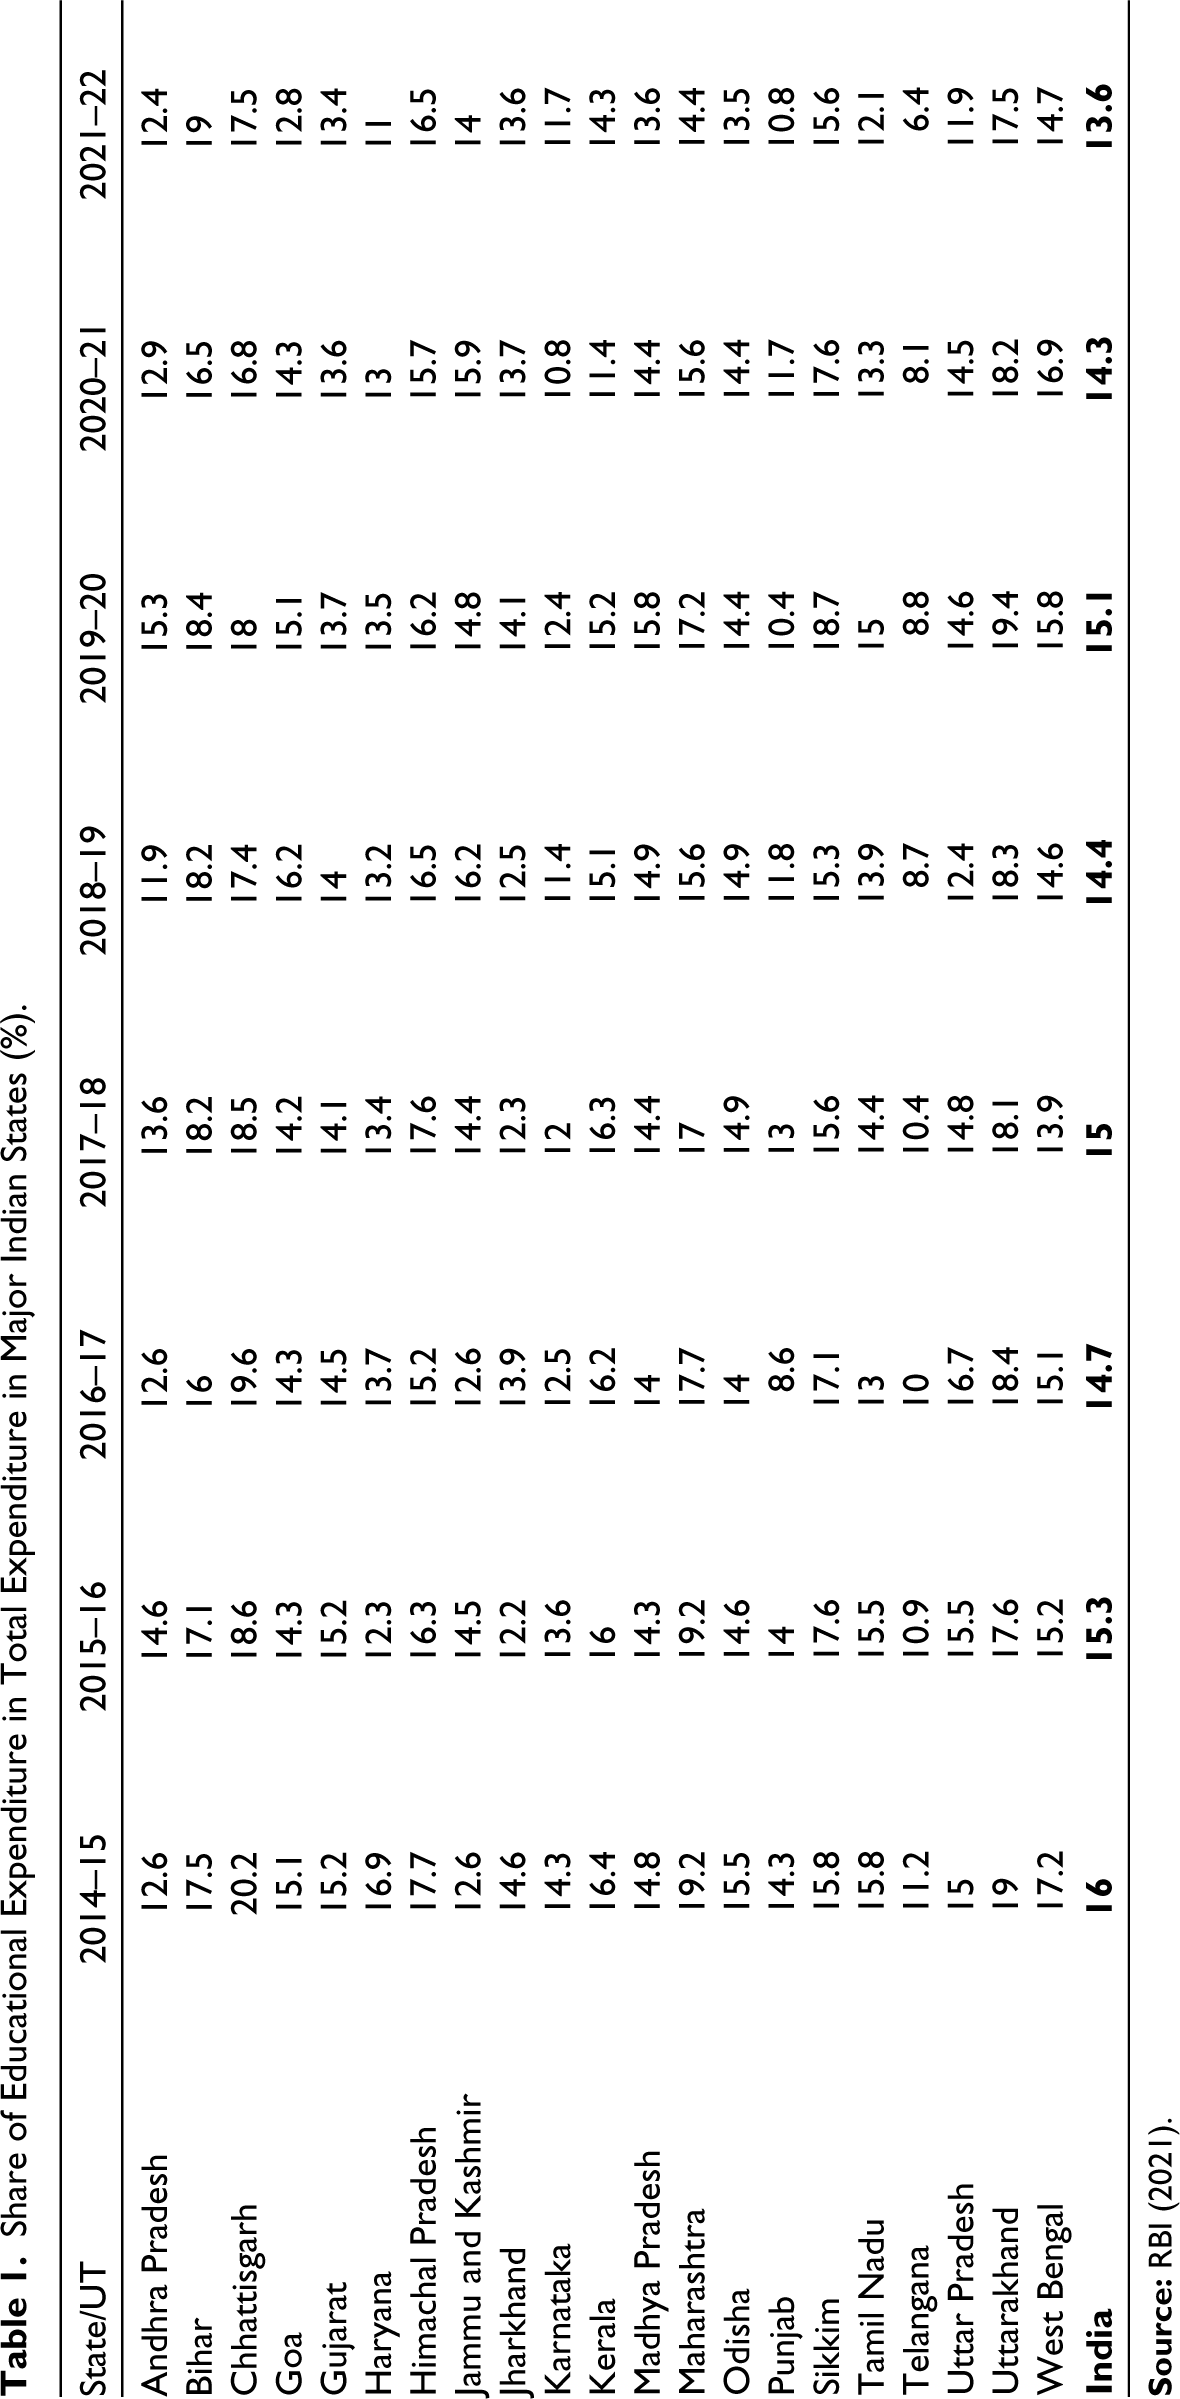
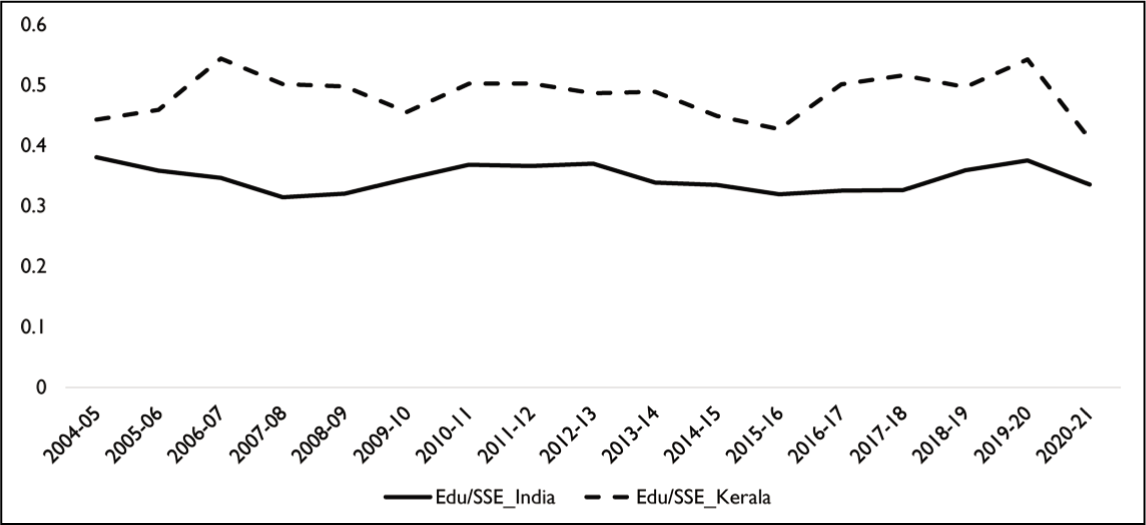
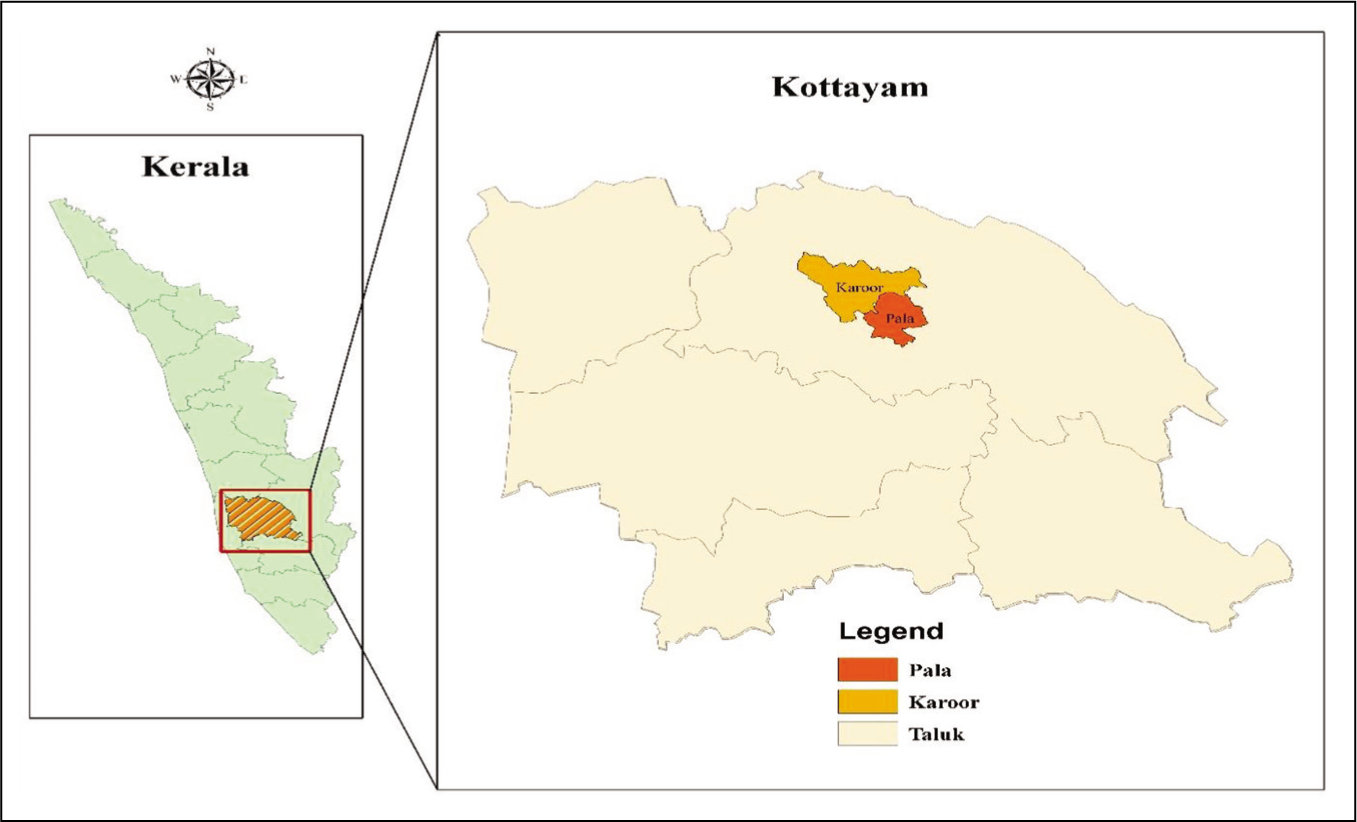
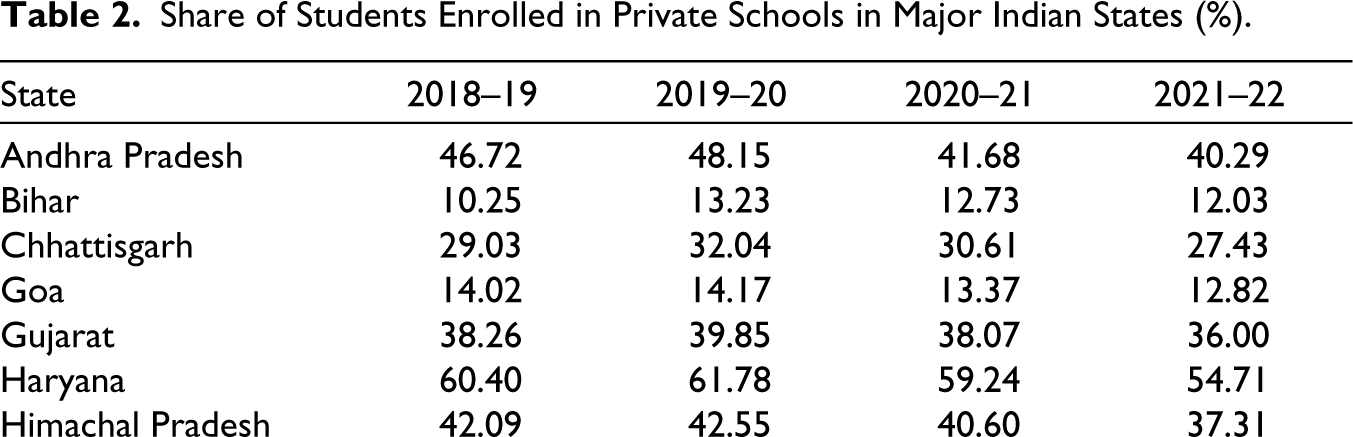
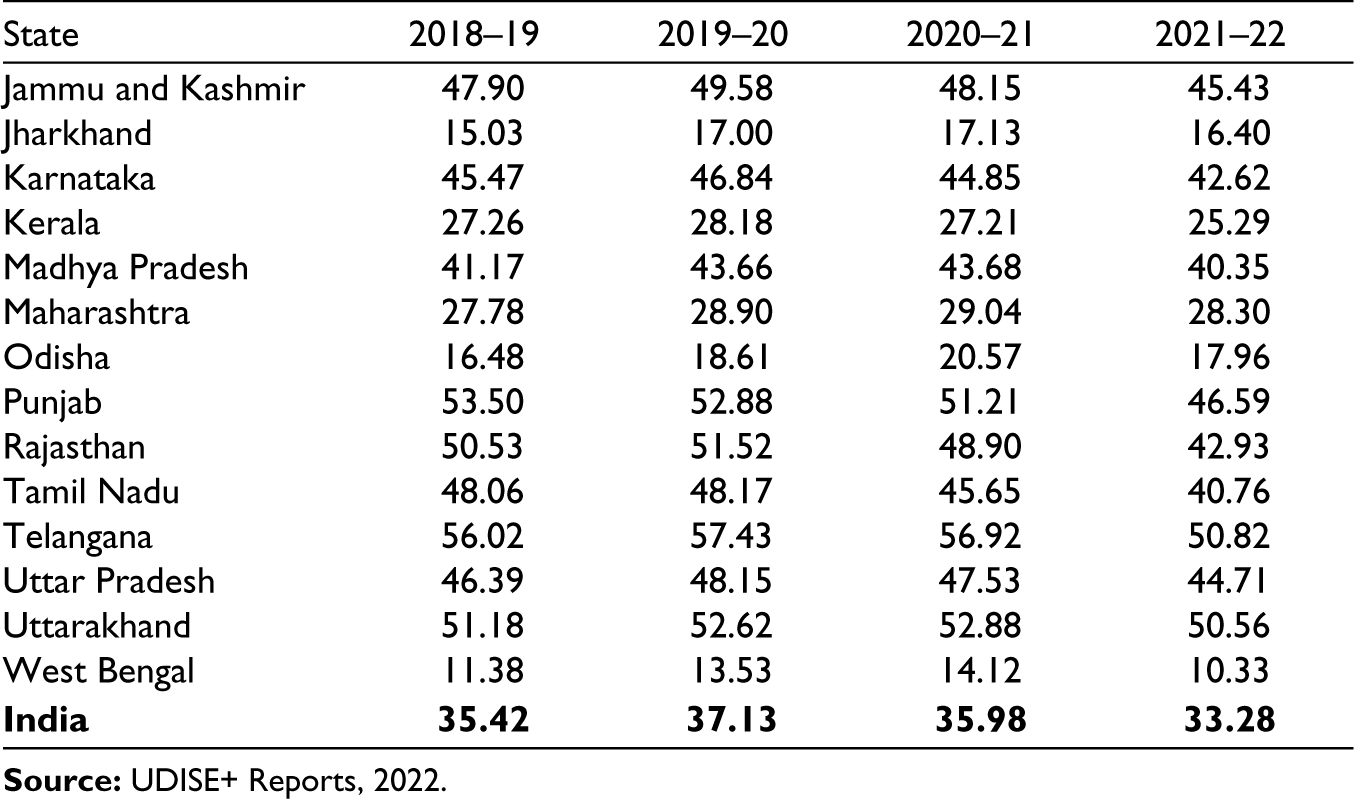
Table 2 shows the proportion of students attending private schools in major Indian states during the academic years from 2018–19 to 2021–22. For example, states such as Bihar, Chhattisgarh, Goa, Jharkhand, Kerala, Maharashtra, Odisha and West Bengal had a very low proportion of students attending private schools during this period (State Planning Board, 2021), possibly due to regional differences in educational preferences and socio-economic conditions along with differences in state-level policies and institutional arrangements (ASER Centre, 2022). 4 Importantly, studies have shown a decreasing tendency of enrolment of students in private schools at the national level, indicating a growing preference towards the public educational system in the country, and the New Education Policy 2020 seems to have played an important role in this regard.
Share of Students Enrolled in Private Schools in Major Indian States (%).
Notably, Kottayam District in Kerala is known for its distinct socio-economic and educational characteristics. It showed the highest literacy rate in the past two censuses, including total, female and male literacy rates (State Planning Board, 2021). Further, as per the multidimensional poverty index (MPI), the states with the lowest poverty rate are as follows: Kerala (0.71%), Goa (3.76%), Sikkim (3.82%), Tamil Nadu (4.89%) and Punjab (5.59%). Notably, Kottayam District is the only district in the country that registered zero poverty as per the MPI (NITI Aayog, 2021). As per the 2011 Census of India, Kottayam District has a population of 1,974,551 with 11 blocks and 487,296 households. There are 71 gram panchayats and six municipalities 5 with a population density of 895. Further, it has a favourable sex ratio of 1,071 females for 1,000 males. In addition, it also has the fifth highest emigrant population and the fourth highest per capita income in the state (State Planning Board, 2021).
Figure 2 shows location of the study area. Kottayam District was chosen as the study area because of its socio-economic and educational status compared with other districts in Kerala. It has the fourth highest literacy rate in India (Ministry of Home Affairs, 2011). The district headquarters Kottayam town, known as the ‘city of letters’, gained the status of ‘100 per cent literate town’ in 1989. According to the NFHS 2021, 99% of the female population in the district is literate. In addition, Kottayam District has the third highest private school enrolment rate in the country (43.5% of students seeking admission to private schools). 6 There are 922 schools for 158,513 students (i.e., one school for every 172 students) in the district (State Planning Board, 2021), which is the second highest school–student ratio after Pathanamthitta District. These different dimensions of socio-economic and demographic characteristics make Kottayam District distinct.
Since there are no major differences in school infrastructure facilities in the study area, sample households were selected randomly. Nevertheless, socio-economic and other characteristics of the sample households largely match with those of the households at both state and district levels (Table 3).
Basic Information on Sample Households vis-à-vis that for Kottayam District and Kerala.
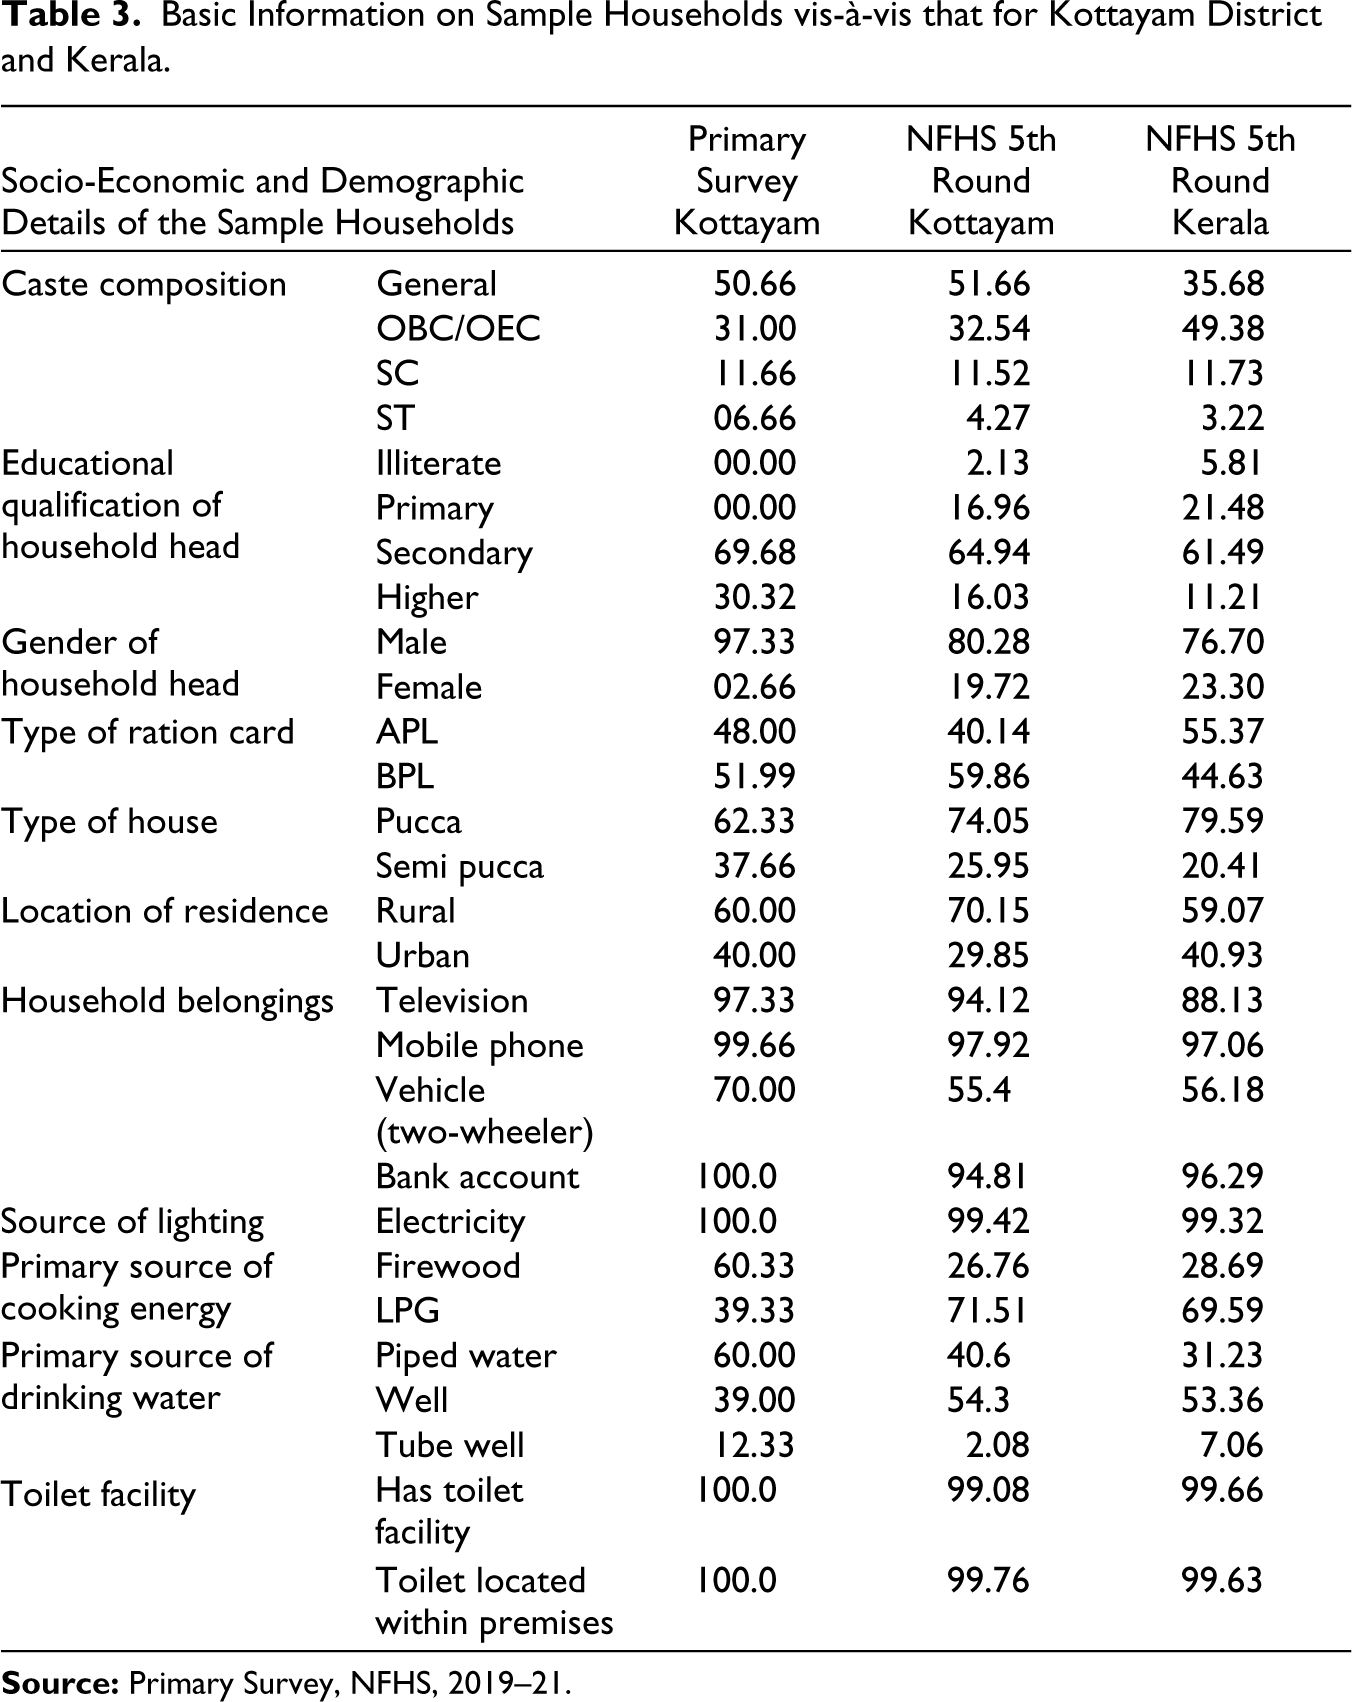
Table 3 presents the socio-economic and demographic characteristics of the sample households and those of households across Kottayam District and the state of Kerala. The similarities observed across several aspects indicate that the conclusions drawn from the sample households can be reasonably generalised to both district and state levels. Similarities are observed in socio-economic and demographic characteristics and basic amenities available at the household level. Thus, the consistency in socio-economic and demographic characteristics among the sample households and that at the district and state levels imply that the conclusions drawn based on the sample can be generalised to a broader population. This indicates that the analysis in the present article can offer significant insights for policymakers and other stakeholders. Broadly, policies and interventions suggested based on the insights from the sample households may apply to addressing wider socio-economic and demographic issues in Kottayam District and Kerala.
A primary survey was conducted in December 2021, and data were collected from 50 schools and 300 households from the selected areas of the district. Further, one panchayat (Karoor) and one municipality (Pala) were considered to capture possible rural–urban variations. In addition, focus-group discussions were conducted in December 2022 to verify the information gathered during the primary survey and validate the findings. The findings were also validated using various secondary data sources such as the Annual Status of Education Report (ASER), the Unified District Information System for Education (UDISE+) report of 2021–22, and the National Achievement Survey (NAS) 2021 report. The ASER assesses education quality in rural areas annually. The survey was designed to provide a snapshot of the schooling status of children aged 3–16 years in rural India. UDISE+ reports, published by the Government of India, are comprehensive data sets that collect information from institutions that provide formal education to students at the pre-primary level to Class XII. The Ministry of Education carries out NAS to assess students’ learning. The present study is completely based on the primary survey, and the insights from the ASER, UDISE+ and NAS are also included to set the perspective of the study and substantiate the findings.
Specification of Econometric Models
Field experience does not show any difference in infrastructure facilities at both household and school levels. Hence, these aspects are unlikely to cause any difference in households’ choice of schools. Accordingly, this article focuses on examining household-level factors only.
Since the dependent variable (i.e., choice of school) is binary, this article estimates both logit and probit models as specified in Equations 1 and 2, respectively
8
:
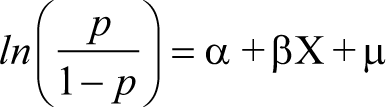
where p is the probability of choosing a government school, α represents the intercept, β is the vector of coefficients of the independent variables, and µ is the random disturbance term.
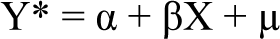
where Y is the dependent variable, α represents the intercept, β is the vector of coefficients of the independent variables, and µ is the random disturbance term.
Based on the literature review and the above discussions, the following relationships are envisaged in this article:
Model 1: Choice of Institution = f (ethnic background, sex of the household head, place of residence, education level of the household head, primary occupation of the household head, type of ration card, family type) Model 2: Choice of Institution = f (ethnic background, sex of the household head, place of residence, education level of the household head, primary occupation of the household head, annual income, family type)
Here, parents’ choice of type of school for their children is taken as the dependent variable. There are primarily three categories of schools in Kerala, namely government, aided and private schools (State Planning Board, 2021). Government and aided schools are clubbed together into a single category as they have similar fee structures and implications for affordability. Furthermore, these schools follow largely similar rules and regulations. Since this article primarily aims to examine how socio-demographic and economic factors at the household level influence the choice of schools, such clubbing is unlikely to cause any distortions in the findings. Nevertheless, future studies can consider further categorisation of schools for deeper understanding in this regard.
In Kerala, infrastructure facilities available across different schools are uniform 9 (Ministry of Education, 2022; State Planning Board, 2021), and differences observed in learning outcomes across various schools are not substantial. For example, the percentage of Class VIII students who can read Class II texts is 81.8 and 87.8 in government and private schools, respectively, whereas it is 66.2% and 80.0%, respectively, at the national level. Thus, learning outcomes are largely similar across different types of schools in Kerala according to the NAS (Ministry of Education, 2021). Hence, it is imperative to examine the impact of other socio-economic and demographic aspects (Ayyangar et al., 2020; Kumar & Choudhury, 2021). Accordingly, only different household characteristics are included as independent variables in the econometric models.
Existing studies show that ethnic background is an important factor that affects the enrolment of students in schools 10 (Ayyangar et al., 2020; Härmä, 2009; Kumar & Choudhury, 2021). Hence, to capture the impact of the ethnic background on decisions about the choice of school, caste is included as an independent variable. Given that the possibility of people from marginalised sections and poor families choosing private schools for their children is low, economic variables such as the primary occupation of the household head and annual income 11 are included as independent variables to capture these aspects (Ayyangar et al., 2020; Gouda & Sekher, 2014; Kumar & Choudhury, 2021). Besides, authorities issue ration cards depending on households’ socio-economic status; hence, the type of ration card also indicates the same (Murarkar et al., 2020; Pandey & Chaubal, 2011). Accordingly, the type of ration card is considered a proxy to capture households’ affordability, along with household income.
Furthermore, proximity to school can also influence the choice of school by the parents (Kumar & Choudhury, 2021; Vij & Farhan, 2018). Hence, location of residence is included as another independent variable in the econometric models. In addition, since making an individual decision may be difficult in a joint family (Dhanaraj & Mahambare, 2019), family structure is also likely to play a role in this regard. In around 78% of the households, the head is male, and the decisions regarding household-related aspects are made by the male members of the family (Ministry of Health and Family Welfare, 2021; Scaria, 2014). Hence, to include such household-level dynamics, sex and education of the household head are added as other explanatory variables. It is expected that household heads with higher education have more information about the benefits of education and hence choose school for their children differently (Jones, 2018; Kumar & Choudhury, 2021; Woodhead et al., 2013).
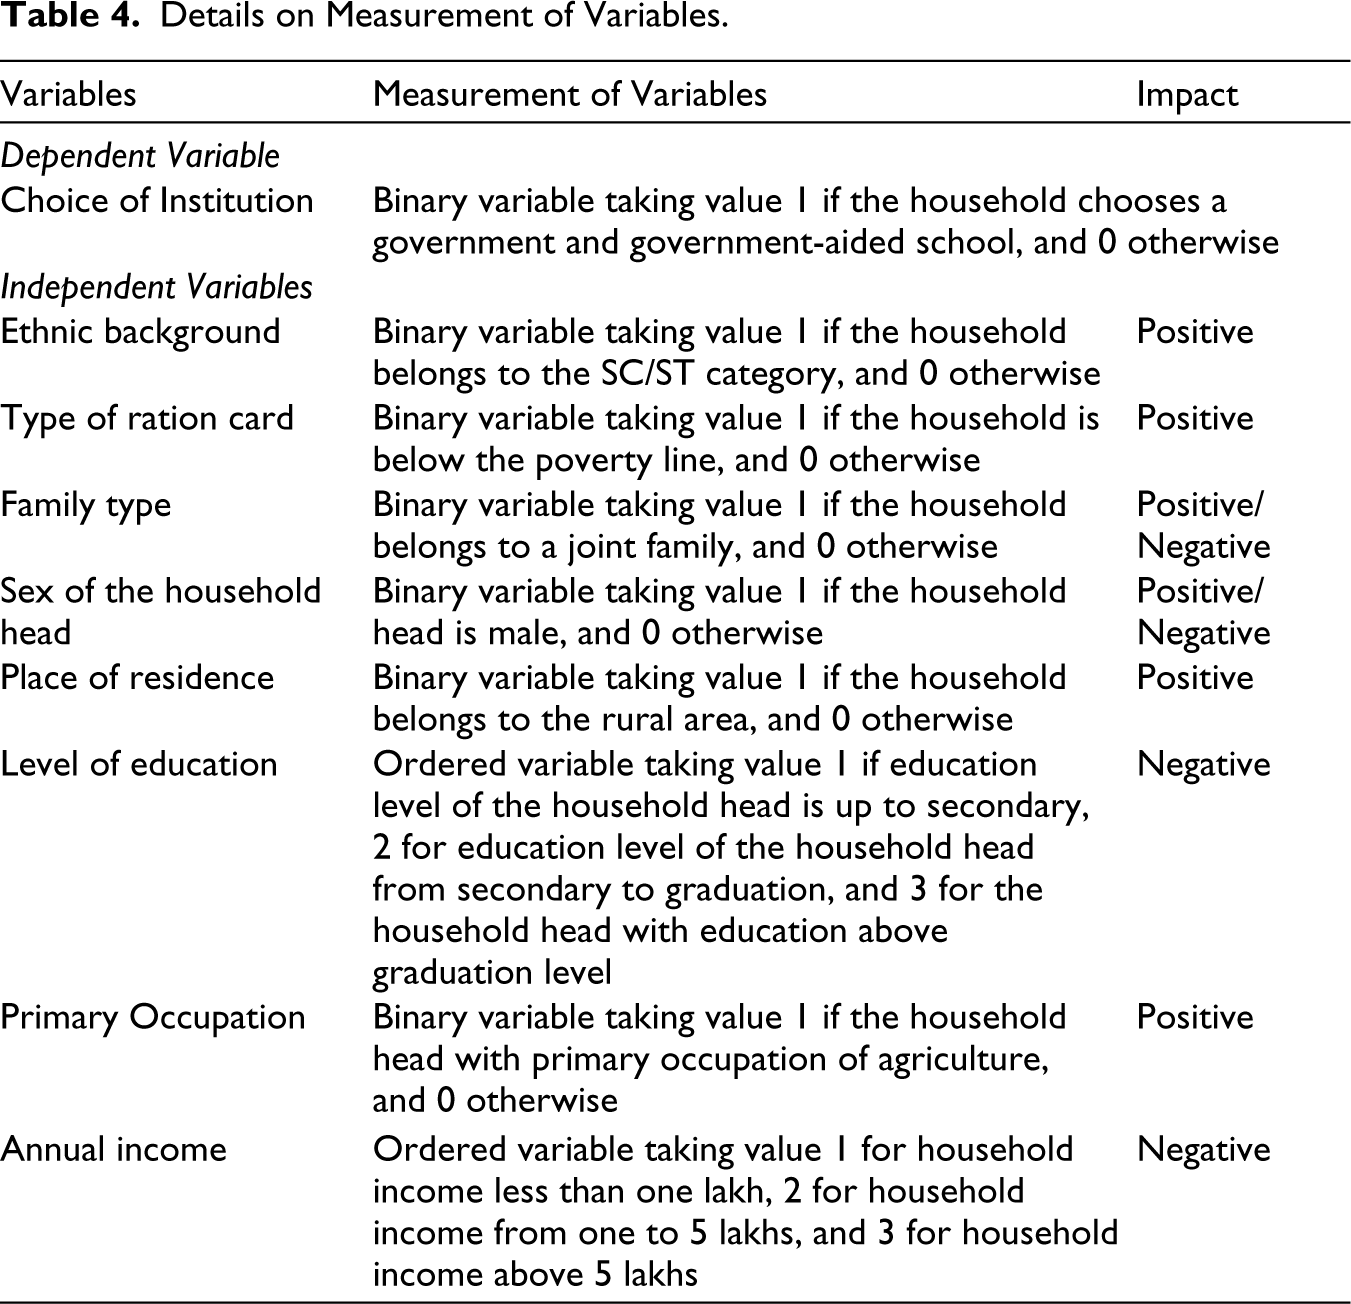
The details of the variables are given in Table 4. All the variables except education level and annual income are binary. Further, education level and annual income are considered ordered variables.
Details on Measurement of Variables.
Estimating binary logit and probit models to examine the incidence of school choice as a binary dependent variable has numerous advantages as compared to other econometric approaches such as ordered models (Ayyangar et al., 2020; Khan, 2022; Kumar & Choudhury, 2021). The choice between binary models and ordered models is based on whether the research focuses on incidence or extent. Binary models are appropriate for situations where the dependent variable can have only two possibilities, and the purpose is to determine the incidence (Mishra & Mishra, 2017). In contrast, ordered models are designed for response variables that are ranked or ordinal in nature (Swain & Mishra, 2020). They investigate the degree or the extent of the event or characteristic across ordered categories (Nayak et al., 2018). The present study focuses on the incidence of selecting a type of school rather than its extent. Hence, both binary logit and probit models have been estimated for econometric analysis. While the logit model follows a logistic distribution, the probit model is based on a normal distribution. The former measures the response variable as the natural logarithm of the odds ratio, whereas the latter considers it as the probability of success. Nevertheless, both models often give similar results. It is expected that consistency in findings across these two models will ensure the robustness of the econometric analysis. Since the data are at the individual level, the maximum likelihood method is applied to estimate the models (Gujarati & Porter, 2009). With most variables being binary in nature, there is less likelihood of the multicollinearity problem.
Results and Discussion
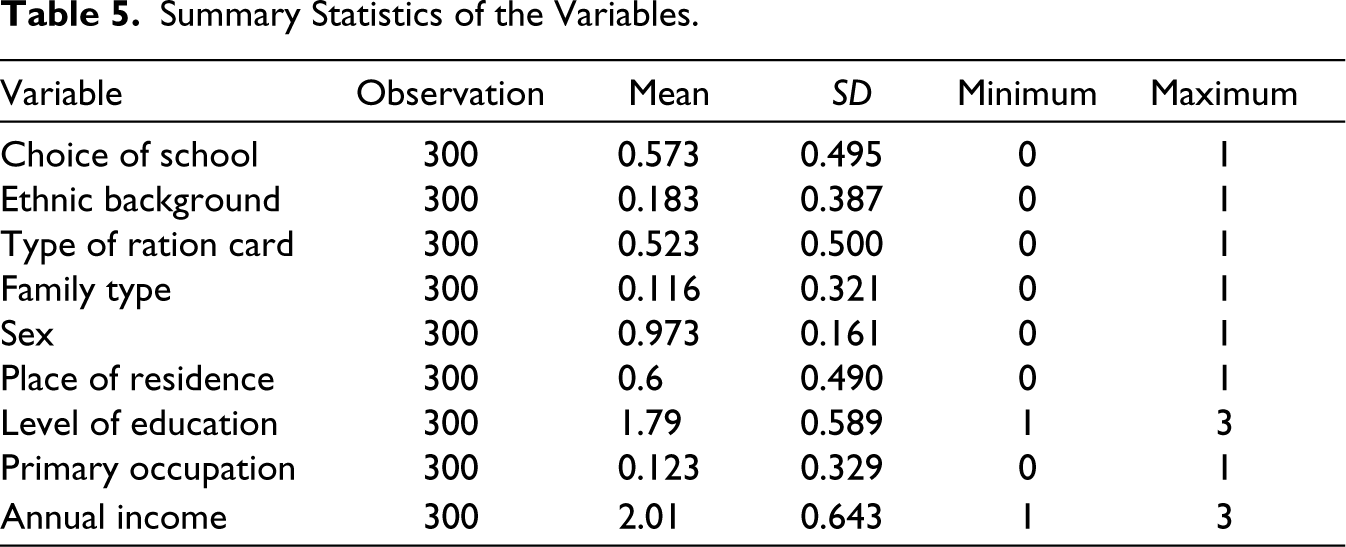
The summary statistics of the variables are presented in Table 5, and the regression results are presented in Tables 6 and 7. This article estimates both binary logit and probit models to examine the factors influencing parents’ choice of school for their children. The Pearson goodness-of-fit test is used to ensure that the estimated model is correctly specified.
Summary Statistics of the Variables.
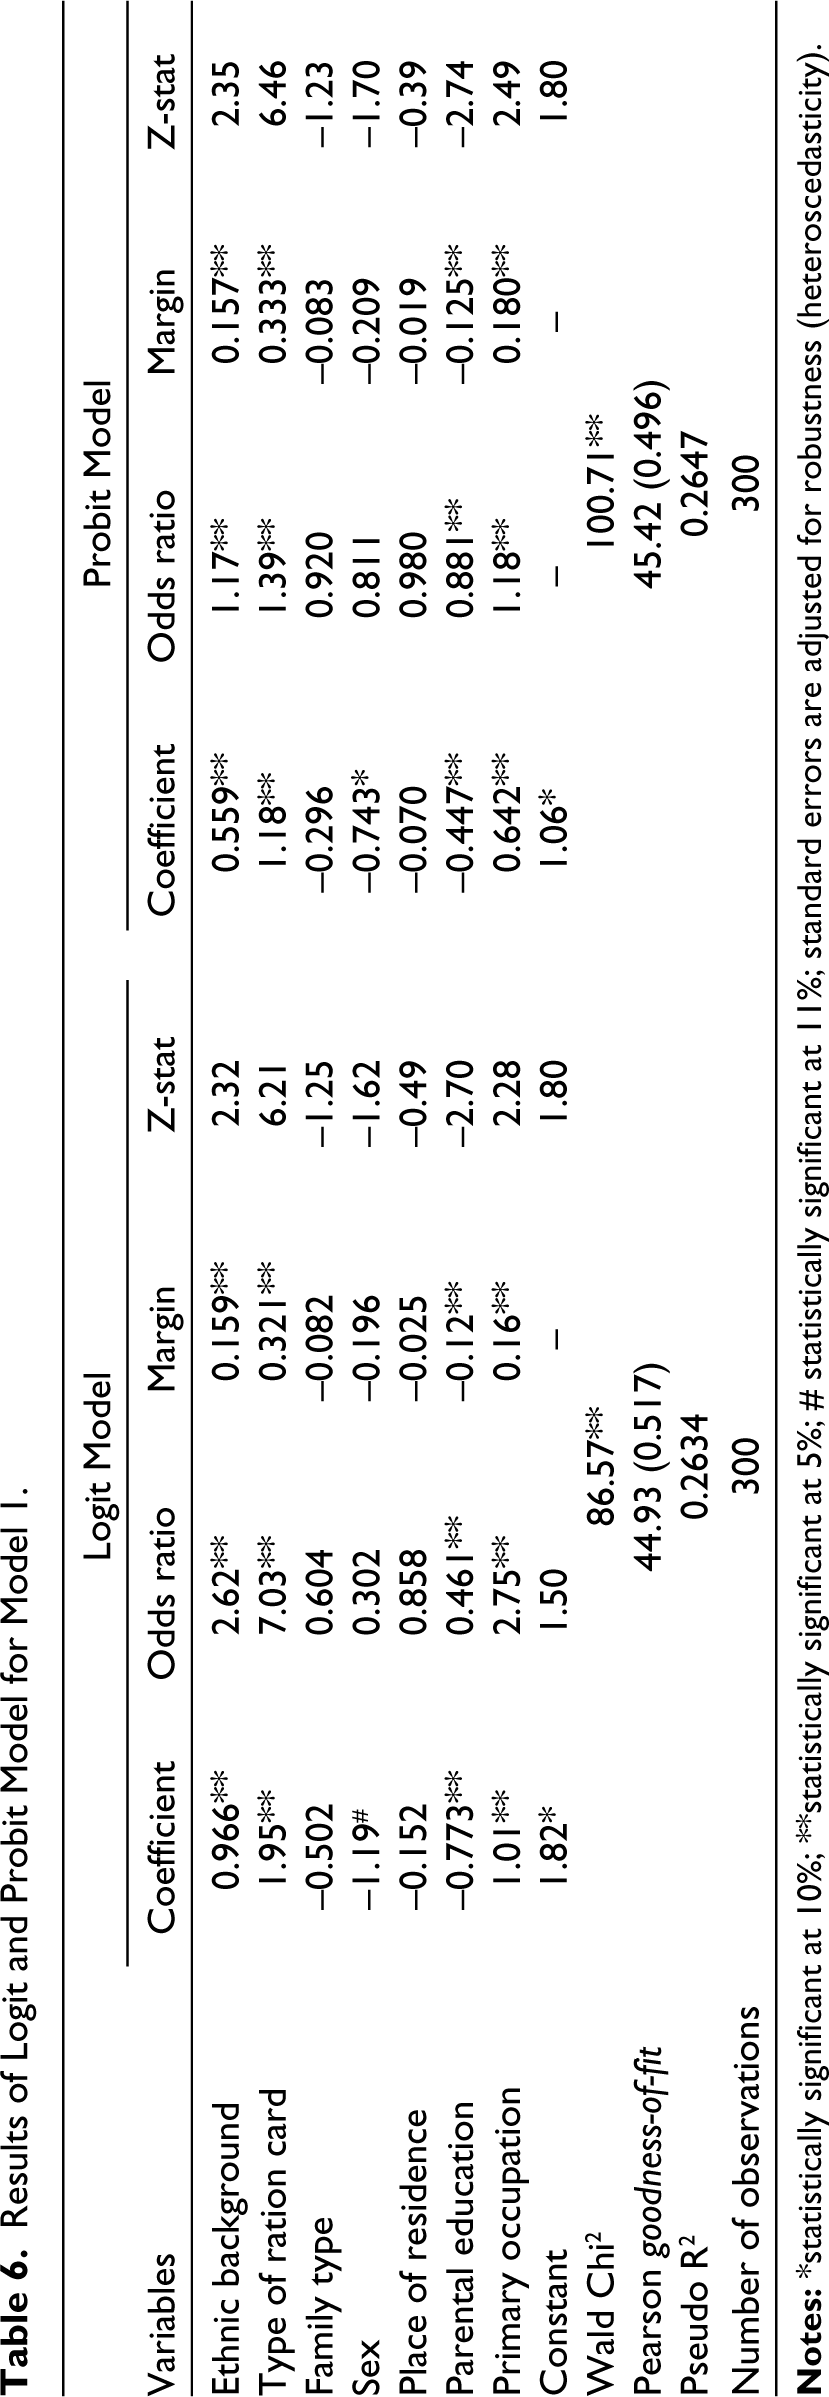
Results of Logit and Probit Model for Model 1.
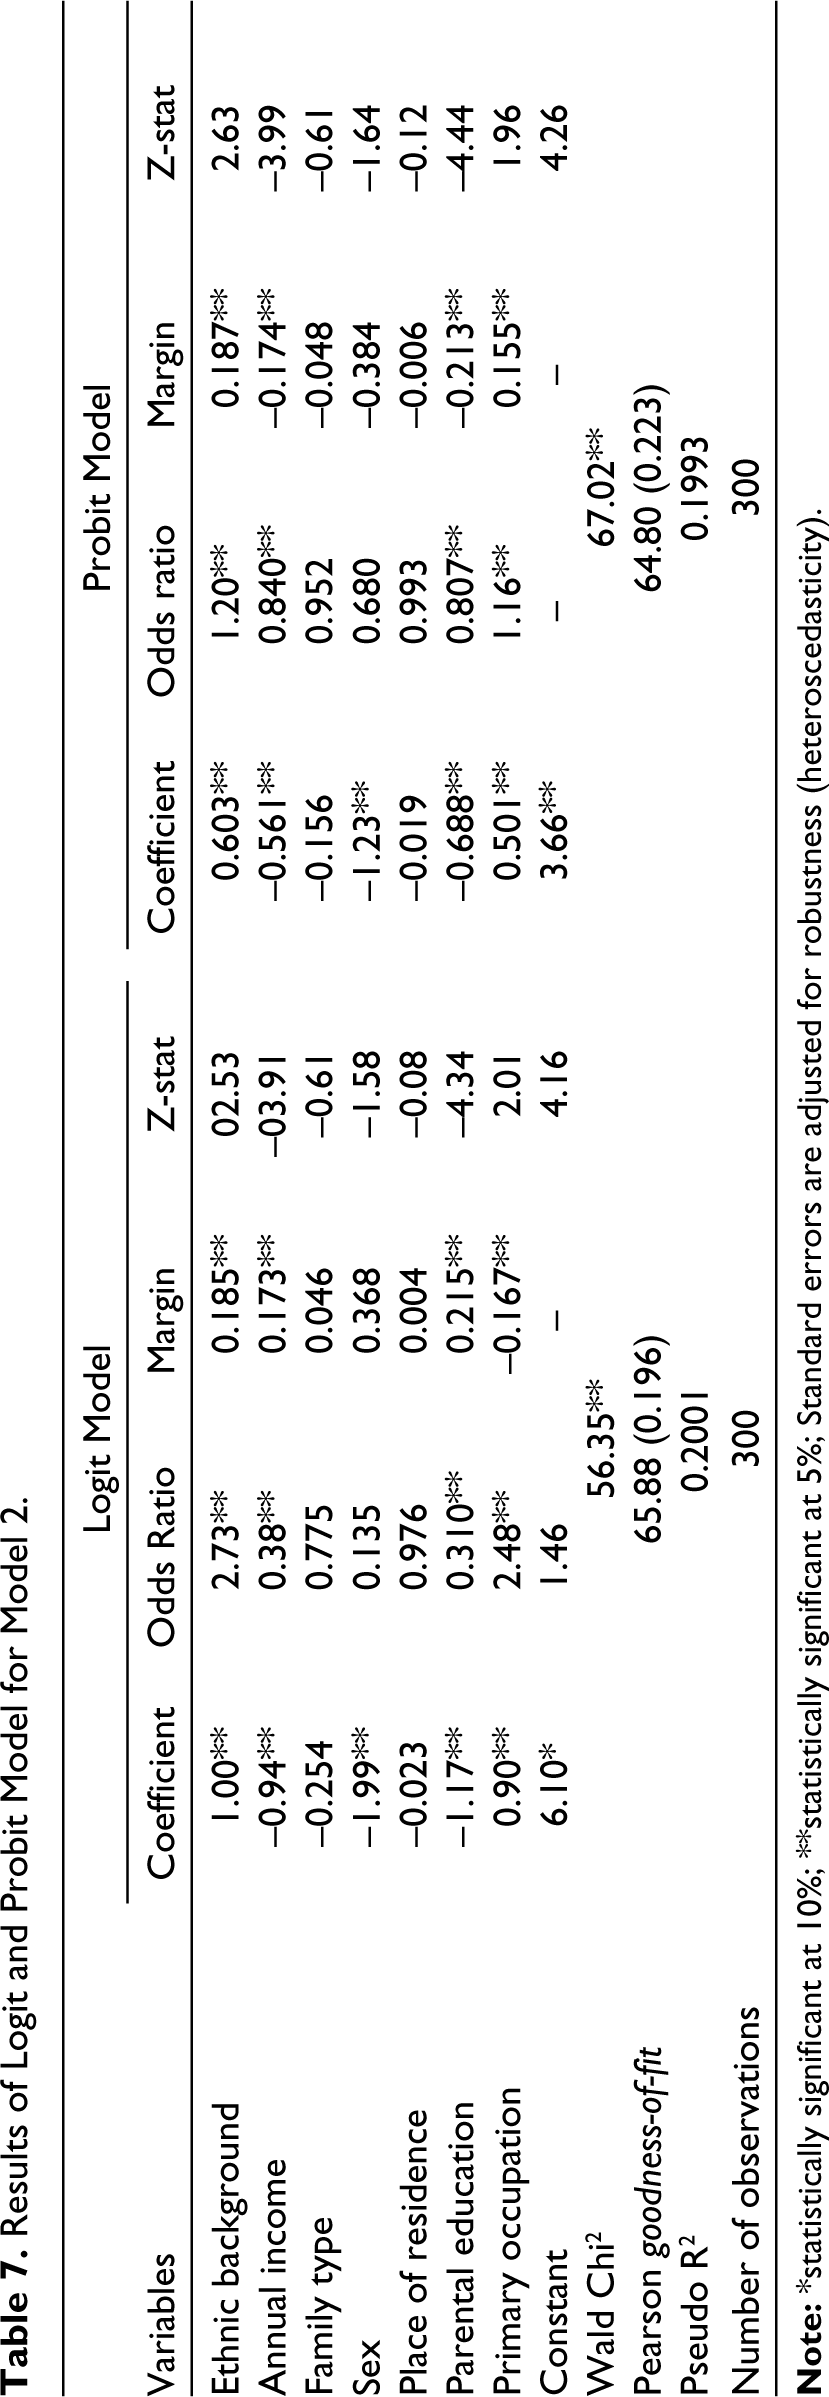
Results of Logit and Probit Model for Model 2.
While coefficients represent the estimated effect of the independent variables, odds ratios indicate how odds of the event change with a change in explanatory variables (Monahan et al., 2007). Marginal effects, on the other hand, represent the average change in the probability of the event occurring (Norton & Dowd, 2018). Z-statistics tests the statistical significance of coefficients. Wald Chi-Square values are statistically significant, indicating the statistical significance of both models.
Regarding individual coefficients in Model 1, the coefficients of ethnic background, type of ration card, sex and primary occupation of the household head, and parents’ education are statistically significant (Ayyangar et al., 2020; Banu & Mistri, 2020; Chudgar & Creed, 2016; Lahoti & Mukhopadhyay, 2019;). Further, while the coefficients of sex of the household head and parents’ education are negative, those of ethnic background, type of ration card and primary occupation of the household head are positive. Thus, ethnic background, economic status, parents’ education and primary occupation of the household head have a significant impact on the choice of school. Alternatively, households that belong to the SC/ST group, those that have Below Poverty Line (BPL) cards, those with low income, those with low education, those that are female-headed and those that with agriculture as the primary occupation are more likely to choose government or aided schools. Notably, family type and place of residence have no impact in this regard (Oommen, 2014).
In Model 2, the coefficients of ethnic background, household annual income, sex and occupation of the household head, and parents’ education are statistically significant (Ayyangar et al., 2020; Chudgar & Creed, 2016; Georgiadis et al., 2022; Kumar & Choudhury, 2021; Lahoti & Mukhopadhyay, 2019). While the coefficients of sex of the household head, parents’ education and annual income are negative, they are positive for ethnic background and primary occupation of the household head. Hence, households belonging to the SC/ST category, with low income, with lower levels of education, having a female head and working in agriculture are more inclined to choose government or aided schools. Further, family type and place of residence do not have any significant impact (Oommen, 2014). Thus, the results of both the models are consistent. Overall, in both models, odds ratio and marginal effect suggest that SC/ST and BPL households have higher odds or probabilities of choosing a government or aided school, whereas a higher level of parents’ education is associated with lower odds for the same. Similarly, both models show that households that are primarily engaged in agriculture have higher odds or probability of choosing government or aided schools.
The higher likelihood of households from the SC/ST categories, those below the poverty line, or those with agriculture as the primary occupation choosing public schools might be because of higher expenses associated with private schools (Ayyangar et al., 2020; Bhattacharya et al., 2015; Hill et al., 2011; Lahoti & Mukhopadhyay, 2019). On the contrary, government and aided schools offer a diverse range of programmes that make education almost free. 12 Male household heads who are educated are less likely to choose public schools possibly because of greater access to information and positive perceptions about private schools (Chudgar & Creed, 2016). Additionally, wealthier households choose private schools for their children (Georgiadis et al., 2022). In particular, aspiring parents choose private schools primarily due to their desire to teach English to their children (Kumar & Choudhury, 2021; Streuli et al., 2011). Moreover, female-headed households are more likely to choose public schools, as they are often less wealthy and have fewer assets (Banu & Mistri, 2020).
In general, proximity to school has a significant impact on parents’ choice of school (Lohan et al., 2020; Vij & Farhan, 2018), particularly when the lack of transportation becomes a major hindrance (Sridevi & Nagpal, 2019). However, location of household does not have any significant influence on the likelihood of choosing government schools in Kerala, possibly because of limited rural–urban gaps (Oommen, 2014) and well-developed public transport facilities in the state (Kumar & George, 2009). Development of the social sector in Kerala is also uniform across the districts (Chakraborty, 2009).
Notably, there is no gender inequality in choosing school for children in Kerala (State Planning Board, 2021) possibly because gender bias against girls is not reported in Kerala (Lancaster et al., 2008; Maitra et al., 2011). While many other states in India have the problems of lack of infrastructure facilities, low enrolment and high dropout in government schools, Kerala has overcome these issues long back (State Planning Board, 2019) using policies such as the Public Education Rejuvenation Mission.
In addition to the collection of primary data, focus-group discussions were also conducted to gather qualitative insights, particularly into different stakeholders’ perceptions of school choice and its potential implications. It is found that, given the similar infrastructure facilities in different schools, parents assign significant value to the medium of instruction. It is also found that parents do not find proximity as an important factor while choosing school for their children possibly because there is at least one school in every 2 sq. km in Kerala. On the contrary, English as the medium of instruction is particularly favoured by parents on the grounds that it can improve their children’s future opportunities (MoSPI, 2020; Ministry of Education, 2022). Malayalam is the primary language of instruction in government schools. However, parents usually want their children to be educated in English. Thus, the qualitative insights from the focus-group discussions largely support the findings from the econometric models.
While proficiency in the local language is important, households belonging to socially disadvantaged groups may face constraints in their participation in different socio-economic activities due to a lack of proficiency in English. Conversely, individuals from upper castes dominate high-skilled professions (Tewathia et al., 2020). In addition, households from poor socio-economic backgrounds prefer government or aided schools for their children where the quality of education needs improvement (Retnakumar & Arokiasamy, 2006).
Irrespective of the type of school management, infrastructure facilities across the majority of schools in Kerala are largely uniform (Ministry of Education, 2022). The state government has allocated a considerable amount of budget to strengthening the public education system, particularly through the Public Education Rejuvenation Mission. This has important implications as there is a growing preference towards private schools instead of public ones, despite their high tuition fees and other associated expenses. To address this concern, the Public Education Rejuvenation Campaign of 2016 aims to restore public trust and confidence in government and government-aided schools and offer free education to all students in the state. The Kerala Infrastructure Investment Fund Board has been engaged to upgrade the basic infrastructure in schools with more than 500 students (State Planning Board, 2021). While only 18.9% of government schools had functional Internet facilities in 2012–13, by prioritising inclusive infrastructure improvements, this value increased to 95.7% by 2021–22. This is a significant progress compared with the national average of approximately 40% as per the UDISE+ report (Ministry of Education, 2022). Importantly, following such an improvement in Internet facilities, enrolment in government schools has also started increasing in Kerala (State Planning Board, 2021). The implementation of the Public Education Rejuvenation Campaign has facilitated the state government in effectively responding to the changing demands and preferences of different stakeholders. This initiative resulted in modifications of the infrastructure, alterations in the curriculum and teaching methods, and augmentation in public awareness and involvement in both government and aided schools in the state.
Conclusions and Policy Recommendations
Household-level factors significantly influence parents’ choice of schools for their children. In this context, this article examined the factors that influence households’ choice of schools for children in Kerala. In Kerala, proper infrastructure facilities are available at household and school levels, mainly due to policies such as the Public Education Rejuvenation Mission that improve quality and infrastructure. However, because of the homogeneous infrastructure, this study only considered household-level socio-economic, demographic and geographical characteristics to identify the determinants of households’ choice of school. Using primary data collected from randomly selected 300 households from the selected areas of Kottayam District of Kerala and estimating binary logit and probit models, this article determined the significant influence of ethnic background, households’ economic status, gender, education and primary occupation of the household head on the choice of school for the education of their children. There is a higher likelihood of choosing public schools by households from the SC/ST category, those living below the poverty line and those with agriculture as the primary occupation. In contrast, households with educated, male heads and households with higher income are less likely to choose public schools. Notably, the choice of school does not differ significantly between rural and urban households.
Since SC/ST and BPL households are more likely to prefer public schools, policies should focus on improving the quality of public schools and introducing both Malayalam and English mediums of instruction to enhance education levels and promote inclusive human development in the state. Without improvement in the quality of education in public schools, social exclusion in education and disparities in human capital are highly likely. Perceptions about English as a medium of instruction, alongside communication, should also be taken into consideration.
Therefore, improving the quality of public education has the potential to improve education levels and promote inclusive human development. In the absence of quality enhancements in education, there is a possibility of social exclusion and inequalities, especially among marginalised communities, along with the lack of human capital necessary for inclusive growth and development. Several government schools have witnessed an increase in enrolment after the implementation of English as the primary language of instruction. This emphasises the need for designing appropriate language policies for inclusive education, given the importance of local language as well as considering parents’ preferences in this regard. Considering these factors, this study suggests the need for specific measures to improve the quality of and access to the public education system in Kottayam District of Kerala, especially to cater to the human capital requirements of marginalised communities.
Achieving desired outcomes in this regard requires an emphasis on the requirements of various stakeholders and efficient execution of policies and related programmes, as evidenced by the successful implementation of educational policies for public schools in Delhi. Policymakers deliberated about adopting a coordinated policy encompassing parents’ engagement rather than simply enacting the policy. Regular meetings of parent–teacher associations are conducted at schools in Delhi, leading to an increase in enrolment in government schools. To improve the effectiveness of the monitoring system, the Government of Delhi has decentralised the system by granting authority to school management committees. This shift empowered parents to take the responsibility of ensuring accountability and resulted in the efficient working of public schools according to Delhi Government Performance Report (Dialogue & Development Commission of Delhi, 2022).
Similarly, the involvement of various stakeholders has to be encouraged further to facilitate the quality of public education. A comprehensive strategy is required to improve the standard of public education in Kerala, with a special focus on serving underprivileged people and fostering inclusive education. Bilingual educational initiatives can be implemented to promote inclusion while simultaneously recognising the significance of the local language. Further, it is imperative to implement strategies aimed at enhancing parents’ involvement, drawing inspiration from the effective initiatives implemented in Delhi. Decentralisation of the authority to school management committees can potentially ensure accountability and efficiency of the public education system. Through such interventions, Kerala can attain comprehensive and high-quality public education that meets the requirements of the public and thus can foster equitable human development and inclusive progress.
The article has limitations that can be addressed in future studies. For example, due to the pandemic and lockdown restrictions during the course of this study, only 50 schools and 300 households were surveyed. The changing dynamics over time can be examined by collecting recent data and information. Furthermore, the study area is limited to a specific district and time period, resulting in geographical and temporal constraints. In addition, despite the overall improvement in educational outcomes across the state, certain underdeveloped districts and communities require further attention. Hence, this study provides scope for future research by incorporating additional districts. This would allow for a more comprehensive understanding of perceptions and the underlying factors, considering the diversity of geographical and socio-economic contexts.
In addition, the article focuses primarily on the perceptions of parents, but it is also important to consider the perceptions of students and teachers to have a more comprehensive picture of the choice of school. Besides, this article combines government and aided schools into a single category. Although such clubbing is unlikely to cause any distortions in the findings in the present context, future studies can consider further categorisations of schools for a deeper understanding of the underlying dynamics.
Footnotes
Acknowledgements
This article is partly based on the first author’s doctoral research at IIT Kharagpur with a fellowship from the University Grants Commission (UGC). The authors are thankful to the UGC and IIT Kharagpur for the support. An initial version of this article was presented at the Fourth Annual Economics Conference organised by Ahmedabad University on 6–7 January 2023. The authors are thankful to the editors of the journal and reviewers for their valuable comments and suggestions.
Declaration of Conflicting Interests
The authors declared no potential conflicts of interest with respect to the research, authorship and/or publication of this article.
Funding
The authors received no financial support for the authorship and/or publication of this article.