
Abstract
This article examines the level, composition and trends of social expenditures at the subnational level in India using the secondary data of Odisha from 1990–91 to 2016–17 due to the low level of economic development in the state. The level of social expenditures of Odisha is better than those of the 14 major states of the country. However, it is not sufficient for the development of the state due to its declining trend and a small proportion of capital account social expenditures. Regarding the composition of social expenditures, a substantial proportion is incurred on populism rather than human capital formation. Social expenditures deviate from human capital formation to populism with time. Further emphasis is shifted towards economic services from social expenditures in the total expenditures. The ruling party used the strategy of populism to win seats in the state legislature keeping in mind the high proportion of the poor, illiterates and poor farmers in the state, where a direct relationship exists between human capital formation and winning seats in the legislature. To ensure economic development, the state should strive to improve its human capital formation and refrain from populist measures.
Introduction
The universal provision of basic social services (i.e., health and education) lays the foundation for long-term resilience for citizens and ensures equality in opportunities and outcomes (United Nations Development Programme, 2014). This resilience secures and sustains human development necessary for the economic development of the country. There exists an interrelationship between human capital (investment in social) and physical capital (economic services) (Appleton & Teal, 1998). Worldwide, a large section of people is deprived of food, health, education, sanitation and water (United Nations Development Programme, 2016). The proportion of social expenditures has declined substantially not only in some developed countries but also in some emerging economies, where it is below the average (20% of the gross domestic product [GDP]) of Organisation of Economic Co-operation and Development (OECD) countries (OECD, 2014). 1 Further, in developed countries, transfers constitute a significant proportion of total social expenditures (Bastagli et al., 2012). A lower level of social expenditures with a significant transfer payment adversely affects the output and employment, leading to a lower level of economic development in the country (Bhattacharya, 2009). An increase in populist expenditures destroys the political economy of the country. Democracy becomes redundant due to increased polarisation within the country. The increased division within the country indicates the exclusion of social sectors from the participatory mechanism. Thus, representative democracy is converted to participatory democracy, which distributes multiple interests within society beyond state regulations negating the essential component of democracy (Torres, 2006). Expansionary macroeconomic fiscal policies introduced by populists severely affect the economy. The adverse effect of the increased public debt required for expansionary fiscal policies is ignored, assuming that the increased demand due to lower taxes or populist expenditures will improve economic growth. As a consequence, this leads to economic crises (Dornbusch & Edwards, 1991; European Economic Advisory Group [EEAG], 2017). Poli (2016) argued that populism resulted in an economic crisis in Western Europe. However, populism is used for winning elections. It is supported by people with lower educational attainment, those with low per capita income, the elderly, farmers, waivers, low-skilled workers, people from deprived classes and those with specific interests (EEAG, 2017).
In India, the proportion of social expenditures is less than 5% of its GDP (United Nations Development Programme, 2016). Dev and Mooij (2002) estimated it to be between 6% and 8% of the GDP during the period of 1990–91 to 2000–01. In 2015, the human development index (HDI) of India (0.624) was around two-thirds of that of the highest HDI among all countries (0.949) (United Nations Development Programme, 2016). The proportion of social expenditures at the subnational level (states) in total, combining the social expenditures of the centre and states, was significant (Dev & Mooij, 2002; Mohan, 2005). 2 Dev and Mooij (2002) estimated it as 85% and 80% during 1990–91 and 1998–99, respectively. Among the 14 major states of India, Odisha is a state with a low per capita income (₹29,431, against the highest per capita income of ₹65,327, that of Haryana), 3 a lower level of educational attainment, a higher proportion of deprived class, a higher proportion of farmers and a lower proportion of skilled workers. The value of HDI was low in Odisha (0.291), ranking 18th among 28 states during 2011–12 (Mukherjee et al., 2014). It was 3.5 times less than the value of the state with the highest HDI (0.911, Kerala). A higher level of poverty (32.6%) than the national average (21.9%) in 2011–12 and poor social output indicators were observed in the state. 4 . This article examines the composition and extent of social expenditures in the context of human capital formation and populism in Odisha using the secondary data from 1990–91 to 2016–17.
The article is organised as follows. Literature related to social expenditures is reviewed, which is followed by an empirical analysis of the level and composition and an investigation of trends in social expenditures. The article then explores how political factor augments populism in social expenditures and aggravates human capital formation. An outline of summary and policy suggestions is presented in the final section.
Review of Literature
In-depth discussions have been found in the literature of social sciences (Dev & Mooij, 2002; Guhan, 1995; Lalvani, 2009) regarding trends in social expenditures in India. Dev and Mooij (2002) examined the trend in combined social expenditures of the centre and states, social expenditures of the centre and those of 25 states from 1990–91 to 2000–01. In addition, they analysed the trends of social expenditures of the 15 major states. 5 They observed (a) a declining level of combined social expenditures of the centre and states, (b) an increased level of social expenditures by the centre and (c) a declining level of social expenditures by states. In combined social expenditures, the proportion of education and basic minimum services increased, whereas those of rural development and health declined and remained constant, respectively, in the latter half of the 1990s. The aggregate social expenditures of 25 states were also found to be declining over time. The findings of the analysis of the trends in social expenditures of the 15 major states are as follows: the declining proportion of social expenditures for education in all states except Haryana, Orissa, Punjab and Rajasthan; the declining proportion for health in all states except Haryana, Punjab, Rajasthan and Madhya Pradesh; a mixed trend in water supply and sanitation for all states; and the better performance of rich and middle-income states than poorer states.
Guhan (1995) examined the trends in the social expenditures of the central and state governments from 1990–91 to 1995–96 by converting social expenditures into the percentage of total expenditures as well as GDP. He found that the level of central social expenditures marginally increased, while that of states declined drastically over the study period. Chakrabarti and Joglekar (2006) compared the proportion of the combined educational expenditures of the centre and states, and the aggregate educational expenditures of the 15 major states between the pre- and post-reform periods. They found that both variables showed a significant decline in the post-reform period than that in the pre-reform period.
Bhat and Jain (2006) showed that the trend of aggregate public healthcare expenditures of all states declined significantly from 1987 to 2003 due to the reduction in healthcare expenditures with the introduction of liberalisation. Dev and Mooij (2002) argued that inefficient bureaucracies, waste accumulation and corruption led to a reduction in the level of social expenditures. Lora and Olivera (2007) found a negative relationship between total public debt and social expenditures using an unbalanced panel of 50 countries between 1985 and 2003.
Mahapatra et al. (2022) showed that strategic prioritisation and operational efficiency in public expenditures are indispensable for the sustainable fiscal discipline of a country, which in turn expands its economic development. They analysed fiscal discipline and strategic prioritisation of public expenditures using secondary data on major components of public expenditures and deficits from 1976–77 to 2018–19 and examined the operational efficiency of public expenditures using primary data on expenditures for the construction of check dams.
Hussain and Das (2023) examined the association between human capital formation (measured in terms of health and educational expenditures by the government) and economic growth (an increase in the gross state domestic product [GSDP]) in 28 states and Delhi from 1998–99 to 2018–19 and found a significant positive association between the two.
Kurian (2000) examined the economic and social disparities among the 15 major states using demographic, social and economic indicators from 1981 to 2001. The demographic indicators included the population figure, sex ratio, urban population and annual compound growth rate of the population. Social indicators comprised the female literacy rate, infant mortality and life expectancy at birth for females. Economic indicators covered per capita net state domestic product (NSDP) at current prices, sector-wise contribution to the NSDP, poverty, developmental and non-developmental expenditures, investment, bank branches, deposits and bank credit, per capita consumption of power, irrigated area, registered vehicles and telecom lines. Kurian further observed a wide disparity in socio-economic development across the states due to significant economic growth with increased participation of the private sector with the introduction of the New Economic Policy in 1991.
Ravishankar et al. (2008) explored the social expenditures of the 14 major states from 1998 to 2006–07 and found that social expenditures are adversely affected by the fiscal discipline measures adopted by these states. One fiscal discipline measure introduced by the central government of India is the medium-term fiscal restructuring programme linked to incentive grant conditions to reduce the gross fiscal deficit of states to 2.5% of the GSDP, revenue deficit to zero and interest payment to less than 18%–20% of revenue receipts of states (Rao, 2004). This measure does not confirm that states would ensure fiscal discipline by increasing their own tax effort and public expenditure management. Chakraborty (2015) argued that the state government would need to prioritise its expenditure for economic development.
However, little attention has been paid to exploring the trends and composition of social expenditures at the subnational level in the context of human capital and populism.
Social Expenditures in Odisha: Level and Composition
The level of social expenditures 6 at the subnational level in India is not only lower than those with national and international figures but also declining. A significant proportion of social expenditures is diverted to populist expenditures rather than human capital formation 7 (Tables 1 and 2). Further, only a negligible proportion of human capital formation of social expenditures is productive (Table 2). As shown in Table 3, political power resides with a single party continuously over time. It seems that the ruling party might have been adopting populist measures to win elections.
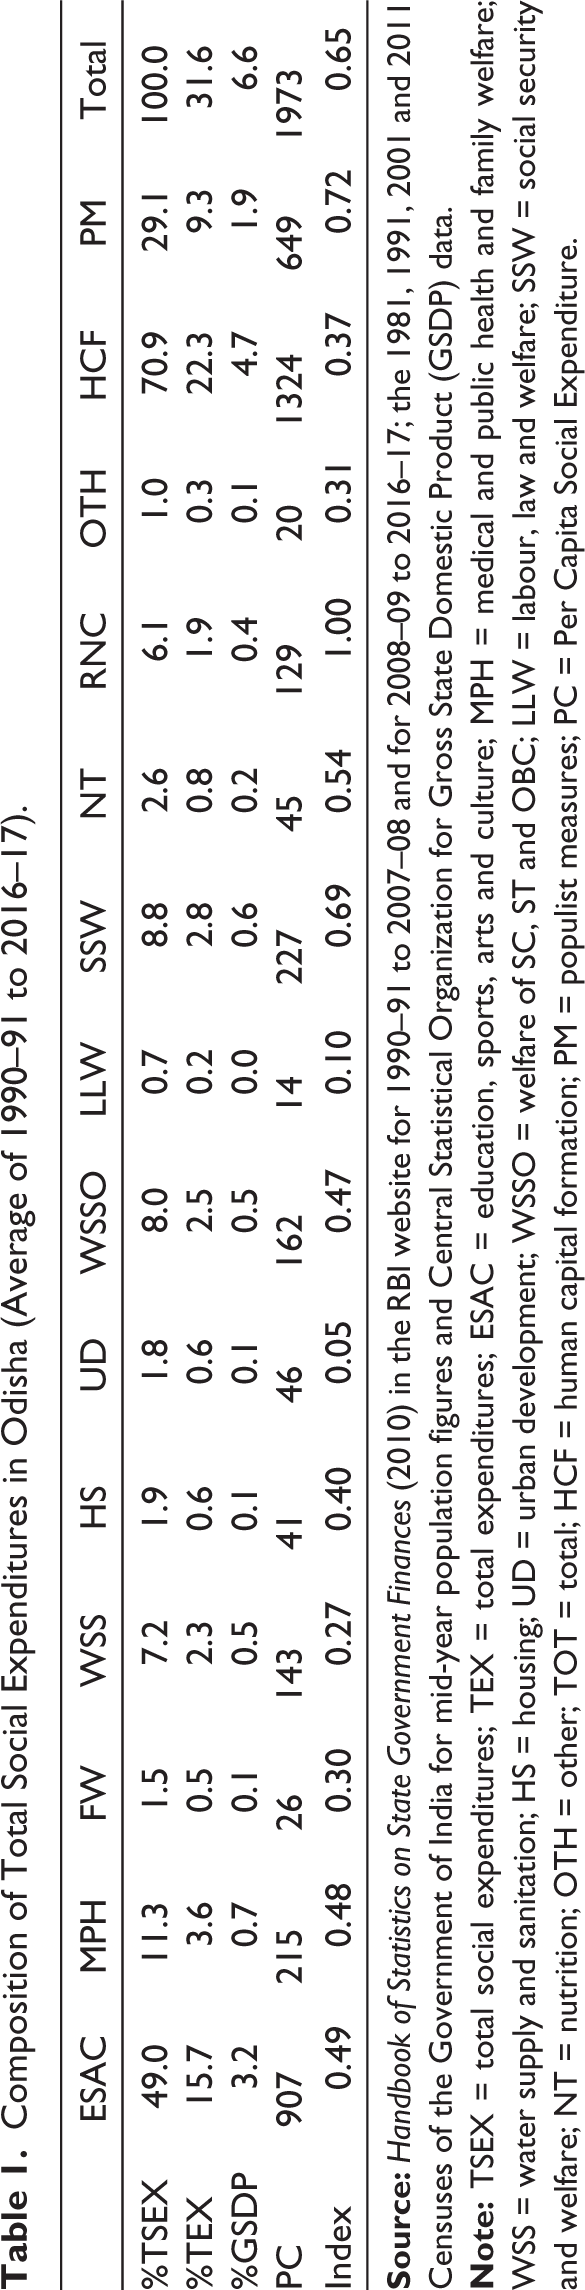
Composition of Total Social Expenditures in Odisha (Average of 1990–91 to 2016–17).
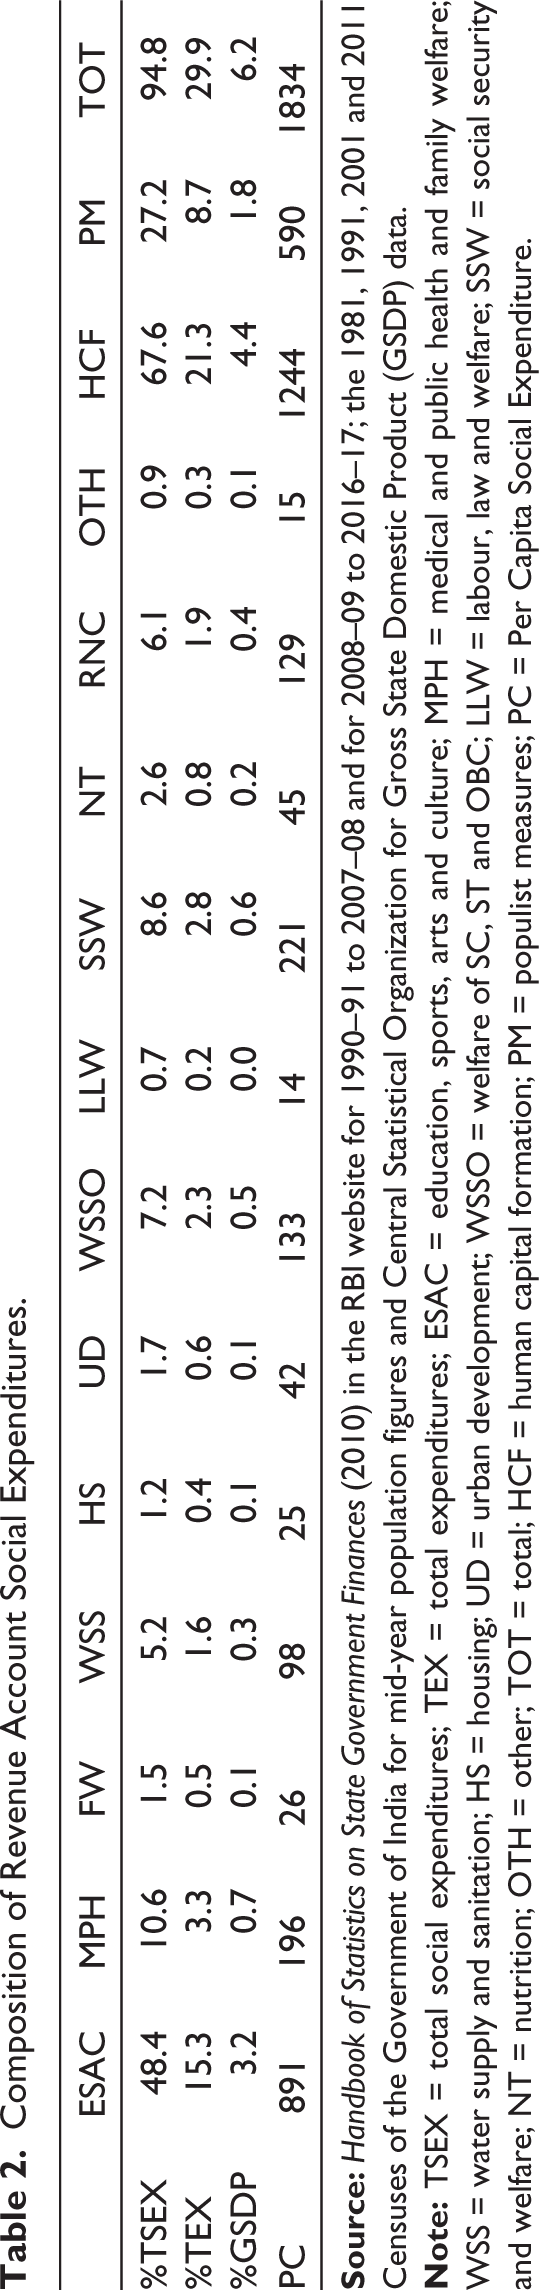
Composition of Revenue Account Social Expenditures.
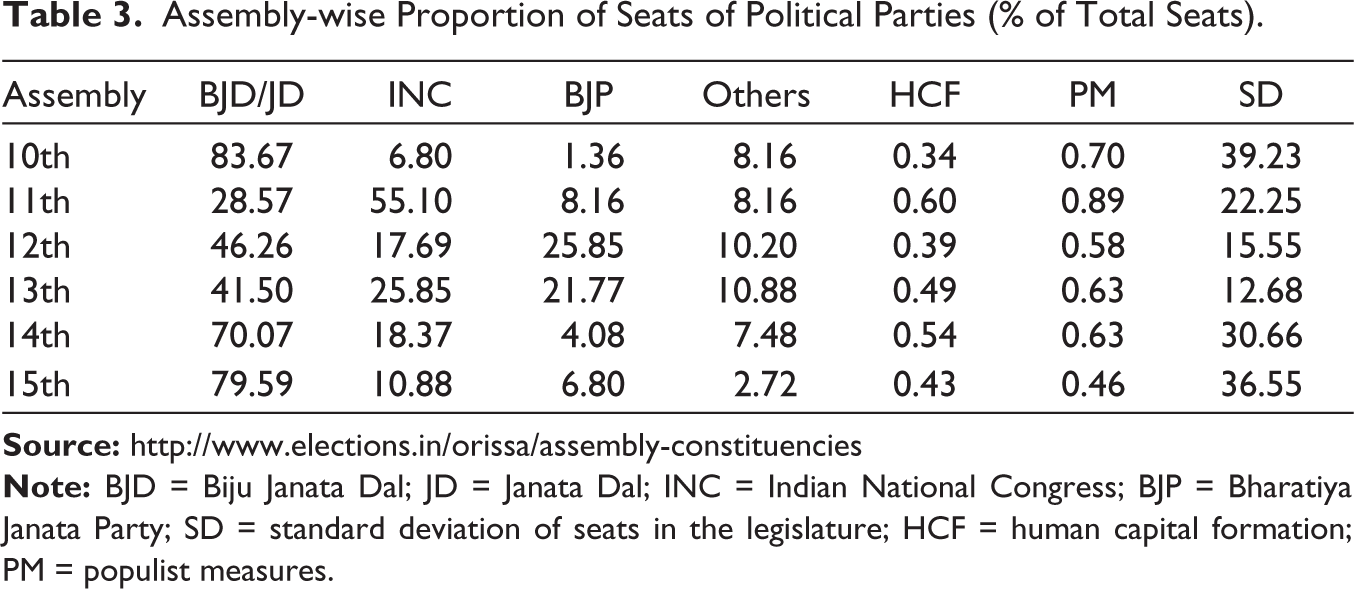
Assembly-wise Proportion of Seats of Political Parties (% of Total Seats).
Level: Is It Sufficient for Development?
The level of social expenditures for the development of the state is low due to a significant proportion of non-developmental expenditures.
Analysis shows that the proportion of social expenditures made up around 31.6% of total expenditures and 6.6% of the GSDP from 1990–91 to 2016–17. The per capita social expenditure was on average ₹1,973 (Table 1). The proportion as the percentage of the GSDP was higher by 1% than the average proportion of the 14 major states of India. The percentage of total expenditures and per capita were lower by 0.3% and ₹165, respectively, than those of the 14 major states. The percentage of total expenditures, GSDP, and per capita were lower by 6.8%, 0.9% and ₹996, respectively, than their corresponding highest proportion.
Among the 14 major states, Odisha ranks seventh, third and ninth in terms of the proportion of total expenditures, GSDP and per capita, respectively (Table A1). It was reported that OECD countries on average spent more than 20% of their GDP on social expenditures in 2014. The ratio of social expenditures to GDP in France was 32%, whereas it was 30% in Denmark, Belgium and Finland (OECD, 2014).
Even though the percentage of total expenditures and GSDP of low-income group (LIG) states were higher than those of high-income group (HIG) and middle-income group (MIG) states, the per capita proportion was lower than those of HIG and MIG states, which was less than half of the HIG and MIG states. The per capita proportion of Odisha was ₹550 higher than the average of LIG states. It was three-fourths of the proportion of HIG and MIG states. Elsewhere, it has been mentioned that the per capita proportion is low in Odisha (Dev & Mooij, 2002).
The value of the Social Expenditure Index (SEI) (0.65) reflects that Odisha is well positioned among the 14 major states of India. In the present study, the value of SEI is estimated by taking the average of the ratio of the difference between the actual and the minimum values to the difference between the maximum and the minimum values of social expenditures as the percentage of total expenditures, social expenditures as the percentage of the GSDP and per capita social expenditures. One of the three variables cannot capture the true picture of the level of social expenditure. For instance, when social expenditures as the percentage of the GSDP are higher, per capita social expenditures are lower.
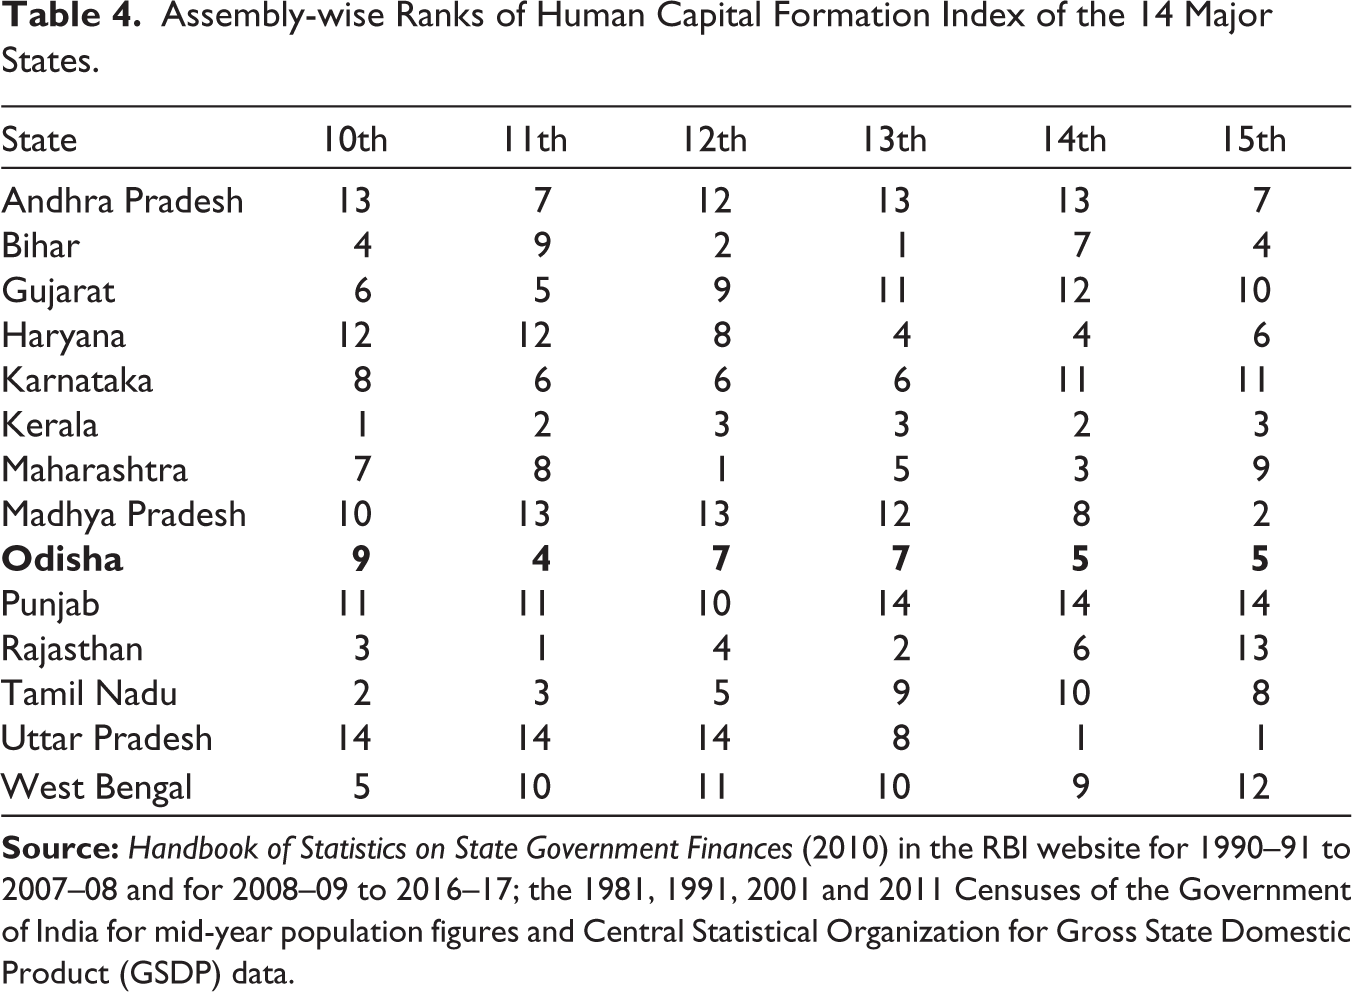
Regarding social expenditures, Odisha ranks third among the 14 major states. The comparison of the SEI average between states of different income groups reveals that it is highest (0.62) in LIG states, followed by MIG (0.61) and HIG (0.46) states. Among LIG states, Odisha ranks second, behind Uttar Pradesh (0.67). Odisha ranks fifth in human capital formation among the 14 major states, as shown by the Human Capital Formation Index (HCFI). The HCFI is an average of the Education Index, Medical and Public Health Index, Water Supply and Sanitation Index, Labour and Employment Index and Nutrition Index. Kerala tops the list, with an HCFI value of 0.54. The HCFI value of Odisha is around two-thirds that of Kerala. The comparison of average values of the HCFI of states belonging to different income groups showed that MIG states have the highest value (0.37), followed by LIG (0.35) and HIG (0.33) states. The HCFI value (0.37) of Odisha is equal to the average value of MIG states. However, it is lower than the value of Bihar (0.38).
The analysis of the Populist Measures Index (PMI) values of states belonging to different income groups indicates that the PMI is highest in LIG states, followed by MIG and HIG states, respectively. Among LIG states, Odisha ranks second, the highest being Madhya Pradesh. The PMI value is the average of the Family Welfare Index, Housing Index, Urban Development Index, Welfare of Schedule Caste, Schedule Tribe and Other Backward Caste Index, Social Security Welfare Index and Relief for Natural Calamities and Other Social Expenditures Index.
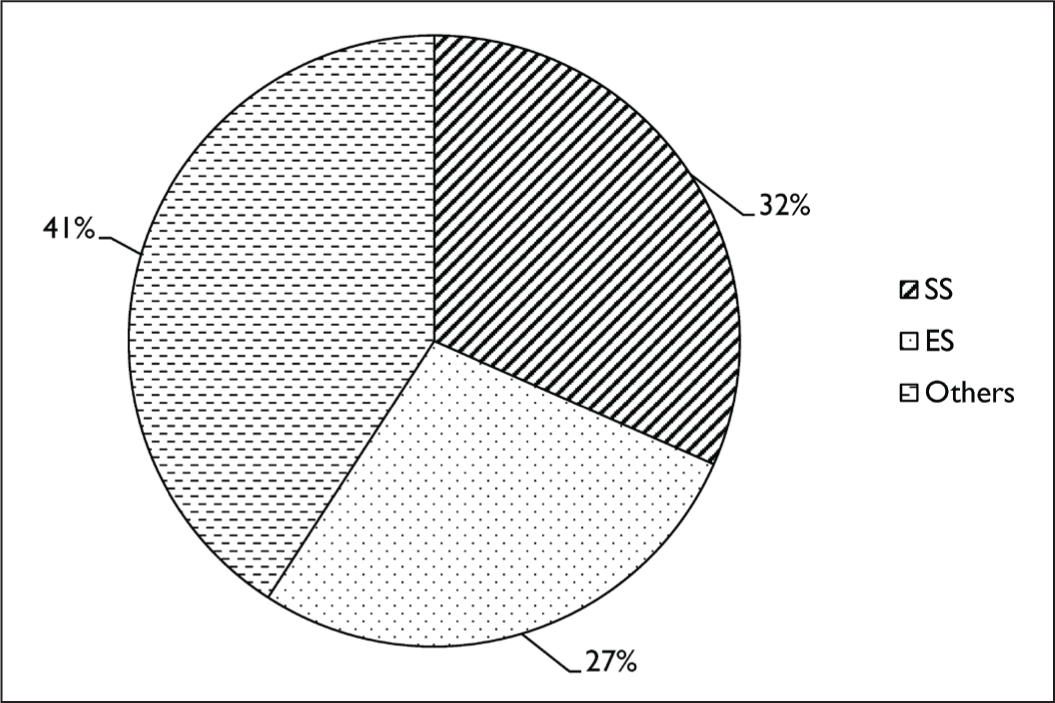
The Odisha government gave the highest priority (41%) to non-developmental expenditures during the study period (Figure 1). Among non-developmental expenditures, major proportions went to interest payment (14.3%), repayment of debt (8%) and pension (7.1%). Regression analysis shows a negative relationship between social expenditures and non-development expenditures, but it is not significant. 8 This is consistent with the study of Lora and Olivera (2007), which stated the negative relationship between social expenditures and public debt. The revenue of the state has no significant impact on social expenditures. The level of social expenditures is significantly related directly to federal transfers. 9 Elsewhere, it has also been mentioned that federal transfers determine the allocation of resources for human capital formation (Ranis et al., 2000). It has further been argued that the budget should be the financial mirror of social and economic choices (Schiavo-Campo & Tommasi, 1999).
Composition and Trend: Approaching towards Populism
The intersectoral composition of social expenditures shows that significant weightage has been given to social security welfare, relegating the importance of education, health and employment in the economic development of the state (Table 1). Even if human capital formation constitutes the major proportion of total social expenditures, it is increasing at a marginal rate; however, the proportion of populist expenditures is increasing tremendously over time (Table 3). The negligible revenue generation capacity of social expenditures is revealed by its economic classification (Table 2).
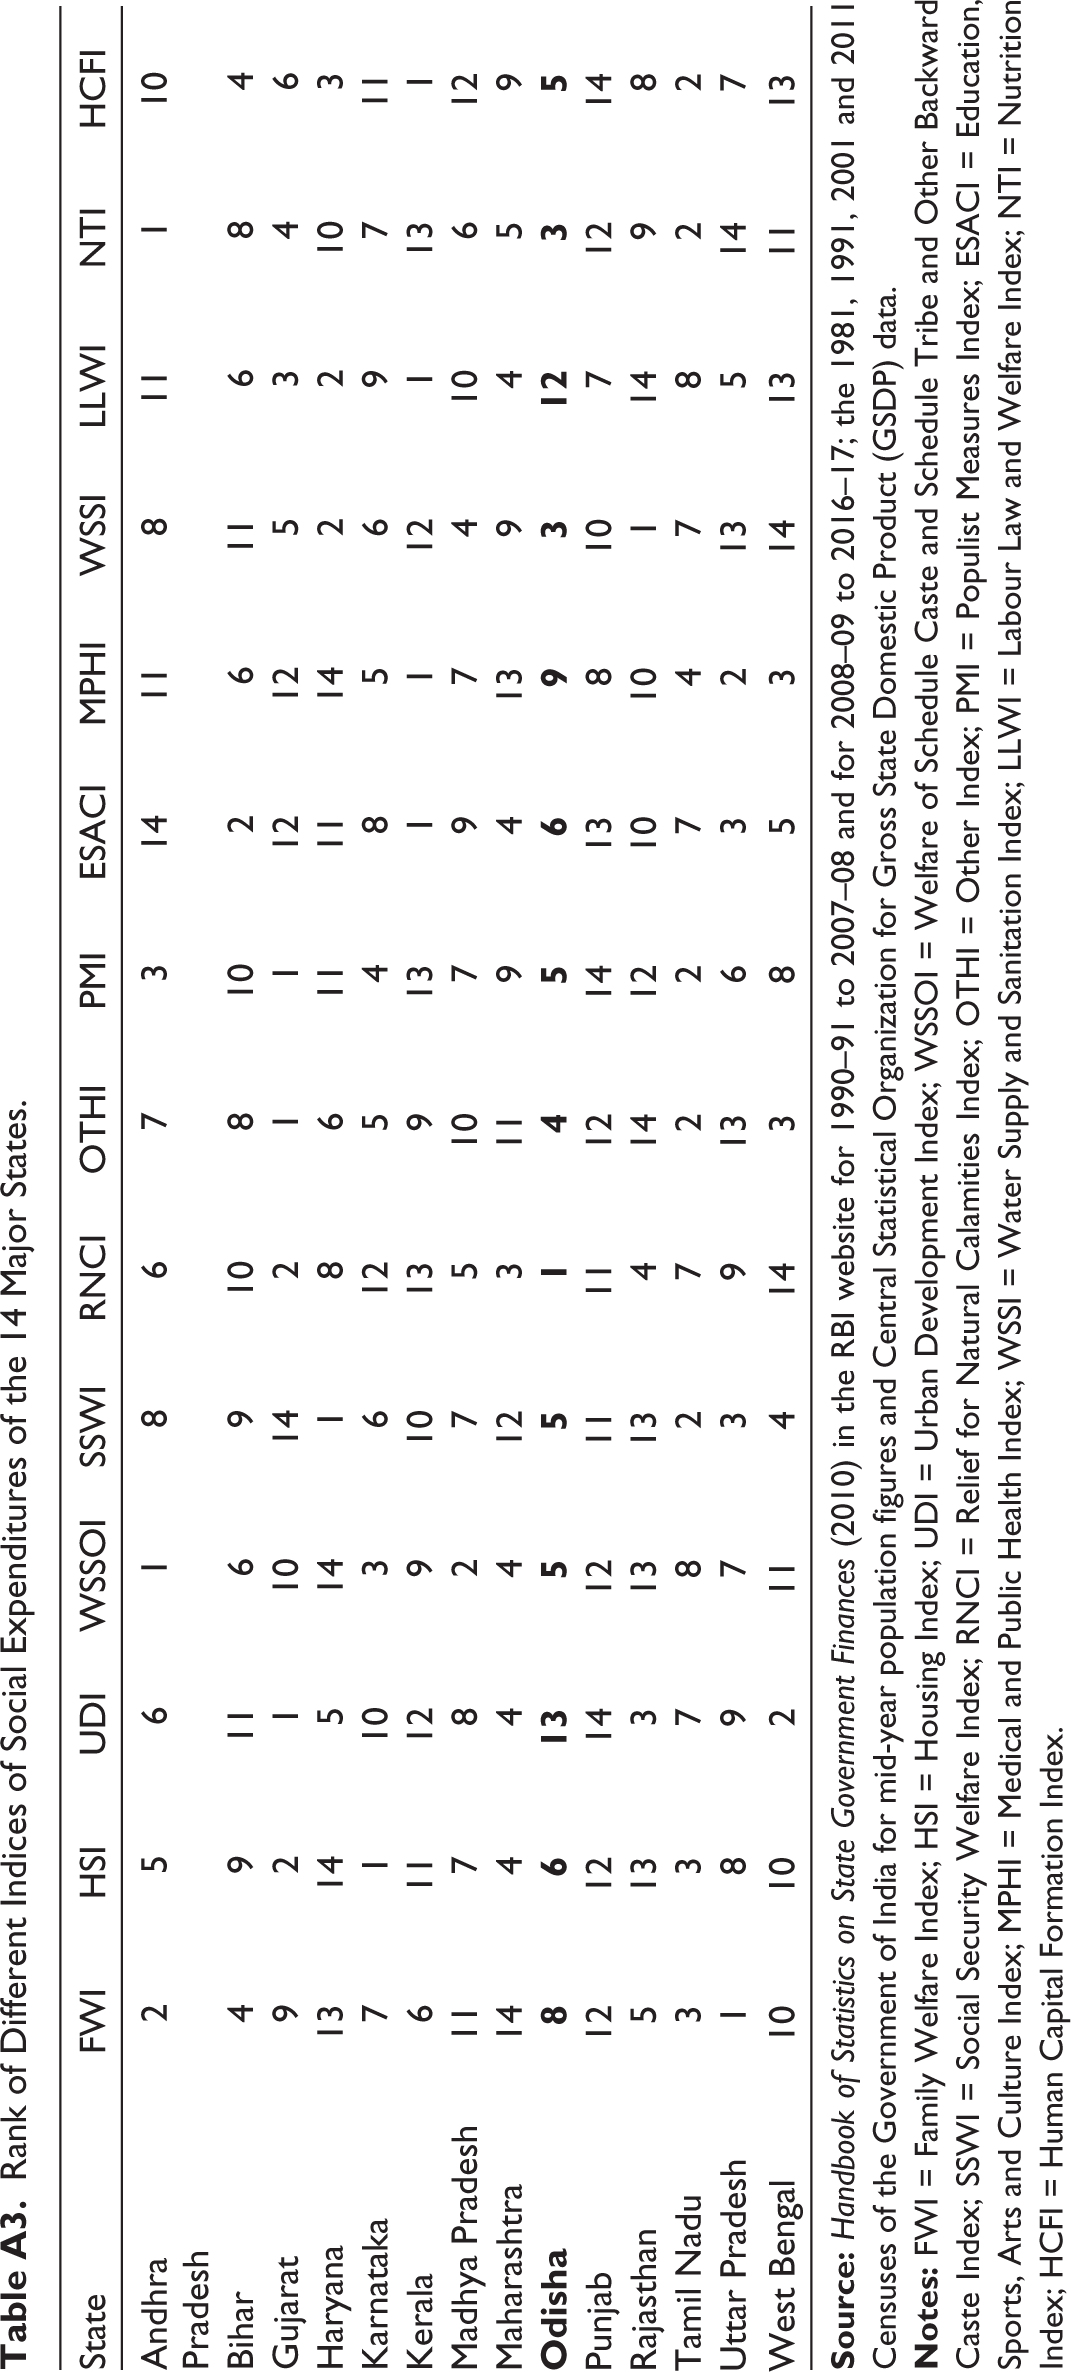
An average estimation of the proportions of intersectoral expenditures reflects that education has the highest proportion of total social expenditures (49.2%), total expenditures (15.7%), GSDP (3.2%) and per capita expenditures (₹907) in all sectors. The proportion of education in total social expenditures is more than four times that of health expenditures and 2.3 times that of the combined expenditure on health and its determining factors (water supply, sanitation and nutrition). A comparison of index values of different components indicates that the value for education (0.49) is marginally (0.01) higher than that for health and less than that for nutrition (0.54) and social security welfare (0.69) (Table 1). Among the 14 major states of India, Odisha ranks sixth, third and fifth in the Education Index, Nutrition Index and Social Security Welfare Index, respectively (Table A3). Even though it ranks third in terms of the proportion of educational expenditure in GSDP, it ranks 10th in per capita educational expenditures. A great achievement has been brought about in educational output indicators. 10 However, it is relatively lower than in MIG and HIG states. For example, the average literacy rates of HIG and MIG states are 77.9% and 78.6%, respectively, whereas it is 73% in Odisha as per the 2011 census. It is 21% less than the literacy rate (94%) of Kerala (the state with the highest literacy rate in the country). The Education Index of Odisha is lower by 0.26 than that of Kerala. The proportion for education should be increased. The importance of education in the economic development of a state is well recognised in the literature of social science (Odior, 2011). It has been argued that higher priority should be given to education than to health (Al-shihri, 2014; Tang & Lai, 2011).
The proportion of health expenditures in total social expenditures, total expenditures, GSDP and per capita expenditures is 11.3%, 3.6%, 0.7% and ₹215, respectively. The Health Index (0.48) of Odisha is more or less the same as the value of the Education Index as mentioned earlier, being ranked ninth among the 14 major states of India. This lower rank is attributable to lower ranks in the percentage of total expenditures (11th) and per capita expenditures (10th) (Table A1). The combined expenditures on medical and public health, water supply, and sanitation and nutrition in total social expenditures are 21.1%, and in GSDP, they are 1.4%. Elsewhere, it has been argued that to provide universal health coverage, the proportion of health expenditures should not be less than 3% of the GDP (Government of India, 2011). In 2002–06, life expectancy at birth was 59.6 years in Odisha, while it was 74 years in Kerala. It was even lower than that of Bihar (61.1 years). In 2010–12, the maternal mortality rate was 16 per 100,000 live births, whereas it was 3.3 for Kerala and 5.2 for Maharashtra, against the national average of 12.4. In 2012, anaemia contributed to 3.15% of deaths and tuberculosis to 1.49%. In 2011, 19.8% of people used well water, whereas 5.8% used water from ponds, rivers, etc. In rural areas in 2011, 85.9% of households had no toilets, whereas it was 35.2% in urban areas. In total, 78% of households had no access to toilets in 2011. Since health and education are interconnected, the low level of expenditures on health worsens the quality of education 11 (Ding & Lehrer, 2007; Finlay, 2006; Suhrcke & de Paz Nieves, 2011). On average, the proportion of labour and employment expenditures in total social expenditures is 0.7%, whose index value is negligible. Further, Odisha ranks 12th among the 14 major states.
A comparison of ranks of different index values reveals that social security welfare has been given a higher level of priority than education, health and employment in Odisha (Table A3).
A marginal proportion of capital account social expenditures (5.2%) is observed from the economic classification of social expenditures. The proportion of capital account social expenditures in total expenditures is 1.7%. Its proportion in the GSDP and per capita is 0.4% and ₹150, respectively. The GSDP elasticity of total social expenditures is less than unity (0.9).
The division of social expenditures into human capital formation and populist expenditures indicates that human capital formation constitutes a significant proportion (71%) of total social expenditures. As stated earlier, Odisha ranks fifth among the 14 major states in terms of human capital formation. However, in terms of education, health and labour employment, it ranks sixth, ninth and twelfth, respectively.
Although populist social expenditures in Odisha make up around 29% of total social expenditures and 2% of the GSDP, it is the state that incurs the fifth highest populist social expenditure (0.46) among the 14 major states. Punjab is the state with the lowest populist social expenditure with a value of 0.14, followed by Kerala (0.24). The proportion of populist social expenditure is much higher than the growth rate of human capital formation. The estimation of the compound growth rate using a semi-log model shows that populist expenditure (16%) is 3% higher than human capital formation and 2.4% higher than the growth rate of total expenditures (13.6%) and GSDP (13.6%).
Human Capital Formation Versus Populism: A Political Analysis
The competition across parties for winning seats in the legislature determines the extent of populism in the social expenditures of the state. A direct relationship is observed between these two variables 12 (Table 3). The increase in the populist social expenditures of the state at the expense of human capital formation (Tables 3–5) and shifts in the priority of government expenditure from social expenditures to economic expenditures (Table 6) are observed when a party with a single majority rules the state continuously over a period of time.
As stated earlier in the literature review, human capital formation is determined by own revenue, federal transfers and public debt of the state. Ranis et al. (2000) reported the positive relationship between human capital formation and federal transfers in a decentralised economy. Lora and Olivera (2007) reported the negative relationship between human capital formation and public debt. Since federal transfers are exogenously determined 13 and public debt repayment depends on the revenue of the state, examining their effects on the human capital formation of the state is of little importance. Human capital formation also depends on the decision-making of the ruling political party of the state. Populism is the result of winning elections (Poli, 2016), and it will be the cause of winning the next elections by the ruling party. A study showed that populism is used to mobilise the support of skilful political entrepreneurs (Martinelli, 2016). The political opinions of citizens are determined by their experience from interactions with social policies (Rothstein et al., 2010). However, populism is supported by people with lower educational attainment, those with low per capita income, the elderly, farmers, waivers, low-skilled workers, people from deprived classes and those with specific interests (EEAG, 2017). In this context, human capital formation versus populism is analysed assembly-wise from the 10th to the 15th assembly (Table 3).
Over 27 years, from 1990–91 to 2016–17, as stated earlier, six assembly elections were held and different political parties ruled the state. 14 There is a direct relationship between the level of competition in winning seats in the legislature and human capital formation.
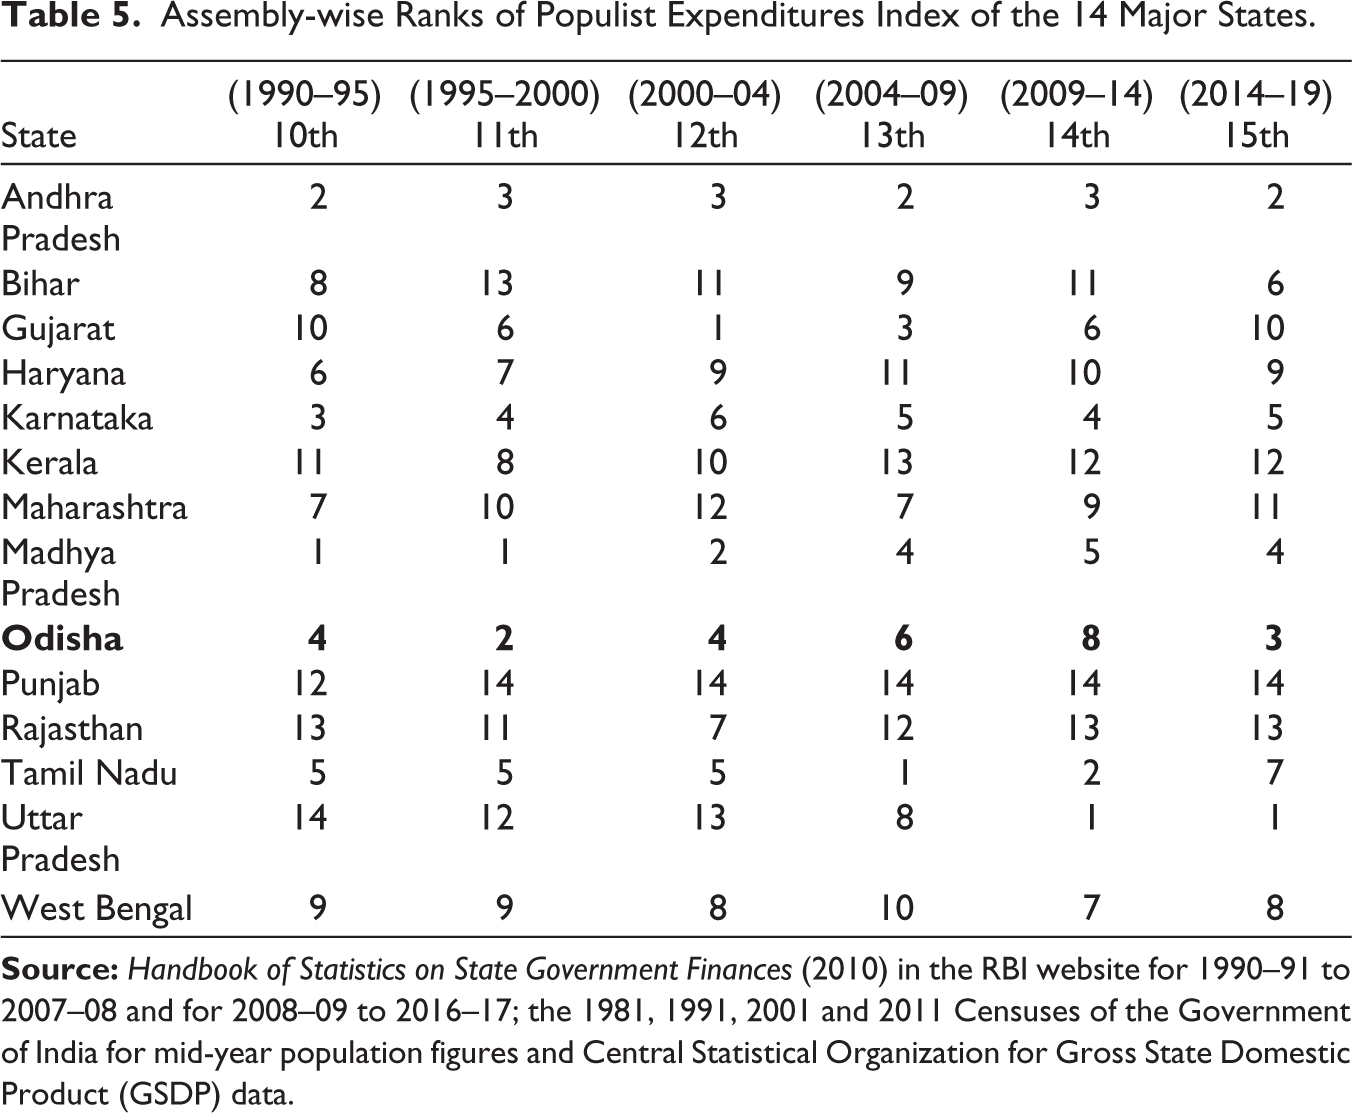
When the competition measured in terms of standard deviation in winning seats in the legislature is less and a single party gets the majority of seats only once instead of achieving the majority over different assembly periods, the HCFI value is lower than the PMI value 15 (10th, 14th and 15th assembly periods). When the competition is less and a coalition party continuously gets the majority, the HCFI value is lower (12th and 13th assembly periods). When the competition in winning seats in the legislature is higher and a single party gets the majority, the PMI value is high (11th assembly period) (Tables 3–5).
Assembly-wise Ranks of Human Capital Formation Index of the 14 Major States.
Assembly-wise Ranks of Populist Expenditures Index of the 14 Major States.
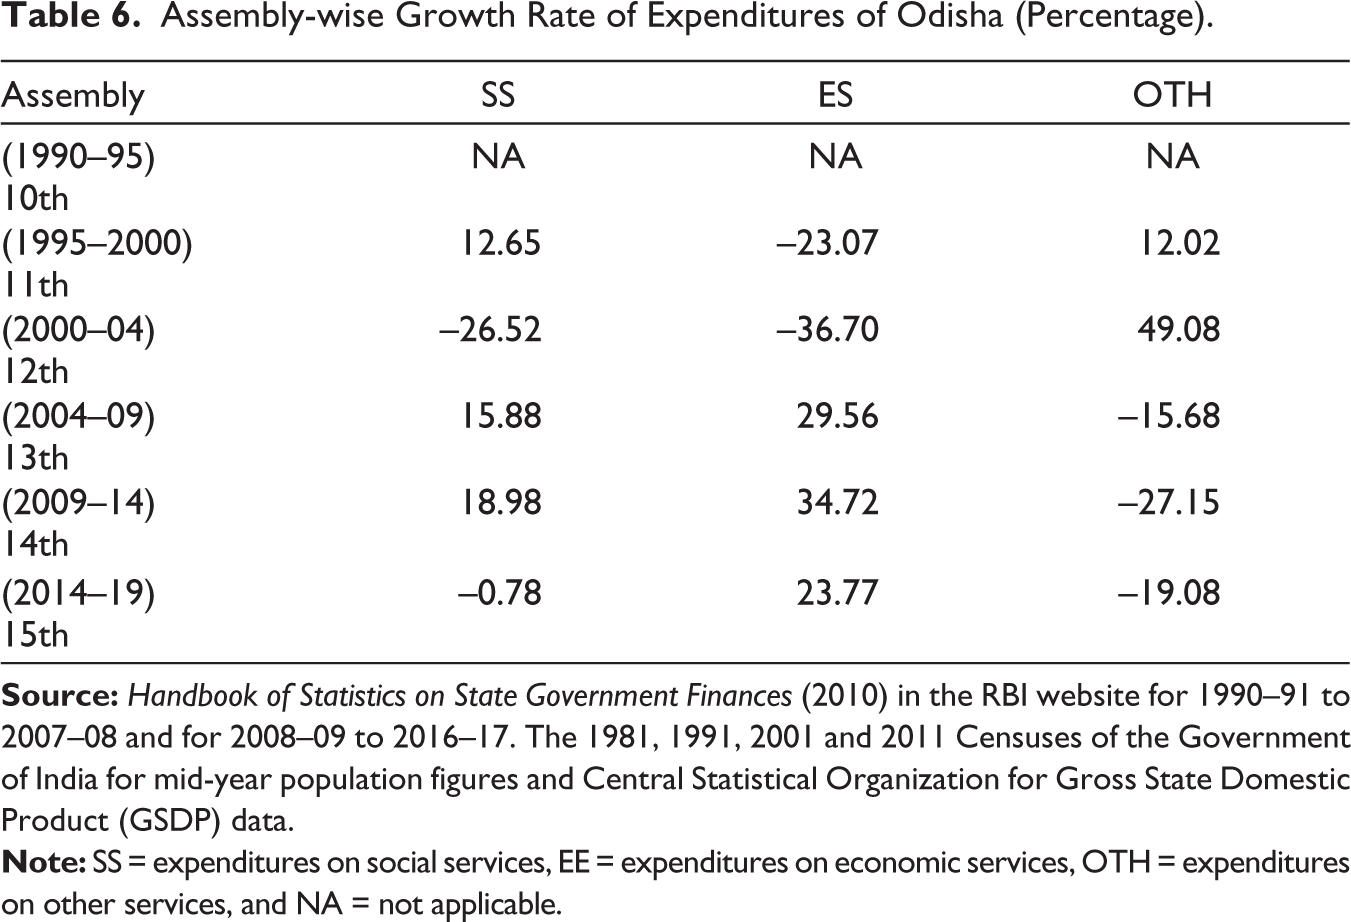
Further, when a single majority party rules the state continuously over a period of time, populist social expenditures and economic expenditures are increased (Table 6), whereas human capital formation and total social expenditures are decreased.
Assembly-wise Growth Rate of Expenditures of Odisha (Percentage).
Conclusion and Policy Suggestions
The level, composition and trends of social expenditures in Odisha did not determine the economic development of the state. Even though the level is more relative to the other 14 major states of the country, its declining trend shows its deterioration. A higher level of priority to populist social expenditures was found in the composition, indicating higher unproductive social expenditures. Populist social expenditures were determined by the level of competition for winning seats in the legislative assembly. The continuous shifting of priority from human capital formation to populist expenditures may adversely affect the development of the state. To enhance state development, political interferences should be removed, and a higher level of priority should be given to human capital formation.
Footnotes
Declaration of Conflicting Interests
The authors declared no potential conflicts of interest with respect to the research, authorship and/or publication of this article.
Funding
The authors received no financial support for the research, authorship and/or publication of this article.
Appendix
Rank of Different Indices of Social Expenditures of the 14 Major States.
| State | FWI | HSI | UDI | WSSOI | SSWI | RNCI | OTHI | PMI | ESACI | MPHI | WSSI | LLWI | NTI | HCFI |
| Andhra Pradesh |
2 | 5 | 6 | 1 | 8 | 6 | 7 | 3 | 14 | 11 | 8 | 11 | 1 | 10 |
| Bihar | 4 | 9 | 11 | 6 | 9 | 10 | 8 | 10 | 2 | 6 | 11 | 6 | 8 | 4 |
| Gujarat | 9 | 2 | 1 | 10 | 14 | 2 | 1 | 1 | 12 | 12 | 5 | 3 | 4 | 6 |
| Haryana | 13 | 14 | 5 | 14 | 1 | 8 | 6 | 11 | 11 | 14 | 2 | 2 | 10 | 3 |
| Karnataka | 7 | 1 | 10 | 3 | 6 | 12 | 5 | 4 | 8 | 5 | 6 | 9 | 7 | 11 |
| Kerala | 6 | 11 | 12 | 9 | 10 | 13 | 9 | 13 | 1 | 1 | 12 | 1 | 13 | 1 |
| Madhya Pradesh | 11 | 7 | 8 | 2 | 7 | 5 | 10 | 7 | 9 | 7 | 4 | 10 | 6 | 12 |
| Maharashtra | 14 | 4 | 4 | 4 | 12 | 3 | 11 | 9 | 4 | 13 | 9 | 4 | 5 | 9 |
|
|
|
|
|
|
|
|
|
|
|
|
|
|
|
|
| Punjab | 12 | 12 | 14 | 12 | 11 | 11 | 12 | 14 | 13 | 8 | 10 | 7 | 12 | 14 |
| Rajasthan | 5 | 13 | 3 | 13 | 13 | 4 | 14 | 12 | 10 | 10 | 1 | 14 | 9 | 8 |
| Tamil Nadu | 3 | 3 | 7 | 8 | 2 | 7 | 2 | 2 | 7 | 4 | 7 | 8 | 2 | 2 |
| Uttar Pradesh | 1 | 8 | 9 | 7 | 3 | 9 | 13 | 6 | 3 | 2 | 13 | 5 | 14 | 7 |
| West Bengal | 10 | 10 | 2 | 11 | 4 | 14 | 3 | 8 | 5 | 3 | 14 | 13 | 11 | 13 |