
Abstract
This study examines the stress spillover of the stock market, bond market and exchange market among the BRICS countries during the COVID-19 pandemic. Following the principal component analysis approach, a composite stress index is developed for each country to measure the stress level in BRICS. We use the dynamic conditional correlation-generalized autoregressive conditional heteroskedasticity (DCC-GARCH) approach to investigate the dynamic connectedness among the countries. While the stress in the stock market and exchange market is measured by their respective volatility, the bond market fluctuation is examined by using the yield spreads between the 10-year government bonds yield of BRICS countries and 10-year government bond yield of the United States. The study finds that among all the BRICS countries, India and China have been major transmitters as well as receivers of the stress spillover. The findings of our study contribute to the literature by highlighting the importance of understanding the behaviour and interconnectedness of the economies in a group. The study also provides valuable insights to policymakers who need to be more vigilant about the financial crisis and spillover among the countries.
Introduction
The ongoing crisis of COVID-19 has already made a radical impact on the global economy. Policymakers are in a dilemma about the rising uncertainty. The pandemic has not only had an economic effect, but it has also infected the world’s social and political set-ups. The World Health Organization (WHO) acknowledged COVID-19 as a pandemic on 11 March 2020. Since then, a climate of fear and panic has begun to spread through all nations—developing and developed alike. The situation in emerging economies is worsening, as exports are collapsing and credit conditions are tightening (Djankov & Panizza, 2020). According to Hevia and Neumeyer (2020), developing countries are suffering more than developed countries due to ineffective policy measures to combat the pandemic. Researchers, regulators and politicians are all attempting to comprehend and forecast the global effects of this crisis. Policymakers and governments around the world are unveiling a slew of economic stimulus packages in an attempt to resurrect their ailing economies.
While the crisis has disrupted the entire global economic climate, the rapid reaction can be seen in the form of large fluctuations in some of the financial market’s main sectors, including the stock market, bond market and currency market. Given the context, the objective of our study is to examine the financial stress among the BRICS countries and how the stress transmits among them during the pandemic. There is a considerable amount of literature evaluating the effect of COVID-19 on stock exchanges all over the world. However, there seems to be a lack of literature on the bond and currency markets. Our study fills this gap by adopting a comprehensive approach to evaluate the fluctuation in the three major sectors of the economy of BRICS countries: the stock markets, bond markets and exchange markets. Besides, in our understanding, this is the first study that examines the volatilities spillover of these sectors among the BRICS countries during the pandemic. We follow the dynamic conditional correlation-generalized autoregressive conditional heteroskedasticity (DCC-GARCH) connectedness approach adapted by Gabauer (2020) to measure the stress spillover.
BRICS countries are the foremost emerging players in the world’s economy. BRICS is one of the largest political cooperation groups. The BRICS countries collectively account for 30% of global trade and are home to more than 40% of the world’s population. Following the United States, India, Brazil and Russia were among the worst-affected countries due to COVID-19. At the same time, South Africa was also among the top 20 worst-affected countries at the time of data collection.
Because of the scale of these economies and their prominent positions worldwide, the stress caused by the pandemic would have a severe and long-term effect on the global economy as a whole. India, Brazil and South Africa are projected to have more serious effects among the five countries, as these are relatively more developing in nature with several fundamental issues (Singh & Misra, 2020). Despite its status as a developing economy, China is the only country in the group (and the world) that began to show signs of recovery in late September 2020. However, since the pandemic is ongoing, the future remains unpredictable and uncertain.
We analyse the daily data starting from December 2019 to April 2021. The volatilities of the stock and exchange markets are calculated to understand the fluctuations in these markets. In addition, to examine the stress in the bond market, the difference between the 10-year government bond’s yield of each country and the 10-year government bond yield of the United States (taken as a benchmark) is considered. Following the principal component analysis (PCA), we develop a stress index by accounting for three markets. The comprehensive stress index is constructed to measure the overall stress of each country. Having created the index, we followed the DCC-GARCH approach to examine the spillover of the volatilities among the BRICS countries.
The findings of our study suggest that most countries experienced high fluctuations during March and April 2020 (the early stage of the pandemic) but the anxiety decreased as time went on. Second, these countries witnessed the spillover of the stress from and to their peer countries. Among all the countries, India and China were major transmitters and receivers of stress. The results of our study have significant implications for the policymakers and regulators who are responsible for forming the policies to bring stability to the economy during various economic cycles. The results of our study also reflect the dynamic connectedness among the economies, especially during the financial crisis.
The paper has been structured in the following manner: the second section addresses the literature review, the third section describes the data and methodology, the fourth section highlights the results, the fifth section discusses the implication and the sixth section is the conclusion.
Literature Review
COVID-19 has influenced almost every aspect of life, including economic, social and political. The pandemic is having a negative effect on economies all over the world, from industrialized to emerging. The situation in emerging economies is more vulnerable, as exports are collapsing and credit conditions are tightening (Djankov & Panizza, 2020). Developing countries are suffering more than developed countries due to ineffective policy measures to combat the pandemic argued by Hevia and Neumeyer (2020). It is difficult for these countries to issue new debt to alleviate the pandemic shock. Although the effect of this global pandemic on the world economy was apparent, the extent of that impact will become more evident in the coming months. Policymakers, practitioners and academics are focusing their efforts on determining and examining the effect of the COVID-19 on the global economy’s well-being. For example, Topcu and Gulal (2020) conducted a study to analyse the impact of COVID-19 on emerging countries stock markets, concluding that officials’ response time and the economic packages offered by regulators have an impact on offsetting the pandemic’s effects.
Similarly, Phan and Narayan (2020) investigate real-time stock market reactions at various stages of the pandemic. He used a sample of 500 publicly traded firms from 10 emerging markets to investigate the effects of COVID-19 at the firm stage. They discovered that the pandemic has a negative effect on the majority of businesses. As a result, these countries have reduced their spending and halted many programs.
COVID-19 and BRICS
BRICS is one of the largest associations of the major emerging economies. In 2011, the BRICS Forum was recognized as an autonomous international organization with an objective to promote commercial, political and cultural interaction among the BRICS states. The BRICS nations offered $75 billion in June 2012 to increase the International Monetary Fund’s (IMF) lending ability. The BRICS countries have been the engine of global growth over the years. However, these countries have also been severely affected by the ongoing pandemic. A significant portion of the Brazilian labour market (83.5%) has reached a vulnerable point (Prates & Barbosa 2020). Furthermore, approximately 26 million employees would be uncompensated by any financial package such as unemployment benefits, basic emergency income (EBI) or any other form of relief compensation (Prates & Barbosa, 2020). The pandemic’s consequences have been felt throughout the Russian economy as well. The rate of unemployment went up to 6.3% in October 2020, the highest level in eight years. Between the second and third quarters of 2019 and 2020, half a million jobs were lost in each of three major sectors, namely, construction, manufacturing, and retail and hospitality services. According to the report published by the World Bank (2020), the national poverty rate in Russia reached 12.6% and 13.2% in the first and second quarters of 2020, respectively.
The government of South Africa also declared a national state of disaster on 16 March 2020, followed by a 21-day country-wide lockdown. The pandemic came at a time when South Africa’s economy was already under severe stress. Economic growth in 2019 was 1.5%, down from 3% in 2010. In fact, the economy entered a technical recession in the fourth quarter of 2019. According to the South African government database, unemployment peaked at 27.3% in the first quarter of 2019, and by the third quarter, it had grown to 29.1%. In a speech to the nation, South African President Jacob Zuma said that the pandemic would have devastating economic implications because the country is already suffering from high levels of poverty, malnutrition and diseases such as HIV and TB.
The situation in India is no different. On 24 March 2020, the country went into lockdown (the world’s biggest lockdown). The United Nations has predicted that the country’s GDP would decline by 5.9% and has warned that this contraction could result in permanent income loss. According to the Ministry of Statistics, India’s growth fell to 3.1% in the last quarter of the fiscal year 2020. As per India’s Chief Economic Adviser, the fall is mainly attributable to the coronavirus pandemic’s impact on the Indian economy. The World Bank states that India was already in recession before the pandemic, and the new epidemic has ‘exacerbated pre-existing economic issues in India’.
The Chines economy, however, presents a different scenario. Although the outbreak of the pandemic was first discovered in China in December 2019, the situation had steadily improved since mid-March 2020, and businesses have been systematically resuming work and development. Other economies, such as the United States, are lagging behind China to contain the spread of COVID-19 and reopen the economy (Liu, 2021). According to a UN survey, the Chinese economy is projected to rise by 1.3% in 2020 and by 8.1% in 2021.
These projections are sufficient to suggest that the next few years will not be particularly smooth for these economies. While the long-term impact on the world economy would be more visible in the coming future, a current scenario of important sectors can be studied to understand the flow. In this line, keeping in mind the importance of BRICS in the world economy, we have investigated the volatilities of stock, bond and exchange markets, and the spillover of the stress among the countries of interest.
Financial Stress, the Spillover and Stress Index
The literature describes periods of financial stress in several ways. For example, Illing and Liu (2006) describe financial stress as the force put on economic agents by uncertainty and fluctuating expectations of losses in financial markets and institutions. According to, financial stress Hakkio and Keeton (2009) is a disturbance in the normal functioning of financial markets. In addition, Balakrishnan et al. (2011) suggest that financial stress occurs when the financial system is under strain and its ability to transact is compromised.
The spillover of financial stress occurs when the economic event in one country transmits its impact to the other countries through different ways. For instance, the collapse of Lehman Brothers in the United States caused the global financial crisis of 2008. Similarly, the Eurozone bond crisis in 2011 created an unprecedented reaction across the global economies. The United States spent a total of $20 trillion to avoid the collapse of the banking sector, while the governments in Europe spent €312 billion on bailing out financial institutions (Fratzscher et al., 2016; Hryckiewicz, 2014; Kizys et al., 2016).
The financial stress index (FSI) is used to provide an aggregate picture of the economic health. There is extensive literature available on financial stress indices, their components and aggregation methodology. For instance, Cardarelli et al. (2011) employ an FSI to detect instances of financial distress and present an analytical framework for assessing the impact of financial stress on the real economy. The authors follow the variance-equal weighting method to aggregate the index. Balakrishnan et al. (2011) build on the work of Cardarelli et al. (2011) and use the same methods to develop FSIs for emerging economies. Hakkio and Keeton (2009) developed the Kansas City FSI (KCFSI), a comprehensive measure of financial stress in the United States economy. The existing literature mostly follow two methods of developing the FSI, the variance equal weighting method and the principal component analysis approach. However, while constructing the index, the former gives equal weights to the variable, which is a shortcoming overcome by the principal component analysis approach. Our study follows the principal component analysis approach while constructing the FSI. We explain the same in the next section on data and methodology.
Data and Methodology
The study consists of daily data for the last 17 months starting from December 2019 to April 2021. China reported the first case in December 2019; however, WHO declared COVID-19 as a global pandemic in early March 2020. The data is collected from the stock exchange of respected countries, but for some data, the Federal Reserve Economic Database (FRED) is also approached. We first built the stress index for each country using three components, namely, stock market volatility, exchange market volatility and bond yield spreads. The literature shows that several studies have been conducted to measure the stress level of the economies using the stress index. Our approach to building the index is similar to that adapted by Apostolakis and Papadopoulos (2015).
Stress index = volatility of stock market + volatility of exchange market + bond yield spread
To build the index, the principal component analysis approach is followed. Taking the index of each country, we then measured the connectedness of the economies by following the DCC-GARCH model adapted from Gabauer (2020) that provides an alternative to the vector auto regression (VAR)-based connectedness approach used by Diebold and Yilmaz (2012, 2014). The DCC-GARCH model overcomes the two major disadvantages of the earlier connectedness approach which are (a) loss of observations due to the rolling window size and (b) arbitrarily selection of window size (Gabauer, 2020).
DCC-GARCH Model
We employ the two-step DCC-GARCH model to examine the time-varying conditional volatility. The model can be expressed as follows:


Where,
Ft−1 presents all information available up to t − 1, Yt is the N # 1 dimensional vector that represents the analysed time series, µt is the N # 1 dimensional vector that expresses the conditional mean, st is the N # 1 dimensional vector that expresses the error term, ut is the N # 1 dimensional vector that expresses the standardized error term. Rt is the N # N dimensional matrix representing dynamic conditional correlations, Ht is the N # N dimensional matrix representing time-varying conditional variance-covariance matrices, and Dt = diag (
Volatility Impulse Response Function
It is worth noting that the connectedness approach pioneered by Diebold and Yilmaz (2012, 2014) is based on the generalized impulse response functions (GIRFs) developed by Koop et al. (1996) and Pesaran and Shin (1998). The GIRF is independent of the variable ordering and can be expressed as the J - step ahead impact of a shock in variable i on variable j. Similarly, the volatility impulse response function (VIRF) quantifies the effect of a shock n variable i on variable j’s conditional volatilities. This VIRF is the base of computing forecasting of conditional variance-covariance by adopting the DCC-GARCH model. 1
Dynamic Connectedness Approach
The VIRF is used to compute the generalized forecast error variance decomposition (GFEVD), which can be understood as the variance share that one variable explains for others. These variance shares are normalized such that each row amounts to one, indicating that all variables collectively account for 100% of the forecast error variance for variable i. This is computed as follows:
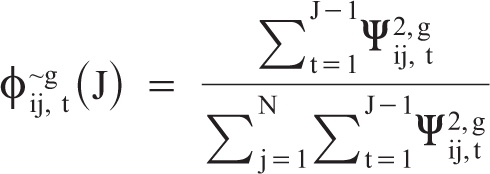
Where

The numerator denotes the cumulative effect of the ith shock, whereas the denominator denotes the cumulative effect of all shocks. The total connectedness using the GFEVD can be computed as follows:
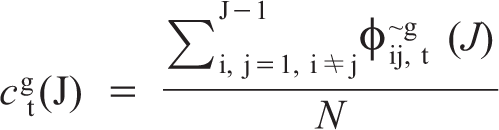
Now the total directed connectedness (variable i transfers to variable j) can be computed as follows:
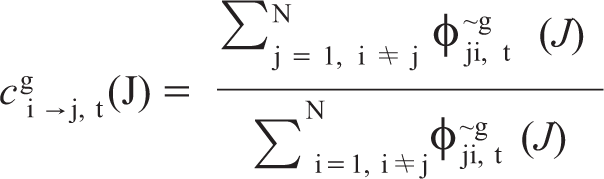
Second, the total directional connectedness (spillover variable i received from others) can be explained as follows;
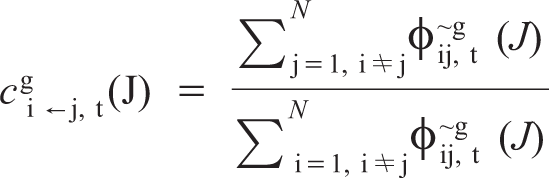
Finally, the difference between equation (6) and equation (7) is called net directional connectedness.
Descriptive Statistics
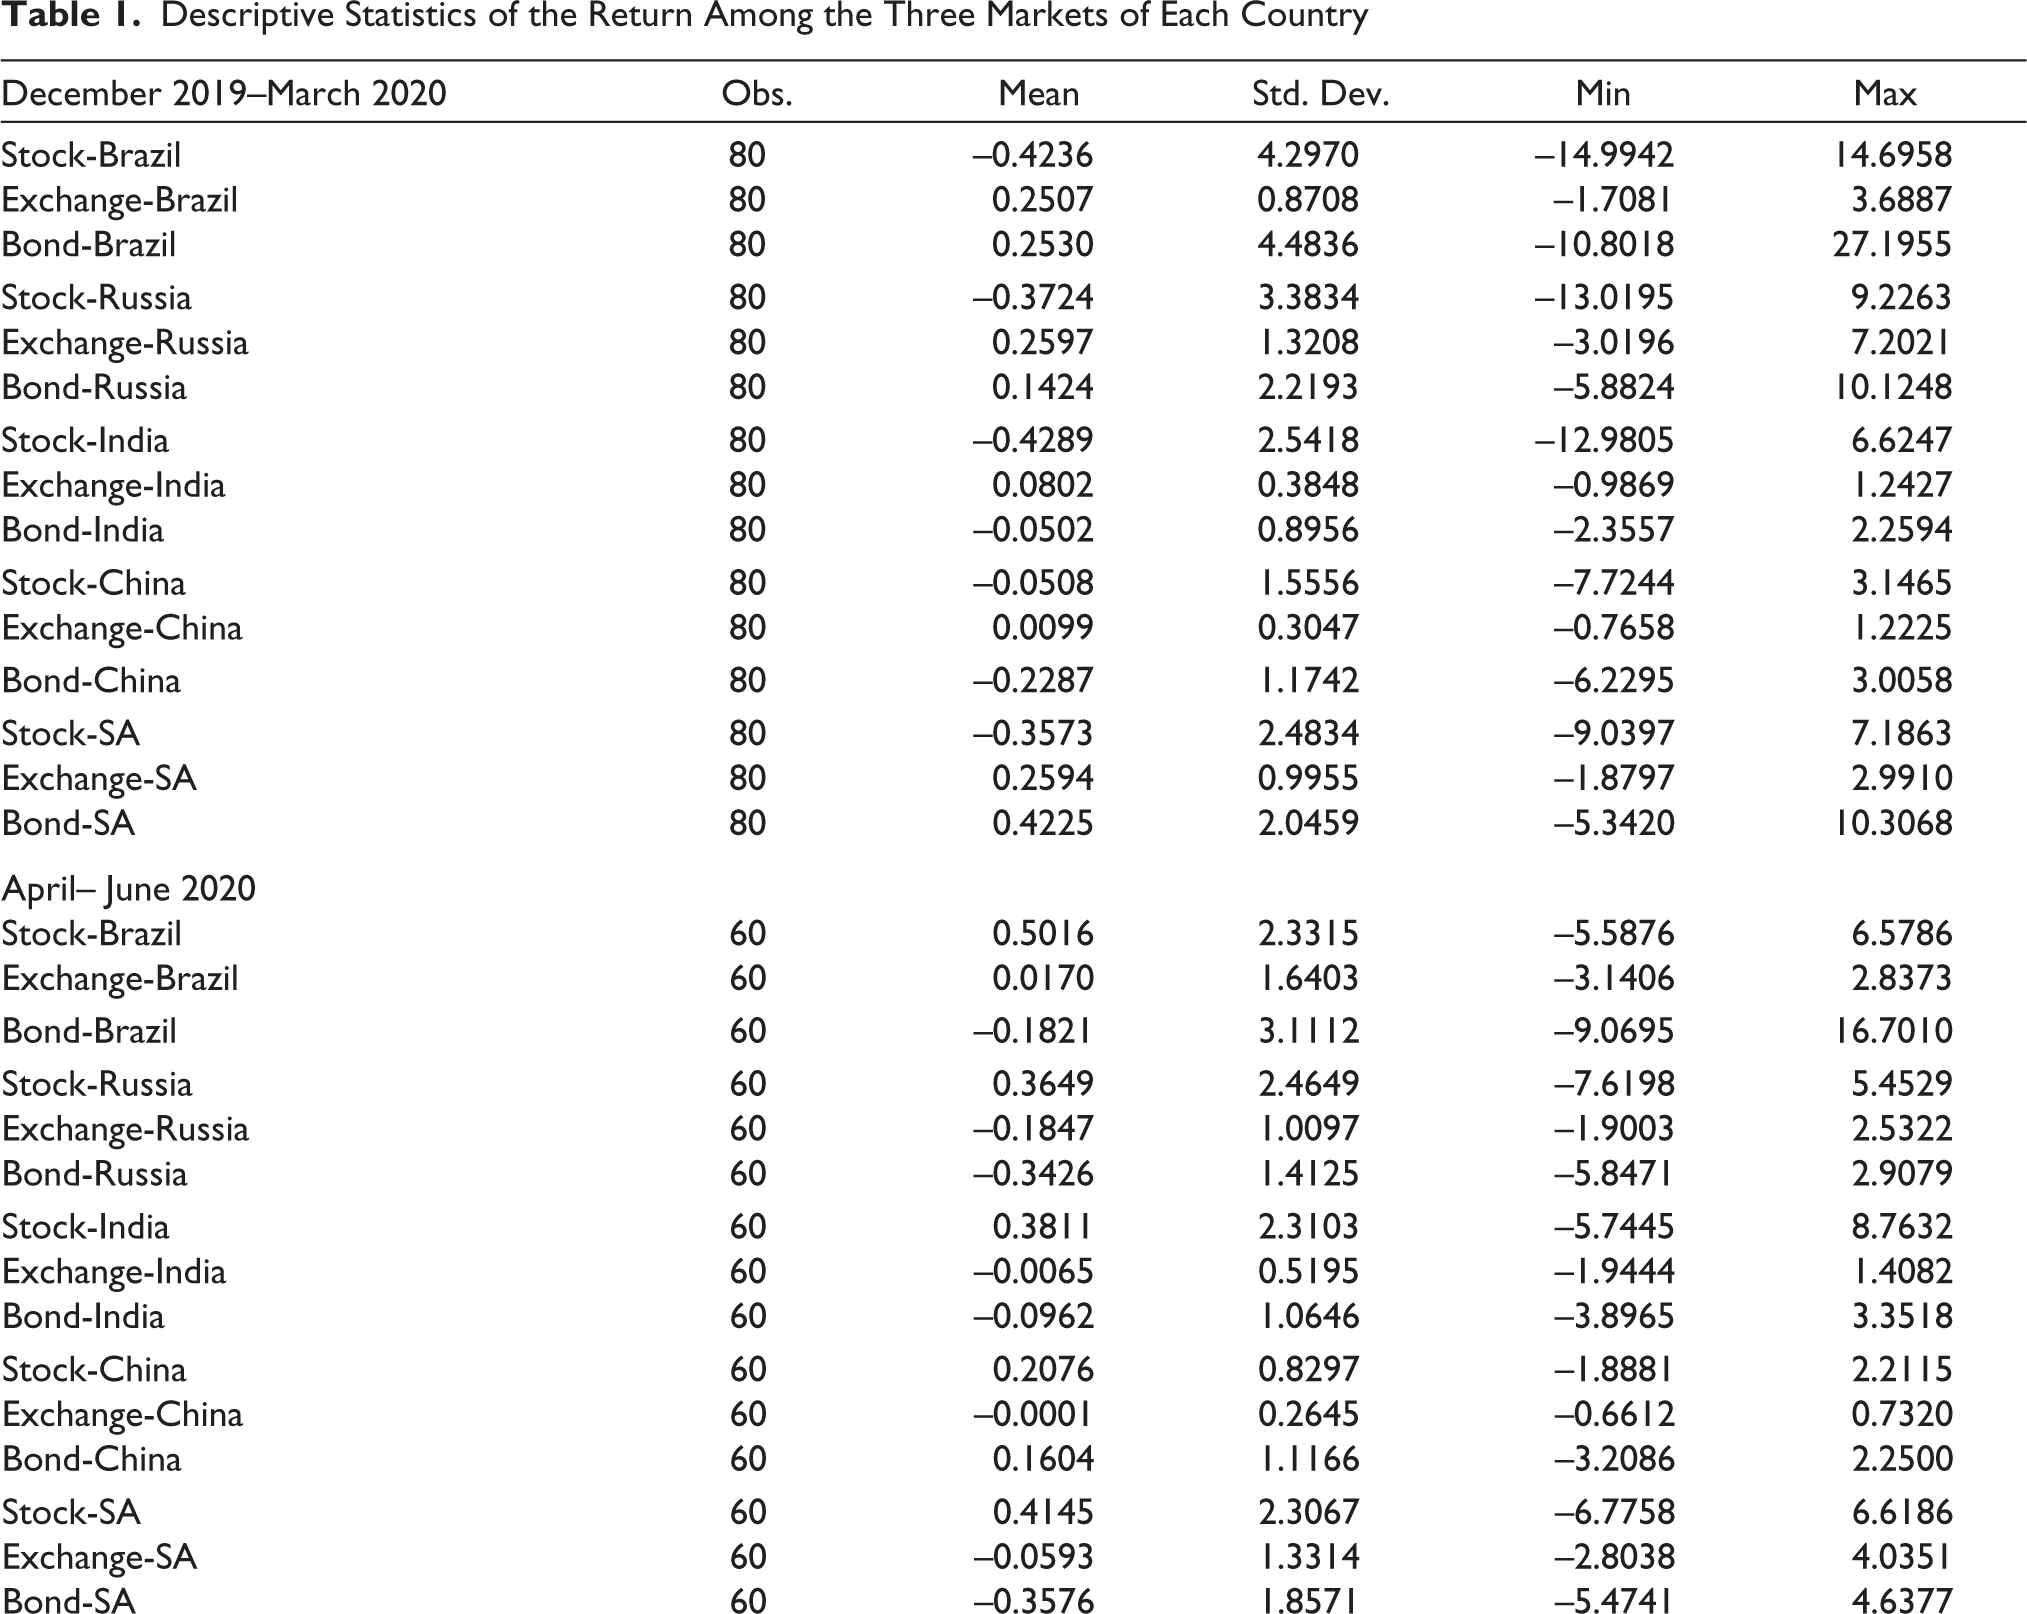
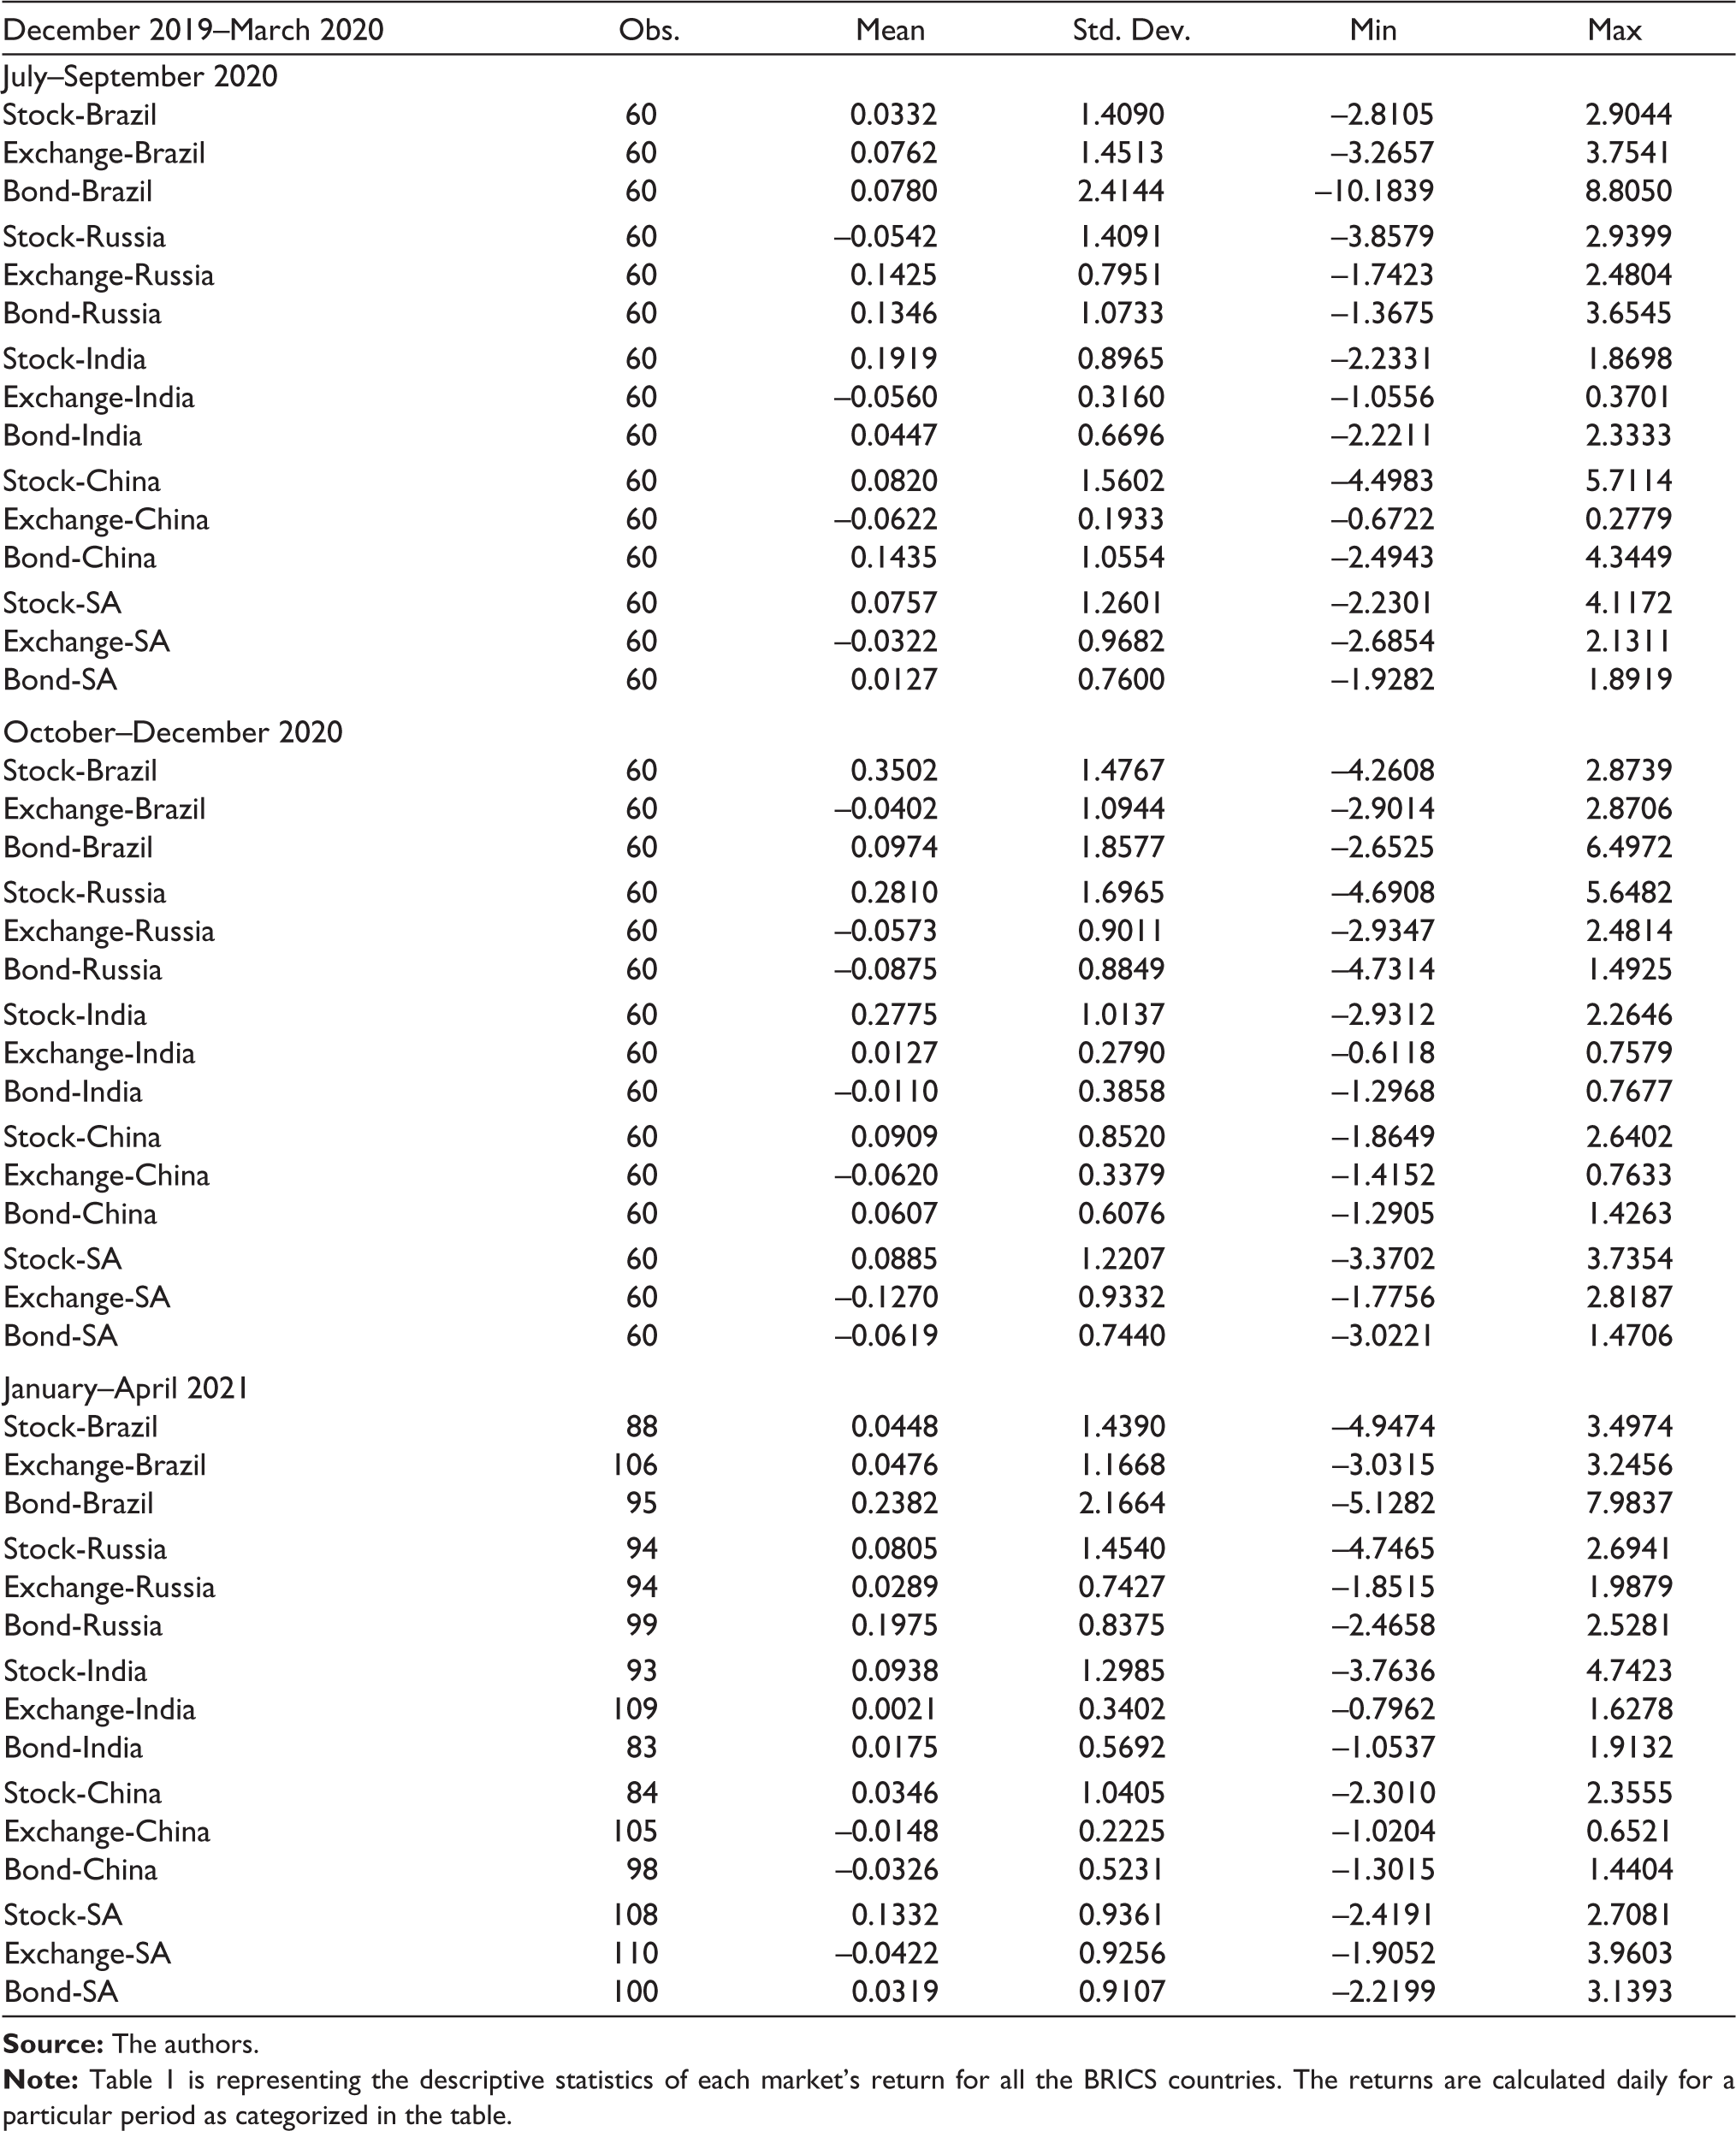
Table 1 presents the country-wise descriptive statistics of the returns for all three markets. The table is divided into five time periods to check the quarter-wise volatilities among the markets. We can see that during the first phase (December 2019 to March 2020), the fluctuation among the markets was relatively high for each country, especially the stock market. This high fluctuation is a little apparent since this is the period when the pandemic started spreading globally. The maximum and minimum values were extreme during the initial period and came down in the later part.
Descriptive Statistics of the Return Among the Three Markets of Each Country
Results and Discussion
Stress Among the BRICS Countries
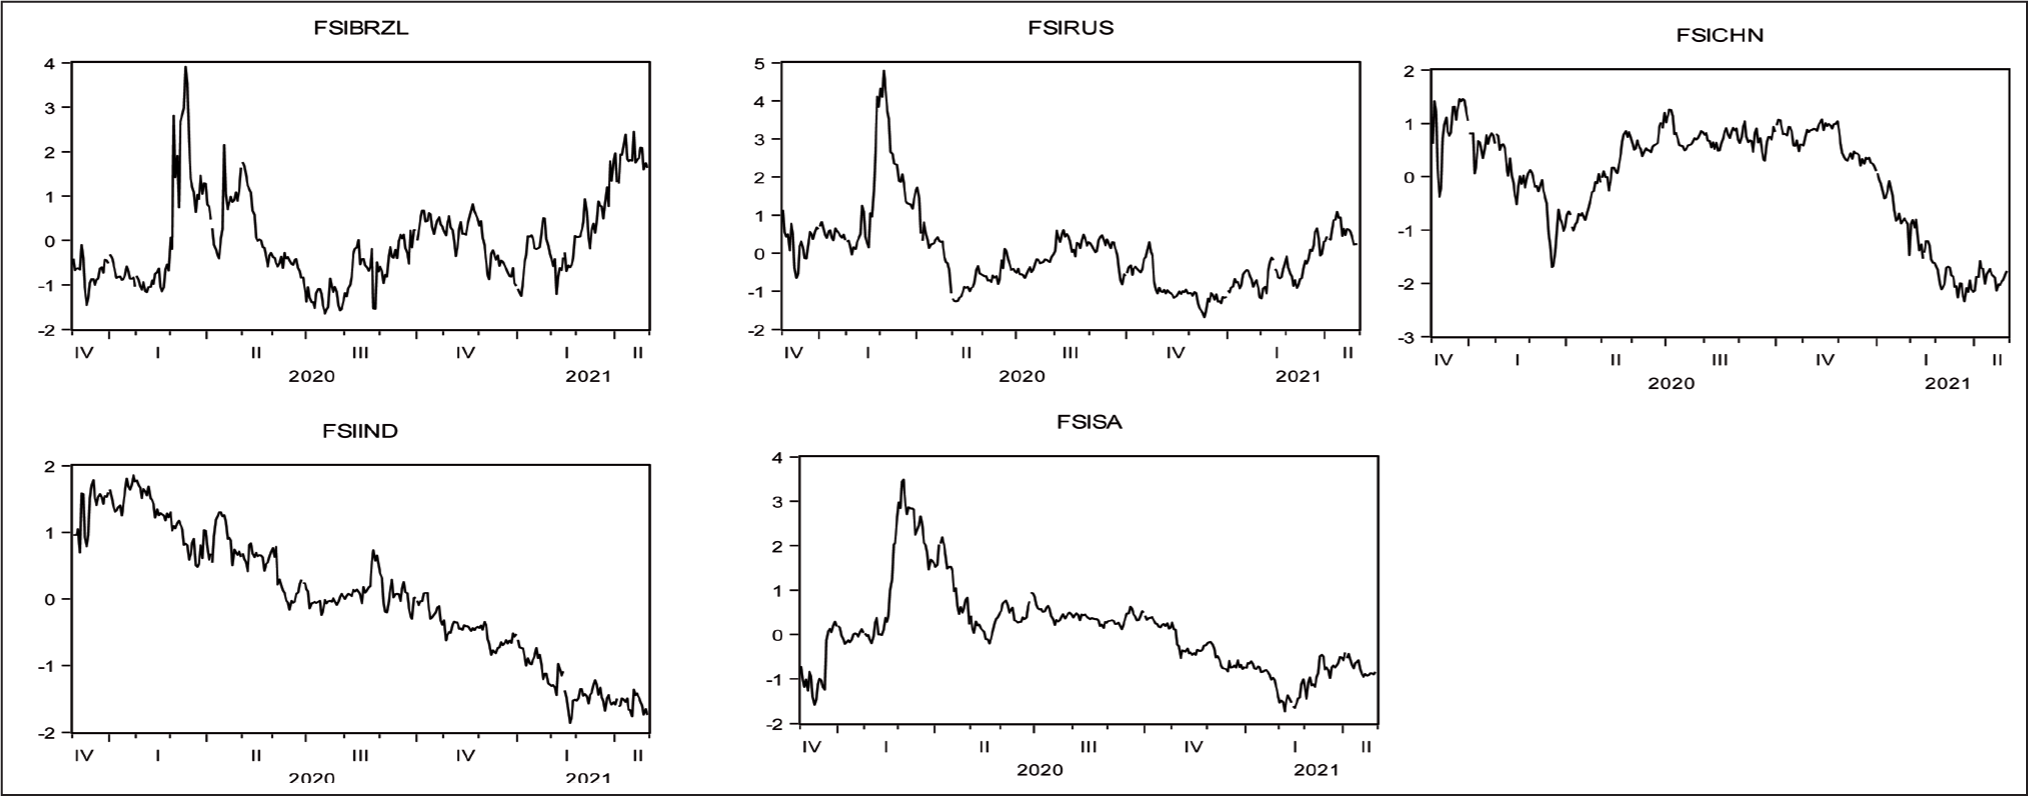
The stress among BRICS countries is depicted in Figure 1 using each country’s stress index. Almost all countries witnessed increased stress during the months of March and April in 2020, as the majority of countries went into lockdown during this period, causing increased anxiety and uncertainty. However, at this time, the stress level in China was lower. This is not very surprising as the country had significantly reduced the spread of the virus by that time. The stress in China was high however in December 2019 and January 2020, the time when the country was experiencing the highest cases of infection. The stress level began to rise again at the start of the second quarter when the pandemic reached its global height. The spike in India has been positive from the start because the country has been experiencing an economic downturn since early 2019. The IMF had also predicted a slowdown in the Indian economy. Since August 2020, when the economy was partially opened, the level of stress has been decreasing. Russia, Brazil and South Africa experienced a similar trend.
Dynamic Connectedness Among the BRICS Economies
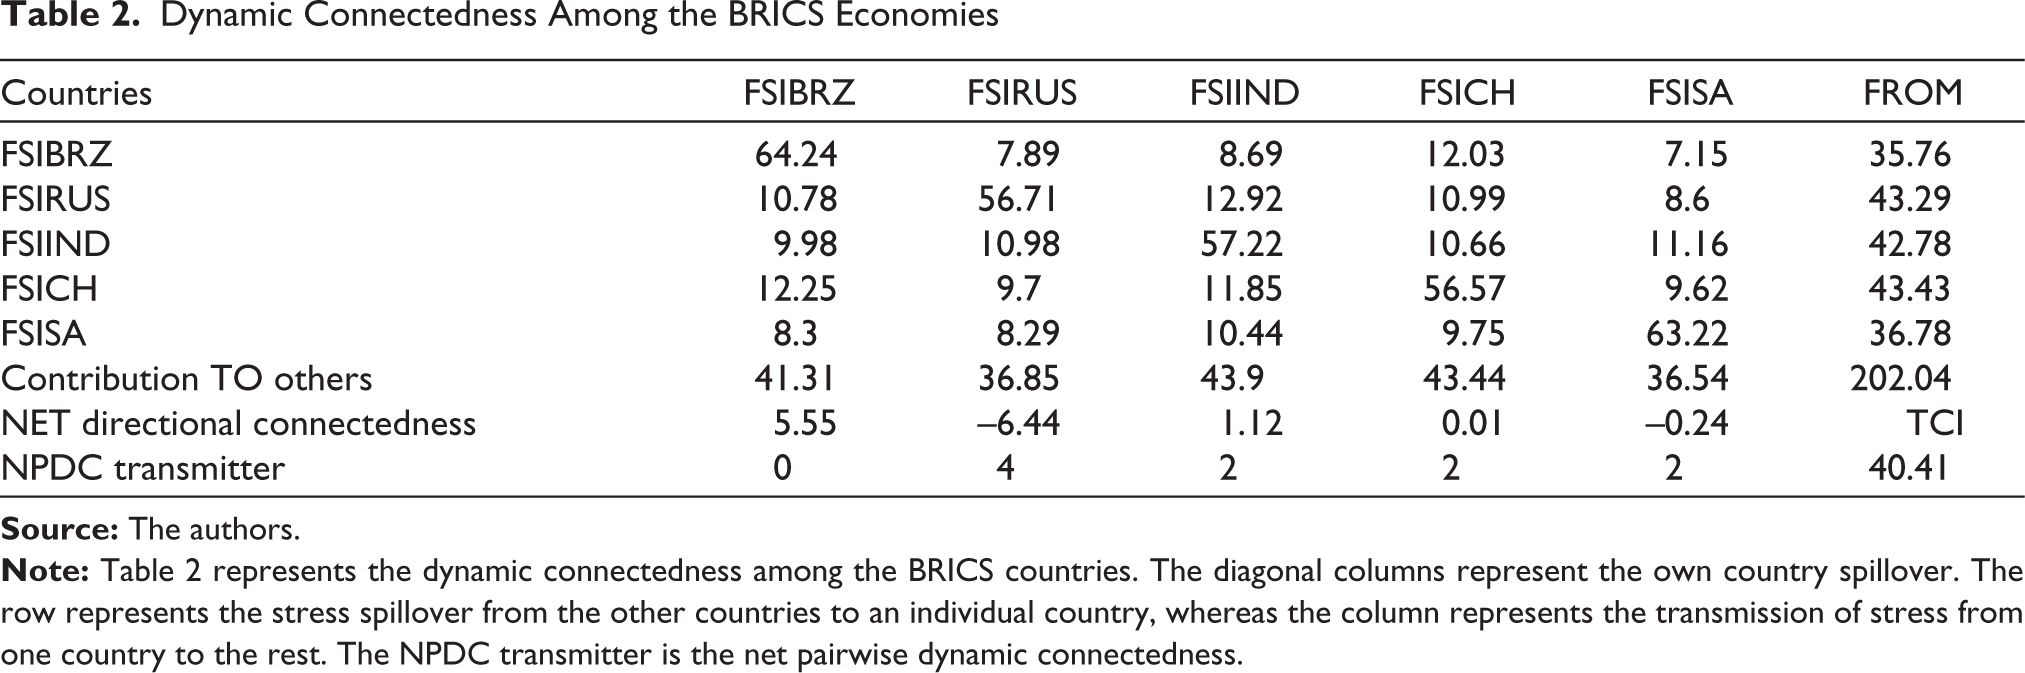
Since the markets have gradually become more interconnected, the co-movement of stress is becoming more severe during the financial turbulence. Table 2 shows the dynamic connectedness among the BRICS economies. The diagonal value represents the own-country spillover, whereas off-diagonal elements provide cross-country spillover effects. The rows indicate the spillover of the stress from the other countries to one country, and the column shows the impact spilled over from one country to another. We find that the own country’s spillover is the highest in Brazil (64.24%), followed by South Africa (63.22%), India (57.22%), Russia (56.71%) and China (56.57%). The own-country spillover also depends upon the domestic consumption. The higher the share of domestic demand in the overall GDP, the more the shock to the domestic market of any financial crisis. Table 2 also indicates that India and China, followed by Brazil, have contributed the most to other countries in terms of spillover effects; however, on the receiving side, it was India followed by China and Russia who have received the highest stress from other countries. The total transmission amongst the BRICS economies was 40.41%, which demonstrates the importance of the spillover.
Dynamic Connectedness Among the BRICS Economies
Pairwise Dynamic Connectedness
In Figure 2, we look at pairwise spillover effects of the countries. The spikes in the graph indicate the transmission of the spillover between the two countries. For instance, in the Brazil–China chart, we see that in the initial (the time when the virus was detected in China) and last months of 2020, the impact of the stress event spilled over from China to Brazil, while in the earlier months of 2021, the impact of the stress events spilled over to China from Brazil. In another India–China relationship, a similar pattern was seen, especially when in the initial months of 2020, the impact spilled over from India to China, whereas at the beginning of 2021, the impact spilled over to India from China. In the case of India and South Africa, both the countries shared the stress during the first and second waves of the virus as reflected by the spikes, however, in between, the level of stress has been insignificant. From April 2020, Brazil has been the stress transmitter to the rest of the countries; the reason could be the high impact of the underlying pandemic in the country during the same period.
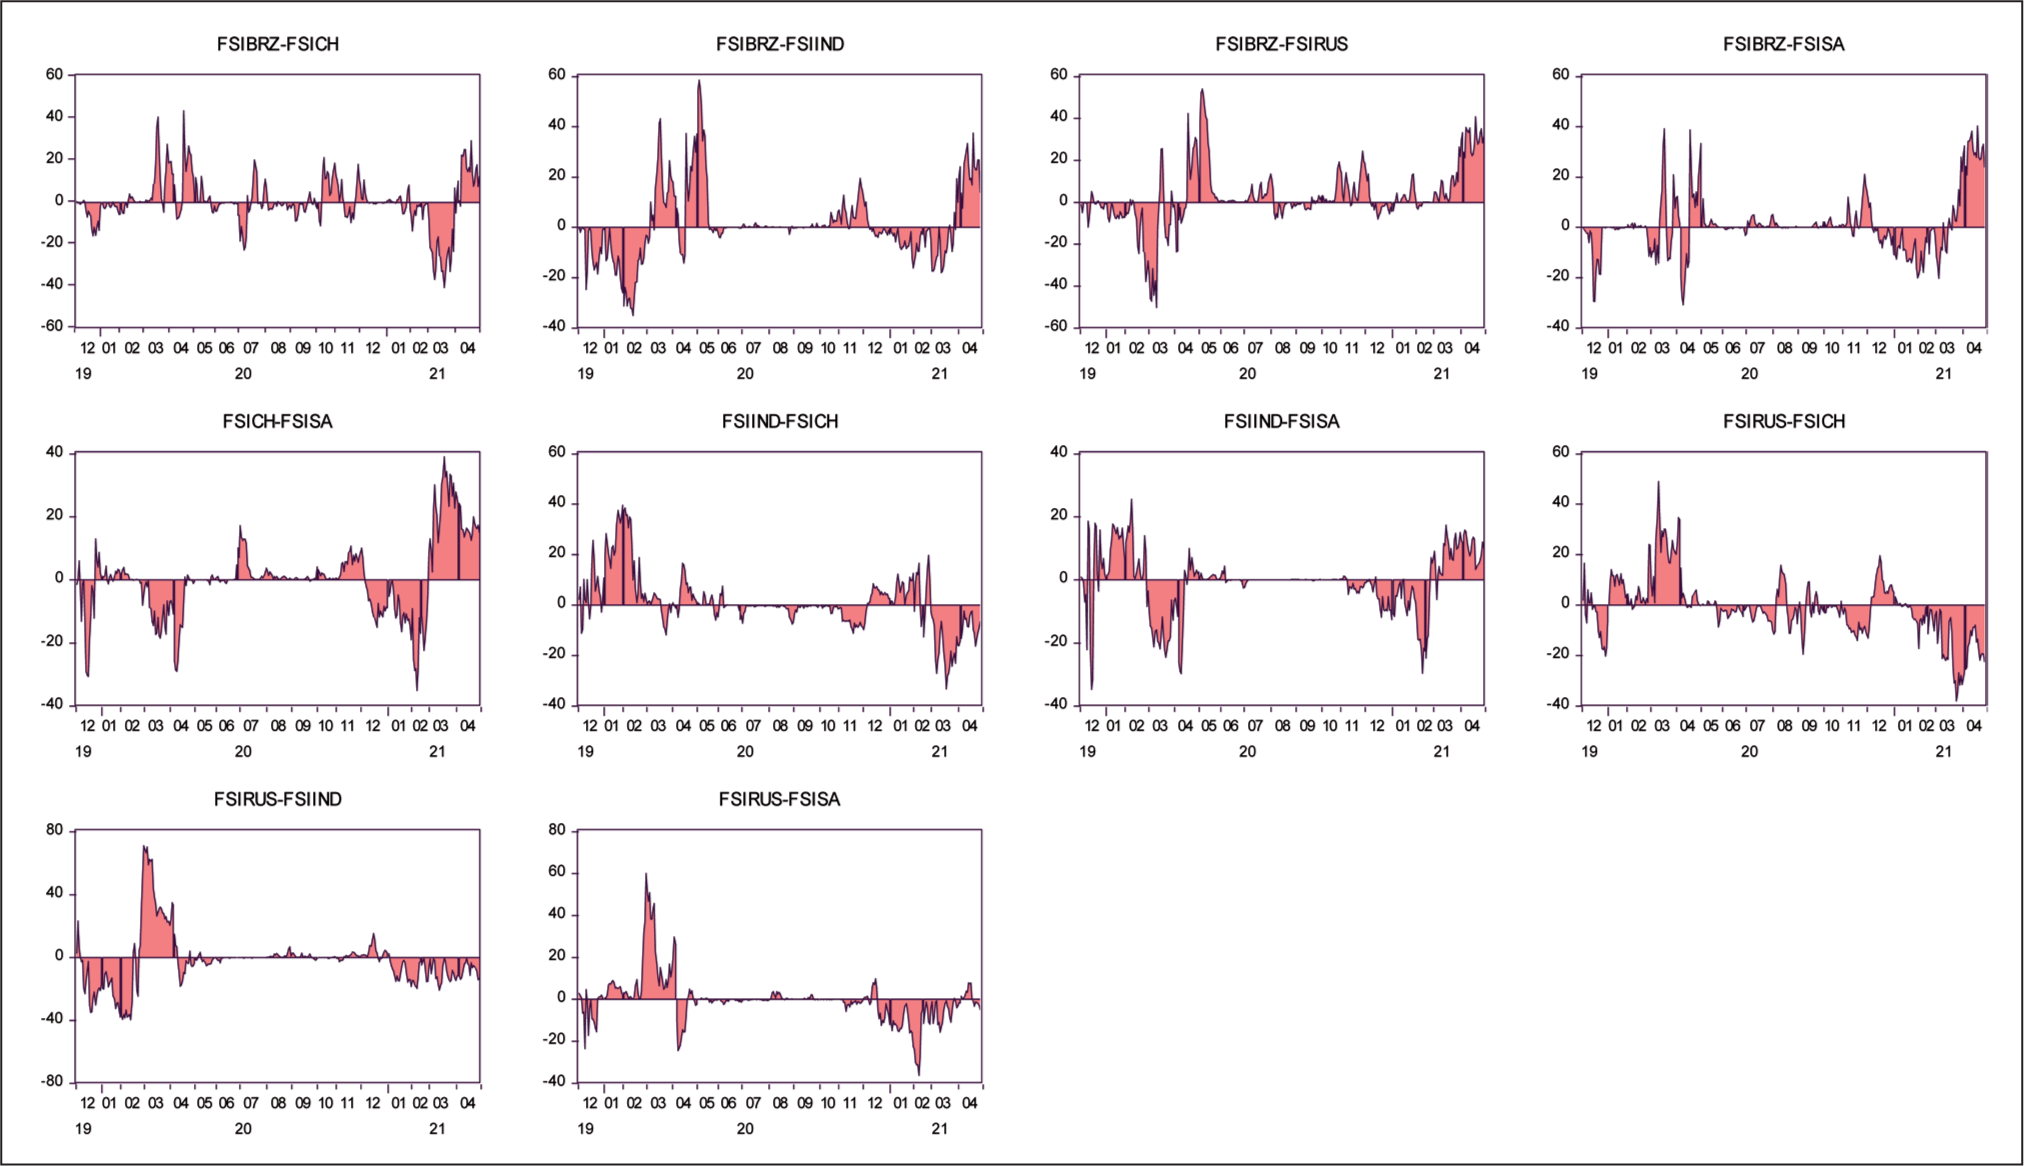
One common trend that can be majorly observed is that the stress spillover was high in the initial months of 2020 and 2021. The reason for this could be the arrival of the first and second waves of COVID-19 during these time periods. The spillover from the first country to the second happened when the pandemic reached its heights in that particular country.
Overall, the findings of our analysis suggest that the pandemic has significantly impacted the global economy. The pandemic has expanded at an alarming rate, infecting millions of people and bringing economic activity to a halt as countries enact stringent movement restrictions to slow the spread of the virus. Economic damage is already evident as the toll on health and human life continues to climb, resulting in the worst economic shock the world has experienced in decades. Despite unprecedented measures by governments to address the crisis with fiscal and monetary policy support, the World Bank has already deemed the present crisis to be the biggest global recession in decades.
Implication of the Study
Our study has different implications for investors and policymakers. Investors reduce their risk by engaging in hedging strategies. Therefore, understanding volatility dynamics in key markets and their relationship with financial stress is essential for investors to make investment decisions. The BRICS countries account for 19% of world exports, 16% of global imports, and 19% of incoming and nearly identical amounts of outgoing direct investment (Larionova, 2020). These figures exhibit not only the size of these economies but also their significant influence in the partner countries, and globally. A better understanding of financial stress, its accumulation and its spillover will enable regulators and policymakers to develop more effective policies and to apply them more effectively. This understanding becomes more critical for a country such as India since the country is already facing economic stress and seeking more international investments to revive the crisis. India shares a significant economic interest with the BRICS countries, and unlike the global financial crisis of 2008, the spillover of this economic crisis is unavoid-able for the country. Therefore, India requires a more diligent and effective policy measure and a better understanding of financial stress to ensure better control of the current crisis.
Our study has the following limitations. First, we study the spillover effects at the country level. A future study might look into the market-level spillover within each country. Second, because the frequency of data for other sectors is relatively low owing to the short timeframe, our stress index only comprises three areas of the economy: stock market, exchange market and bond market. Other micro and macroeconomic parameters can be included to construct a more composite index in the future. However, since the pandemic is still among us, further reactions of markets are hard to predict.
Conclusion
We have investigated the stress spillover among the BRICS countries using the three markets volatilities, namely, the stock market, bond market and exchange market. The period of the study includes 17 months, from December 2019 to April 2021. This study is motivated by the existing gap in the impact of the current COVID-19 pandemic on the financial sectors of the economy. Following the PCA, a stress index is developed to measure the stress by combining the volatilities of each of the three markets mentioned earlier. The DCC-GARCH approach is followed to measure the connectedness among the BRICS countries.
The results show that the volatilities were very high in March and April 2020, when COVID-19 was announced as a global pandemic and most of the countries went into lockdown. However, the stress level went down in the latter part of the year as countries started taking necessary steps in different forms to revive their respected economy. The study results indicate that China and India have been the major transmitters and receivers of the stress during this period among the BRICS countries. However, the difference between these two countries and the rest is not much. The overall spillover was 40.41%, which indicates the significant dynamic connectedness among these countries. Since we have not measured the market-wise spillover, a future study can look into it. As the pandemic is ongoing, a definite conclusion is not easy to make. A clearer picture of the pandemic’s impact on the BRICS economy as well as the world economy will be reflected in the coming months.
Footnotes
Declaration of Conflicting Interests
The authors declared no potential conflicts of interest with respect to the research, authorship and/or publication of this article.
Funding
This study has been conducted independently by the authors and not funded by any agency.