
Abstract
Pessimism looms large all over. COVID-19 has been projected as worse than the Great Depression of 1930. Everyday analyst and agency reports are diving into new bottoms of a fall-down in economic activities. Indian economy, however, has a slightly different story to tell at this hour of crisis. The silver lining for the Indian economy comes from a steep fall in the crude oil prices from around $70 per barrel to a record 18 years low of $22 per barrel. This windfall gain can, to some extent, offset the direct losses due to COVID-19. At the same time, dreams like a $5 trillion economy no longer look even a remote possibility. This article takes stock of the likely impact of COVID-19 on the Indian economy in the short term and the long term. A decision-tree approach has been adopted for doing the projections.
Introduction
The objective of this paper is to assess the impact of COVID-19 on the Indian economy in the short term and the long term. The research question being addressed is What will be the impact of COVID-19 on the Indian economy in the short term and the long term? A decision-tree approach has been adopted for doing the projections that spell out the impact. Different scenarios have been considered for assessment of the economic impact. These scenarios have been constructed to follow the generally adopted standard pattern of ‘best’, ‘middle’ and ‘worst’ (Hyndman & Athanasopoulos, 2018). In most of the projections, a scenario framework of strong, moderate and weak recovery of the economy has been considered in line with the three general options that are used.
Since the Indian economy is a part of the global economy first a stock of the global impact has been taken. Before measuring the likely impact on the Indian economy, the methodology has been spelled out in the assessment part of the paper. A wide range of literature in the form of global and local reports from eminent financial experts has been referred. Tables 1 and 2 give details of these literature reviews. As a policy emphasis was given on reference to agency research rather than individual author opinions. Agency research offers more credibility and reliability. Five popular economic indicators: GDP growth rate, inflation, unemployment, interest rate and industrial output, were chosen for measurement of the impact. Findings for this paper are in the form of short-term and long-term projections for the key economic indicators. These have been given and discussed at the end of the assessment of each of the economic indicators. Moreover, they have also been consolidated before the conclusion. A few suggestions have been given as a part of the conclusion.
Ever since the break out of COVID-19 virus pandemic, analysts and experts worldwide are in a race to project bigger and bigger economic troubles for the global economy. With each day passing, the new forecasts are showing a gloomier picture than the previous one. A decline of the global economy by 1% as compared to the previous projection of a 2.5% growth has been forecasted by the UN on 2 April 2020 (The Economic Times, 2020a). The net impact that is projected is around 3.5%. The size of the world economy in 2017 was $80 trillion, as shown in Figure 1.
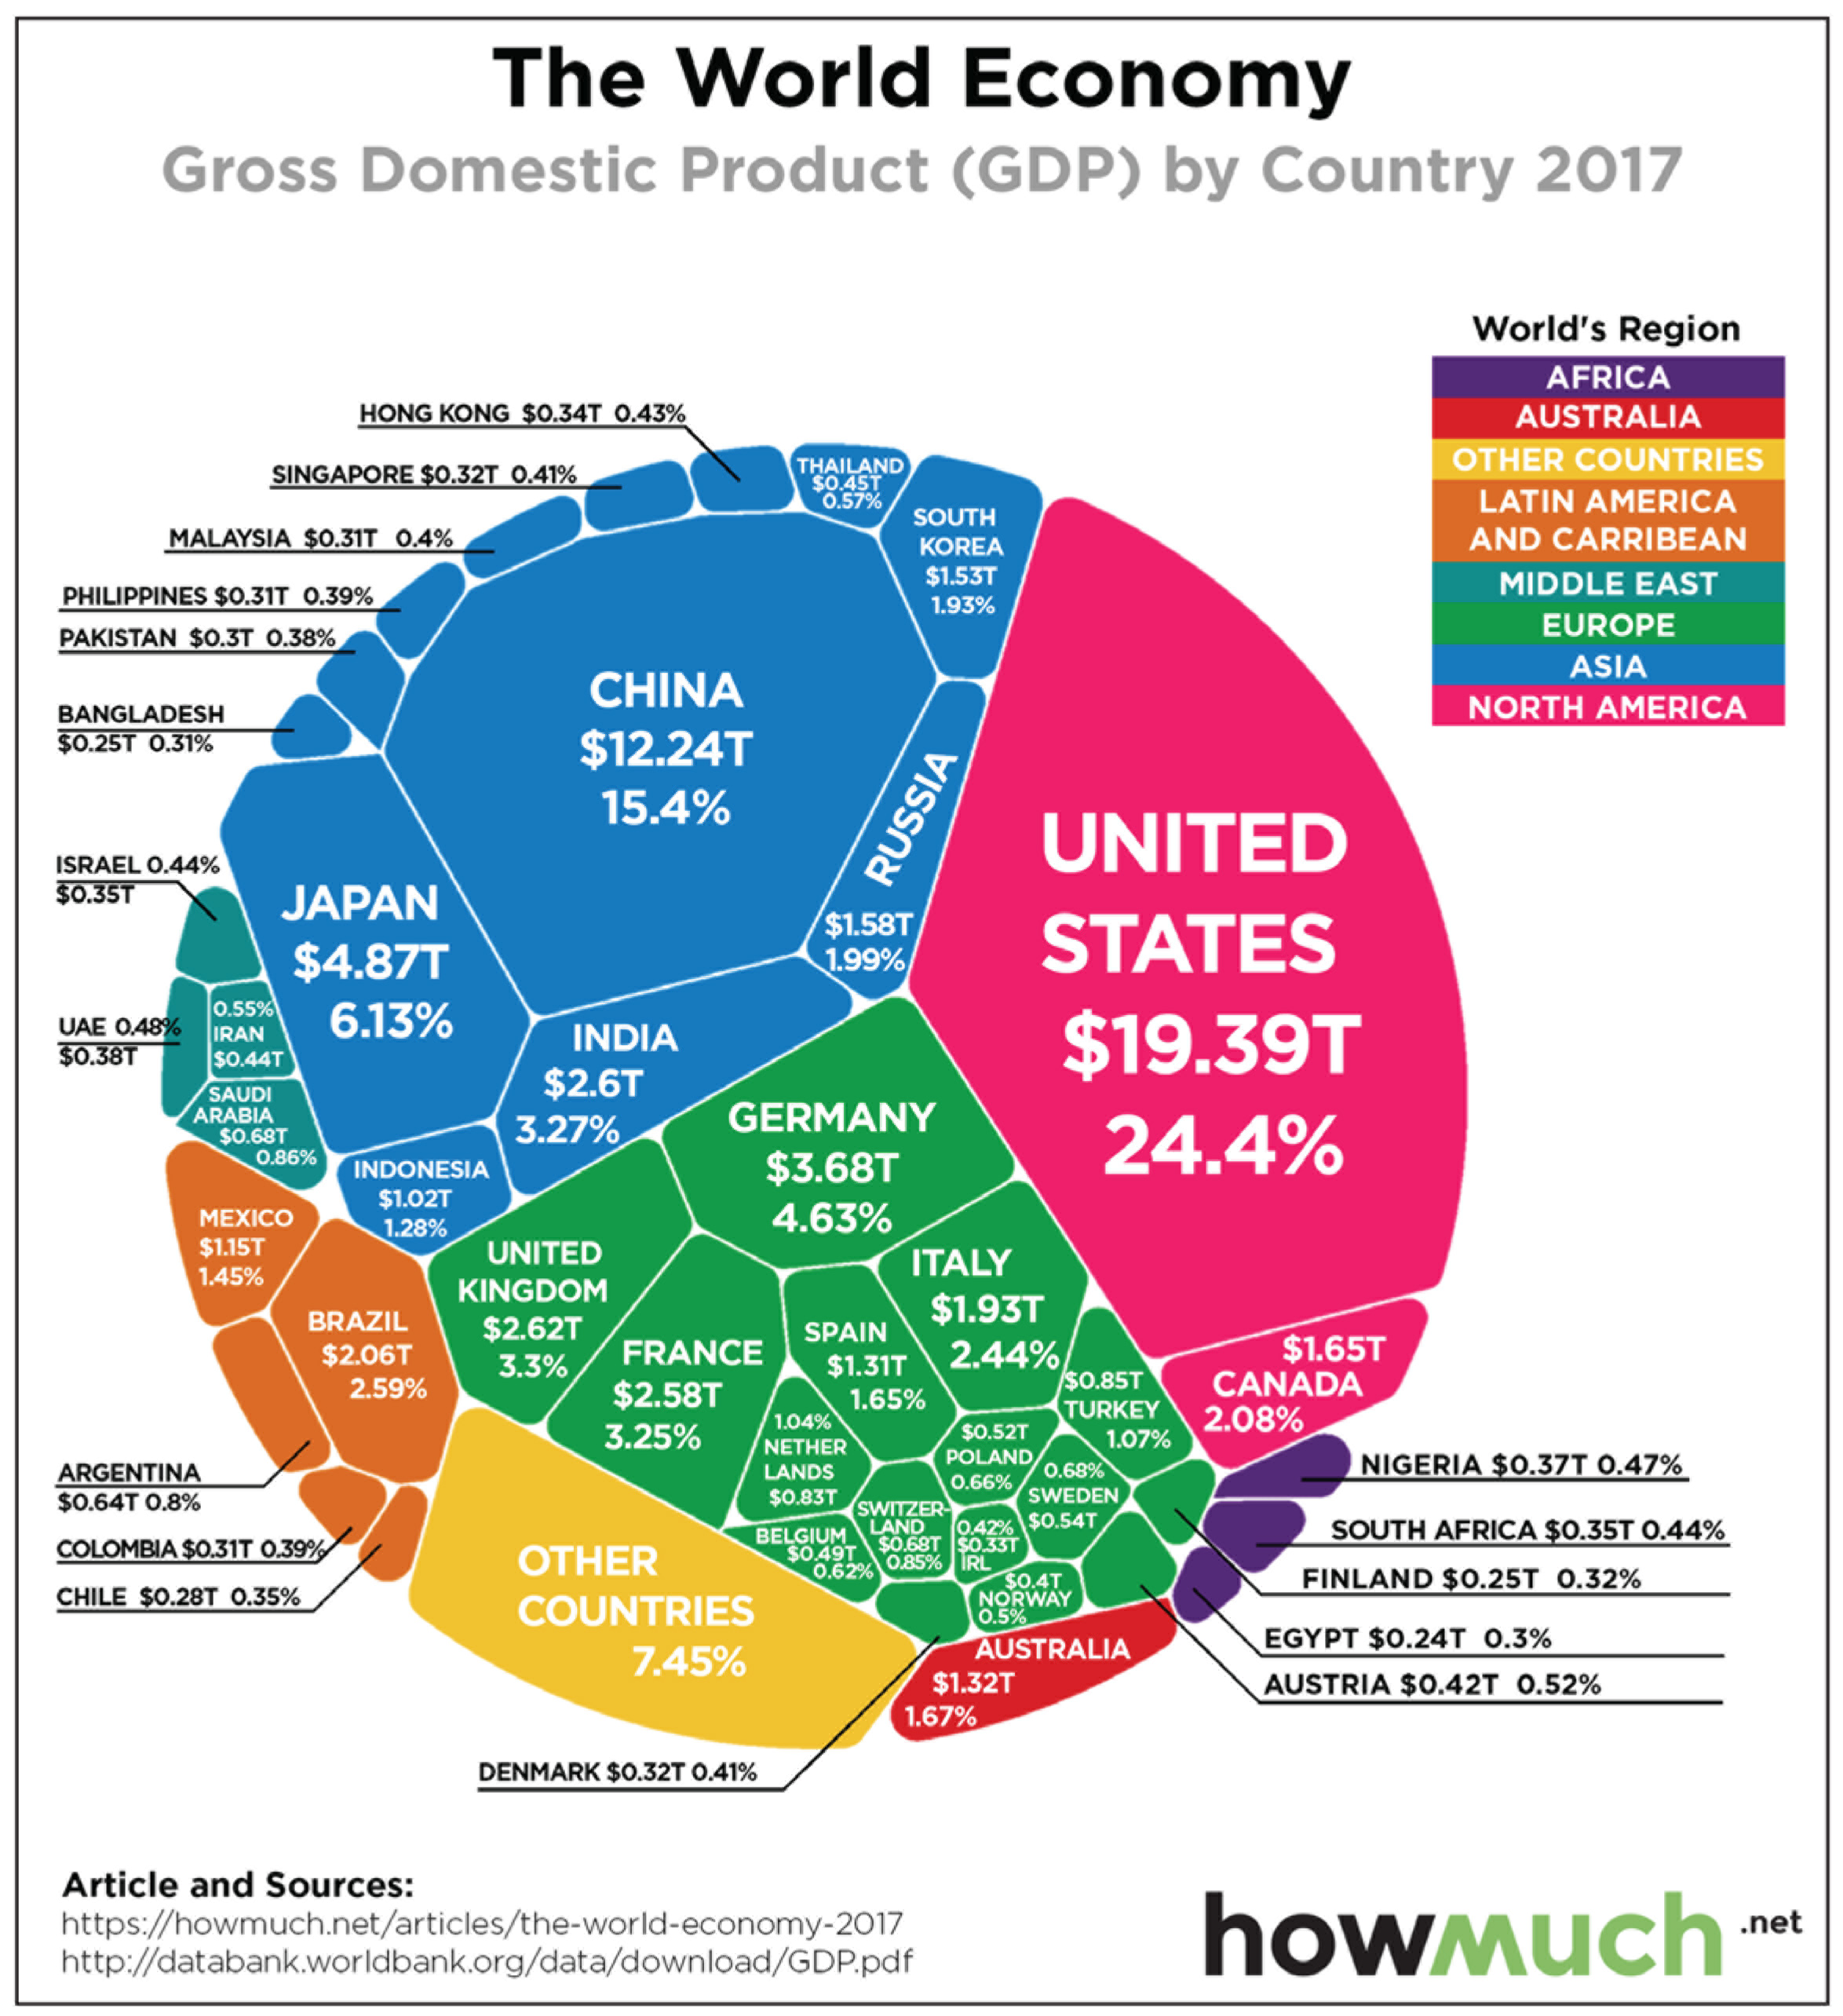
A 3.5% hit to the $80 trillion world economy means $2.8 trillion which was the exact size of the entire Indian economy in 2018–2019, the world’s fifth largest (India Today, 2019). The vicious circle leading to economic depression has set on a roll. Lower consumption, reduced demand, falling prices, supply cut, job cuts, lower spending, lower consumption—all the blocks look like a perfect fit. Recent predictions about the gloomy prospects for the world economy from some of the big names are shown in Table 1.
Global Economic Forecast of Some Leading Agencies
Key Global Indicators of the Fear
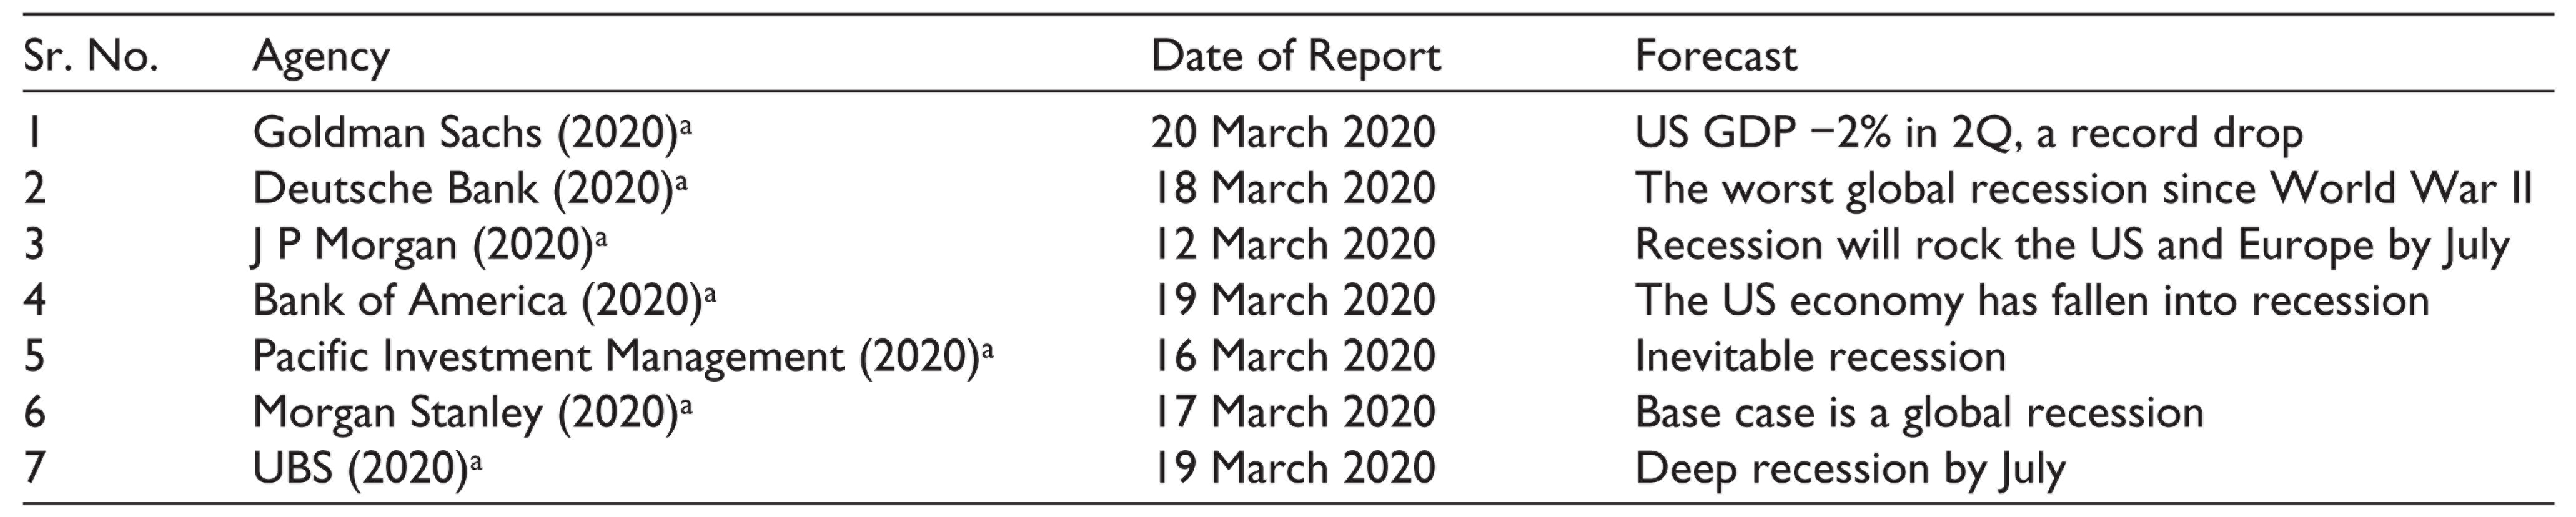
There has already been a strong initial knee-jerk reaction in the global economy as things started unfolding.
Stocks across the globe have taken a big hit especially in March 2020 as more information came about the depth and the width of the pandemic (Figure 2).
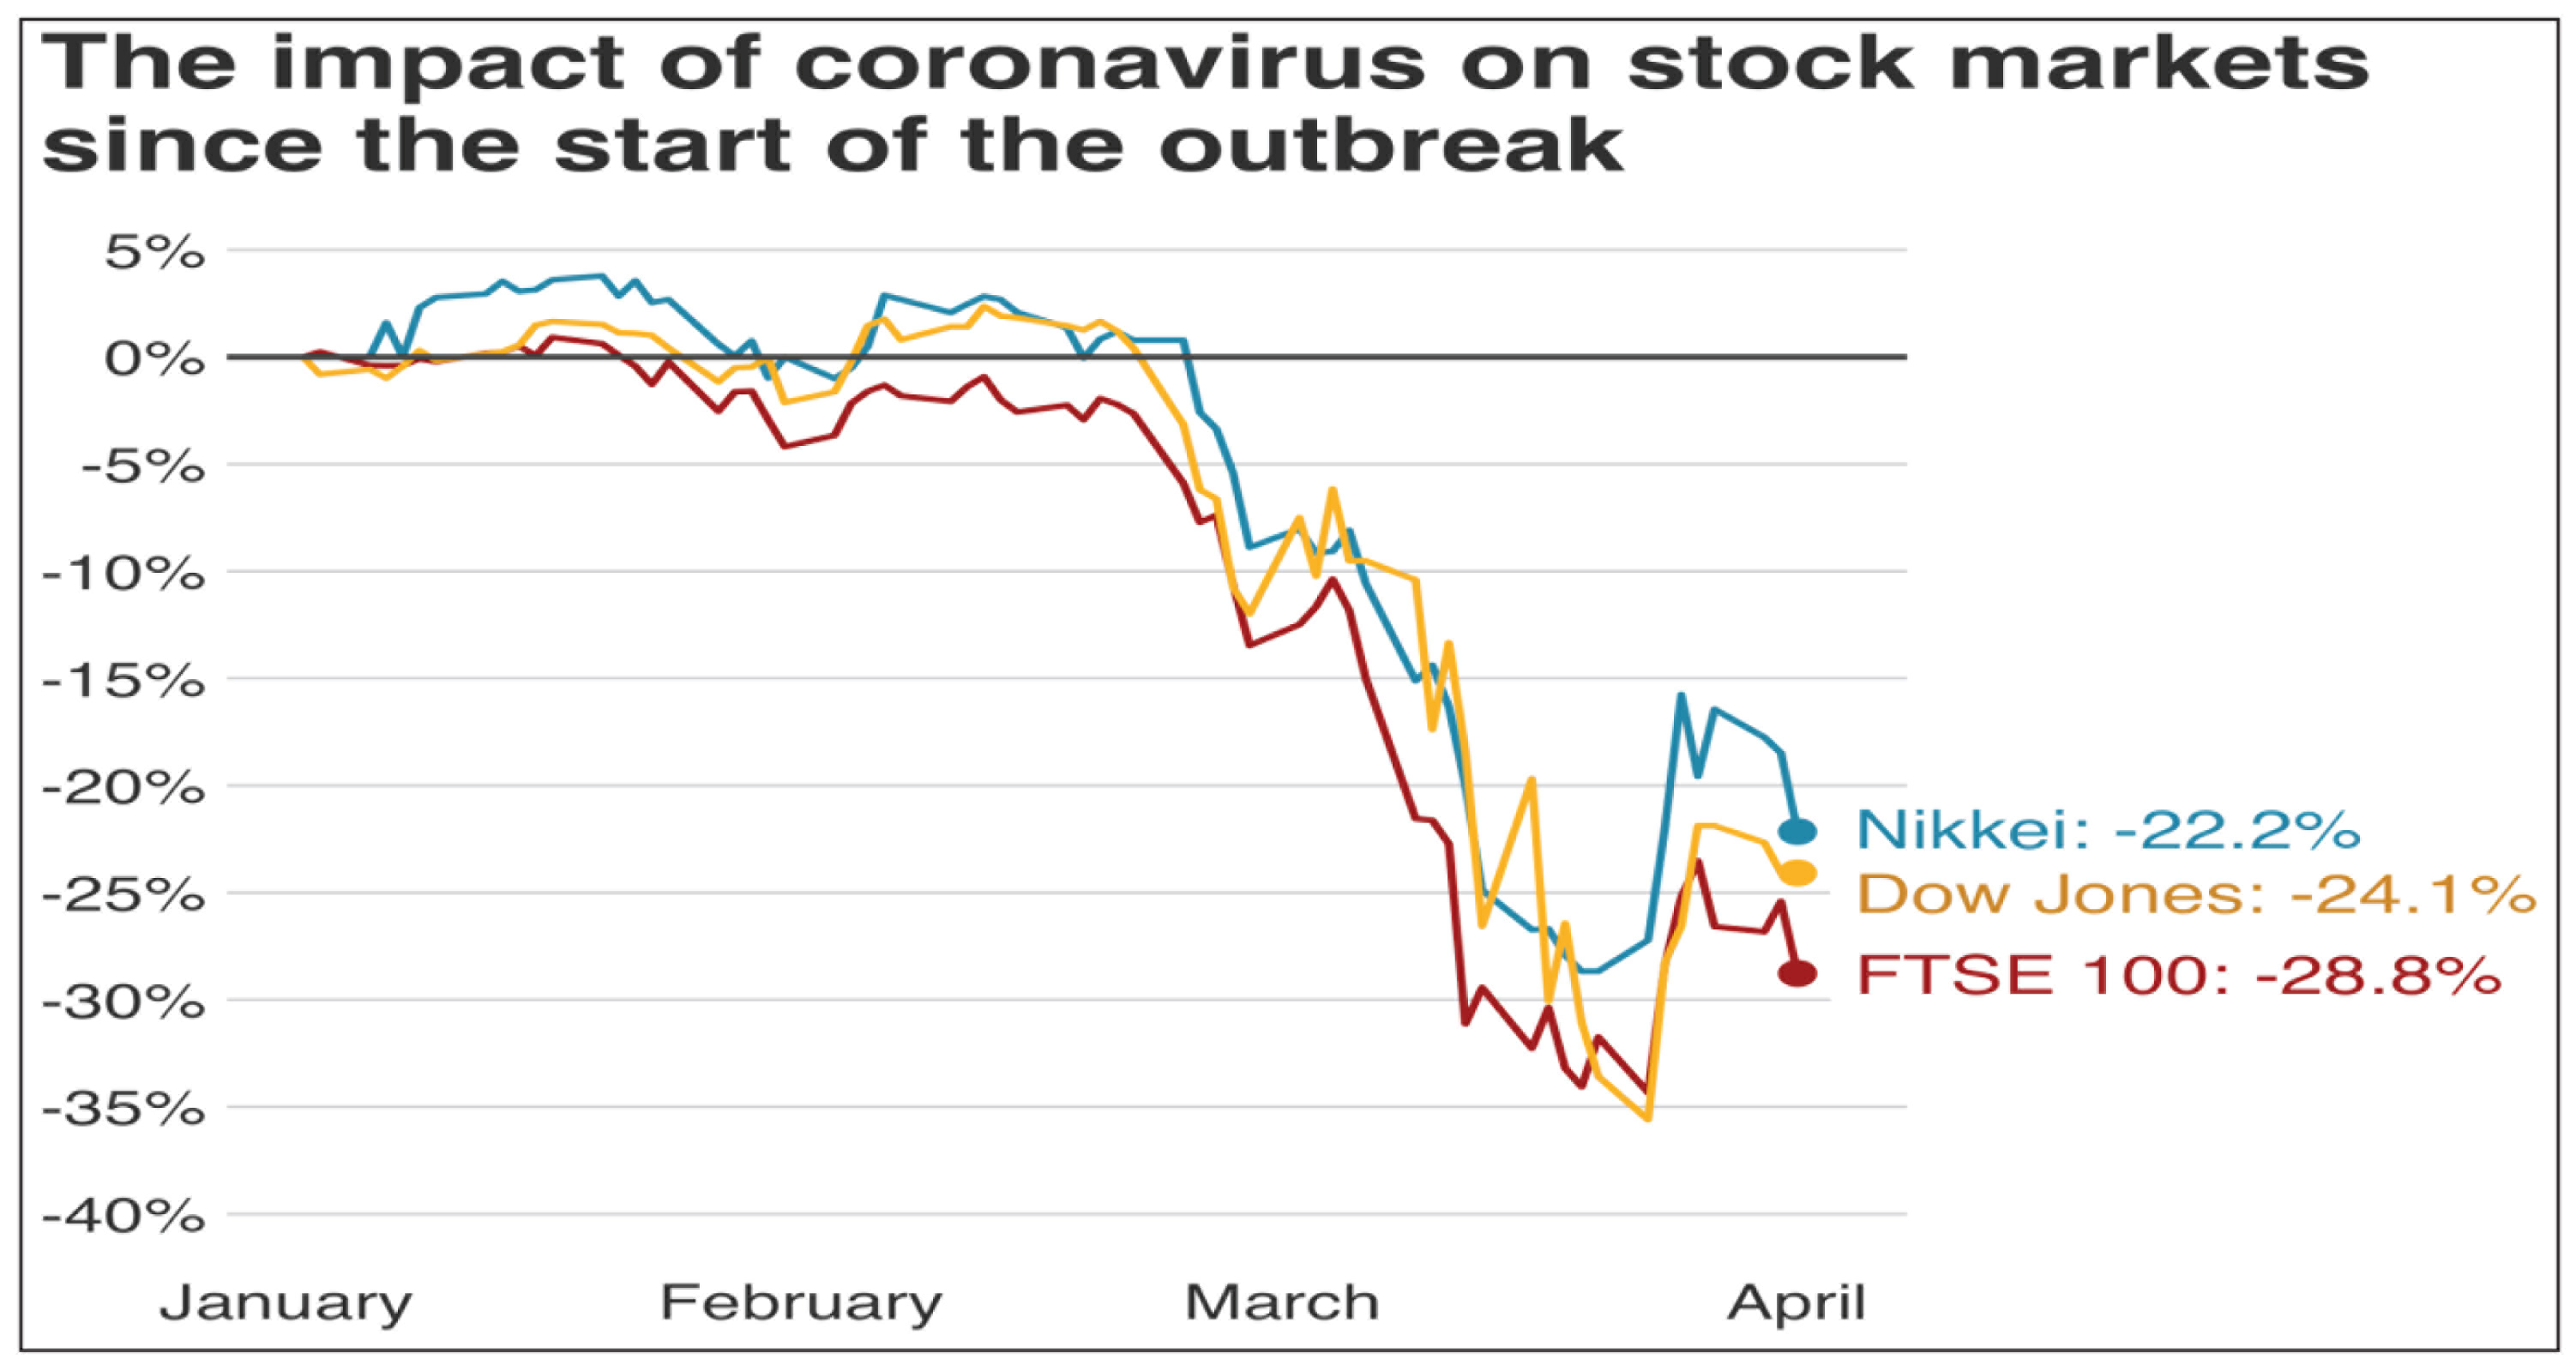
The last 6-month crude oil price per barrel (in USD) has shown a steep fall (Figure 3). The fall in the price is as high as 58.39% and is very steep in March 2020.
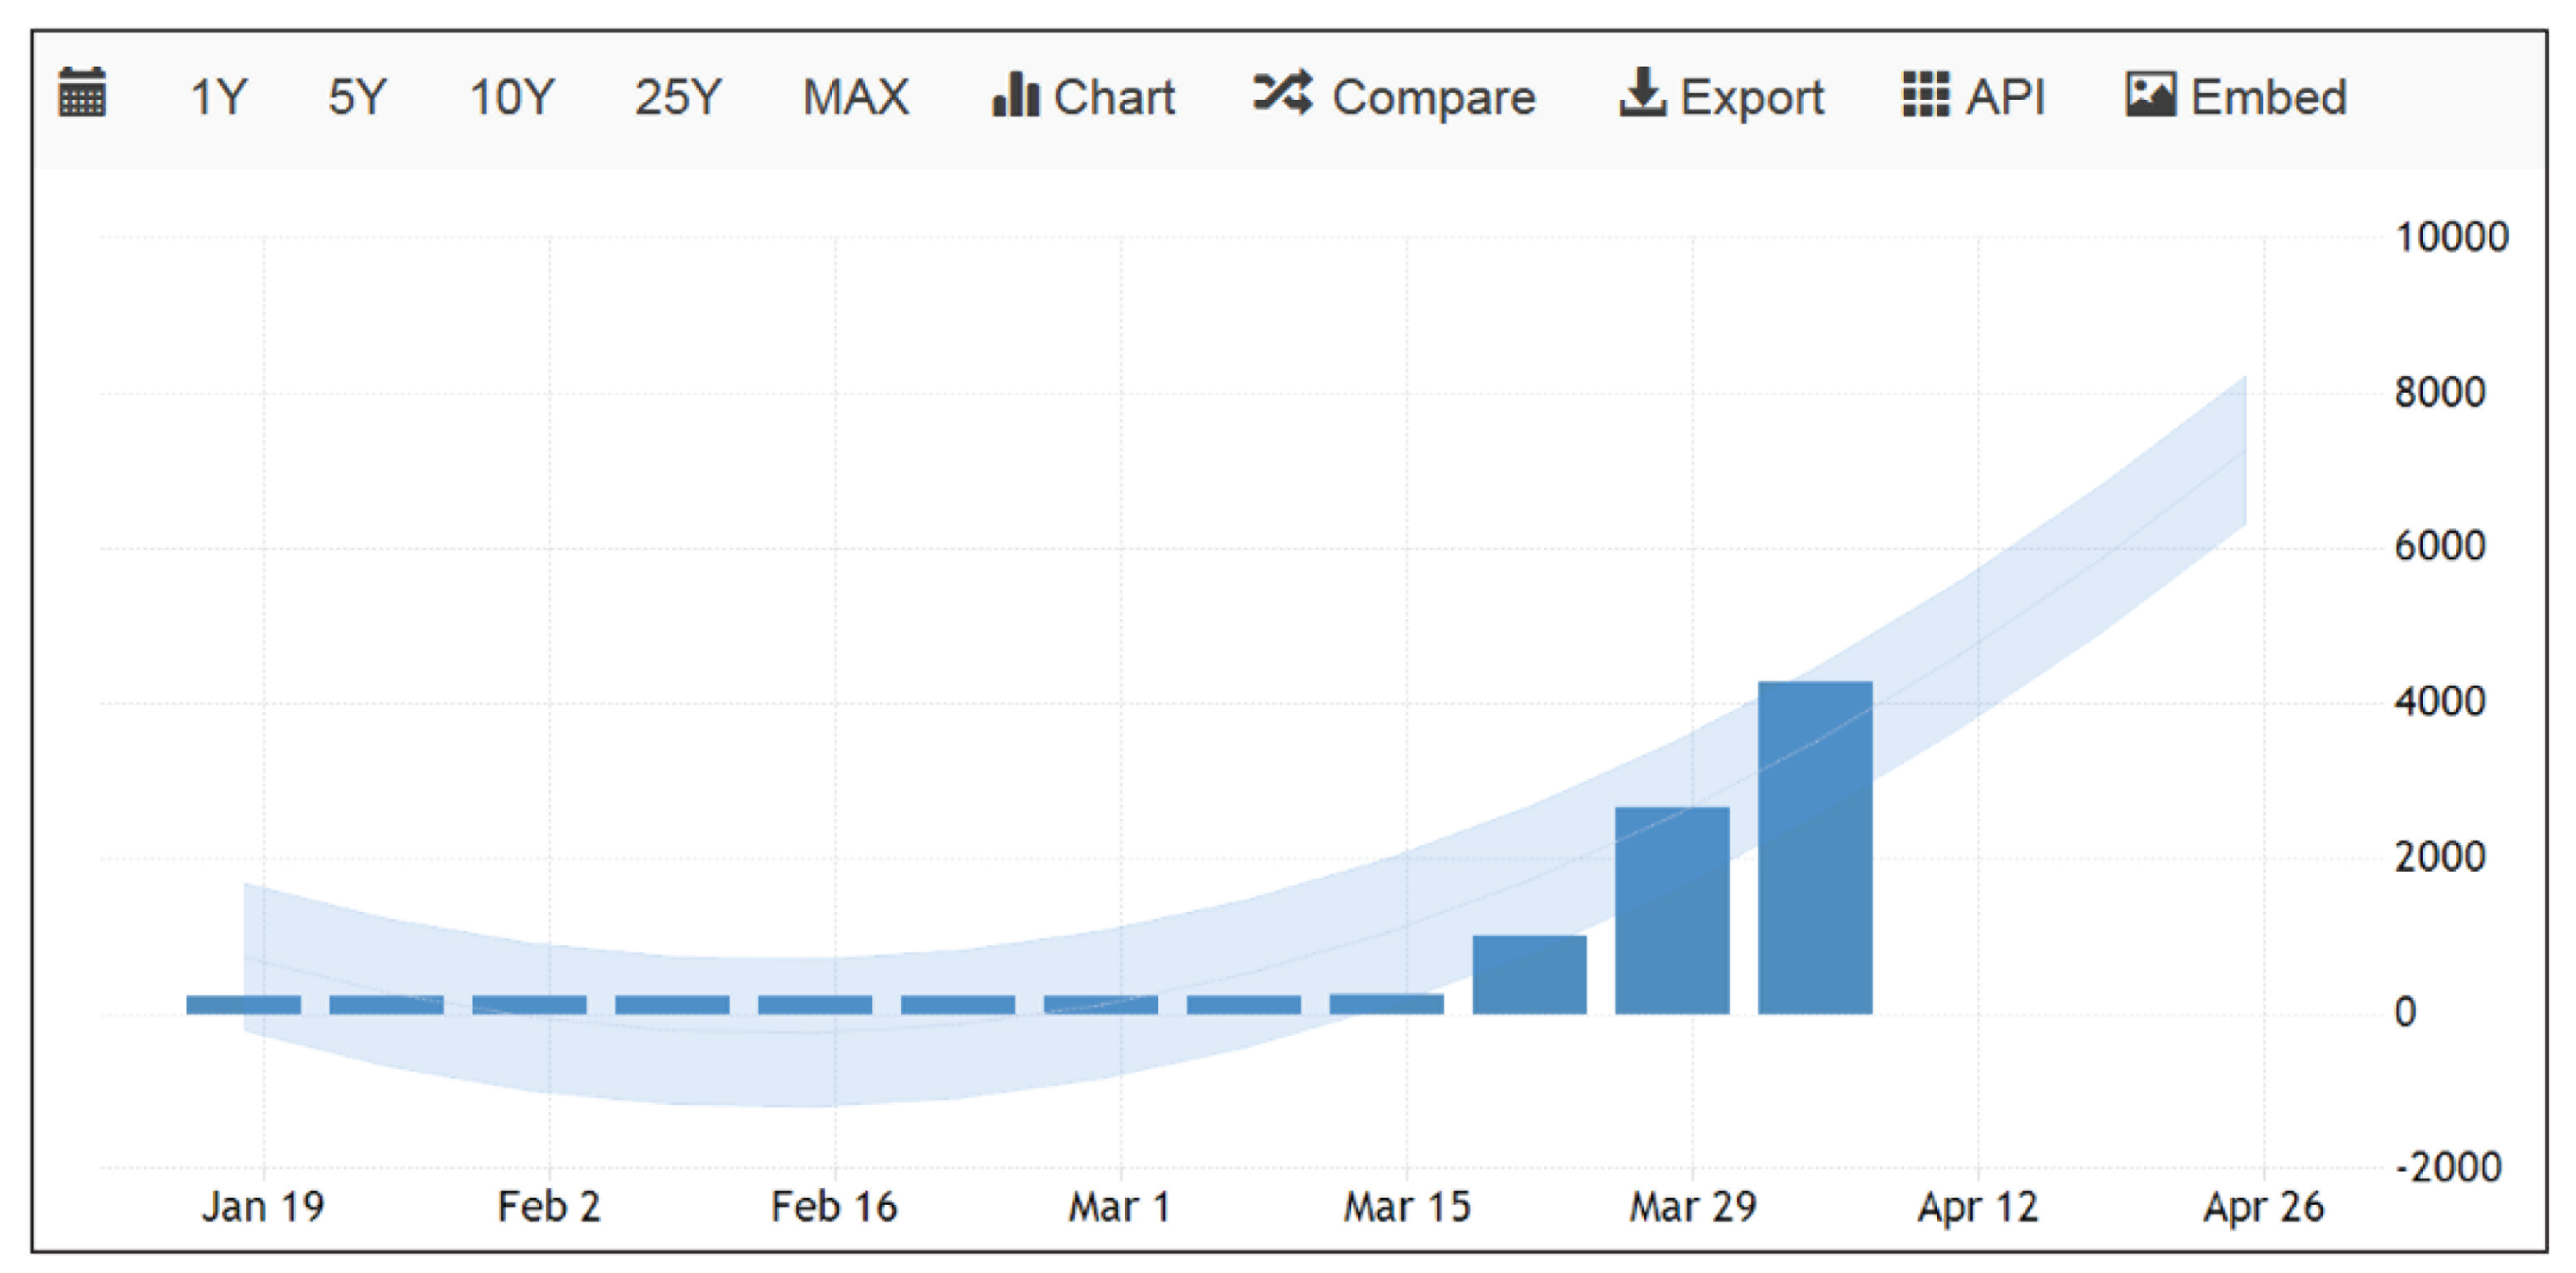
The rate of claims by the jobless in the US was hovering around 0 mark till 15 March 2020. But after just few days, it shot up to 4,000 and was slated to be double in the next 15 days (Figure 4).
What we understand is that the numbers shown and discussed above are only an initial reaction. The real punch is yet to come and as per some of the analysts that will be felt by June–July 2020.
Materials and Methods
Notwithstanding the silver lining in the form of low crude oil prices, the Indian economy is all set to follow global cues. This article tries to assess the impact from both short-term and long-term perspectives. Short term has been defined as the financial year 2020–2021. Long term has been defined as a 5-year period from 2020–2021 to 2024–2025. The assessment of the impact on the economy has been operationally defined as the impact on the following key economic indicators:
GDP Unemployment rate Inflation rate Interest rate Industry output
Theoretical Foundations
The method primarily applied for assessment of the impact is by way of forecasting through the decision-tree approach in which generally three possibilities have been assumed in the nature of ‘best’, ‘middle’ and ‘worst’ (Hyndman & Athanasopoulos, 2018). Probabilities have been estimated for the scenarios and expected values (EVs) have been calculated aggregating values of the three scenarios. The probabilities have been estimated assuming equal chance for all the three types of scenarios. The base values measuring the five parameters, namely, GDP, unemployment rate, inflation rate, interest rate and industry output have been estimated based on an incremental approach with more or less equal amount of intervals in the three base values. However, in some cases, where the impacts are estimated to be uneven, the base values for scenario forecasting have been estimated with different length of interval amounts (Van Asselt et. al, 2012). The basic model has been drawn from the famous article ‘Decision trees for decision making’ by Magee (1964), published in the Harvard Business Review.
Methodology in Details
Outline of the methodology is given below:
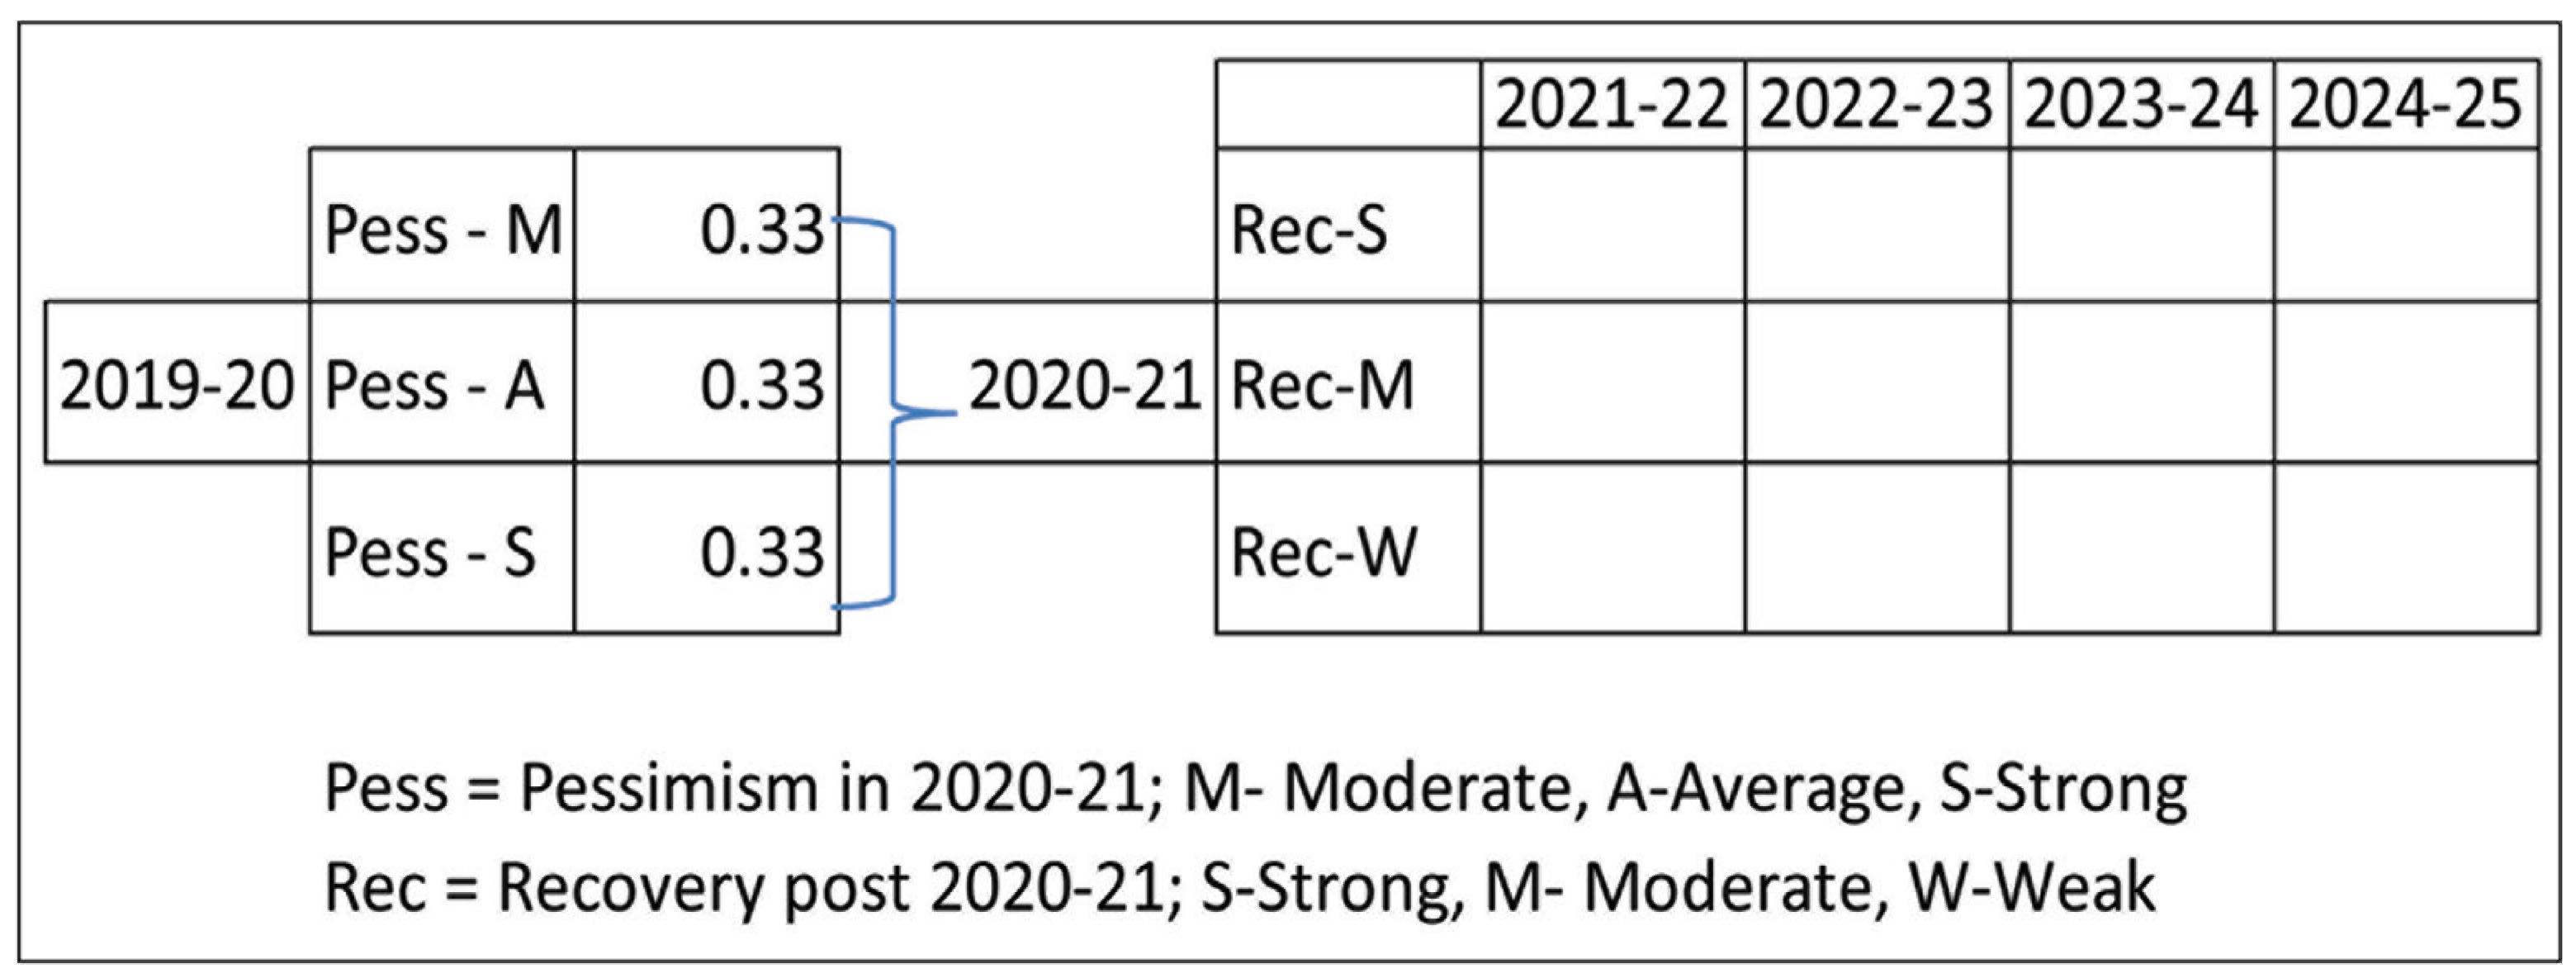
For each of the five economic indicators, ascertain the actual value as of year ended 2019–2020. Consider three scenarios of level of pessimism—moderate, average and severe pessimistic situations of recovery in 2020–2021. Assign estimated values for change in the year 2020–2021 for all the three situations. Assigning equal probability of 0.33 each to all the three situations, calculate a single expected value for the year 2020–2021 as a weighted product of the probability and estimated values of changes in all the three situations. Adjust the current value of the economic indicator (April 2020) for the expected value of the estimated change. The adjusted value will, thus, be the forecast for the year 2021–2021. Estimate the changes for the next 4 years for each of the three scenarios of moderate, average and severe pessimistic situations of recovery in 2021–2022, 2022–2023, 2023–2024 and 2024–2025. Adjust the 2020–2021 projection to the estimated changes projections for each of the three recovery scenarios of strong, moderate and weak recovery situations and for each of the four years 2021–2022, 2022–2023, 2023–2024 and 2024–2025.
The forecasts have been formulated as under:
Forecast 2020–2021 = Actual 2019–2020 + Expected value of estimated change in 2020–2021 under the three scenarios of moderate, average and severe pessimistic situations Forecast 2021–2022 (Strong recovery) = Forecast 2020–2021 + Expected change in case of strong recovery Forecast 2021–2022 (Moderate recovery) = Forecast 2020–2021 + Expected change in case of moderate recovery Forecast 2021–2022 (Weak recovery) = Forecast 2020–2021 + Expected change in case of weak recovery
The forecasting model is shown in Figure 5 for quick understanding.
The choice of three options for a decision tree is based more on the convention of taking three splits for the root (Hoare, 2020). More number of options can be taken. However, for convenience in calculations, the convention is to take three options.
Results: Assessment of the Impact
GDP Growth Rate
Estimates for 2020–2021
A number of research agencies, financial institutions and experts have given a forecast of India’s GDP growth rate for 2020–2021. Table 2 presents a summary of these estimates.
India’s GDP Growth Rate Forecast by Some Leading Agencies
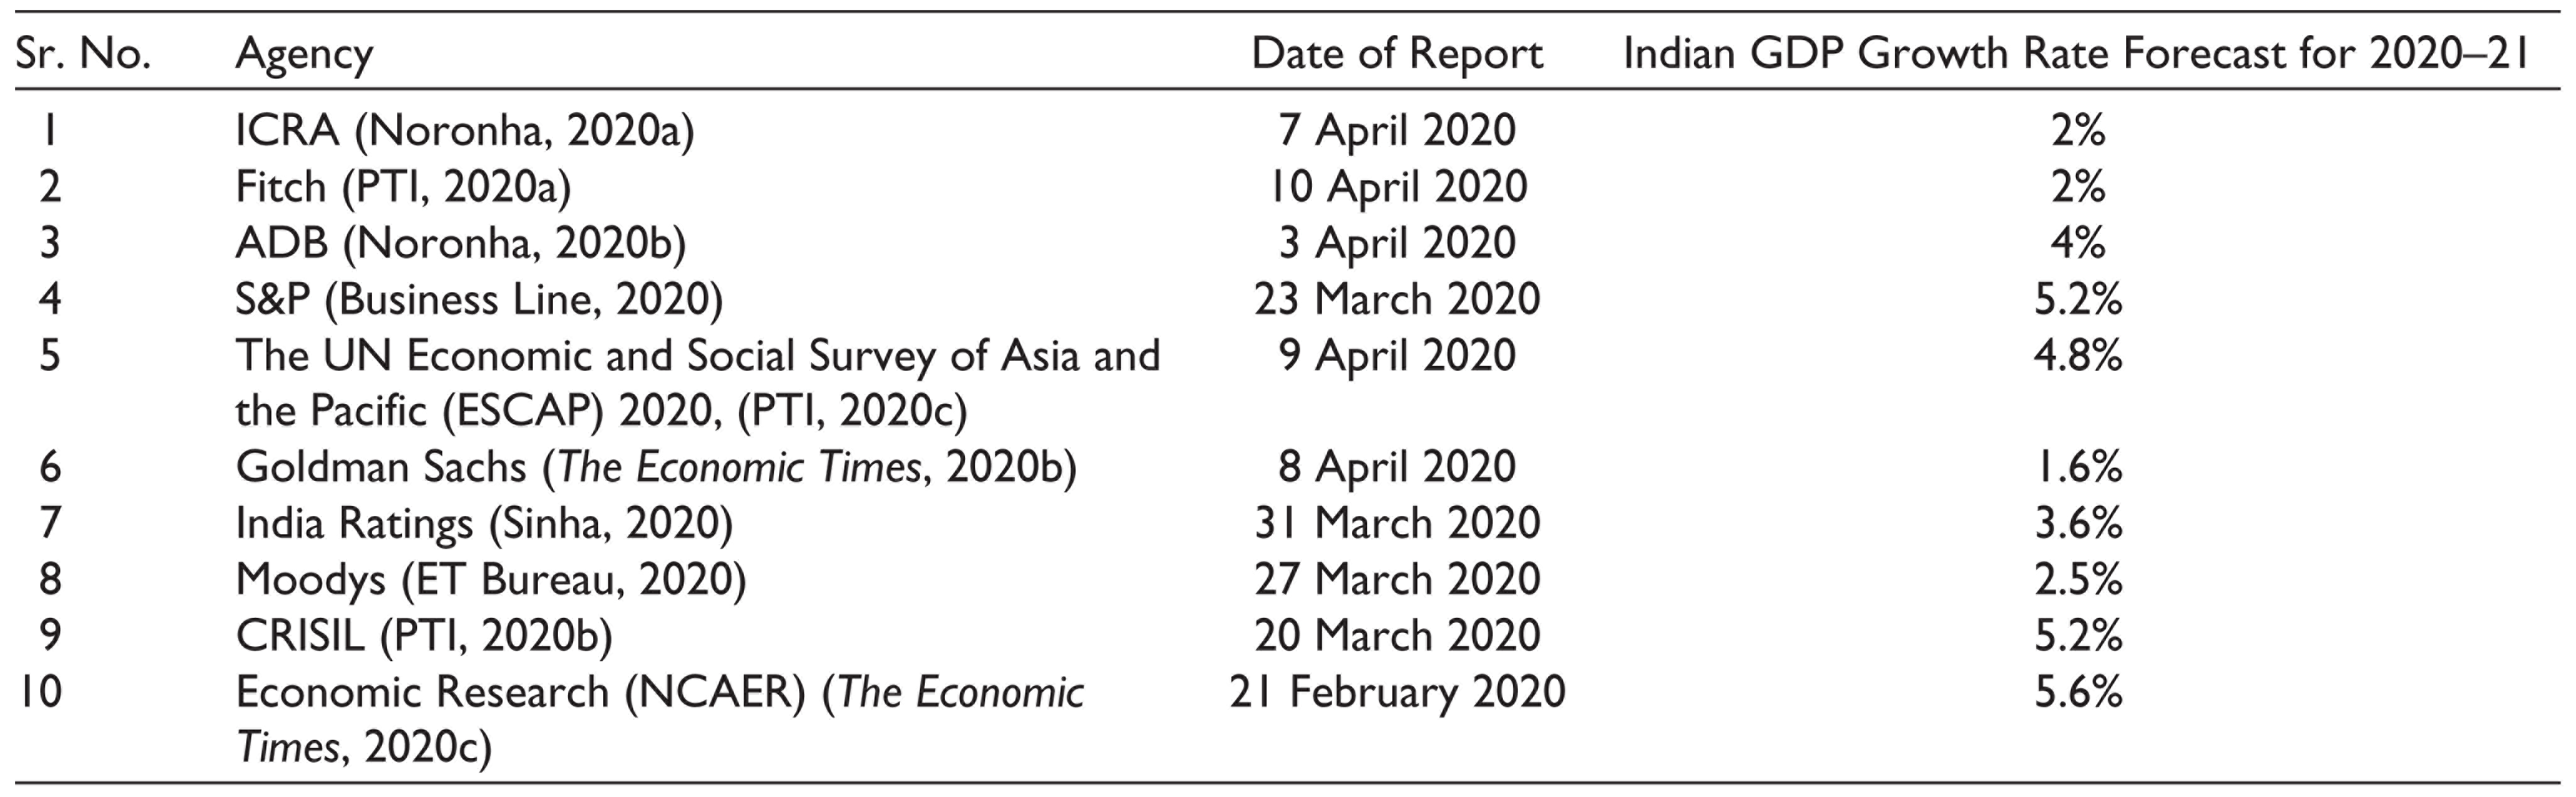
Correction of these forecasts: All these forecasts were corrected by applying weights of 3 for April 2020 reports, 2 for March 2020 reports and 1 for February 2020 and earlier period reports, as shown in Table 3.
India’s GDP Growth Rate Forecast (Corrected) by Some Leading Agencies
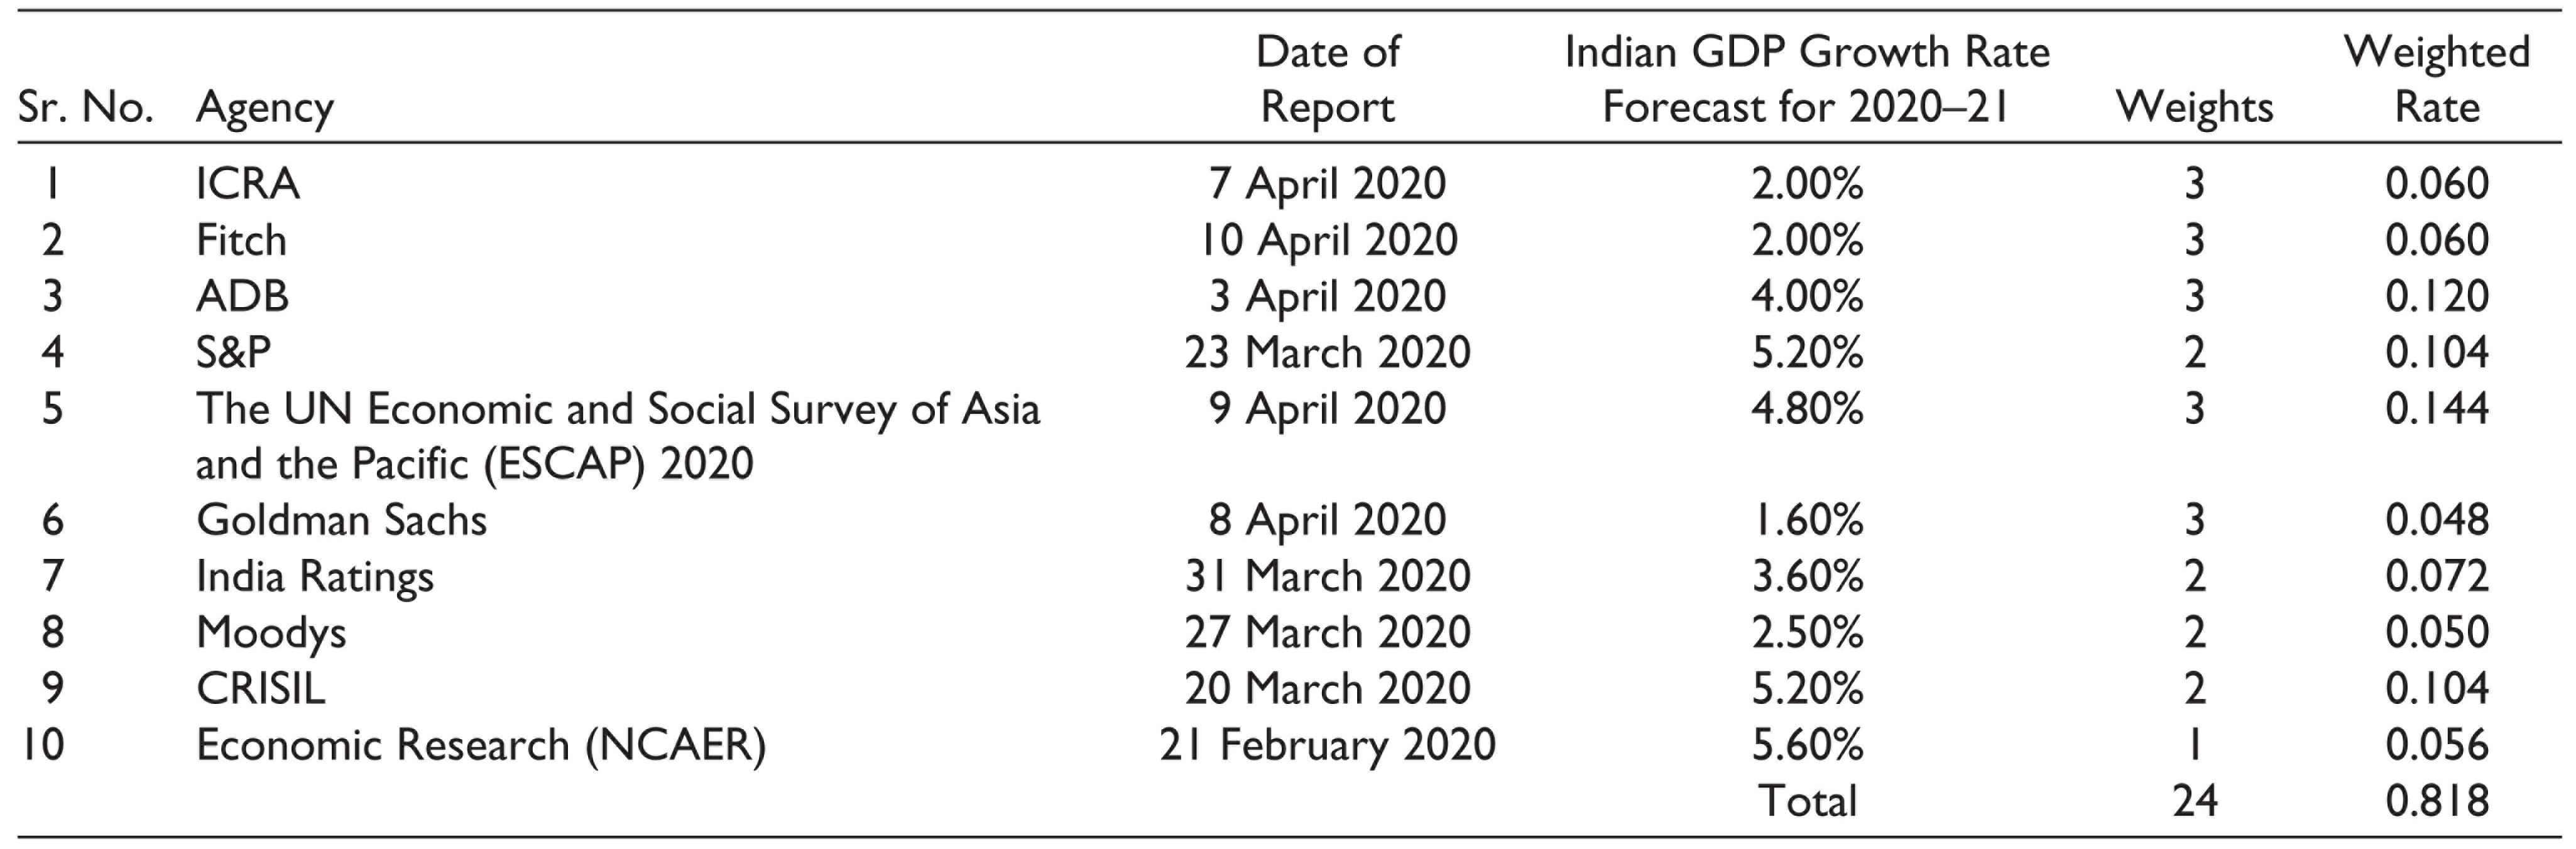
The weighted average rate for these 10 forecasts comes to 3.41% (0.818/24). These numbers can change dramatically given the range of possibilities for 2020–2021. A decision-tree model can be adopted considering three pessimistic situations: moderate, average and severe. Probability estimates for these three scenarios at this point in time (April 2020) can be taken as 0.33 each. The cuts in the GDP growth rates for the three scenarios can be taken as −2%, −4% and −6%, respectively, for moderate, average and severe pessimistic situations. Taking into account these scenarios, their probabilities and the expected outcome, decision-tree structure, as shown in Figure 6, emerges.
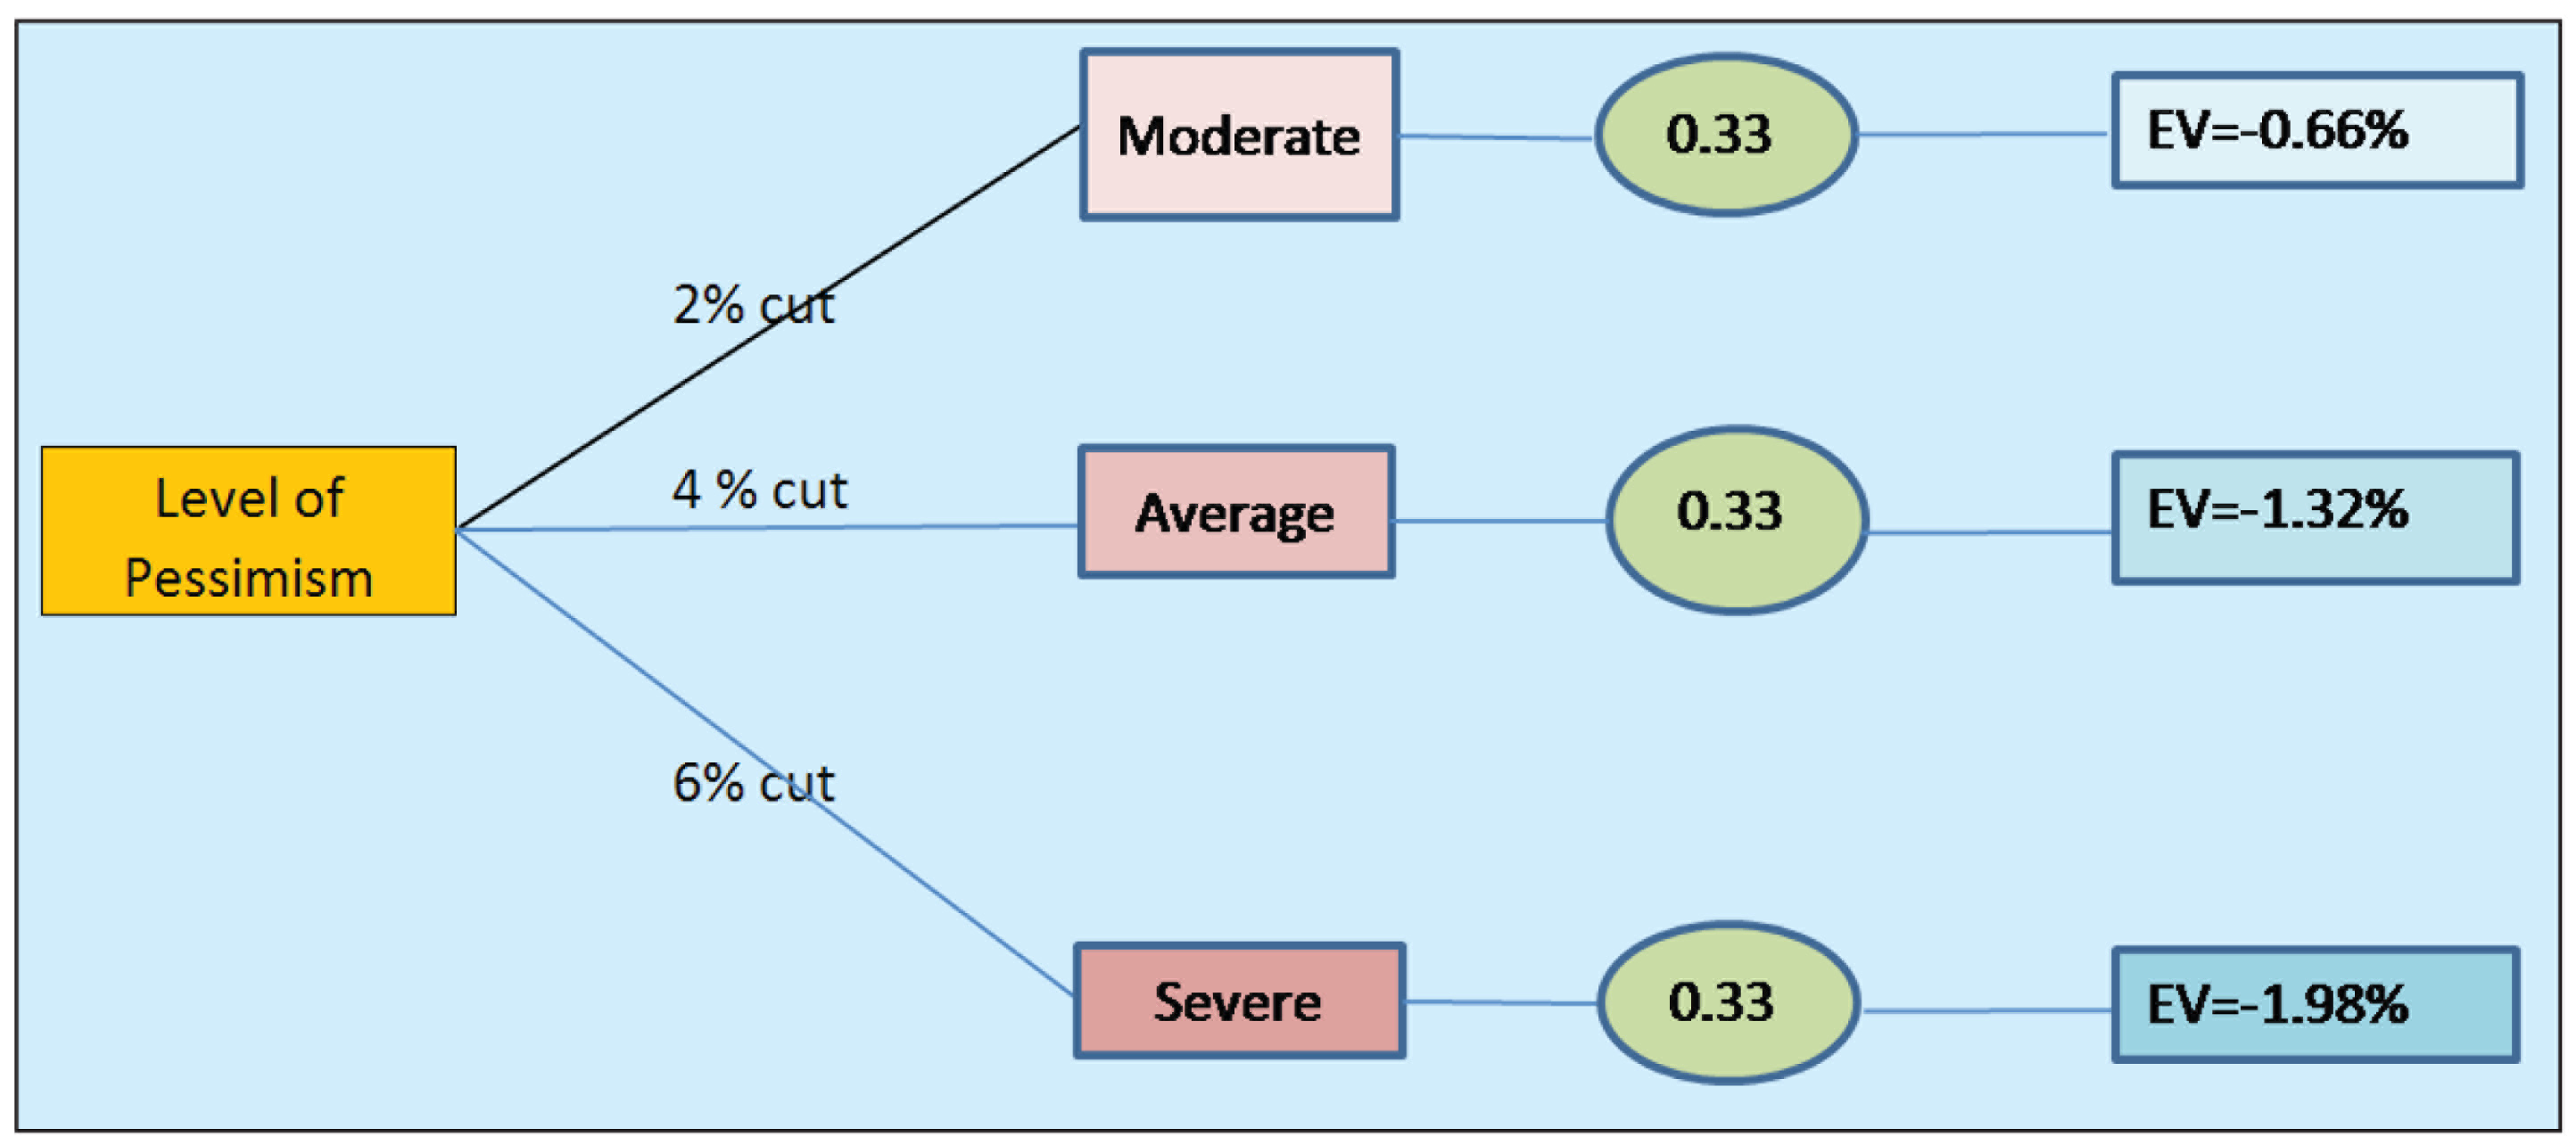
Aggregating the three EVs, −0.66%, −1.32% and −1.98%, the expected cut in the GDP growth rate forecast for 2020–2021 is −3.96%. Adding this to the average of the 10 expert projections, the adjusted GDP growth forecast for the Indian economy for 2020–2021 comes to 3.41% − 3.96% = −0.55%. Thus, there is all likelihood that the GDP for 2020–2021 might remain flat if not turn southwards.
Estimation for the Next 5 Years
An important factor influencing the GDP projections for the next 5 years is the likely recovery rate. Three such scenarios with equal probabilities can be considered as strong, moderate and weak recovery. For a strong recovery, a positive average growth rate of 2% per year can be assumed. For a moderate recovery, a positive average growth rate of 1% per year can be assumed. For a weak recovery, a positive average growth rate of 0.50% per year can be assumed. Likely situation under these three scenarios of recovery are shown in Figure 7.
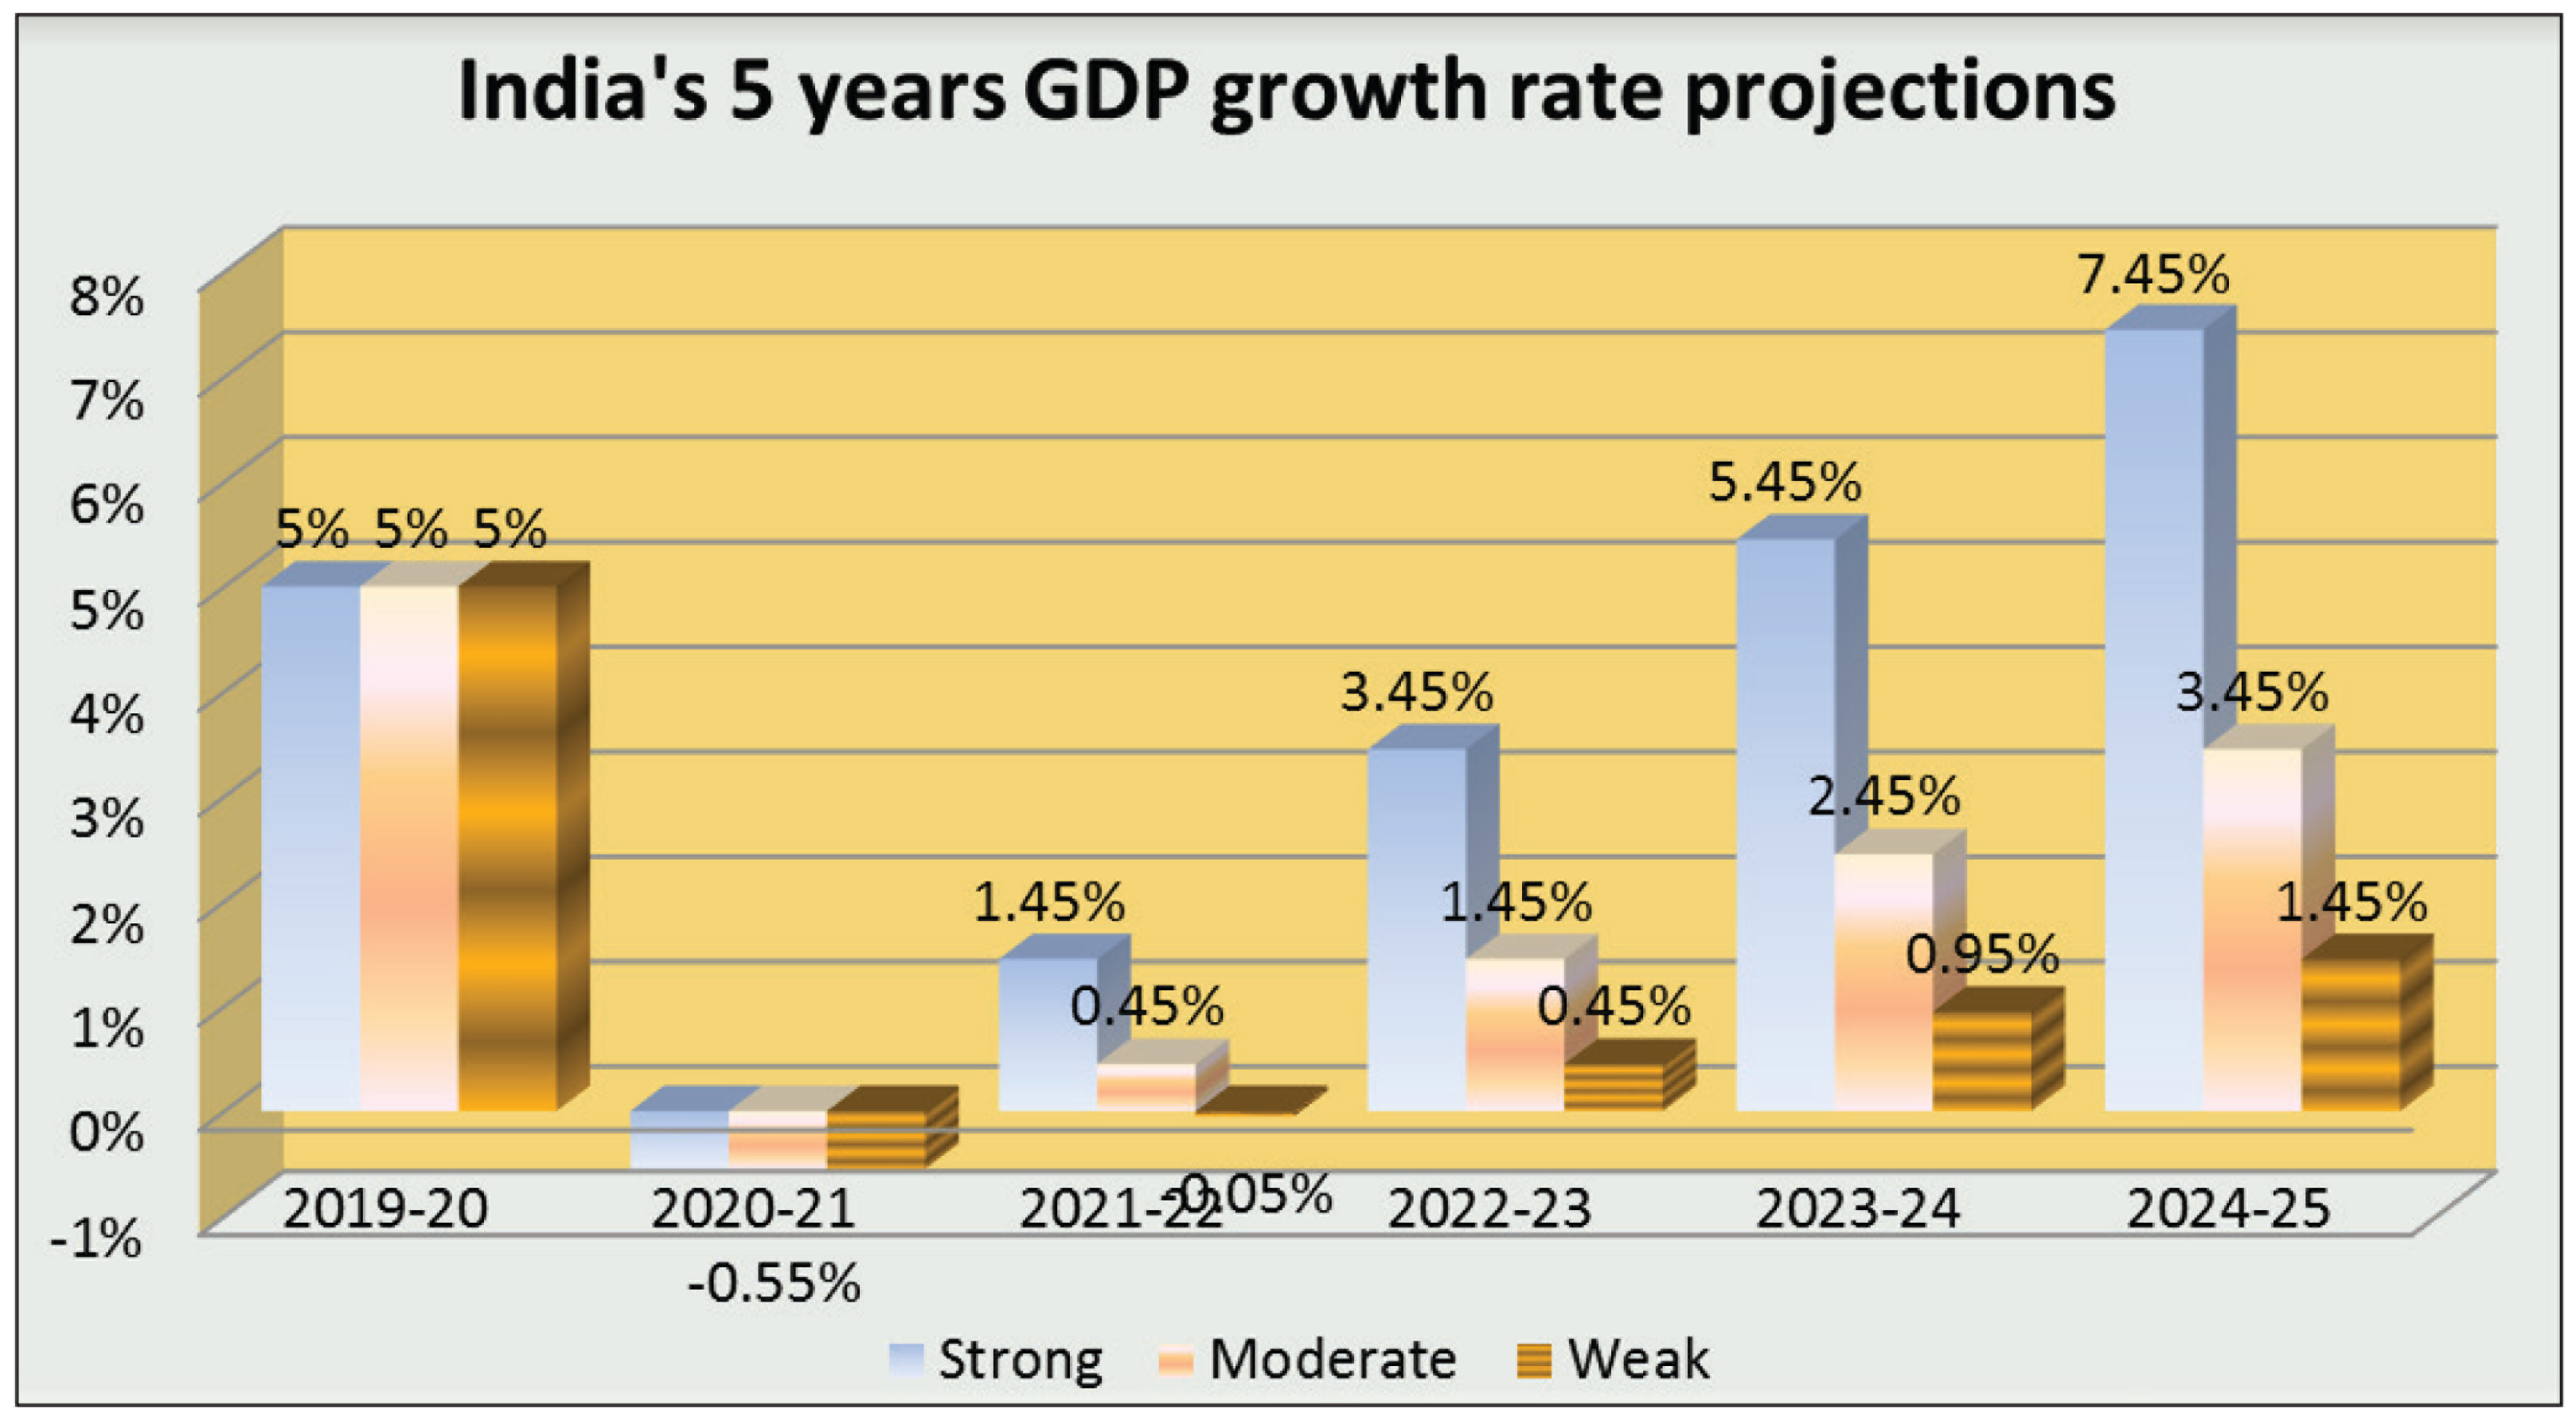
If the recovery is strong, in the year 2024–2025, the growth rate might reach up to 7.45%. If the recovery is moderate, in the year 2024–2025, the growth rate might reach up to 3.45%. If the recovery is weak, in the year 2024–2025, the growth rate might reach up to 1.45%.
Unemployment Rate
Estimates for 2020–2021
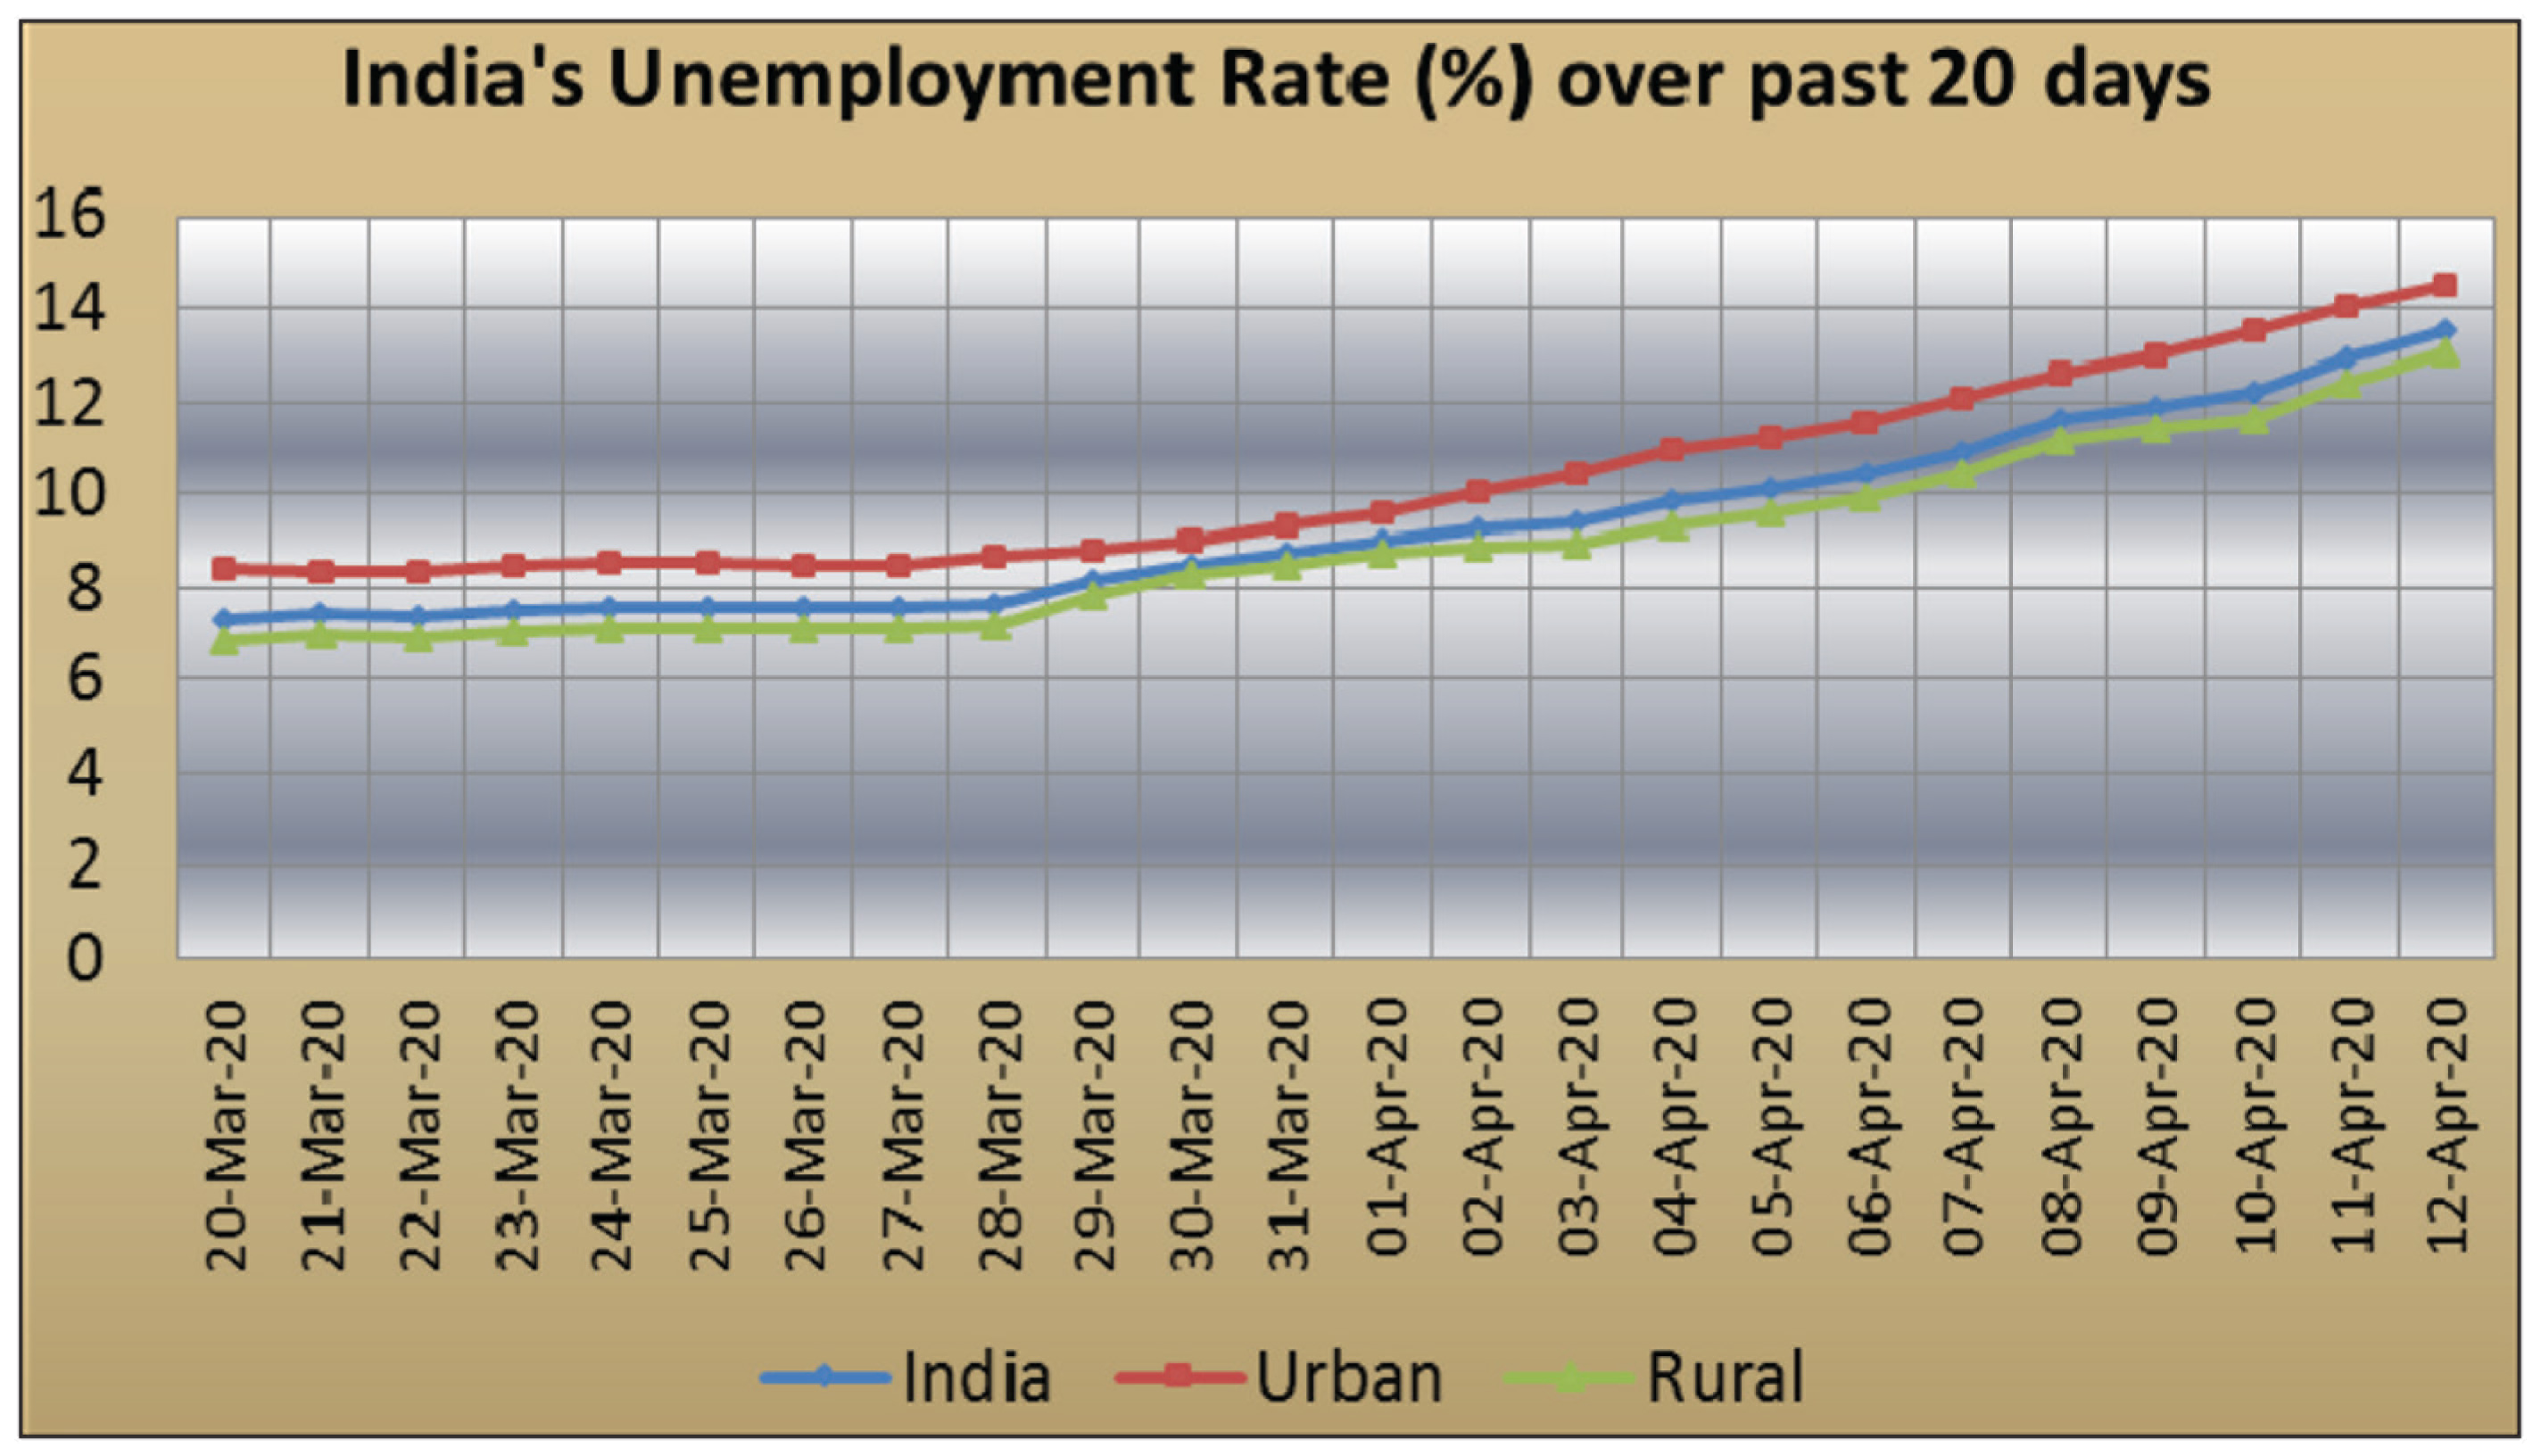
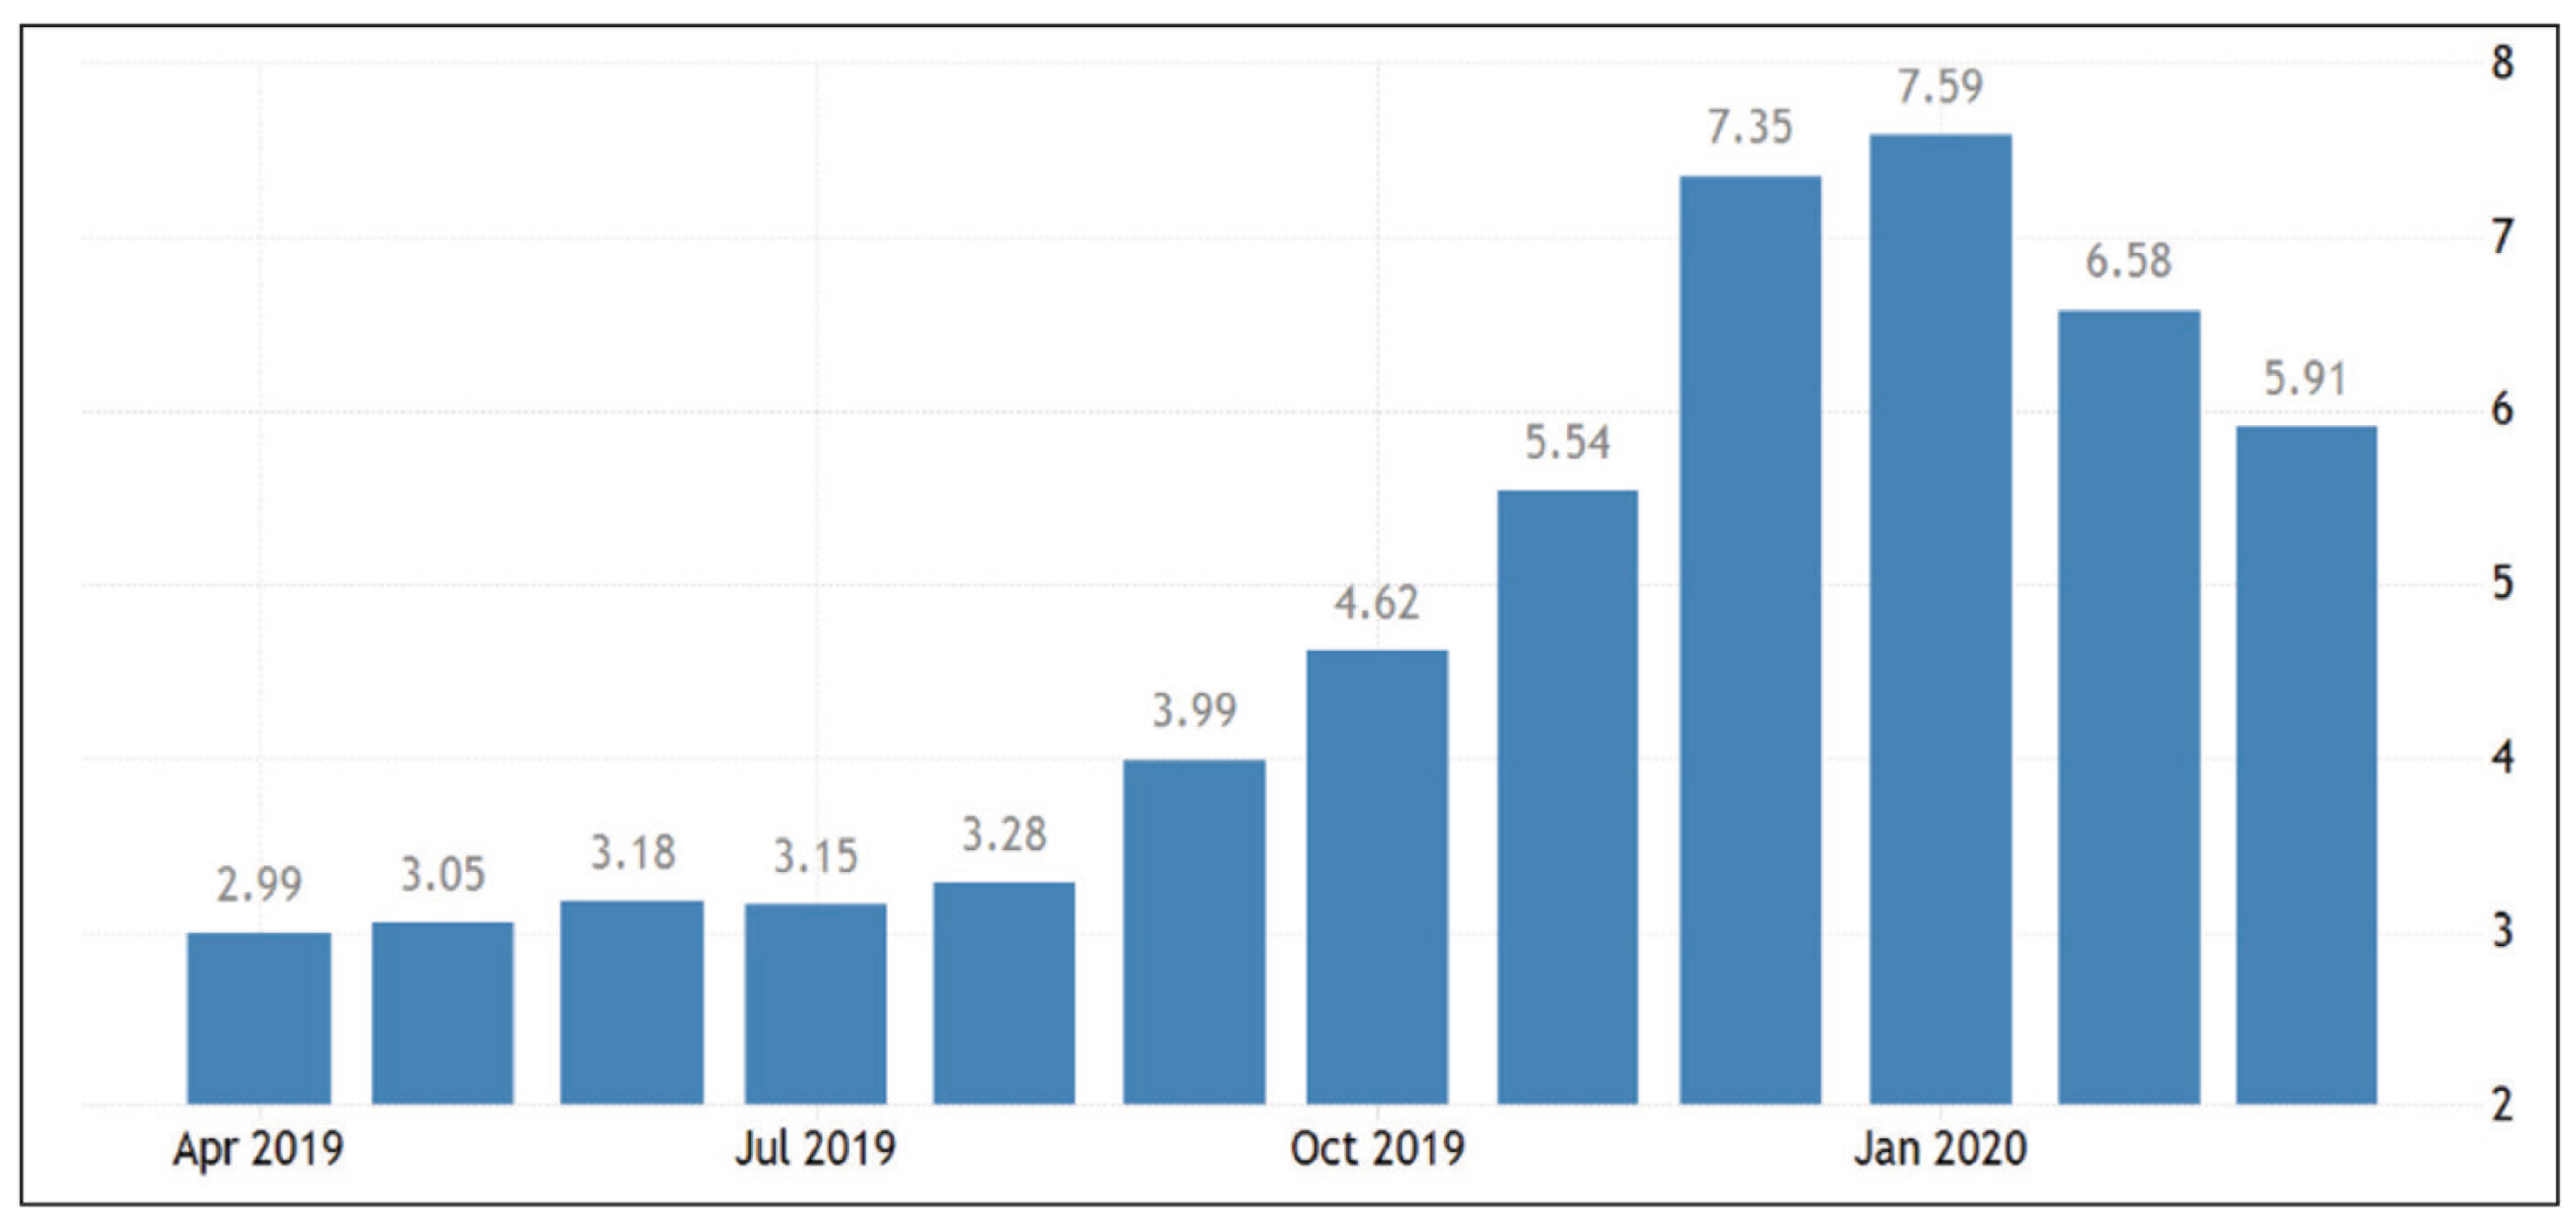
The recent past has shown a sudden spurt in the unemployment rate, as shown in Figure 8.
A decision-tree model can be adopted considering three pessimistic situations: moderate, average and severe. Probability estimates for these three scenarios at this point in time (April 2020) can be taken as 0.33 each. The increment in the unemployment rates for the three scenarios can be taken as 2%, 6% and 12%, respectively, for moderate, average and severe pessimistic situations. Taking into account these scenarios, their probabilities and the expected outcome, a decision-tree structure emerges, as shown in Figure 9.
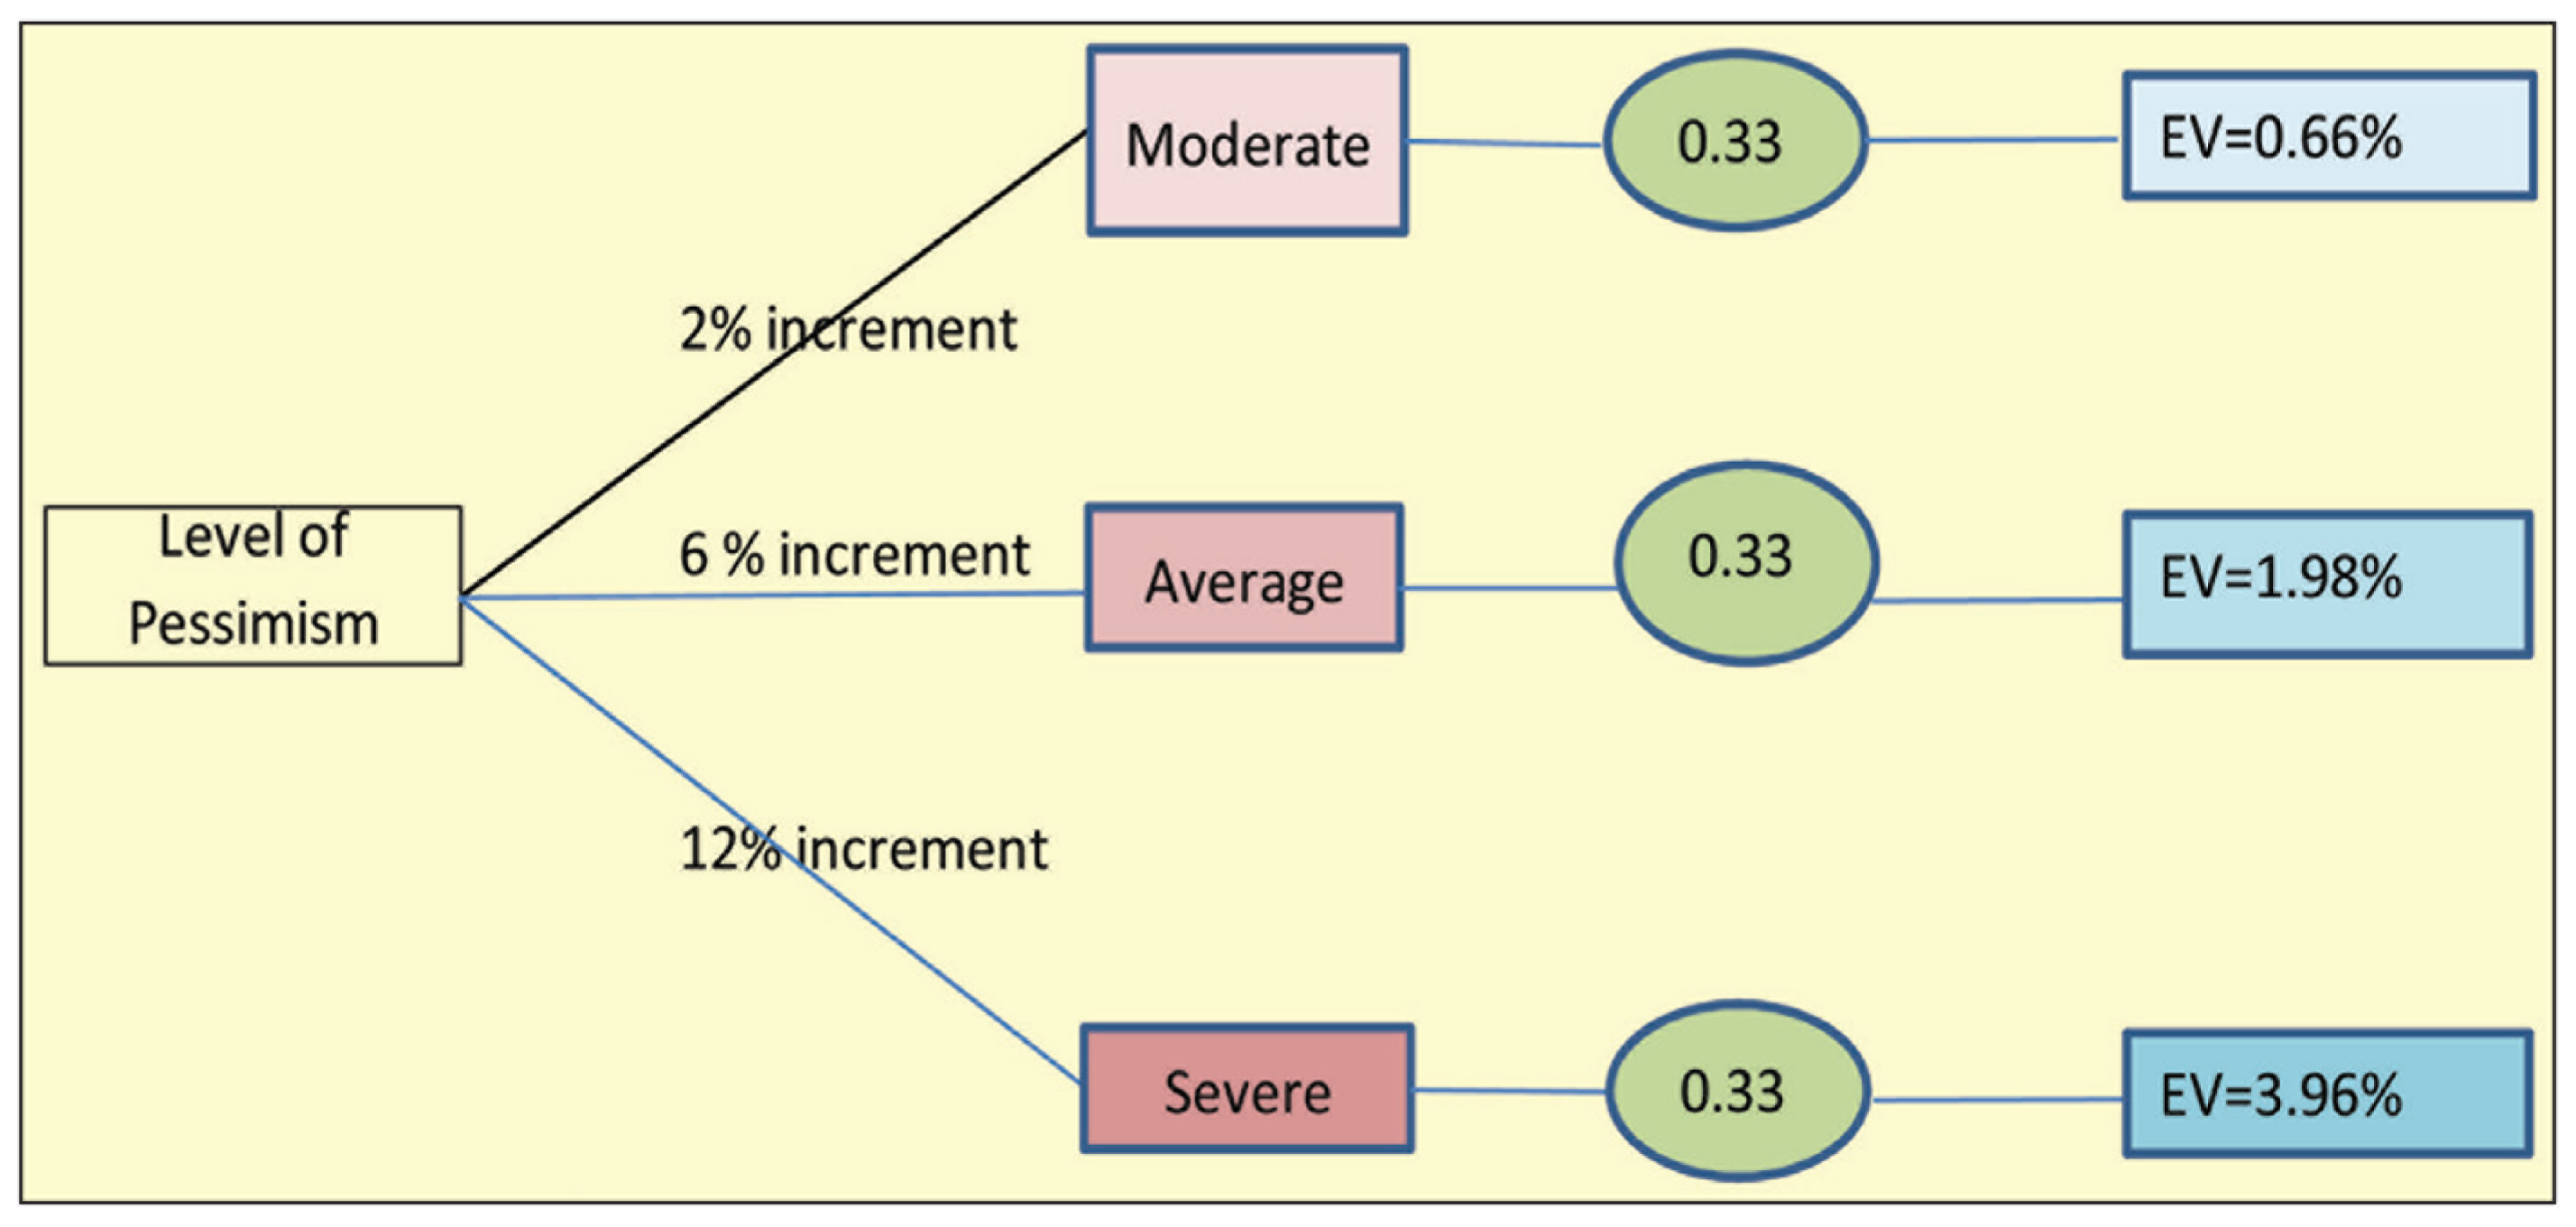
Aggregating the three EVs, 0.66%, 1.98% and 3.96%, the expected increment in the unemployment rate forecast for 2020–2021 is 6.60%. Adding this to the current rate of unemployment of 13.53%, the adjusted average unemployment forecast for the Indian economy for 2020–2021 comes to 13.53% + 6.60% = 20.13%. Thus, there is all likelihood that the unemployment rate for 2020–2021 might cross 20%.
Estimates for 2024–2025
An important factor influencing the unemployment rate projections for the next 5 years is the likely recovery rate. Three such scenarios with equal probabilities can be considered as strong, moderate and weak recovery. For a strong recovery, an average decline rate of 2% per year can be assumed. For a moderate recovery, an average decline rate of 1% per year can be assumed. For a weak recovery, an average decline rate of 0.5% per year can be assumed. Likely situation under these three scenarios of recovery are shown in Figure 10.
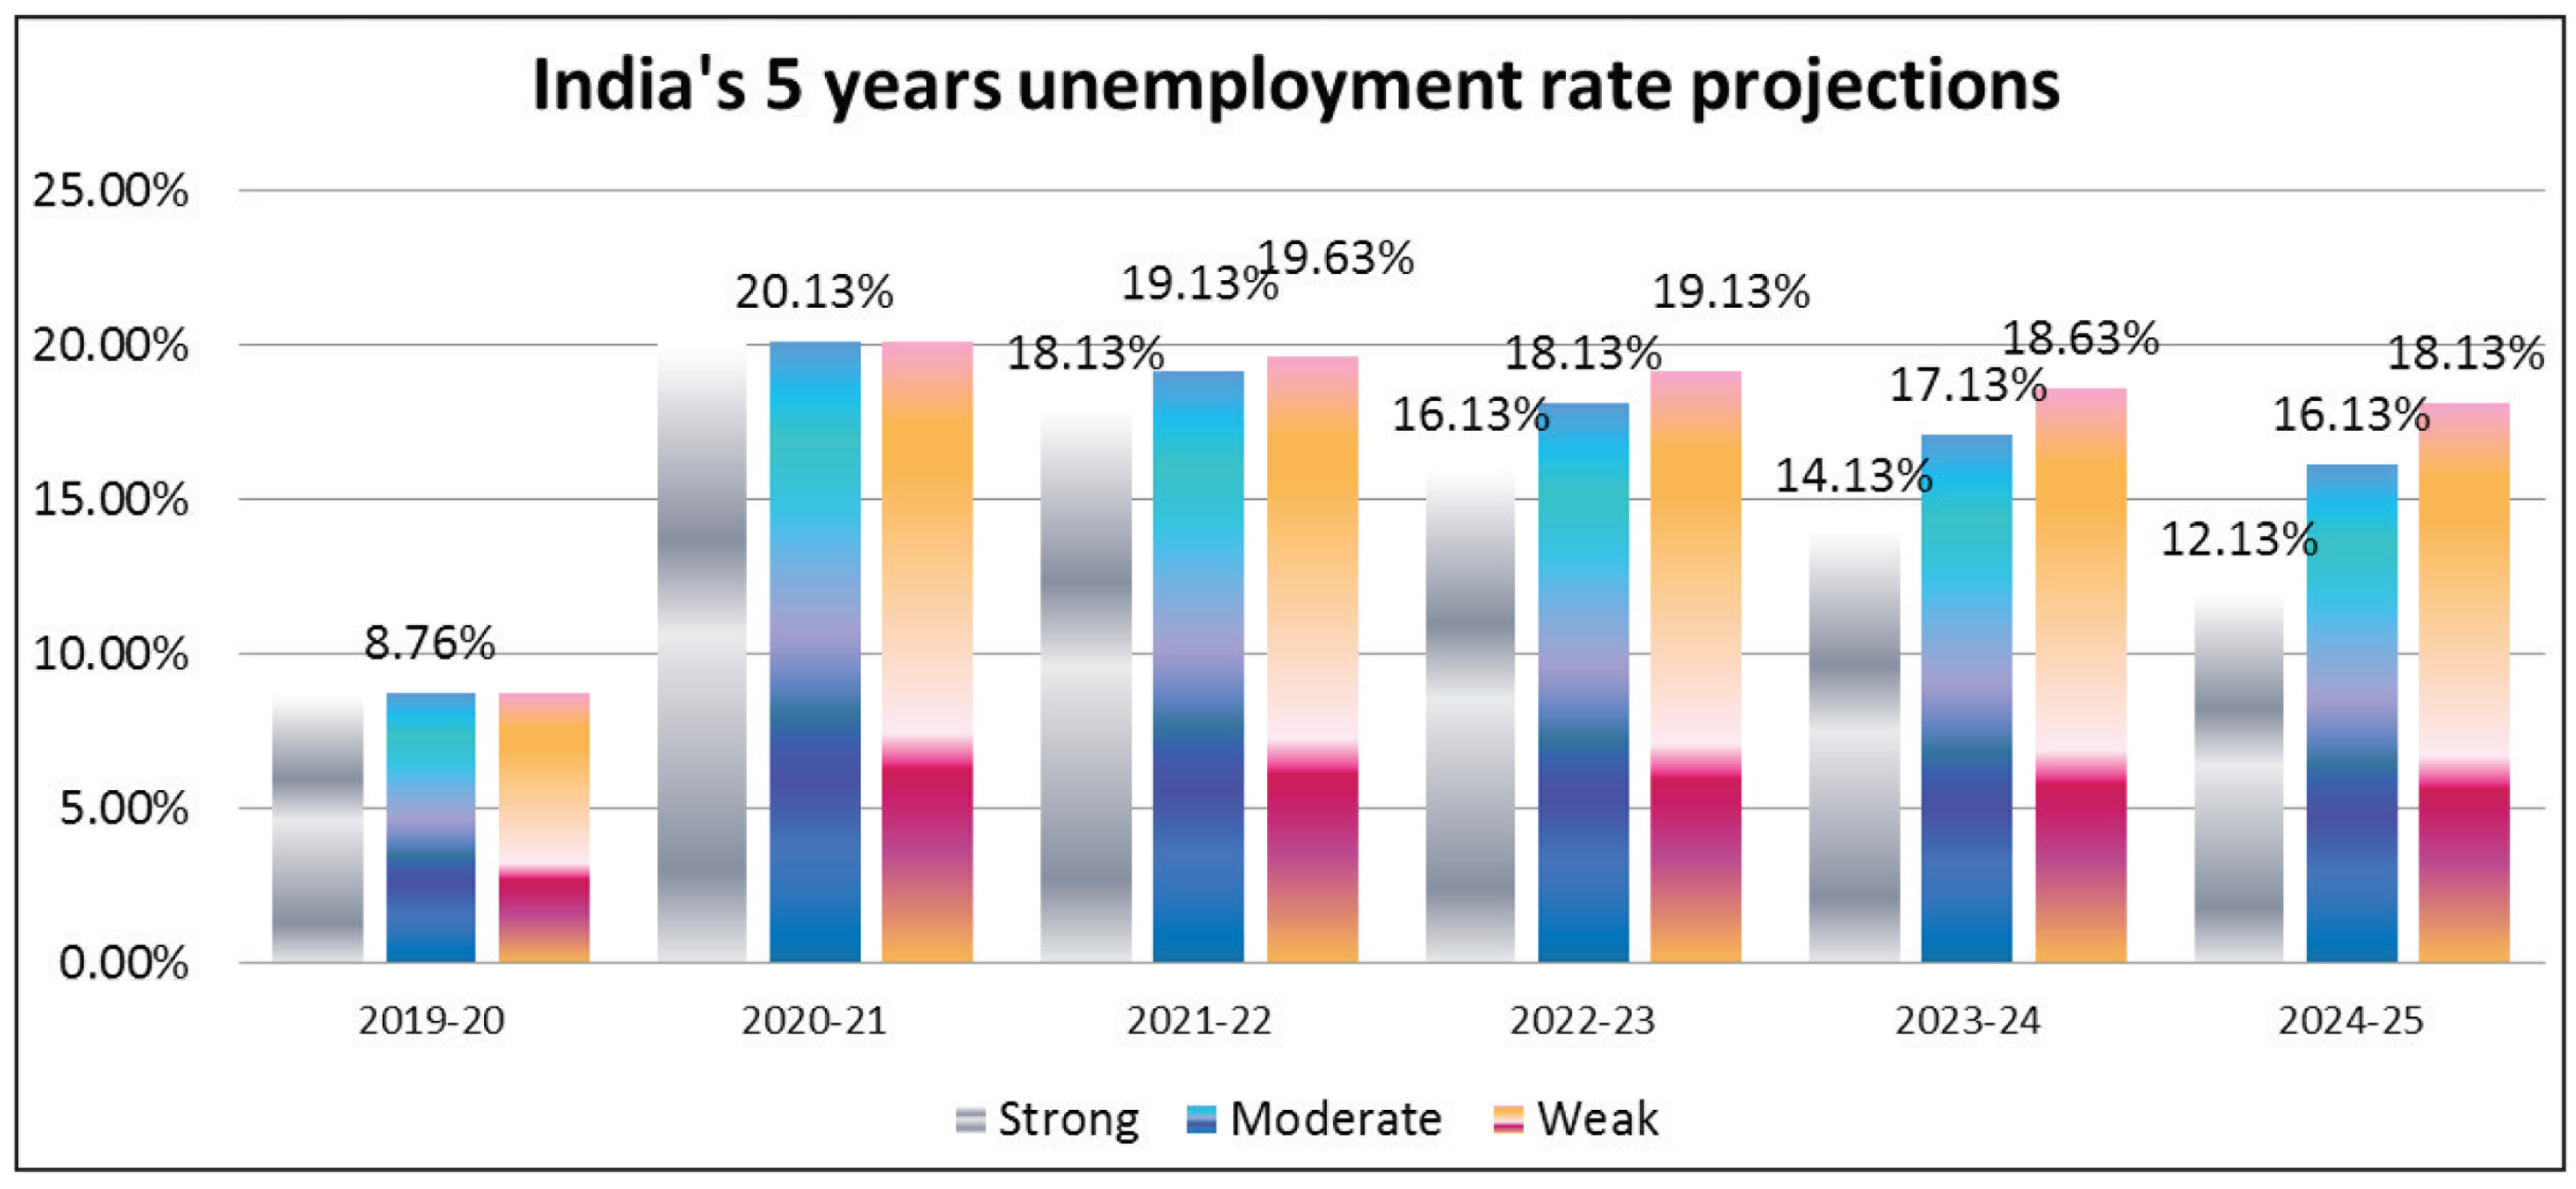
If the recovery is strong, in the year 2024–2025, the unemployment rate might drop down to 12.13% from a peak of 20.13% in 2020–2021. If the recovery is moderate, the unemployment rate might drop down to 16.13% from a peak of 20.13% in 2020–2021. If the recovery is weak, in the year 2024–2025, the growth rate might reach up to 18.13%.
Inflation Rate
Estimates for 2020–2021
Recent trends in inflation are given in Figure 11.
Three factors are likely to contain inflation in the short term. These are as follows:
Falling crude oil prices Reduced demand in the aftermath of COVID-19 pandemic Governments efforts to ensure supply of essential items
As of now, the government has not passed on to the consumers any reduction in oil prices. Petrol and diesel continue to sell at the old rates. This is something that the government is holding in its hand, which can use to curb inflation if it crosses reasonable limits. Further the demand itself has taken a major beating and is expected to keep the prices under check. At the same time, government has aggressively launched supplies of essential food items through rationing and other sources, which again, is likely to keep inflation under check. As the stock of items gets exhausted, the government will allow selective production facilities to resume operations with the use of adequate safety measures. All these measures together are likely to keep inflation in the year 2020–2021 under some check. The average inflation rate for the year 2020–2021 is not likely to go beyond 5–6%.
Estimates for 2024–2025
Long-term impact on inflation will also depend on the mode of recovery of the economy. If the recovery is weak, certainly it will adversely impact inflation, because consumption will not be contained below a certain limit. Supply rationing from government will also have limitations, and, hence, normalcy in the supply chain will only ensure that the inflation is kept under check.
Consistent with methods used earlier, three such scenarios with equal probabilities can be considered as strong, moderate and weak recovery. For a strong recovery, an average rise of 0.5% per year can be assumed. For a moderate recovery, an average rise of 1% per year can be assumed. For a weak recovery, an average rise of 2% per year can be assumed. Likely situations under these three scenarios of recovery are shown in Figure 12.
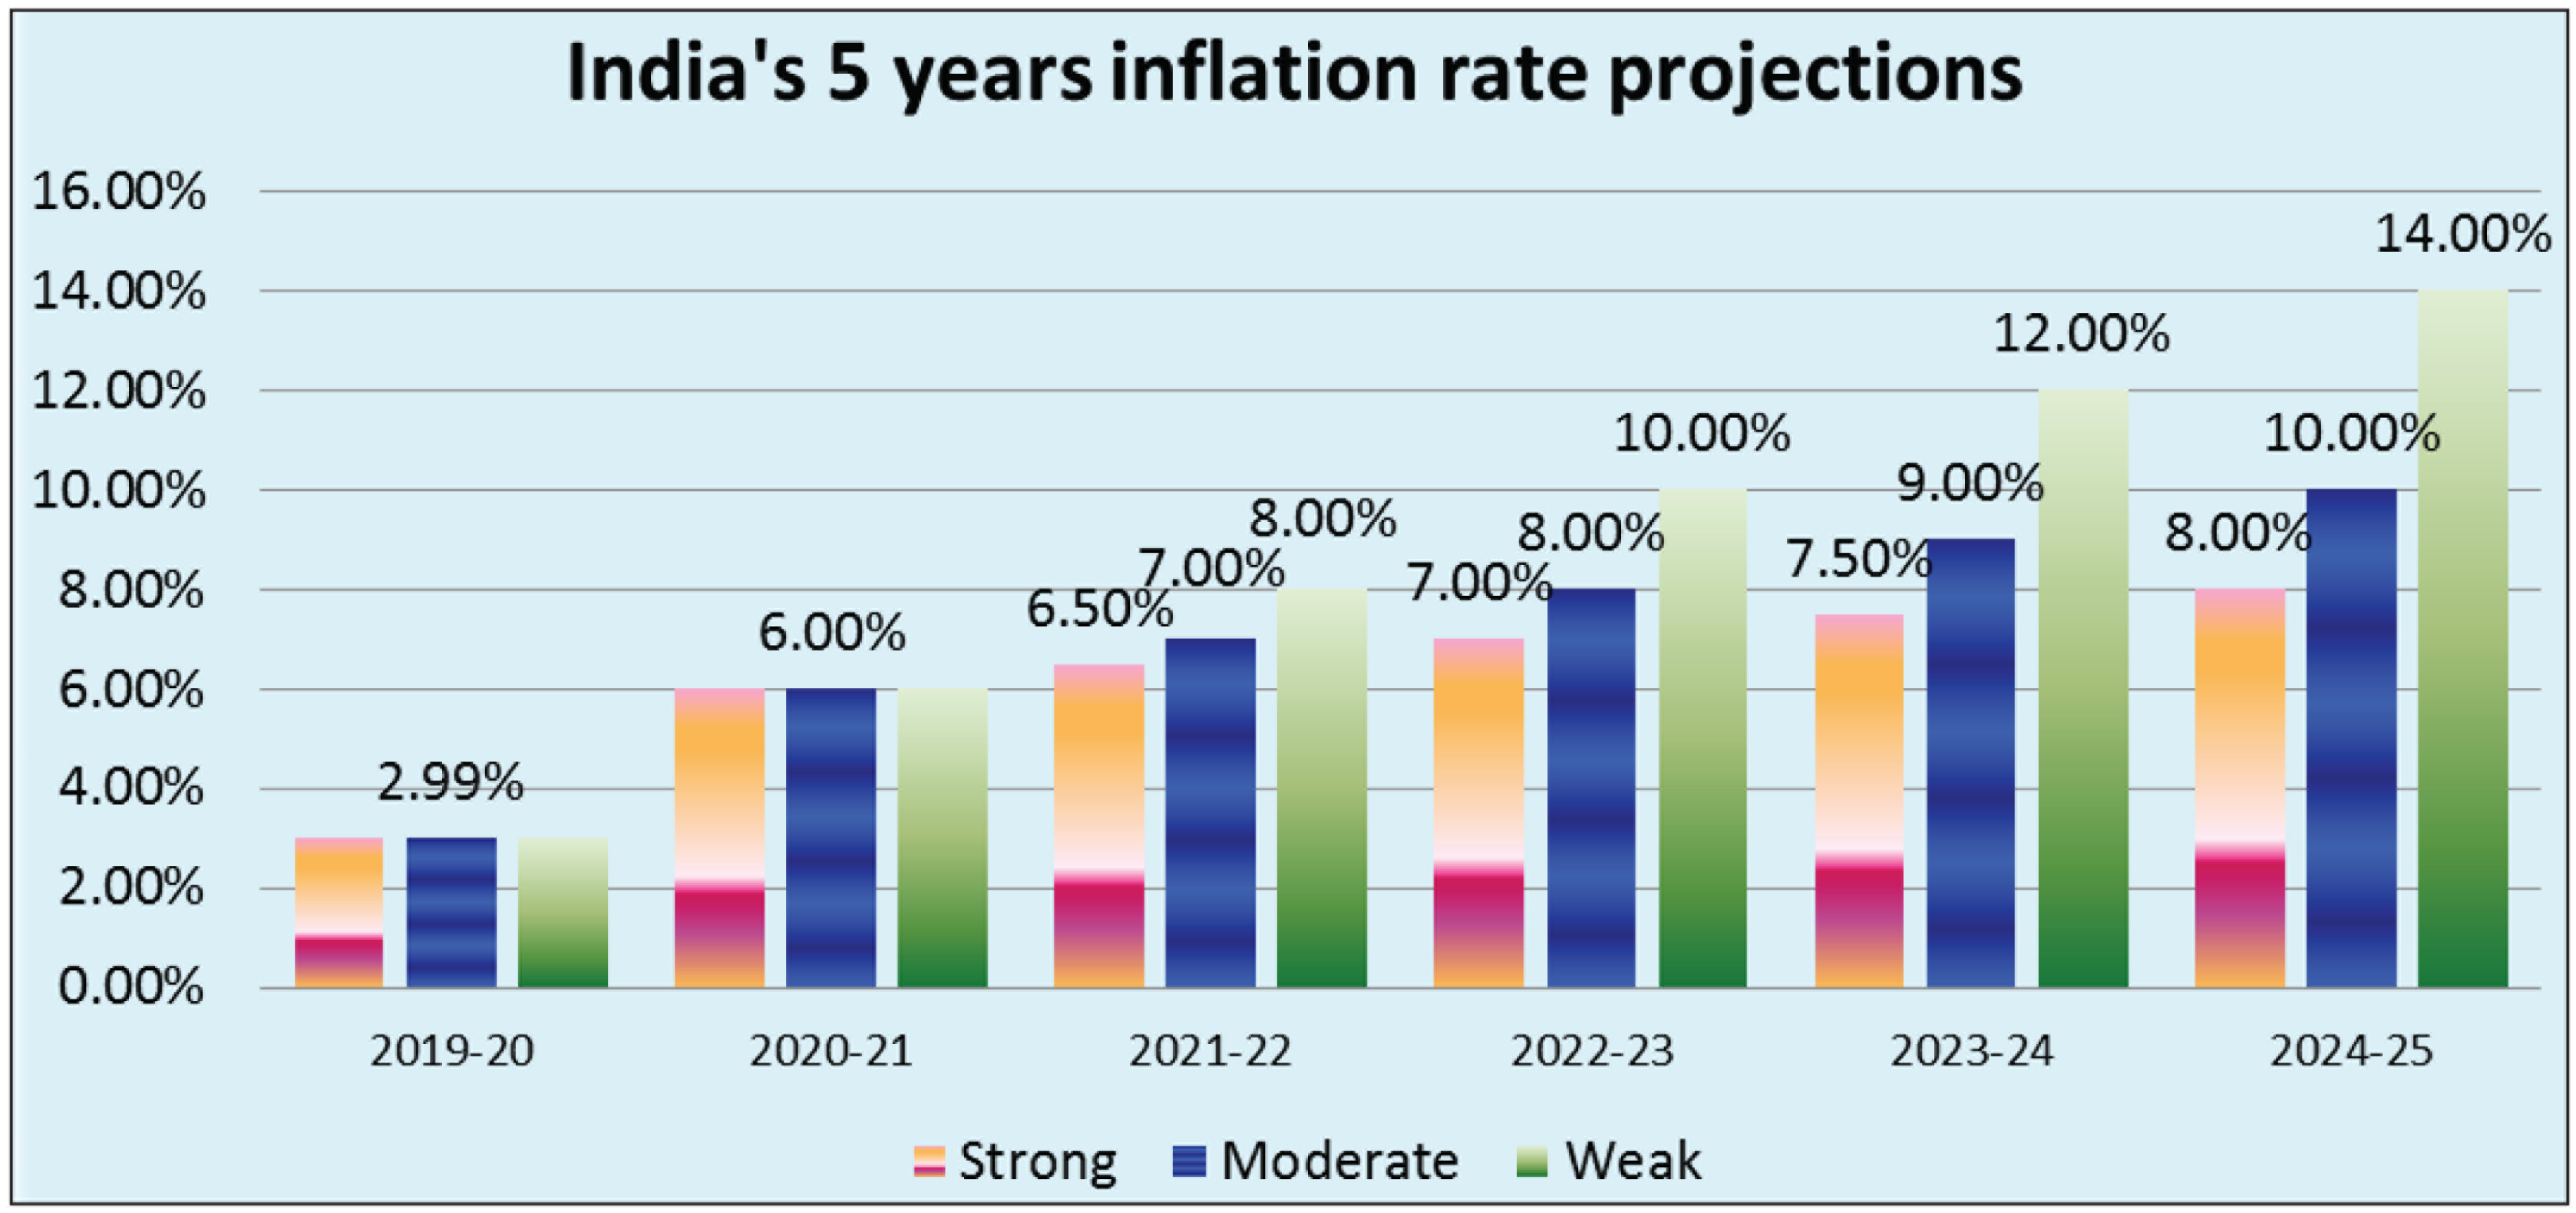
If the recovery is strong, in the year 2024–2025, the inflation rate might rise to 8% from a level of around 6% in 2020–2021. If the recovery is moderate, the inflation rate might rise to 10% from a level of around 6% in 2020–2021. If the recovery is weak, the inflation rate might rise to 14% from a level of around 6% in 2020–2021.
Interest Rate
Estimates for 2020–2021
In its meeting held on 27 March 2020, RBI (2020) took some bold steps and announced the following rate cuts:
Reverse repo rate: Cut by 90 basis points taking it down to 4% Repo rate: Cut by 75 basis points taking it down to 4.40% Marginal standing facility rate: Cut by 75 basis points taking it down to 4.65%
Additionally, the RBI also announced less popular measures to encourage bank lending. The cash reserve ratio has been cut down to 3.00% from 4.00%. Further RBI also has mandated moratoriums of 3 months on loan repayments, easing pressure on the borrowers. There is not much possibility that the interest rate will differ significantly from the current levels (as announced on 27 March 2020). They can go down further by another 100–200 basis points up to 31 March 2021 to ensure that adequate funding is available in the market. The base lending rate of SBI as on 10 March 2020 was revised to 8.15%. This by the end of the year 2020–2021 is expected to come down by another 100–200 basis points, given the fact that pushing-up lending will be a priority. Thus, as of 31 March 2021 the base lending rate (SBI) can be projected at 6.65% (8.15–1.50%).
Estimates for 2024–2025
Like other parameters, interest rates in the long run too will be determined by the mode of recovery. Three such scenarios with equal probabilities can be considered as strong, moderate and weak recovery. For a strong recovery, an average incremental rate of 0.5% per year can be assumed. For a moderate recovery, an average decline rate of 0.5% per year can be assumed. For a weak recovery, an average decline rate of 1% per year can be assumed. Likely situation under these three scenarios of recovery are shown in Figure 13.
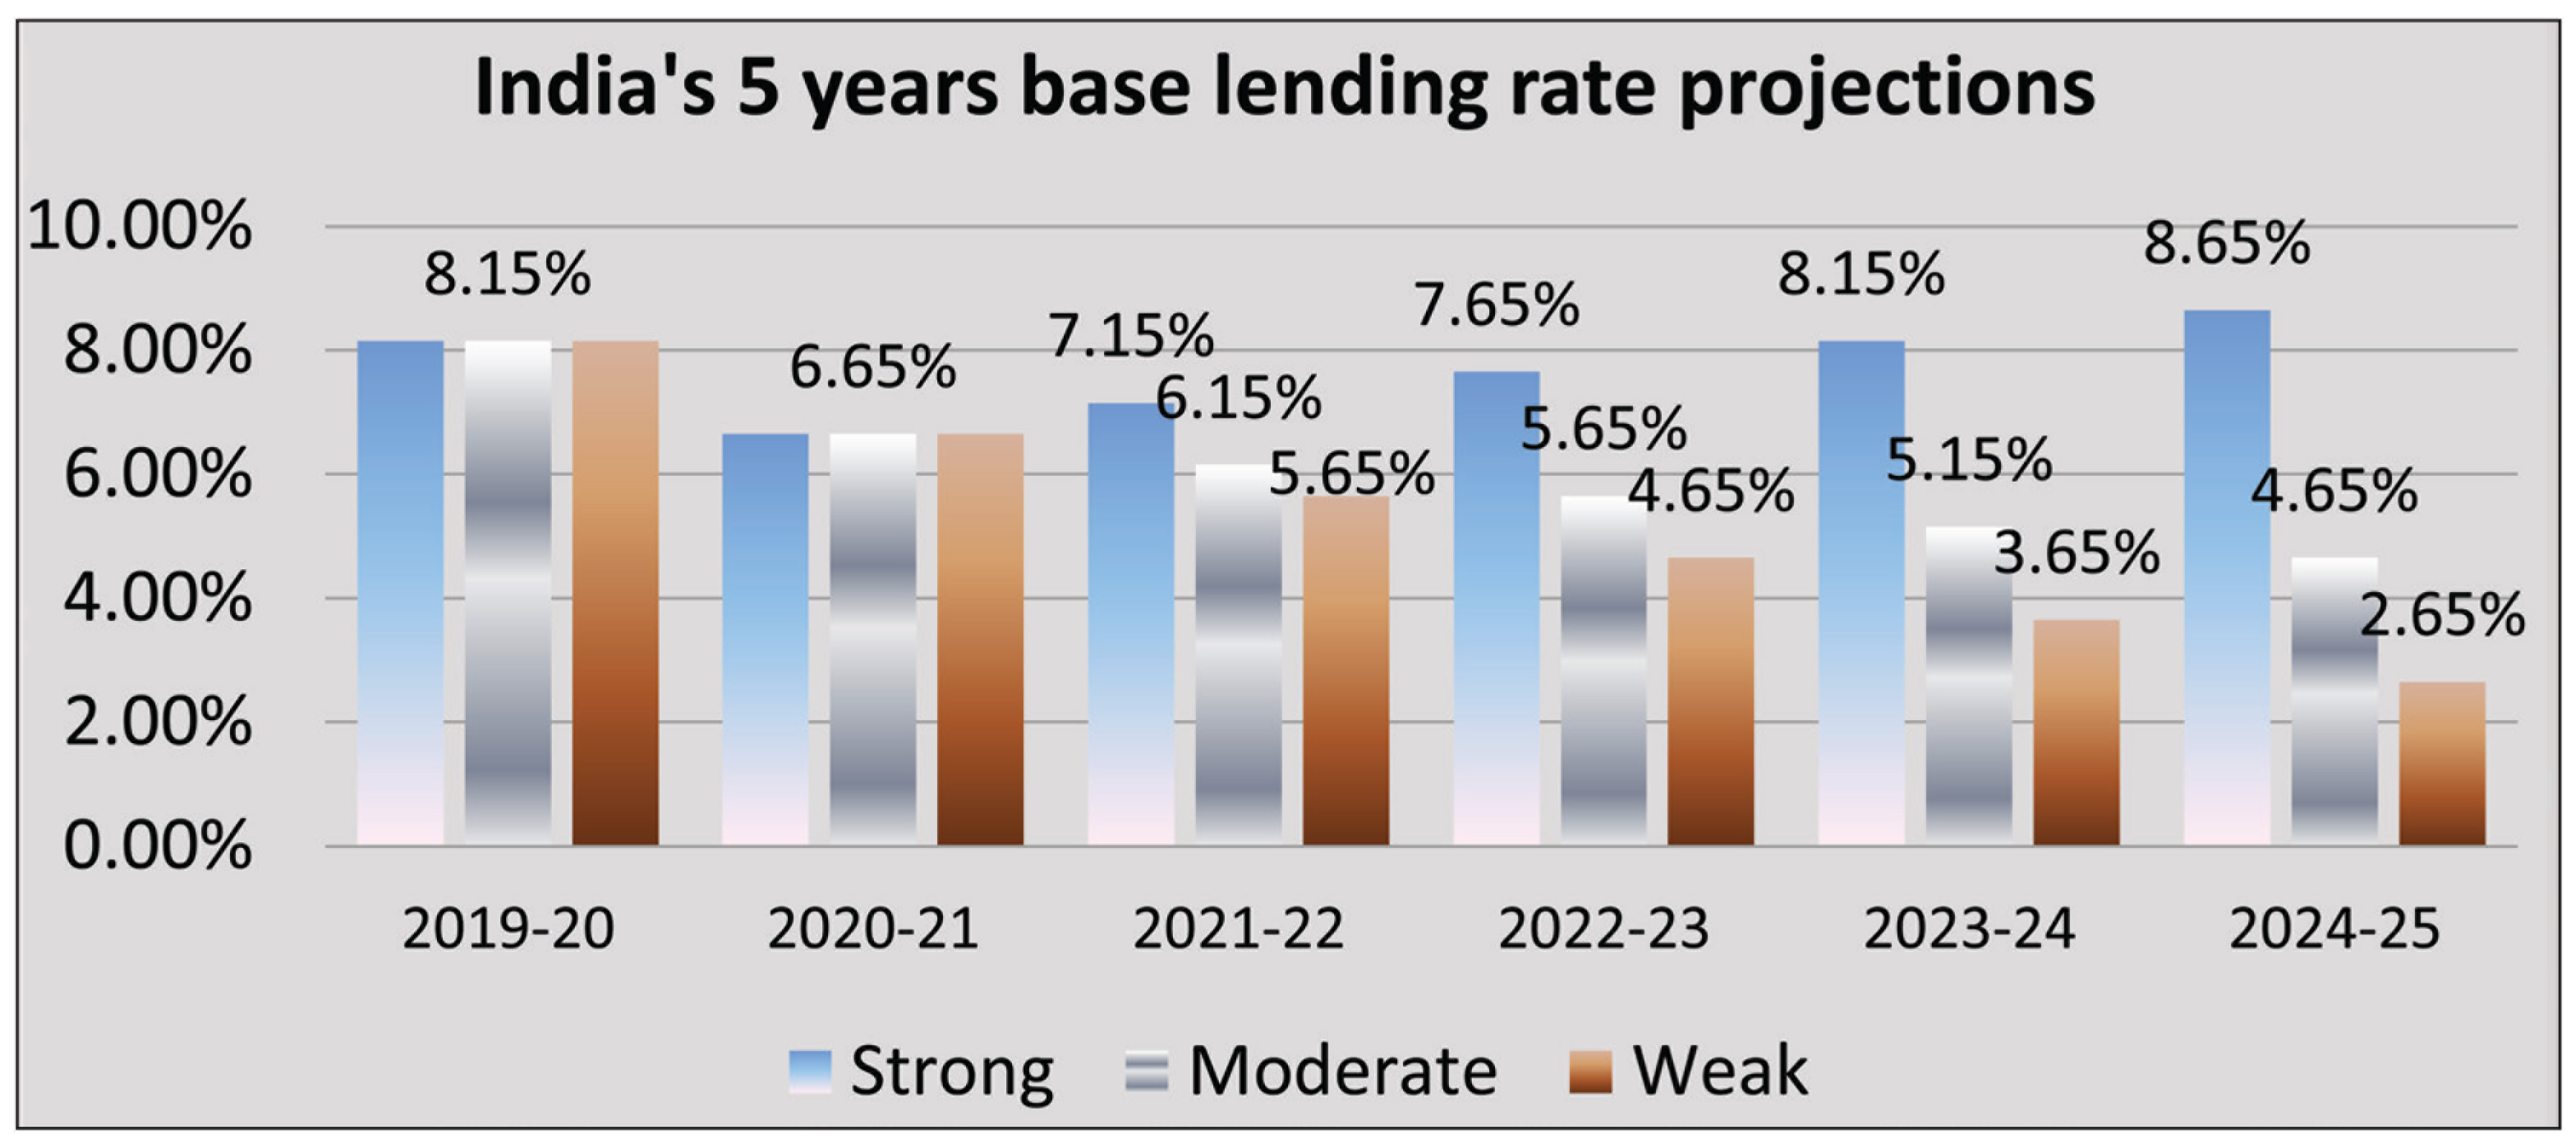
If the recovery is strong, in the year 2024–2025, the base lending interest rate might move up to 8.65% from the projected rate of 6.65% in 2020–2021. If the recovery is moderate, the base lending interest rate might move down to 4.65% from the projected rate of 6.65% in 2020–2021. If the recovery is weak, in the year 2024–2025, the base lending interest rate might move down to 2.65% from the projected rate of 6.65% in 2020–2021.
Industry Output
Estimates for 2020–2021
The year 2019–2020 till February 2020 was quite normal, as can be seen from Figure 14.
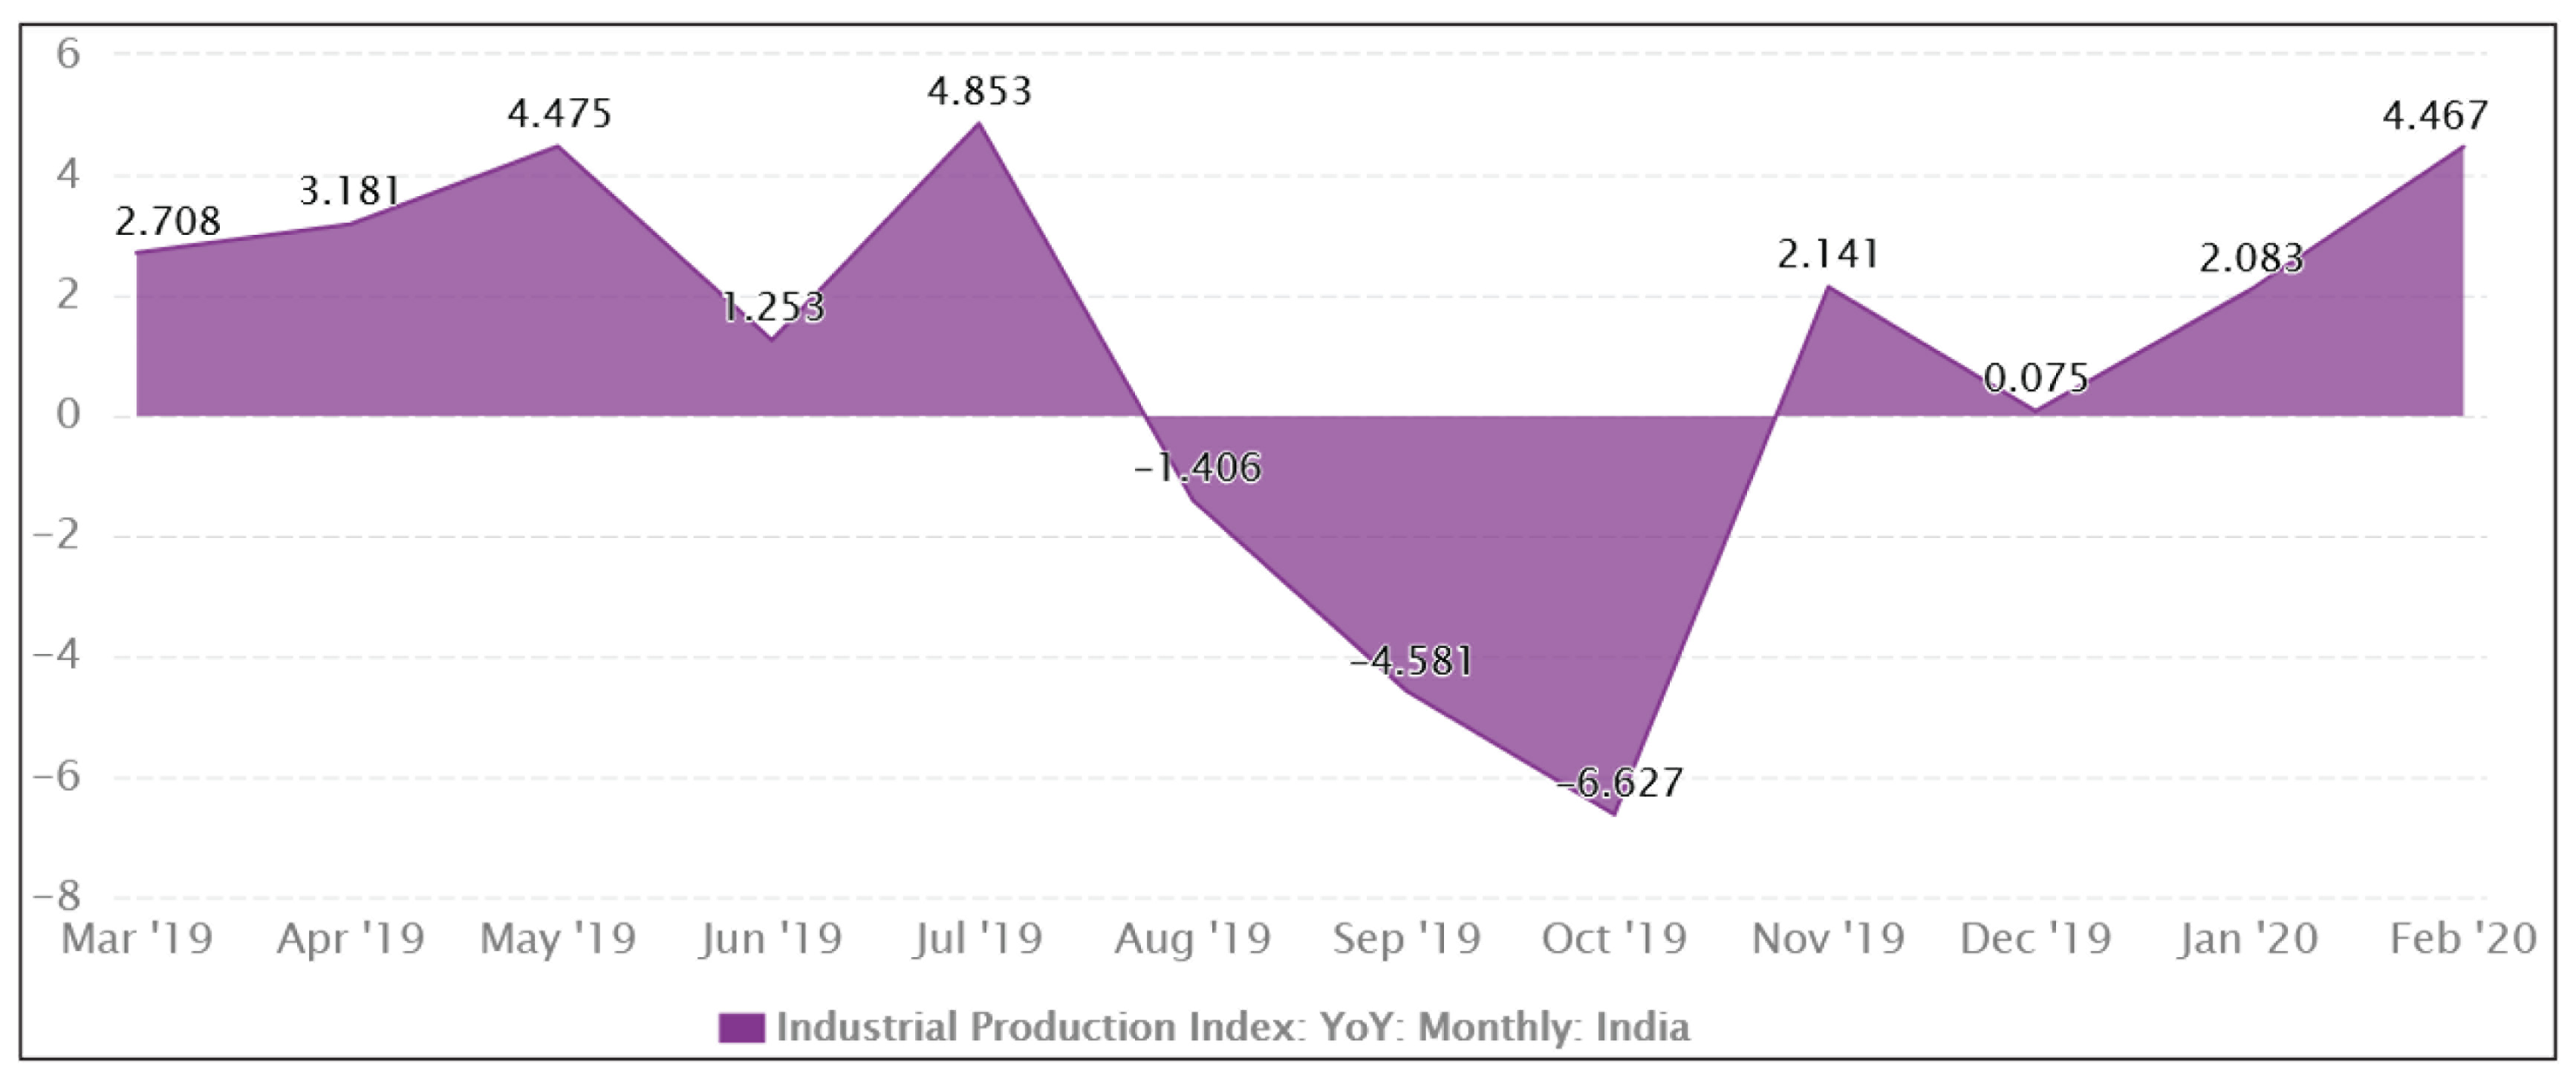
March, April and May 2020 are slated to take big hits amid the lockdowns and the extended lockdowns. This position is likely to continue until June 2020. But thereafter the government and the industry will have to take some positive steps towards recovery. Yet in any case the industry output will take some kind of overall beating in the year 2020–2021. A decision-tree model can be adopted considering three pessimistic situations: moderate, average and severe. Probability estimates for these three scenarios at this point in time (April 2020) can be taken as 0.33 each. The cuts in the industrial output rates for the three scenarios can be taken as −2%, −4% and −6%, respectively, for moderate, average and severe pessimistic situations. Taking into account these scenarios, their probabilities and the expected outcome, a decision-tree structure emerges, as shown in Figure 15.
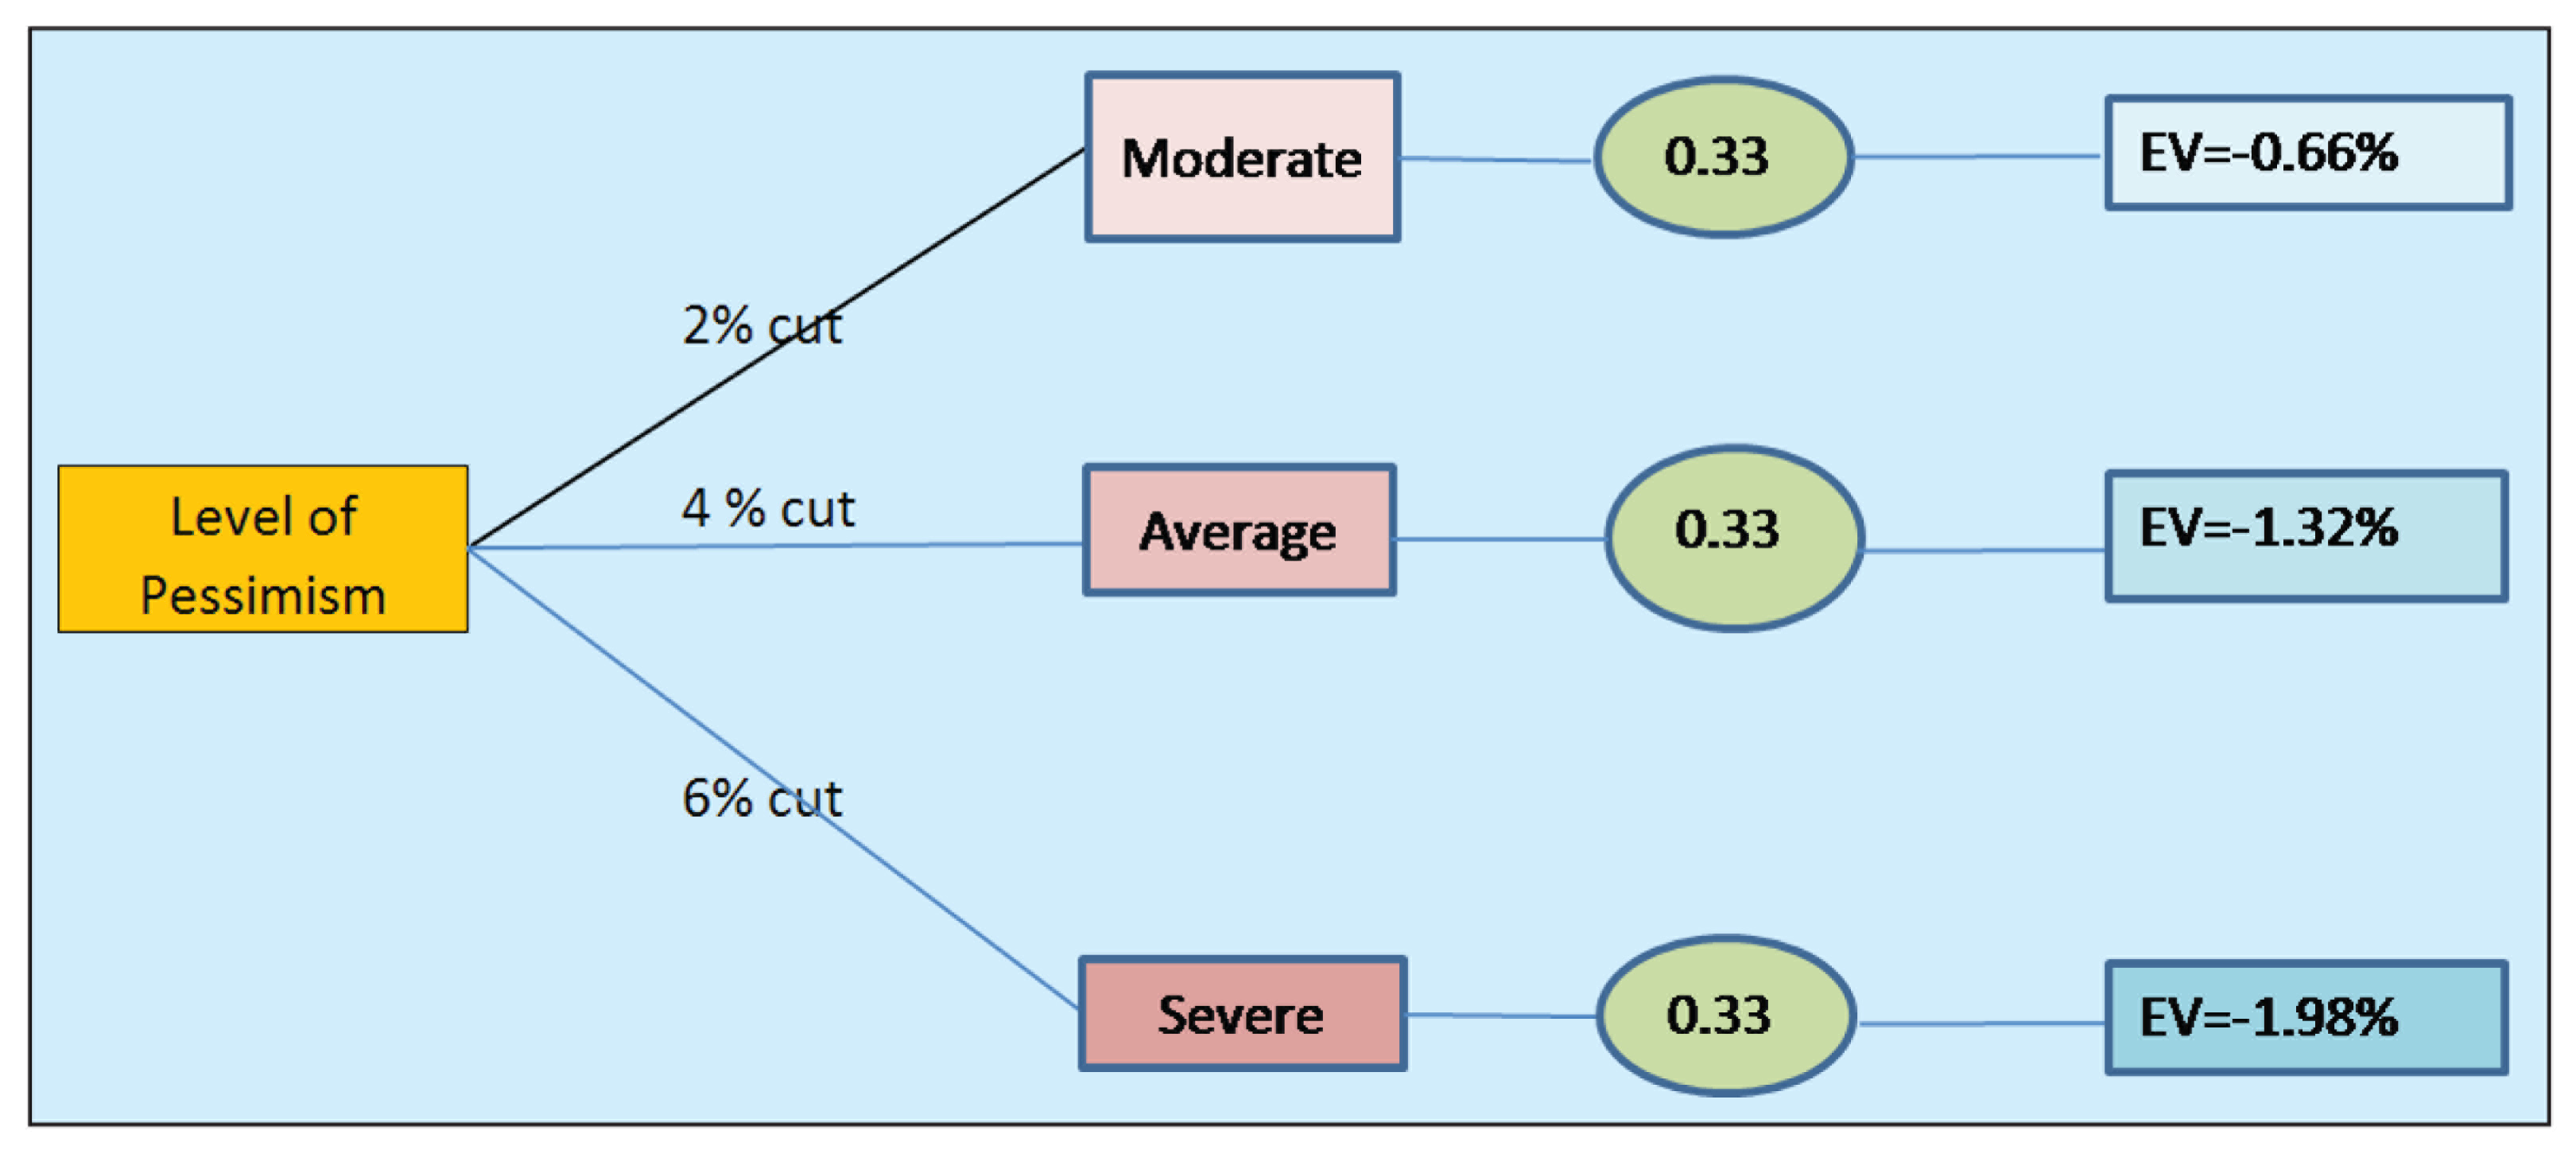
Aggregating the three EVs, −0.66%, −1.32% and −1.98%, the expected cut in the industrial output rate forecast for 2020–2021 is −3.96%. The March 2020 rate can be assumed as 0%. Thus, there is all likelihood that the industrial output for 2020–2021 might reduce to −3.96%.
Estimates for 2024–2025
An important factor influencing the industrial output projections for the next 5 years is the likely recovery rate. Three such scenarios with equal probabilities can be considered as strong, moderate and weak recovery. For a strong recovery, a positive average growth rate of 2% per year can be assumed. For a moderate, recovery a positive average growth rate of 1% per year can be assumed. For a weak recovery, a positive average growth rate of 0.50% per year can be assumed. Likely situation under these three scenarios of recovery are shown in Figure 16.
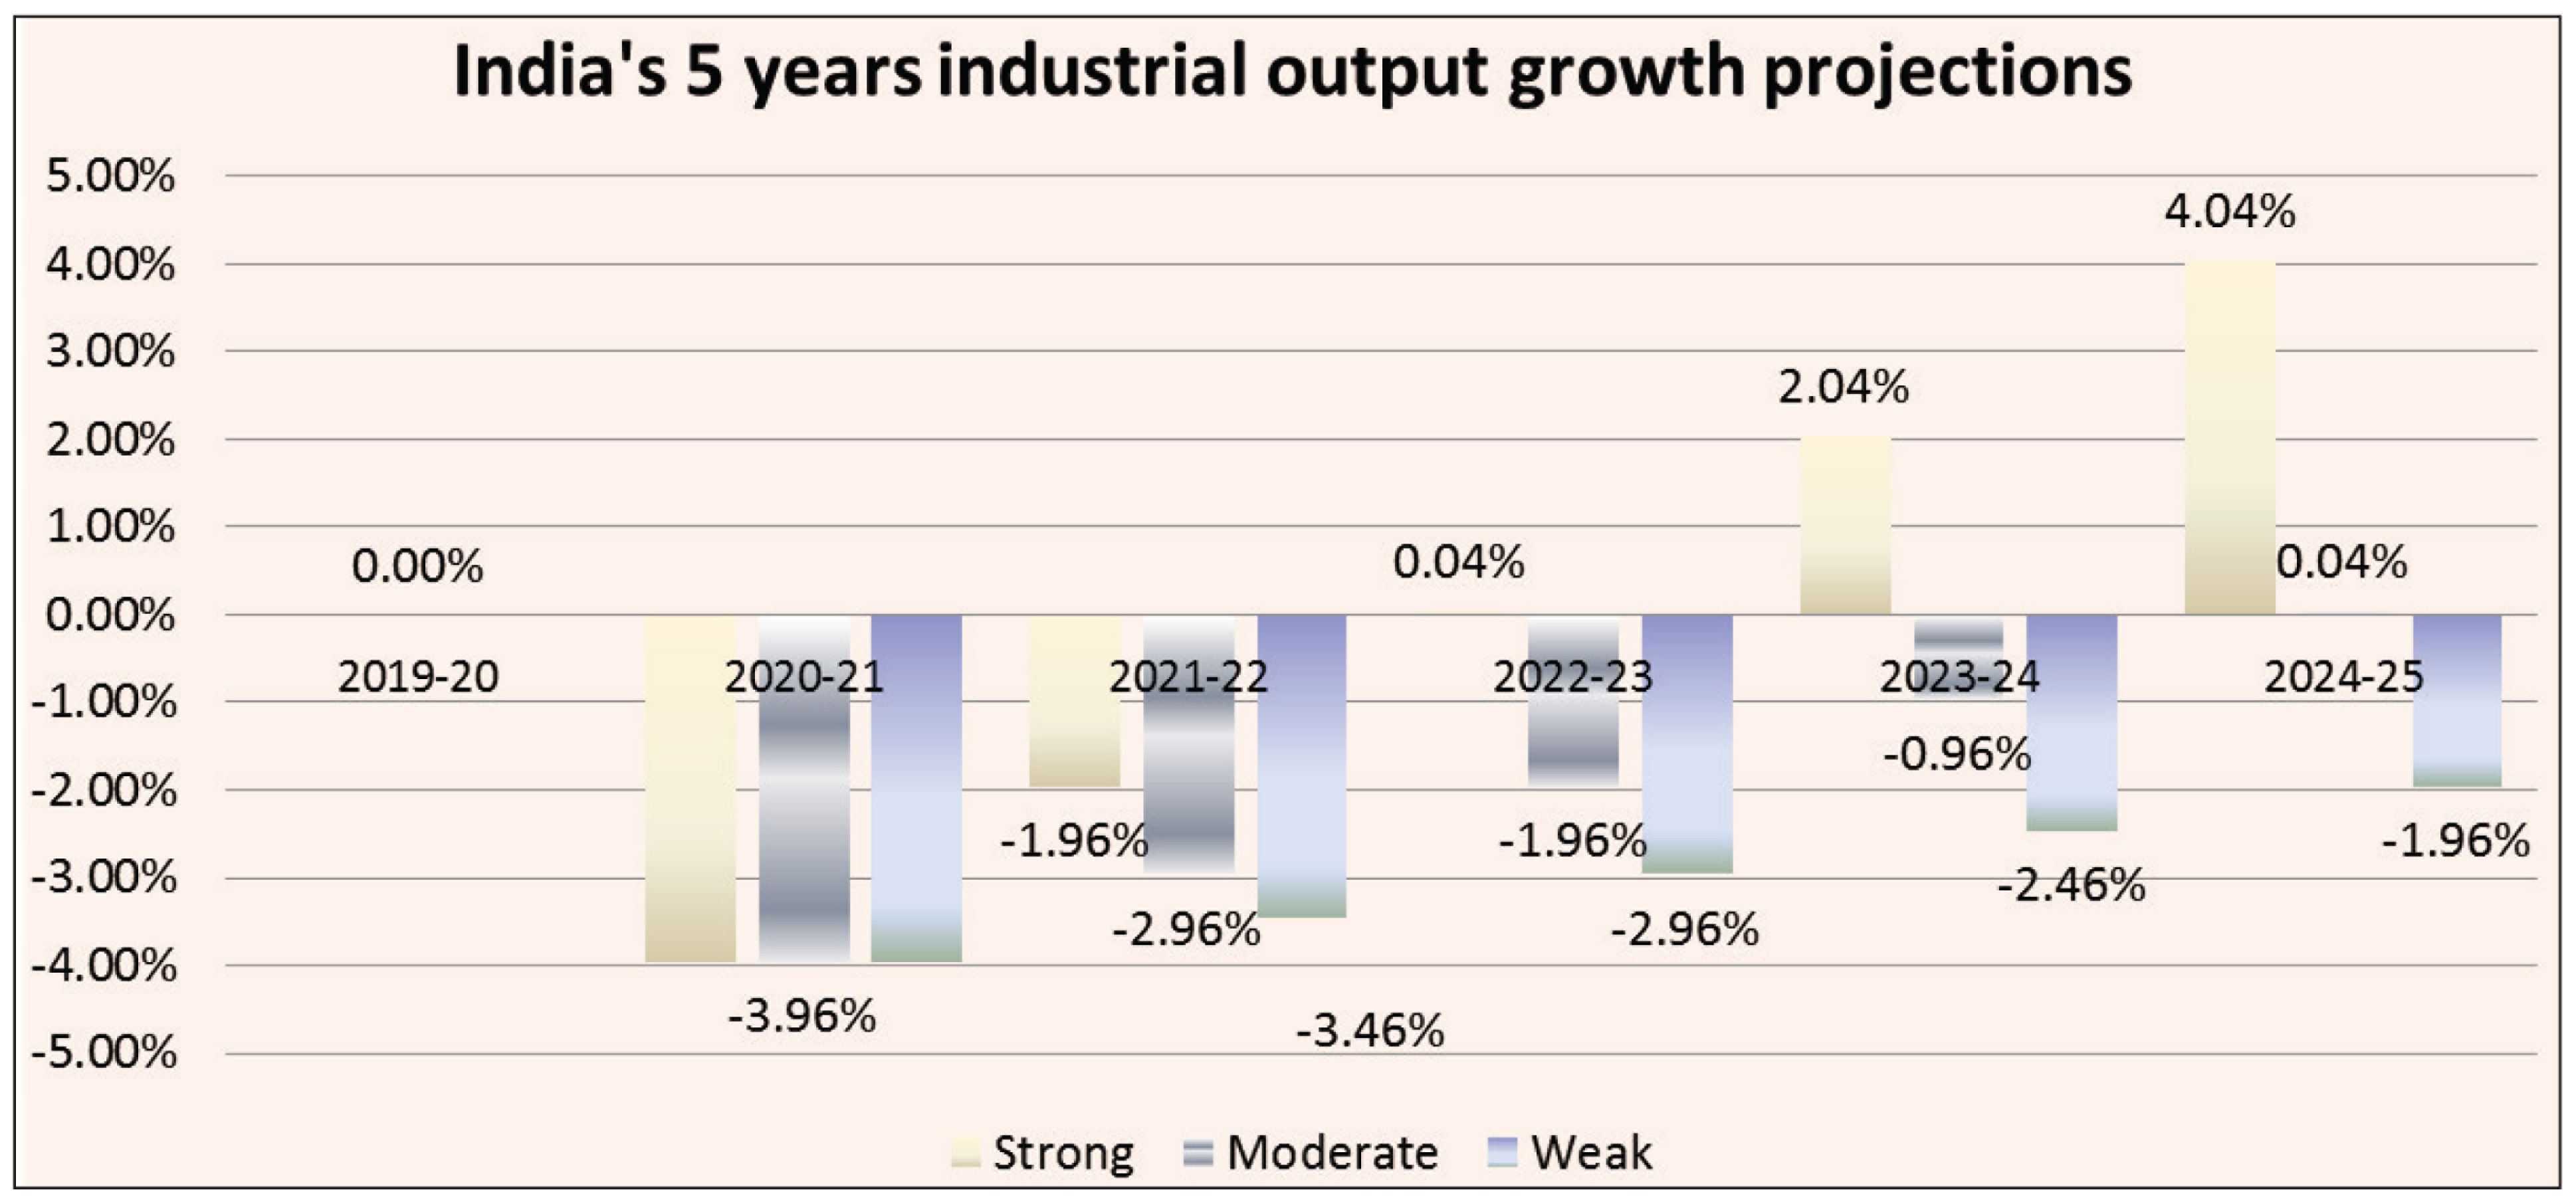
If the recovery is strong, in the year 2024–2025, the growth rate might reach up to 4.04%. If the recovery is moderate, in the year 2024–2025, the growth rate might reach up to 0.04%. If the recovery is weak, in the year 2024–2025, the growth rate might reach up to −1.96%.
Findings and Discussion
The economic impact assessment has been summarized in Table 4.
Summary of Key Indian Economic Indicators Projections
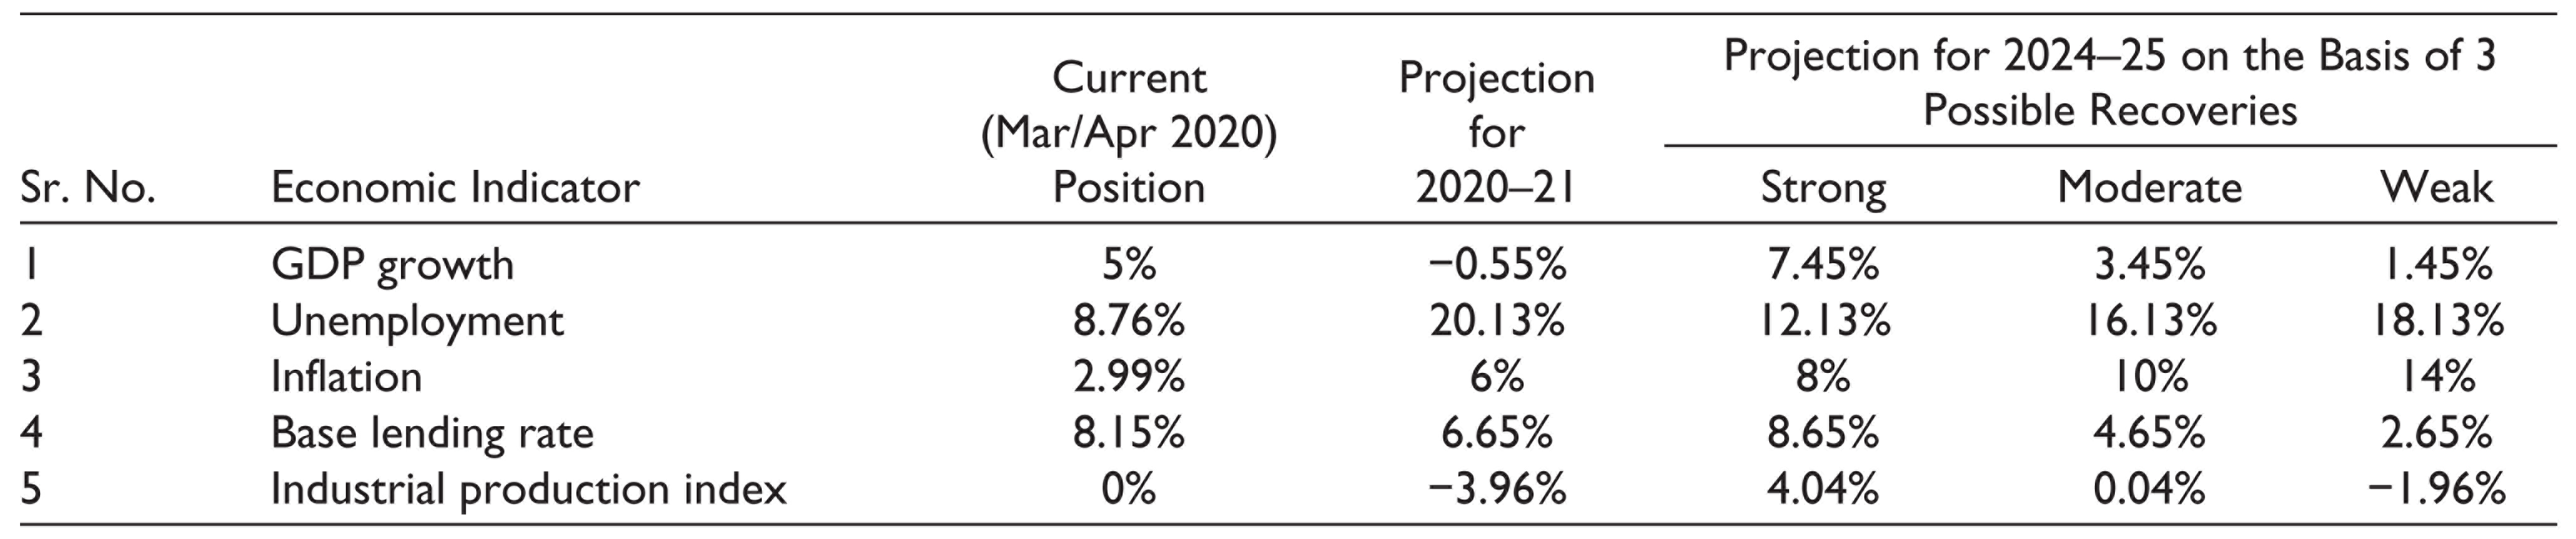
Big impact is likely on the GDP growth rate at least for the year 2020–2021. Same is the finding in case of unemployment. Inflation too is likely to rise in the short term at least. Base lending rate is expected to come down further as the government would like the banks to create more credit in the market. The industrial output is slated to take a strong beating at least in the year 2020–2021.
The economic impact in the long run will depend on the recovery mode. Three such modes, namely, strong, moderate and weak, show a wide range of possibilities.
A major impact of COVID-19 is expected on the Indian economy for fiscal 2020–2021. At the point of writing this article, that is, on 14 April 2020, the lockdown has been extended to 3 May 2020 and in all probabilities is likely to go up to 30 June 2020. So the first quarter will be completely lost. Amid a lot of uncertainty a positive view can be taken that at least from the second quarter of 2020–2021 a recovery will be initiated. The recovery will happen in phases and gradually. The recovery will be severely constrained by the concern of controlling the spread of COVID-19. Effectively it can be assumed that 2020–2021 will be actually of 6 months only. Thus, for 2020–2021 one should be prepared to take on the worst. A global recession has already been predicted by all leading economic and financial experts and some of them think that in June/July 2020 the big impact of the recession will be felt in the US and Europe. Strong leadership efforts will be required from the government. But it will take time to get into action at all levels. The year 2020–2021 would be a forgettable year for the Indian economy and people will remember it as a year of a ‘life-leveller’ or a ‘life-reset’.
Recovery in the long term will depend on the mode of recovery that the economy would be able to adopt. Three recovery modes can be possible: strong, moderate and weak. As of now, the best bet is to assume equal chances for all the three. The resilience of the economy as is always cited will be put to a big test. Some positives go in favour of a strong recovery. One is that the Indian economy is not much vulnerable to the global economic crisis except for a thing like oil imports. It has its own local demand-supply network that can bring back growth levels of 7–8%. There is strong political leadership at the centre whose role is so critical at times of a crisis. The nation seems to be united like never before and it can certainly bounce back. The extent to which it can bounce back, time will only tell.
It is suggested that the government should adopt a two-pronged approach to deal with the economic crisis. It will have to gear up its machinery to ensure a quick and strong recovery. First, these will involve major contributions from the central bank, the commercial banks, the financial institutions and other agencies in manoeuvring policies as per the demand of the situation. Second and importantly, it will have to motivate and involve the general public and private enterprises in responding to the situation. The mammoth nature of the problem warrants strong support from all the stakeholders. The government should make it pretty clear that everything should not be left to the government alone. A strong sense of responsibility will have to be inculcated amongst the general public, private enterprises, industrialists, workers and all other non-government stakeholders. There is a limit up to which the government alone can take on the fight. It is important, therefore, that the government initially only prepares other stakeholders for assuming a good amount of responsibility in taking on the recovery process.
Footnotes
Declaration of Conflicting Interests
The authors declared no potential conflicts of interest with respect to the research, authorship and/or publication of this article.
Funding
The authors received no financial support for the research, authorship and/or publication of this article.