
Abstract
This study aims to analyse the impact of force majeure events or exogenous shocks, characterized by a high level of uncertainty, on the US and European stock market behaviour through cross-regional and inter-industrial comparisons. Based on the sample of 832 largest stock-listed companies publicly traded in both regions, the authors investigate whether specific regional and industrial differences in the stock market reaction to exogenous shocks—as exemplified by the ongoing COVID-19 pandemic—and their recovery paths to be determined. The novelty of the research conducted by the authors is underpinned by the application of a dynamic network analysis method—supported by the exponential random graph modelling—for a data sample of publicly traded companies, encompassing major players and industrial leaders in both regions. Furthermore, the methods are applied quarterly for an identical set of industries in cross-market comparison, within a time span of periods before, during and beyond the exogenous shock. The results reveal significant differences in the reaction of US and European stock markets to exogenous shocks, despite globally integrated financial markets. The connectivity of the largest listed companies on the US market is higher than the European ones. Thus, publicly traded companies in the United States are more likely to be closely connected to their industry peers. As demonstrated by a cross-market comparison of the European and US stock market network configuration, the US network reveals higher probabilities of intra-industrial connections of its market participants. In contrast, the European stock market exhibits fewer connections and a less dense network of market participants in times of uncertainty or exogenous shocks. Except for the European financial industry, which behaves similarly to its US counterpart, the overall interconnectedness of European companies is weaker within the uncertainty-related timespan. The latest could be partially explained by numerous national regulations being implemented at a country level, which are partly deviating from the EU single-market policies. In contrast to a relatively homogeneous setting of the US market, a low level of interconnectedness of publicly traded companies in Europe could be further argued by the application of non-harmonized industrial policies, with the latest being expanded during the ongoing crisis in selected European locations. This difference could also be explained by the absence of a mutual strategy for alleviating the effects of the COVID-19 pandemic in Europe. The obtained results could be valuable for academics, conducting similar thematic research; for portfolio investors, and policymakers in forecasting, reacting and assessing stock market behaviour overall—and at the level of industrial sectors in particular—in response to events characterized as force majeure, exogenous shocks or periods of uncertainty.
Introduction
Global stock markets serve as business circle indicators in respective economies and give both individuals and businesses opportunities to raise capital (Thakor, 2015). Therefore, it is vitally important for market participants and policymakers to understand and predict changes in stock market prices and to identify triggers of stock market reconfiguration in response to uncertainty factors. The outlook or projection of stock returns can be heavily impacted by external events (Beaudry & Portier, 2006) or exogenous shocks (Ahlstrom et al., 2020; Hu et al., 2020). Macroeconomic events such as financial and sovereign debt crises (Grammatikos & Vermeulen, 2012; Schwert, 2011), simple supply and demand shifts (Hossin, 2023; Kaur, 2021; Phylaktis & Ravazzolo, 2005), national and regional geopolitical decisions (Boungou & Yatié, 2022; Onnela et al., 2004; Sun & Zhang, 2022; Tse et al., 2010; Worthington & Valadkhani, 2003) or force majeure such as natural disasters (Cavallo et al., 2013; Kong et al., 2021; Schuenemann et al., 2020; Teitler & Tavor, 2019) can severely impact economic growth, stock price development, volatility and overall stock market configuration.
Although regional epidemics are relatively common, a global spread like it has been seen with COVID-19 is extraordinary. Unlike other events with a much shorter time of impact, the COVID-19 pandemic is an ongoing circumstance to which the stock markets need to adjust continuously. The United States and Europe are home to large and highly developed stock markets. Both regions were severely hit by the pandemic, with over 150 million cases in both regions as of December 2021 (CDC, 2022; WHO, 2022b). The current pandemic in its scale and severity can only be compared to the 1918 Spanish Flu. While stock markets existed back then, they were far from the developed markets as of today and much less interconnected. Considering its scale and level of impact, the COVID-19 pandemic has already been classified as a disruptive exogenous shock by numerous authors, and made to a unique natural experiment for research in many business areas such as business operations (Lau, 2020; Sarker et al., 2022), supply chain management (Hayakawa & Mukunoki, 2021) and HRM (Caligiuri et al., 2020; Sharma & Sharma, 2022).
However, no published research has been conducted so far on (a) comparative regional stock market behaviour analysis; (b) for a time span before, during and beyond an event of exogenous shock; (c) while considering inter-industrial and intra-industrial stock market reaction; and (d) with a focus on major sectors of advanced economies in selected regions. All elements listed above are incorporated into the study design and investigated by the authors of this article. The frequency of observations and data sample generated for analysis are current and unique too. The results are calculated by mean of novel quantitative analysis techniques applied, as described in the Data Description and Methodology section.
In the context of reaction to an exogenous shock of a prolonged and repeated (wave-wise) character, such as the COVID-19 pandemic, the current research goes multiple ways to ascertain market behaviour changes. Aslam et al. (2020) used a correlation-based approach to analyse a multitude of global indices. They identified a contagion effect and reduced connectivity overall. Our research results confirm the findings for a single stock perspective for the European and US American region and contribute both theoretically and methodologically to the academic debate on the topic, while extending upon the timeframe and frequency of observation. A study by So et al. (2021) used both correlation and partial correlation methods in network analysis on an observation of the Hong Kong stock exchange. During the crisis, they found higher clustering and network density. While that study observes the Hong Kong stock exchange on a single stock level, it omits the industry affiliation. Furthermore, it only observes the Hong Kong stock exchange and does not draw comparisons to other regions. The results of our research can partly confirm the increase in network density and clustering as reaction on an exogenous shock for a correlation-based approach. However, with a different method being applied for the partial correlation, the opposite reaction of the market became evident, where no connections during the outbreak could be drawn.
The objective of this article is to combine the cross-market research with inter-industrial and intra-industrial analysis for two major stock markets within a timespan encompassing periods before, during and beyond the exogenous shock. This gives the authors the opportunity to investigate the specific regional and industrial differences in the stock market reaction on an exogenous shock, exemplified by the ongoing COVID-19 pandemic, and, to elaborate and discuss the respective recovery paths being determined.
To investigate the impact of force majeure events or exogenous shocks, characterized by a high level of uncertainty, on the US and European stock market behaviour, the authors have conducted a cross-regional, inter-industrial and intra-industrial analysis on a sample of 832 publicly traded companies in both regions. These markets were specifically selected, as they are highly developed and make up the core of the global financial market (Yin et al., 2017). For research purposes, exogenous shocks were exemplified by the ongoing COVID-19 pandemic, which took over Europe and the United States around March 2020.
The research conducted by the authors, and the results presented and discussed in our article provide evidence of tangible differences in the stock market behaviour on a regional and industrial level. The novelty of methodology, chosen observation time frame and the analysed data sample differentiate this article from existing research in several features:
Prior studies facilitating cross-regional analyses during the COVID-19 pandemic focused on the stock market or composite indices (Aslam et al., 2020; Chakrabarti et al., 2021; Li et al., 2021a; Okorie & Lin, 2021; Samitas et al., 2022; Zhang et al., 2021). We argue that a detailed observation of single stocks and their industry affiliation contributes to a better understanding of intra-industrial and inter-industrial connections of stock market participants in a cross-market comparison. The quantitative analysis techniques and chosen methodology of Gaussian Graphical Models (GGMs) and Exponential Random Graph Models (ERGMs) are novel for the thematic context, time span and data sample investigated by the authors. Our approach to observation in regular time intervals to display dynamic changes in the models is different to prior network analysis studies, which primarily look at a ‘before’ and ‘during’ COVID-19 period (Aslam et al., 2020; So et al., 2020). Therefore, the obtained results extend the theoretical context and add value to the academic discussion on the topic. Furthermore, they demonstrate new knowledge for portfolio investors and policymakers in forecasting, reacting and assessing stock market behaviour overall—and at the level of industrial sectors in particular—in response to events characterized as force majeure, exogenous shocks or periods of uncertainty.
The article is organized as follows. The Literature Review section summarizes the existing research and thematic studies. The Data Description and Methodology section includes a detailed description of the selected methods, utilized in the study and the data. The main results are interpreted and discussed in the Analysis section, followed by the Conclusion.
Literature Review
The significance of pandemics’ effect on national and international economies and financial markets has been shown in multiple studies, including but not limited to the study of the ‘Spanish Flu’ (Almond, 2006; Brainerd & Siegler, 2003), seasonal influenza (Meltzer et al., 1999; Smith et al., 2009) and SARS (Fan, 2003; Keogh-Brown & Smith, 2008). However, these past events fail to compare in scope and scale to the COVID-19 pandemic. Apart from apparent tragedies associated with the number of infected individuals and deaths (WHO, 2022a), COVID-19 created unprecedented threats to the global economy and financial markets worldwide (Boot et al., 2020). Furthermore, the COVID-19 pandemic came with an unprecedented level of uncertainty that required a novel methodology for analysing its short-term and long-term impact on industries, countries and regions.
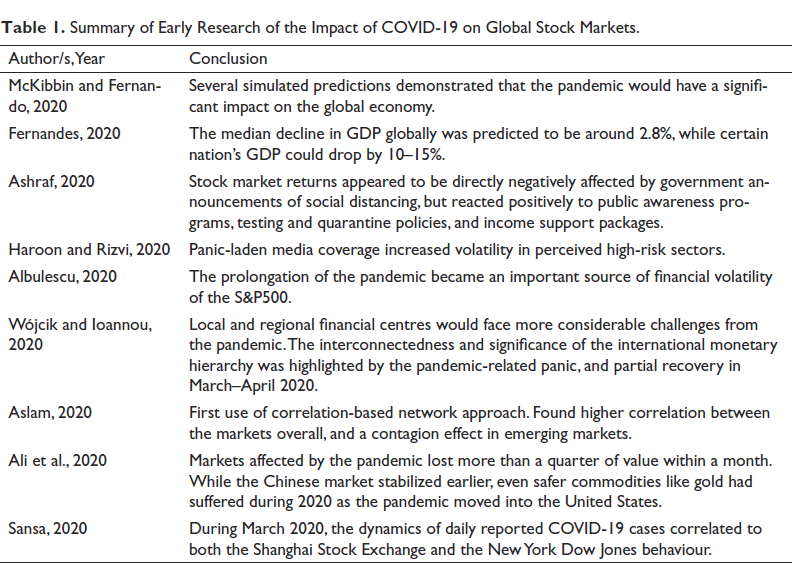
Early studies of the impact of the COVID-19 pandemic have been crucial for the understanding of the overall situation as well as the development of mitigation strategies. A review of studies focusing on the impact of COVID-19 on the financial markets has been summarized in Table 1. Overall, the results of the thematic research suggest that the COVID-19 pandemic is to be classified as an exogenous shock having severe impacts on global stock markets.
Summary of Early Research of the Impact of COVID-19 on Global Stock Markets.
The interlinkages between international enterprises, especially location and industry-related connections, are an integral topic of research and academic interest in the context of international business. Some previous studies are explicitly focused on selected global cities (Goerzen et al., 2013) such as Shanghai and Beijing, aiming to determine the location choice of host-country headquarters (Ma et al., 2013). The capture of the concept of international connectivity has been recently developed in several studies (Asmussen et al., 2020; Belderbos et al., 2017). Bathelt et al.’s (2004) arguing that economic geography perspective stresses the importance of locational interlinkages, suggesting that links connecting global cities favour economic prosperity through ‘the flows of knowledge, capital, people and goods that circulate in the world’ (Beaverstock et al., 2002, p. 114). International connectivity is consequently thought of as a multidimensional concept, split into three approaches of study (Belderbos et al., 2017): a knowledge-centred approach (Cano-Kollmann et al., 2016; Lorenzen & Mudambi, 2013), a corporate organization approach (Derudder et al., 2003; Taylor, 2001) and an infrastructure approach (Mahutga et al., 2010). In a more recent study, Castellani et al. (2022) argue that not all connectivity dimensions are equally crucial for multinational enterprises, as, for instance, research and development labs value areas connected worldwide through international networks of inventors, while decisions on headquarters location put more emphasis on connectivity through the mobility of people, infrastructure and producer services.
The existing studies on connectivity inspired the authors of this article to conduct research by mean of a novel network-based analysis method, while focusing specifically on dependency connections within financial market data of listed companies in two advanced economic regions. Our study combines financial market data with the respective dynamics of the COVID-19 pandemic, measured by the number of cases of infected individuals within identical time frame. Our research generates unique results contributing to a deeper understanding of stock market behaviour and (re)configuration pattern in the event of force majeure, exogenous shocks or periods of high uncertainty. The results, furthermore, enhance the international connectivity research with this novel dimension.
While applying a contextually adapted—and, therefore, novel—network analysis method for a sample of global stock market data within a time frame of repeated exogenous shocks, our study contributes to the development of research methodology and instruments in the academic field of international business.
One approach to infer the companies’ relationships in terms of connectivity is generating an association network that would represent the underlying structure of a financial market. Correlation networks are a special case of association graph models, in which the vertices represent distinct companies, and the edges—the sufficient level of correlation between observed prices or logarithmic returns. Correlation networks were first used for a stock market application in a study by Mantegna (1999). In the following studies, this methodology was applied for crisis-related or uncertainty-related time periods to observe respective market effects (Onnela et al., 2002; Schuenemann et al., 2020). Despite their popularity and simplicity, correlation networks may be overoptimistic about the existence or absence of relationships between companies due to the cross-correlation present in stock market data (Kolaczyk & Csárdi, 2020). Partial correlation offers an alternative to account for external companies’ influence. It determines the relative effect different industrial sectors have on the market by constructing a network using the partial correlations between companies’ stock data (Kenett, Shapira et al., 2010). Breard and Katenka (2016) used partial correlation and partial canonical correlation networks for stock market portfolio selection in a multi-attribute approach, which resulted in less risky portfolios. Millington and Niranjan (2020) used a partial correlation network to analyse the S&P500 stock data from 2000 to 2017. They found partial correlation networks to be less stable than correlation networks.
Gaussian Graphical Model is a special popular type of partial correlation network model (Kolaczyk & Csárdi, 2020). The data used to construct a GGM network are assumed to have a multivariate Gaussian joint distribution. The partial correlation between two vertices is conditional upon the information at all other vertices (Baba et al., 2004; Kenett et al., 2010; Shapira et al., 2009). Graphical models have found many applications within and outside of the financial field, for example, in the areas of biology (Lee et al., 2019; Wang et al., 2016; Yin & Li, 2011) and urban planning (Hara et al., 2018), to name a few. Besides these use cases, GGMs were also valuable for analysing financial market data (He et al., 2017). Fan et al. (2020) used GGMs to construct China’s financially systemic risk contagion network. They found that systemic risk had a cluster effect. Aguilar (2020) used GGMs based on daily logarithmic returns of the Mexican stock market to explore the interdependency structure of Mexican companies. These results showed relatively stable interdependency structures.
The previously mentioned studies used this method exclusively to observe a single national market. Applying GGMs to stock market data in our study, and comparing two advanced regions before, during and beyond an exogenous shock event is, therefore, a novel research approach, extending international business field methodologically, and theoretically—with valuable results generated by mean of this method.
Elaborating on the inferred GGM networks results, the authors of this article next apply the ERGM, to evaluate the strength of intra-industrial and inter-industrial connectivity of companies in selected industrial sectors under consideration of an exogenous shock event exemplified by the ongoing COVID-19 pandemic. In general, ERGM family models measure the influence of vertex and edge attributes on the formation of edges in the network and, therefore, the network structure (Morris et al., 2008). The model demonstrates specific connectivity patterns inherent in the stock market data in each given timeframe and has been applied in some recent financial market studies (Li et al., 2021b; Yao et al., 2022). Deev and Lyócsa (2020), for instance, found larger connectedness between financial institutions in the same country and regions with a common currency. Zhang et al. (2020) used ERGM in a study that showed that the global stock market network reflected typical event-driven and time-varying characteristics. However, the previous studies had not excessively used these methods to analyse global financial markets, especially in the event of an exogenous shock and, in addition, in cross-market, and intra/inter-industrial comparison. The latest once again substantiates the research objective and offers the authors an ample opportunity to apply them for the purpose of this study, to gain novel insights and add contributions to the academic field.
Data Description and Methodology
This study focuses on companies from selected European stock exchanges and the US S&P500. The selected European stock exchanges are the German DAX and TecDAX, the British LSE100, the French CAC40, the Spanish IBX35, the Italian MIB40, the Scandinavian NORDIC40 and the Swiss SWI40. After removing duplicates and companies that are not continuously traded throughout 2020, 331 companies remain in the data sample. Similarly, four companies that are not continuously traded throughout 2020 are removed from the S&P500 dataset, totalling a final company count of 501. Information about the industry affiliation is collected from ‘Refinitiv’. For more precise visualization and interpretation of the results, the initial number of different industry sectors has been reduced to 11 industry groups aggregating some sectors. Overarching industry groups were used to aggregate sub-sectors such as Banking Services and Insurances to a single Financials group; similarly, different manufacturing sub-sectors were aggregated to the Industry group. A primary focus of the study is on the Financials, Energy, Tech and Health industry groups. Daily adjusted close price data has been collected from January 1, 2020, to December 31, 2020, from ‘Yahoo Finance’ for 832 companies. For each company, the data represent a time series of daily prices. Missing records that occurred due to the differences in trading days and market holidays have been replaced with the most recent, adjusted close price. In the following, the authors use the resulting adjusted close prices to create and analyse association networks for different periods and infer the presence of relationships between selected companies and industries before and during the COVID-19 pandemic.
Traditionally, networks represent the systems of interconnected elements. A network graph is defined as
To form network graphs for each period and to ensure comparability between the different companies listed on different stock markets with varying currencies, the authors first converted the close price time series to log-returns:

where
To further infer the relationships between different log-returns and declare edges between the corresponding companies and industry sectors, we adopt an association network approach that is based on measuring similarities between nodes (i.e., companies) based on observed sequences of some attribute (e.g., log return) and assigning edges between pairs of nodes for which similarity measures are non-trivial. Thus, for a set of companies V and their time sequences of log returns
One standard, commonly used similarity measure is a Pearson product-moment correlation coefficient (Kolaczyk, 2009). Computing Pearson correlations,
Gaussian Graphical Model is a special case of the partial correlation approach when the partial correlation between log returns of two companies is defined conditional on the log return information at all other companies under consideration. The attributes are also assumed to have a multivariate Gaussian joint distribution. Under this assumption, two companies
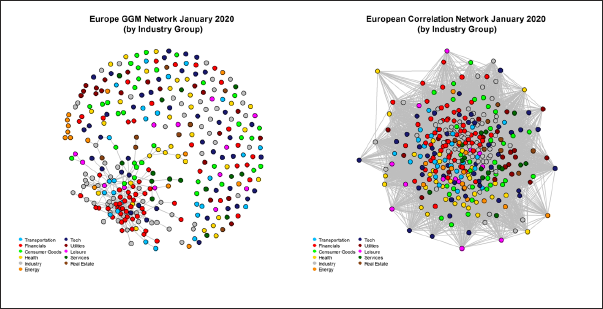
To demonstrate the fundamental difference between a correlation-based network and the advantage of utilizing the GGM principle, we start by constructing a correlation-based network applied to the log returns for selected European stocks, as shown on the lefthand side in Figure 1. The graph is fully connected since the market data are heavily cross-correlated, especially during a global event like a pandemic. By using GGM and factoring out the influence that other companies have on each pairing, only the most significant relationships representing direct relationships remain in the network, as shown on the right in Figure 1. Here, we can interpret what connections between companies and industries mean more meaningfully. For example, based on the GGM network visualization, one can observe a large cluster of directly related companies, primarily from the Financial and Industry sectors. There is also a small set of Health companies closely associated with each other and connected to others in the cluster through several companies from Consumer Goods.
Comparison of a Correlation-Based Approach and a GGM Approach on the European Data Set.
To infer the desired networks using GGM approach, the R package ‘huge’ is utilized (Zhao et al., 2012). The package contains a highly computationally efficient functions that can be applied to non-Gaussian data with some prior data pre-processing (see Zhao et al., 2012) and package manual for more details). The resulting network graphs are then visualized and described using the ‘igraph’ R package (Csardi & Nepusz, 2006) and further analysed using the ERGMs and the statnet R packages: ‘ergm’, ‘sna’ and ‘network’ (Krivitsky et al., 2003–2020).
While network visualization can help understand the connectivity patterns between companies and corresponding industry sectors, relying on the visualization alone can be misleading, especially in highly interconnected regimes. Descriptive network characteristics can offer a piece of additional useful information about the resulting networks.
Assortativity is a measure that can provide further insight into the tendency of vertices with the same property (e.g., the number of immediate connections or degree) to form edges between each other. Assortativity has values from –1 to +1, where positive values, for example, imply a higher likelihood of high-degree nodes connecting with high-degree nodes, and negative values imply that high-degree nodes are more likely to connect to low-degree nodes (Barrenas et al., 2009). The network’s density is a proportion of the observed number of edges to the total number of potential edges. The resulting density measure is a reasonable way to compare different networks or observe changes over time. Lastly, the transitivity, or clustering coefficient measure, is used. The likelihood of nodes clustering together is measured by transitivity. High transitivity indicates that the network has tightly connected communities or groups of nodes. It is calculated by dividing the actual number of transitive triads by the potential number of transitive triads (Snijders, 2012).
Exponential random graph models were first introduced by Wasserman and Pattison (1996) and have since been further developed by Park and Newman (2004), Snijders et al. (2006) and others. They provide a versatile technique to obtain information and draw conclusions regarding the influence of network structural characteristics and node/edge attributes on the determinants of edges within a network (Cranmer et al., 2012). ERGMs behave similarly to logistic regression, where in a typical regression model, a set of observations is selected from a univariate (binary) distribution in which all possible outcome values y are believed to be independent. However, in the context of an ERGM, independence between all potential values is not assumed. A single observation
Formally, consider Y, a random network with Nv nodes. The probability of observing the network y instead of all other possible networks conditional on a realization r of a random vector 
where
Parameter estimates of
Analysis
The applications of the two different analyses, GGM Network and ERGMs, are described next. First, we focus on the United States and European markets separately, summarize the results in steps one and two, and then compare the two regions in step three.
GGM
United States Market
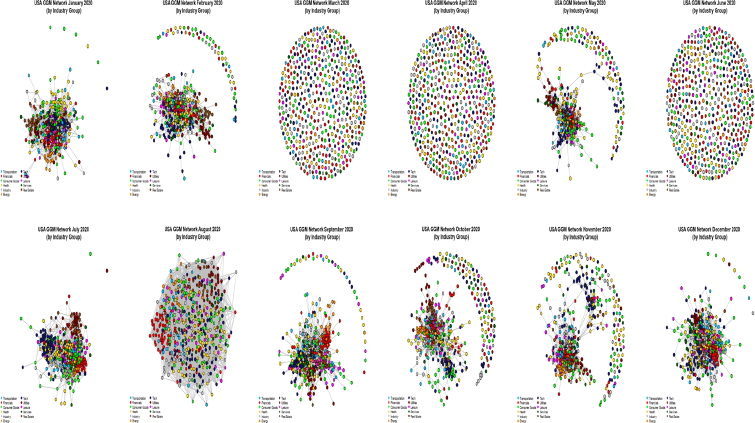
The estimated GGM network for January (see Annex Figure 1) appears to be heavily interconnected. The number of edges in the network graphs for January and February is very similar. An unusual structure is observed for networks estimated based on March, April and June data, where no edge connectivity could be captured, and the inferred networks are disconnected. By accounting for all cross-correlations present in the data, the GGMs only leave connections where interdependency exists. A completely disconnected graph may suggest no interdependencies between analysed companies while accounting for the overall strong influence of the market. Specifically, we observe no connection during the periods of the substantial price drop and rebound in the S&P500. The remaining months of the year appear to be heavily interconnected, with a slight fluctuation of isolated companies. The August model seems to be stronger interconnected than those from other months within the timeframe but has fewer edges than the July model. Only the layout makes the edges overlap more frequently. Smaller company groupings within the same sector are less frequently observed outside the large, interconnected subnetwork. Apart from months where no model could be estimated, industry groupings are visible. Companies that belong to the same industry sectors are close throughout all connected networks. While focusing again on the selected industries, it is visible from Annex Figure 2 that the Financials, Energy and Tech companies form cohesive groups. Health companies are generally more spread out in the network and are more frequently represented by isolated nodes.
Quarterly Regional GGM Network in Comparison to Index and Infection Numbers.
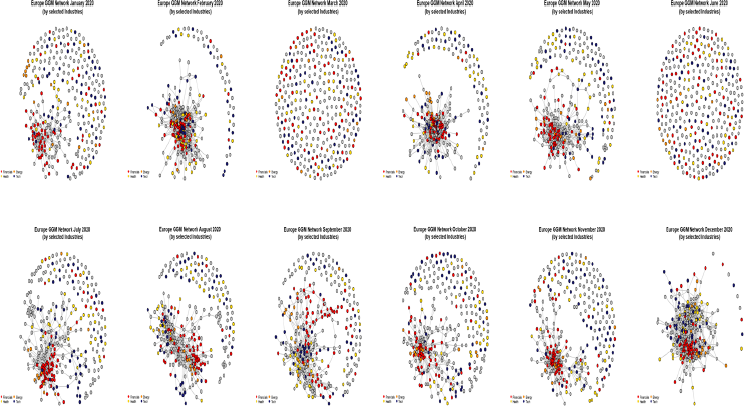
European Market
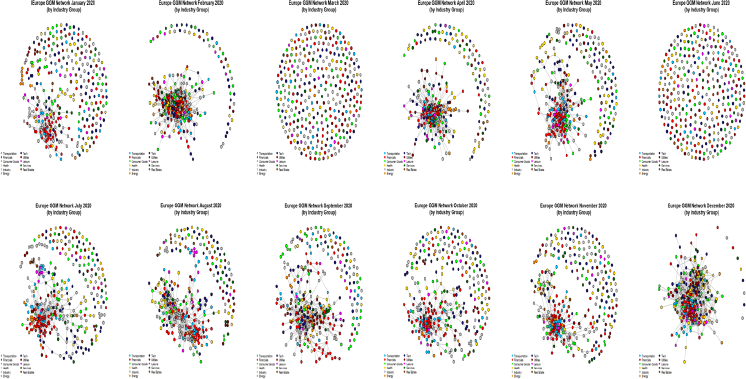
The GGM estimated from January European Market data (Annex Figure 3) is sparser than the following February model. No networks could be inferred for March and June, likely caused by the sharp drop in price on all European stock markets during the two months. Network models for the second half of the year show many connected companies; however, the structure is less dense, which is reflected in a lower number of edges. Compared with the first half of the year, the models do not surpass 1,000 edges until December. Overall, only companies in the financial industry sector appear to consistently form groups (Annex Figure 4).
Quarterly Regional GGM Network with Collapsed Industry Groups.
Comparison
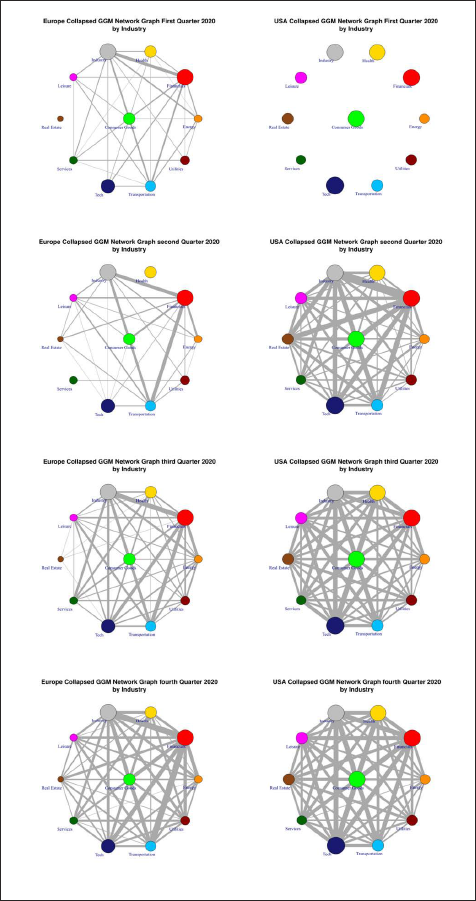
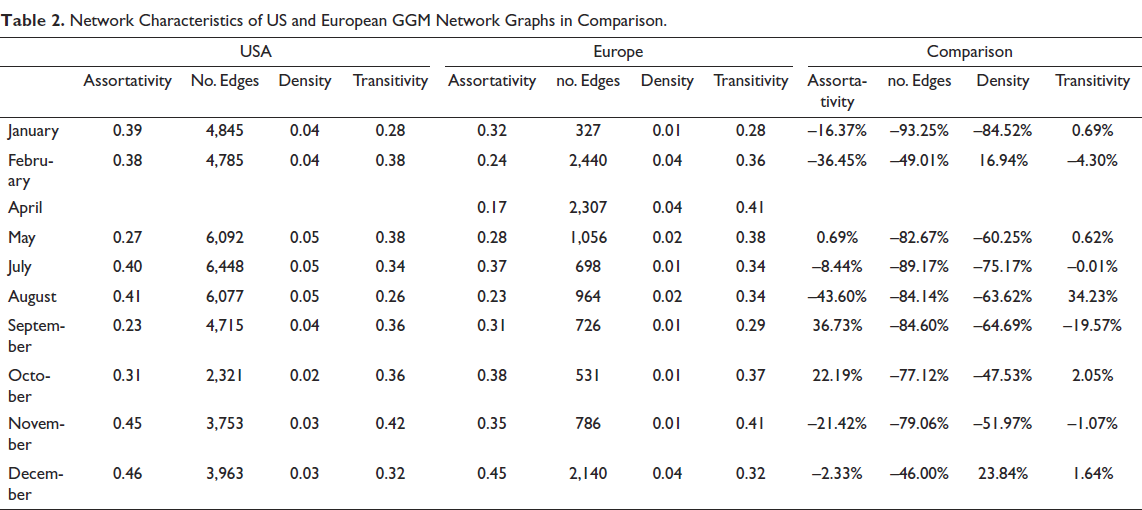
Comparing the GGMs for both regions, we conclude that the US network graphs are more interconnected. The networks visualized in Annex Figures 1–4 and the network characteristics summarized in Table 2 support this conclusion. Months with 0 edges were omitted from Table 2 since no network characteristic can be calculated with a wholly unconnected network. The US network has a steadily higher number of edges after June 2020, while in the European network, the number of edges decreases during the same period. The overall number of isolated companies is consistently higher in the European network. The European network scores lower in all structural network characteristics.
Network Characteristics of US and European GGM Network Graphs in Comparison.
Grouping behaviour within primary industry sectors seems more pronounced in the US network. Only the Financials sector in Europe exhibits similar behaviour. The largest stock-listed companies in the United States appear to be more interconnected than companies in Europe, suggesting that the national borders and country-level regulation, among other things, non-harmonized industrial policies, evidently impact the (re)configuration of the European stock market in the event of the exogenous shock exemplified by the pandemic. However, both markets do not appear to be affected for an extended period, as the network configuration in both regions seems to swiftly converge to structures similar to the pre-COVID month of January 2020.
GGM Network in Regional Comparison
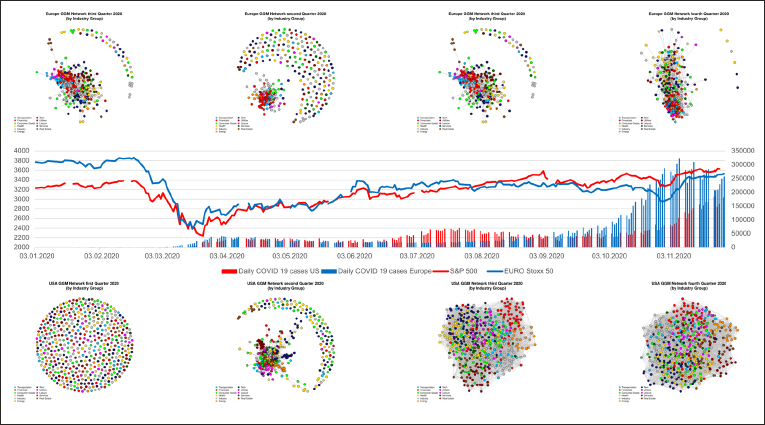
Figure 2 illustrates the regional graphs with a quarterly timeframe that are directly compared and plotted against a timeline of the respective stock market index, marked on the left y-axis and the daily numbers of COVID-19 newly infected cases for the region marked on the right y-axis. The graph is furthermore split into three sections:
The sections on the top and the bottom of the graph feature the quarterly GGM network graphs from the European region (top) and the USA (bottom) In between, a combined line and bar graph is added, whereas the line graphs represent the EURO Stoxx 50 index (blue) and S&P 500 index (red) The bar charts represent the daily new COVID-19 cases for each region (European market in blue, the USA market in red)
The initial market shock in the first quarter of 2020 is visible on the US side. As previously seen in the monthly graphs, a dependency network could not be estimated and left all nodes wholly unconnected in March and April 2020. However, the data for March appear to have a much more significant impact on the entire quarter, as the first quarter, too, shows only wholly unconnected nodes. In contrast, despite also having estimated a network graph without edges in April, the second quarter in the United States does show edges. On the European side, the unconnected graphs in March and June have no such strong impact on the quarterly graphs. The price drop of both indices coincides with the first wave of COVID-19 cases in both regions. Despite ongoing infections, both markets recovered throughout the year, the S&P500 even surpassing its pre-COVID-19 high in September 2020. The EURO Stoxx 50, on the other hand, did not recover to the same extent. A potential reason for this might be how European nations’ governments intervened in the pandemic. Differences in the strategy pursued at respective country-levels could have led to higher uncertainty for companies. As a single nation, the political intervention of the United States appears to have secured the market for the largest corporations in the country effectively. Comparing the timeline for 2020, it becomes evident that the dependency networks include an increasing number of companies and leave fewer outside the network. This development is evident despite higher infection numbers in the United States and both regions in the summer towards the end of 2020.
In what follows, a further step, the company nodes are collapsed into their industry groups to show their overall interconnectedness towards the other industry groups. In the graphs, the number of edges between the industry group is displayed by the thickness of the edge, and the overall size of the node represents the size of the industry group. The trend towards more edges is evident in the European graphs in Figure 3, whereas the US American observation, apart from the first quarter, shows a heavily interconnected network. The results suggest that despite a strongly negative exogenous shock effect on the analysed regional markets, the stock price development of the largest companies in both regions is strongly interconnected outside the initial shock in March 2020.
ERGM
The resulting GGM networks are analysed next utilizing the ERGMs to gain novel insights about intra-industrial and inter-industrial connectivity for selected industry groups and calculate the respective log-odds and odds of the particular industry group forming a link compared with a random network. As ERGMs methodologically can only be applied to the connected networks, several months are omitted for both regions.
United States Market
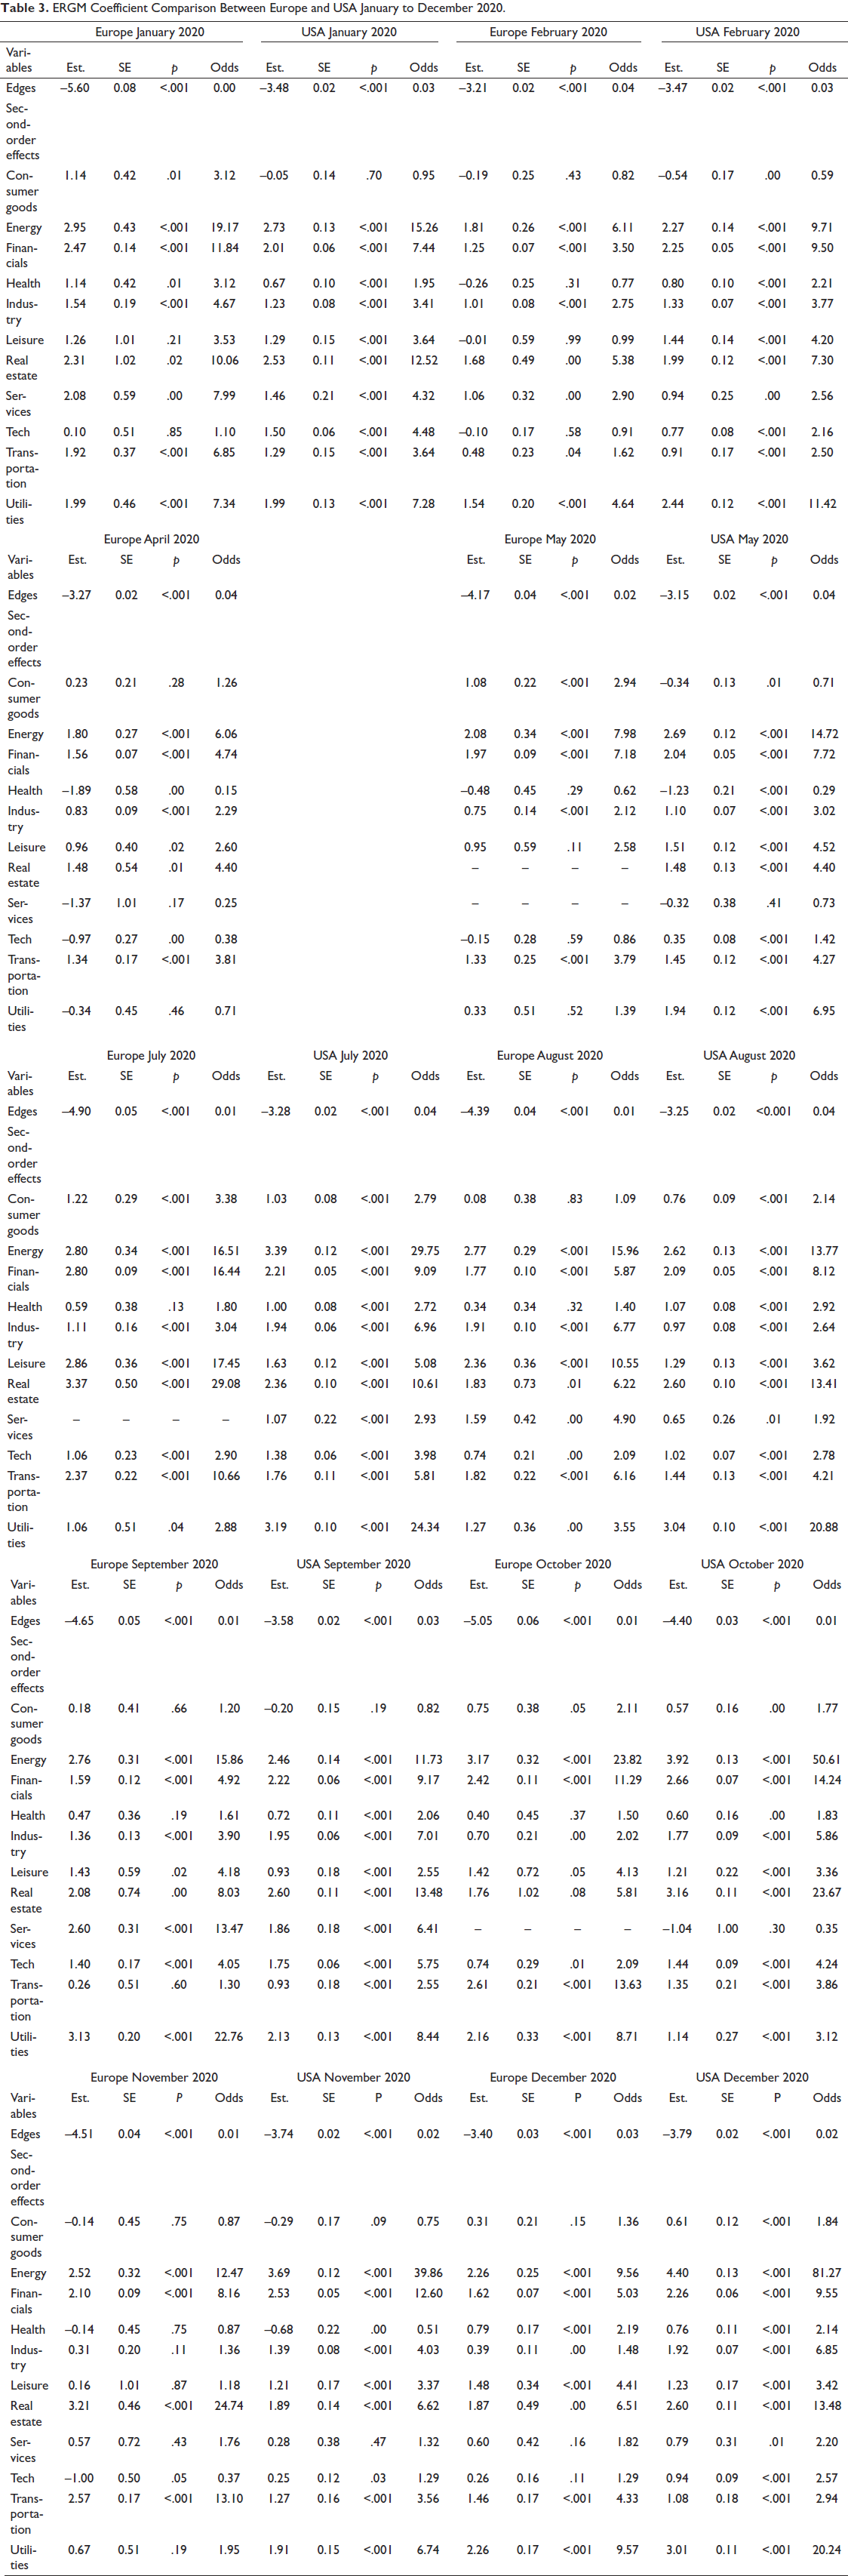
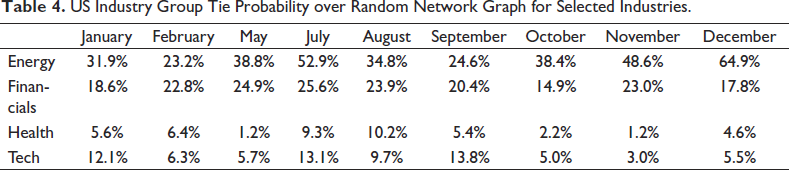
Most node match coefficients the ERGM produces for the US American industry groups are significant to various degrees (Table 3). Many industry group coefficients increase from March to May 2020, except for the Health and Services sector. Calculating the log-odds for the highest and lowest industry group coefficients in May, the results ascertain that an Energy company has a 38.8% higher probability of forming a connection to another Energy company compared with a random graph, while a Health company is only 1.2% more likely to connect to another Health company. Other exceptionally high or low coefficients during 2020 are the Energy group, which has coefficients exceeding 2.4 throughout the year, the Utilities group in July with 3.19, the Services group in October with –1.04 and the Health group in November with –0.68. The results from calculating the log odds for the Energy, Financials, Health and Tech groups for the United States are summarized in Table 4. Over the year, it is evident that the likelihood of a tie between companies in the Energy group increases after the initial exogenous market shock. After a slight probability increase after the initial market recovery, they exhibit stable log odds comparable to January. Firms in the Health industry group are the least likely to form a tie between one another after the initial recovery in May and remain on a low yet comparable level of log odds to January. A decrease in the overall log odds is visible only for the Tech industry group.
ERGM Coefficient Comparison Between Europe and USA January to December 2020.
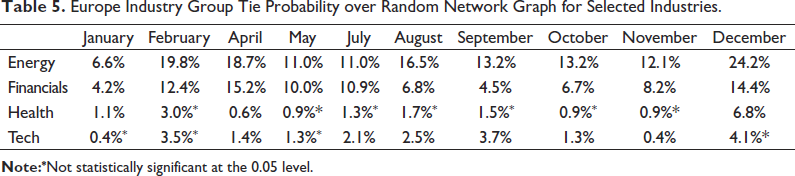
US Industry Group Tie Probability over Random Network Graph for Selected Industries.
European Market
Most coefficients the ERGM produces for the European industry groups (Table 3) are significant to various degrees. In comparison, industry groups do not appear to be moving in a discernible pattern. Especially in the models for April and May 2020, the Health industry group has very low coefficients with –1.89 and –0.48, respectively. Other particularly low coefficients compared with the other industry groups are visible in April for the Services and Tech industry groups. The results from calculating the log odds for the Energy, Financials, Health and Tech groups for Europe are summarized in Table 5. The log-odds for the Health and Tech industry group are particularly low in many months of 2020, making them hard to differentiate from a random network. Furthermore, many months are not statistically significant at a 0.05 level. Both the Energy and Financials industry group see increases in the log-odds compared with January.
Europe Industry Group Tie Probability over Random Network Graph for Selected Industries.
Comparison
Comparing both results, only in 12% of the cases, the probability of an intra-industrial tie is higher in Europe. The development of the coefficients throughout the year appears to be more differentiated in the European observation. Compared with the European market analysis, the probability of US companies forming ties within their industry group is higher. Furthermore, the fluctuation in the respective coefficients appears to follow a similar trend, as is seen in the coefficients for May 2020. The differing result in both regions is likely grounded in the difference in the market structure. Most companies listed on the S&P 500 are headquartered in the United States, whereas companies from the same industry group in Europe can be located in different countries within Europe. Therefore, different jurisdictions with respective legislation and reaction to the pandemic is a likely explanation for this observation.
Conclusion
The performed analyses suggest that the stock market configuration and behaviour in cross-regional comparison appear to be very similar in the United States and Europe in an event of exogenous shock exemplified by the pandemic. However, subtle differences exist. The US market’s GGM network graphs exemplify higher connectivity visualized by far greater clustering behaviour within the analysed industry groups. This behaviour is solely pronounced in the Financials industry on the European side. Examining the market prices, the exogenous shock of the start of the COVID-19 pandemic only lasts for a month before an equally strong recovery takes place on the US market. While showing signs of moderate recovery, the European market does not achieve the pre-pandemic level at the same rate and pace as the US market. The possible reason for the different stock market responses is that the United States as a single nation tends to act more effective in the legislature targeting the economic effects of the pandemic than the 28 (as of March 2020) European countries. The United States appears to have made proper policy decisions in 2020 to address the requirements of the largest companies in the nation. However, this does not necessarily mean that this is the case for the entire economy. Unemployment spiked to almost 15% in April 2020 and has yet to recover to pre-pandemic numbers.
Similarly, the public health reaction appeared weaker during the summer months, with a visible second wave in July 2020. The costs to the economy of unemployment and the death of many thousands of people will probably occur later. While the European countries, on paper, did well in containing the COVID-19 pandemic throughout the summer months, the market did not recover as it did in the United States. Similar issues plague the European nations, and lockdowns, especially, hurt small and medium-sized enterprises (SMEs) throughout the region. Despite the most severe exogenous shock in recent history, the largest enterprises in both regions appear to perform well, if not better, during this time.
The study results, furthermore, underpin some current challenges of an exogenous shock for the European Single Market, that is, the dilemma of playing a balancing act between national interests—especially security and public health issues—and the necessity to harmonize European standards and regulation procedures for all participating member states. This became evident with the abrupt closure of intra-European borders in the beginning phase of the COVID-19 pandemic, followed by the implementation of nationally oriented industrial policies in various EU member states, the exhausting Brexit negotiations and supply chain disruptions at the start of the pandemic and later during the European vaccination campaign.
The study contains the following limitations. Indeed, the COVID-19 pandemic is not the single event of exogenous shock that impacted the stock markets, but also some other major events like, for instance, the US presidential election and Brexit. Therefore, it is impossible only to isolate the analysis for a single event. Furthermore, considering the ongoing character of the COVID-19 pandemics, the extension of observation timespan of the study would reveal additional insights on how exogenous shocks affect the global stock market behaviour. Increasing the number of independent variables beyond the industry sectors could be suggested for future analysis.
Annex
US GGM Network from January to December 2020.
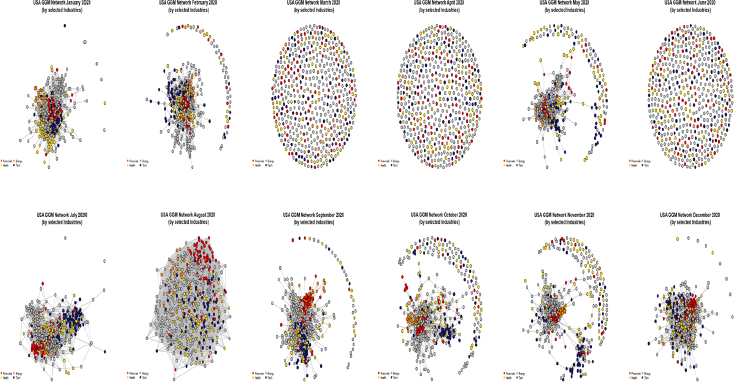
US GGM Network by Selected Industries from January to December 2020.
European GGM Network from January to December 2020.
European GGM Network by Selected Industries from January to December 2020.
Footnotes
Acknowledgements
The authors are grateful to the anonymous referees of the journal for their extremely useful suggestions to improve the quality of the article.
Declaration of Conflicting Interests
The authors declared no potential conflicts of interest with respect to the research, authorship and/or publication of this article.
Funding
The authors received no financial support for the research, authorship and/or publication of this article.