
Abstract
The study is directed to assess the downside stock market risk of the BRICS during COVID-19 and compare it with other economic crises. The study further investigates the association between the stock markets among the BRICS nations. As per the results, the stock markets of India, Brazil, and South Africa suffered the worst crisis during the COVID-19. China has shocked the world by recovering very quickly compared to the rest of the world. Additionally, its been observed that there is an increased association between different markets depending on the severity of the crisis.
Executive Summary
Stock markets serve as a weatherglass for an economy, industries and investors. Therefore, its continuous assessment in terms of risk and returns is pertinent. Markets behave differently in crises. Risk modelling is very important in coping with similar situations in the future. COVID-19 was a unique experience for the world, an assessment of which shall be a valuable addition to the literature. Brazil, Russia, India, China, South Africa, Iran, Egypt, Ethiopia and the United Arab Emirates, now considered one of the most powerful blocs, makes it a pertinent region to study. The study is directed to assess the downside stock market risk of the Brazil, Russia, India, China, South Africa, Iran, Egypt, Ethiopia and the United Arab Emirates (BRICS) during COVID-19 and compare it with other economic crises. The study investigates the association between the stock markets and the BRICS nations. We have considered the stock market indices of Brazil, Russia, India, China and South Africa. Data were also collected from the official websites of the respective stock indices of the countries for the period 1990–2021. Help has also been taken from Yahoo Finance. Then, four periods are identified as high volatility periods namely, the Asian Financial Crisis, the Internet Bubble Bursting, Global Financial Crisis and COVID-19. The downside risk is estimated using Value-at-Risk models. As per the results, the stock markets of India, Brazil and South Africa suffered the worst crisis during COVID-19. China has shocked the world by recovering very quickly compared to the rest of the world. Additionally, it has been observed that there is an increased association between different markets depending on the severity of the crisis. This is the first study focused on the downside potential of the markets, specifically of the BRICS nations. Thus, this will definitely help the BRICS as a whole to rethink their strategies together.
COVID-19 has been unceasingly creating chaos since its outbreak. The health system of even the most developed countries failed to accommodate the patients, and people are also dying due to a lack of treatment. The cost of the suppression strategy undertaken by the governments of different countries is enormous, but is the only option to contain the virus (Ferguson et al., 2020). The pandemic paralyzed both day-to-day and economic activities, leading to a distressed economy across the globe. According to a report by World Bank (2021), in 2020, GDP fell by 5.4% in developed countries, while it fell by 2.6% in emerging and developing countries. It is expected to have a lasting impression on the global economy by destroying a 5.2% contraction in the GDP (World Bank, 2020). As per Torrell et al. (2020), tourism has been hard hit by the pandemic. Dow Jones Travel and Tourism Index declined 32.26%, and the transport industry diminished to 25.82% during this period. The food and beverage industry and telecommunications plummeted by 14.12% and 12.26%, respectively. Ozili and Arun (2020) too established that the economic impact on the hotel industry is observed to be more than 9/11 and the Global Financial Crisis (GFC). They estimated that the tourism, aviation, hotel, and film industries globally had lost 200 billion, $113 billion, $150 billion and $5 billion, respectively. Further, it has also created serious psychological effects (Ho et al., 2020) and geopolitical war between countries (Hartl et al., 2020).
It is well known that stock markets can make you a king, and also bankrupt you. It is also considered a benchmark of the state of the economy and shows the direction of the economy (Pearce, 1983). A rising stock market leads to larger spending, followed by higher economic growth and vice versa. However, it may also hurt the economy due to the vulnerability of market failure (Carp, 2012). It is, therefore very important to keep track of the movement of the stock markets to prevent catastrophe. As Izzeldin et al. (2021) observed, COVID-19 has generated greater variability than other pandemics and even appears more erratic than the GFC. Çütcü and Kılıç (2020) have also found that the markets during COVID-19 have been more volatile than the 1929–1930, October 1987, and December 2008 stock market collapses while analysing ten major countries. Baker et al. (2020) also observed that 18 jumps were there in 22 trading days which is more than any other time in history. Ali and Afzal (2012) studied the impact of the GFC on stock markets in Pakistan and India. They stated that it had a significant unfavourable outcome on stock return but was not so severe. Further, stock indices were significantly less volatile post-GFC than before GFC (Vieito et al., 2016). Ichev and Marinc (2017) explored extensive media coverage related to the Ebola outbreak’s effects on US stocks and established that investors reacted irrationally to the news of the Ebola spread on the event day but then stabilized after one day. Concerning the impact of COVID-19 on stock markets, Ashraf (2020a) observed the proactive negative reaction of the stock markets of 64 countries; however, the reaction varies over time. Yousef (2020) found that both old and new news about COVID-19 impacted the stock market volatility, and bad news affected more than good news in G7 (Canada, France, Germany, Italy, Japan, the United Kingdom and the United States) and the European Union markets. Zhuo and Kumamoto (2020) noticed that stricter containment policies reduce stock returns, while studying 15 countries, including BRICS (Brazil, Russia, India, China, South Africa, Iran, Egypt, Ethiopia and the United Arab Emirates), G7 and four northern European countries. Ashraf and Goodwell (2022) deciphered that strict containment policies negatively impact economic growth in the short run, but have a good recovery in the longer run. Although the stock markets are negatively impacted, they have an indirect positive impact through a decrease in the number of cases due to strict containment policies (Ashraf, 2020b). Bouri et al. (2021) found returns in telecom, consumer staples and food and beverage were highly variable in New Zealand. However, most of the impact was found to be short-lived (He et al., 2020; Kusumahadi & Permana, 2021; Wang & Enilov, 2020), and overreactions are higher for companies with smaller institutional ownership in China (Huo & Qiu, 2020).
Globalization and technology have transformed the world interweaving different layers with each other. News in one market or place or asset class influences other markets or places or asset classes. Therefore, these have brought challenges along with opportunities. Daly (2003) observed high association during the Asian crisis, even between countries that were not directly impacted. Khan and Park (2009) discovered herd behaviour to be responsible for the increased market correlation during the Asian Crisis. Baker et al. (2020) predicted that while the Spanish Flu did not result in daily stock market leaps, COVID-19 is more likely to result in substantial market volatility which may be due to increased information availability and faster dissemination. Similarly, researchers (Akhtaruzzaman et al., 2020; Alqahtani et al., 2021; Yousfi et al., 2021) have confirmed the increased correlation among different markets during COVID-19. The effect of the rise in these linkages is significantly greater for financial firms in China and the G7 countries (Akhtaruzzaman et al., 2020).
BRICS NATIONS AT A GLANCE
The term BRIC was coined byJim O’Neilland established as a formal institution after the first summit in 2009 with four nations (Brazil, Russia, India and China) considered as leading emerging economies and at the same development phase. Later on, South Africa also joined on 24th December 2010. The main purpose of the bloc was to come together and dominate world growth by promoting peace, security, development and cooperation. However, COVID-19 has questioned the cooperation between these countries as they together could not win over the virus. India was the second most infected country in the world (31.3 million infections, 0.419 million deaths), followed by Brazil (19 million infections, 5.47 lakh deaths), and Russia (59.8 lakh infections, 1.49 lakh deaths) as of 23rd July 2021. Although China was the first country to report COVID-19, it had slow infections (92,462) and deaths (4636). As per Nilsen and Holdt (2020, July 24),the southern BRICS countries, home to 50% of the world’s poor, suffered the brunt of both the COVID-19 pandemic and the economic wreckage coming along with it. The researchers questioned the rise of the BRICS as a progressive shift in the world system after observing the way the pandemic was handled by the BRICS nations. However, China seems to have protected its citizens, but the comprehensive control over information makes it difficult to judge the situation on the ground, particularly in the repressed populations of Tibet and Xinjiang. Although the Chinese president, in his speech, considered providing vaccines to BRICS nations, designated its national centre to support the development of BRICS vaccine R&D centre, and the New Development Bank of BRICS countries announced a $1 billion emergency loan to China, India, South Africa and Brazil, and also showed its financial heft to provide $10 billion in crisis-related assistance to BRICS members(Aneja, 2020, May 4). Pham (2020, August 24)regarded BRICS bloc as inefficient in handling the pandemic as all the countries are suffering horrendously except China, who has been blamed for deception and fuelling the spread of the virus. Chari (2021, June, 4)pointed out that assurance by China is just lip service as the Chinese and Russian governments never came forward to share and waive the intellectual property rights of the vaccine to the BRICS members. The world’s second-largest economy ended the year 1.9% bigger after recovering from a 6.8% contraction in the first quarter, compared with a 10.3% contraction for India, −5.8% for Brazil, −4.2% for Russia and −8% for South Africa(Brenan, 2020, November 5). Dash et al. (2020) suggested the BRICS nations must invest more in health infrastructure to recover and contain further crises.
The importance of stock markets for an economy, industries, and investors, its continuous assessment of risk and returns is pertinent. Markets behave differently in crises. Therefore, risk modelling is very important to cope with similar situations in the future. COVID-19 BRICS, which is now considered one of the most powerful blocs, makes it a pertinent region to study. Therefore, the present study is directed to examine the downside risk in the BRICS and the association among themselves during COVID-19 and its comparison to different periods. We found no study focused on the downside potential of the markets, specifically of the BRICS nations. The study will also benefit the users to make investment decisions, and the regulators to undertake effective measures to stabilize the economy, as the stock markets are considered the yardstick of an economy. Further, it shall also provide ideas about diversification benefits within the BRICS.
DATA
We considered the stock market indices of Brazil, Russia, India, China and South Africa. We considered the following indexes IBOVESPA (IBOV), IMOEX, BSE-Sensex (SENSEX), Shanghai Composite Index (SHCOMP) and JALSH. Data were also collected from the official websites of the respective stock indices of the countries for the period 1990–2021. We also consulted Yahoo Finance. Four periods namely, the Asian Financial Crisis (AFC), Internet Bubble Bursting (IBB), GFC and COVID-19, were identified as high volatility periods, and the risk was compared in these periods.
METHODOLOGY
Value-at-Risk (VaR) Models
The VaR model is considered efficient when the study dissects the downside potential or downside risk of a particular system. The largely used method of VaR is the variance-covariance approach, also known as (Parametric VaR) or PVaR, and it is defined as

where, at 99% confidence interval, μ and σ are the mean and standard deviations of the time series, respectively, and Q–1 is the inverse of normal distribution function. However, return series are recurrently observed to comprise high thresholds and horizontal tails. Therefore, we have also computed VaR with Student t-distribution, which works efficiently for such distribution. TVaR is given by

where VaRST stands for TVaR, x explicates the degrees of freedom for student’s T distributions. Similarly, for

where, γi explains the α × α covariance matrix of the risk factor μi and μi denotes α × 1 vector of mean surplus returns over the i – day risk horizon. The study has also used Monte Carlo simulation technique to cross check the estimates as the stock market daily returns are normally found to be non-normal. The VaR using Monte Carlo simulation can be noted as
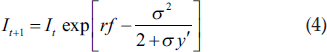
The It is daily return of the indices at time t, rf is the risk-free rate of return, σ signifies the standard deviation of the indices return and
The daily time series consists of volatility clustering, long memory, leptokurtic and leverage effect. The study therefore has also computed the VaR estimates using GARCH. The GARCH VaR model benefits to check the incidence of persistence, volatility clustering, etc. The GARCH VaR model is given as follows:
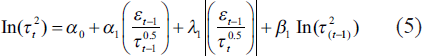
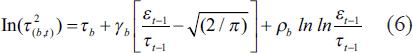
where the stochastic error term is εt as
Expected Shortfall (ES)
The ES calculates the riskiness of a locus by allowing for both size and the likelihood of losses ahead of a confidence level. The sum of all losses rather than the VaR quantile θ, is likely a shortfall accounts for losses which is more than the confidence interim.

Equivalently,

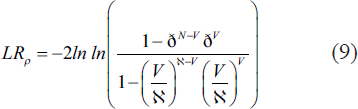
Backtesting
Backtesting of the VaR outcomes is necessary to consider the validity or accuracy of the models. The likelihood ratio (LR) test is used for backtesting the results. It checks the occurrence of loss beyond VaR. Let the number of observations be
RESULTS AND DISCUSSION
Risk in Different Regimes
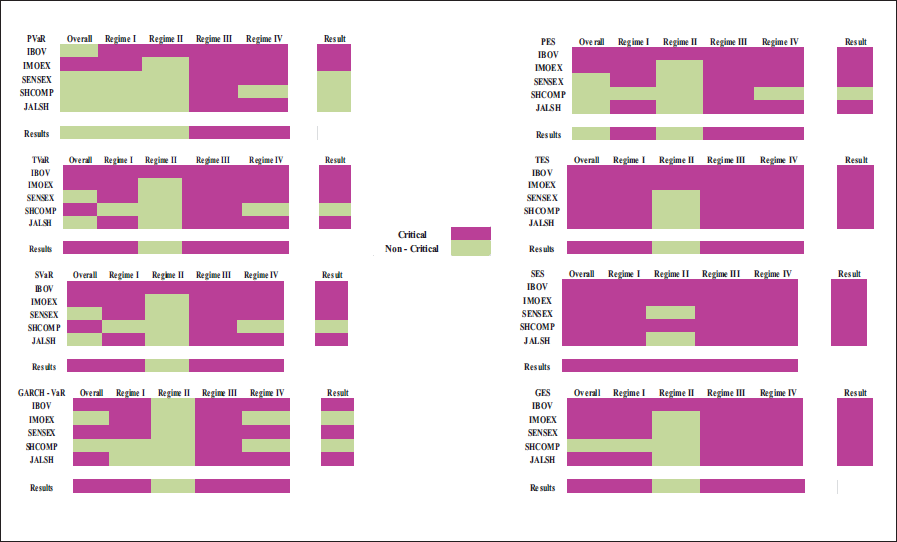
As per the results of Kupiec’s POF test(Table 1), PVaR is not an accurate model for all the countries, and GVaR is also found to be inaccurate for China, Russia and South Africa. However, all the VaR models are accurate except the GVaR in regime I, regime II, regime III and regime IV based on the Kupiec Test (Tables 2–5). The violations are the lowest in the SVaR. Accordingly, it is considered to be the best model.
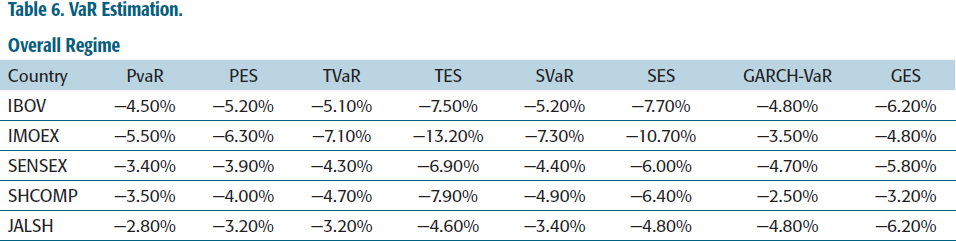
Following the results of VaR models exhibited in Table 6 and Figure 1, the VaR coefficients, Russia has the highest downside risk, followed by Brazil, China, India and South Africa during the whole period. South Africa is found to be the least risky market. The average market risk of the BRICS is approximately 5.04%, whereas India, China and South Africa are observed to be operating below the average. On the other hand, the Russian market is much riskier (more than 7%) compared to the group average. Brazil also outperforms the group average. Similarly, the ES value also confirms that the Russian market is the most concerning market risk.
VaR Graphs for Different Regimes.
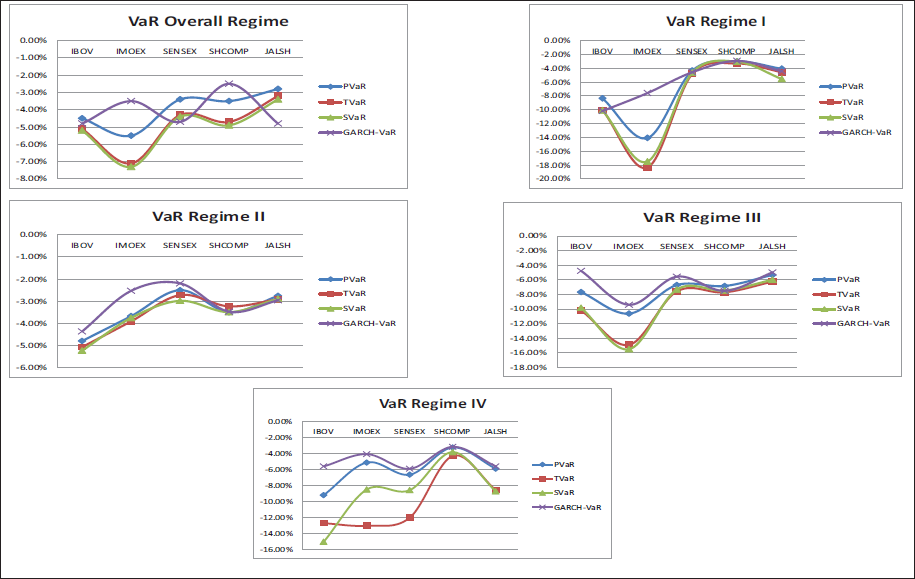
Russia is again found to have the highest risk in regime I, which is higher than the group average of 8.16 followed by Brazil as per the results presented inTable 7. India, China and South African markets are seen to be having lesser risk (3%–6%) than the average, where China is the least risky country in this regime. Further the group average of regime I is higher than the overall regime, which implies that the markets in the BRICS group were riskier than the risk in the overall period.
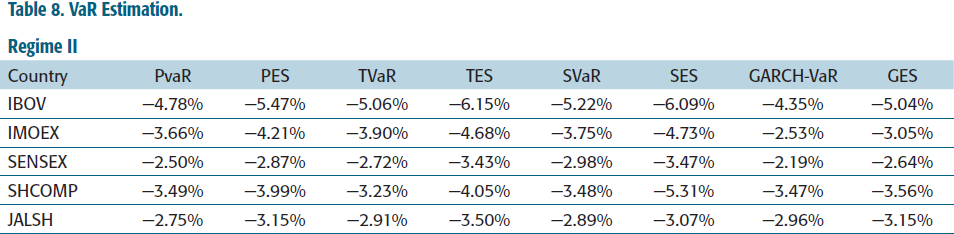
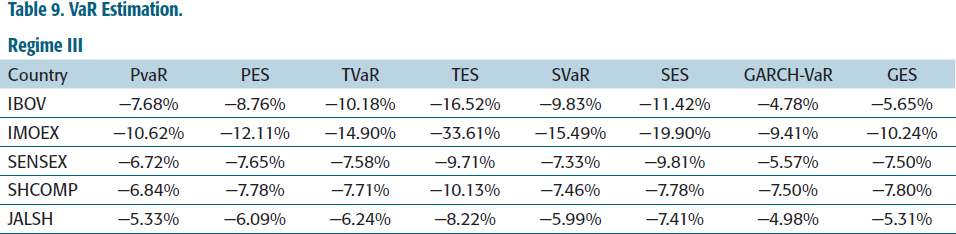
The results of Regime II are exhibited inTable 8. The average risk of the BRICS group in regime II is 3.6 (approx.), which is lower than the overall period. The risk is also lesser compared to the regime I. Brazil is the riskiest market, whereas South Africa is at the bottom. Similar to the Overall period and regime I, the risk in China, India and South Africa is lower than the group average. Russia is in the second position in terms of risk. However, the risk is observed to be substantially lesser than the overall period and regime I. The values of ES are not much higher than the VaR value as observed in the other regimes. Additionally, the outliers are lesser than the VaR values in the other regimes. Russia is the most affected during regime III in terms of market risk, followed by Brazil, China, India and South Africa, as exhibited inTable 9.The group average market risk in this regime is 9.22, which is higher than the overall average in regime I and II. All the countries except Russia were expected to have market risk below the group average. The downside risk is as high as 11.26 on average.
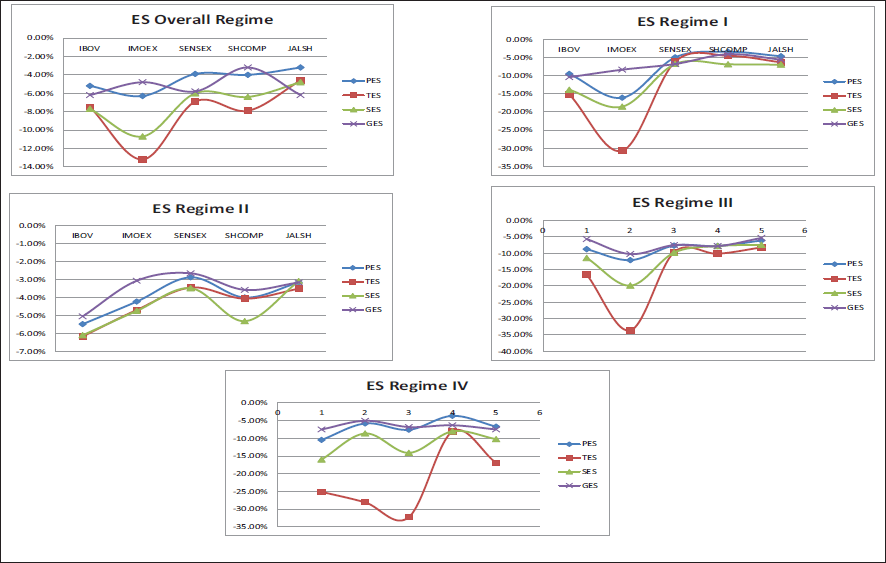
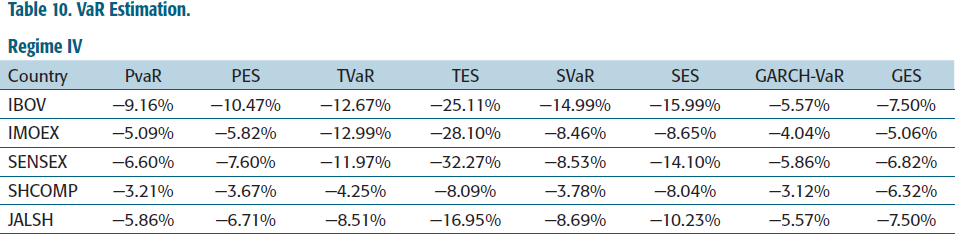
Table 10 exhibits the results of VaR and ES during the COVID-19 period. Figure 2 also shows the results of ES in different regime in graphical form. The average VaR of the group is 8.89 which is less than the VaR during GFC. However, the lower average value is high due to the VaR of China, which is very much lower than other countries. This is quite shocking as COVID-19 first started in China. However, if we observe the ES values of China, it is quite high. This implies that although the risk is lower at a 99% confidence interval, the outlier risk is high. Therefore, the group average of ES during this period is the highest of all time, that is, 11.40%. Brazil, India and South Africa have witnessed the highest risk during COVID-19 compared to the other regimes. This is apparent as the pandemic disrupted day-to-day functioning compared to other economic crises.
ES Graph for different Regimes.
Country Wise Risk
It is evident from the absolute values of VaR and ES (Tables 6–10), and Figure 4 that Brazil has witnessed high downside risk in all the crisis periods. For the period of study, Brazil, on an average was found to be a risky market. It suffered the highest losses during COVID-19, followed by AFC, GFC and IBB.
VaR Models Graphs.
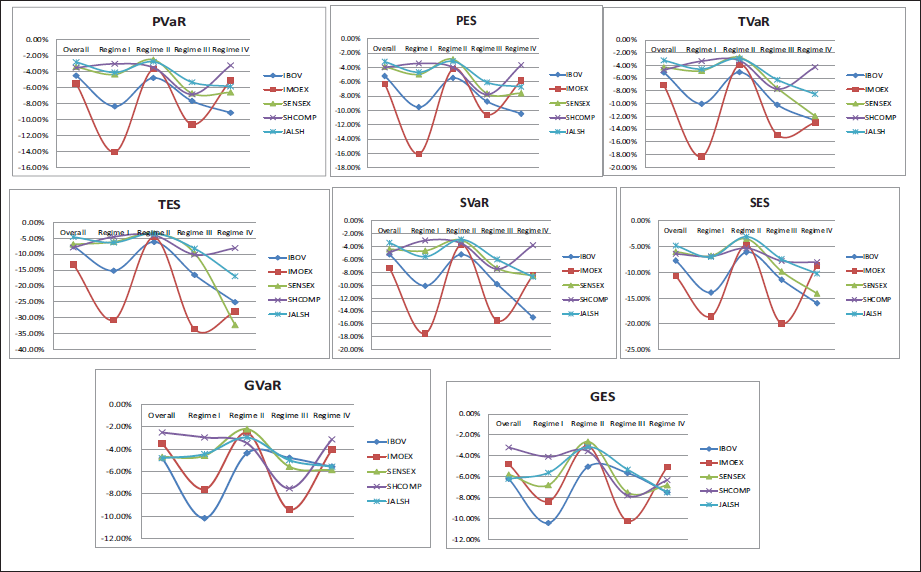
VaR & ES Pattern for Different Regimes.
Russia, too was found to be an all-time risky country as it falls under the critical category. Among the BRICS nations, Russia assumes the highest risk in absolute terms. However, IBB could not affect Russia, and it was found to be a safe zone. The highest loss suffered by Russia was during AFC, followed by GFC, COVID-19 and IBB. The prudent macro-fiscal policies and accumulated buffers might have helped stabilize the crisis.
The Indian market was worst affected during COVID-19, followed by GFC, AFC and IBB. The Indian economy was under continuous lockdowns and shutdowns since March 2020. It impacted the business profits and investor sentiments. Further, the health system also collapsed. India, therefore, witnessed historic volatility. However, although the Indian market is volatile during crises, in the overall scenario, it falls under non-critical regions that is, less risky among the BRICS nations.
The market in China is found to be resilient in all regimes except the GFC. However, the downside risk in the overall period is in the critical region. The order of risk assumed by China is GFC, COVID-19, IBB and AFC. China has been able to recover economically much quicker than others after COVID-19. According to the IMF, China is likely the only country to register positive growth in 2020 and is projected to deliver more than 8% growth in 2021. However, such a shocking recovery has been a topic of discussion all over the globe.
The circumstances of South Africa are similar to India, where the downside risk in the whole period is safe and risky in regime II. Another significant observation is that it is the least risky market among the BRICS nations regarding absolute value. It too, suffered the worst during COVID-19, followed by GFC, AFC and IBB.
Association of Markets during Crises
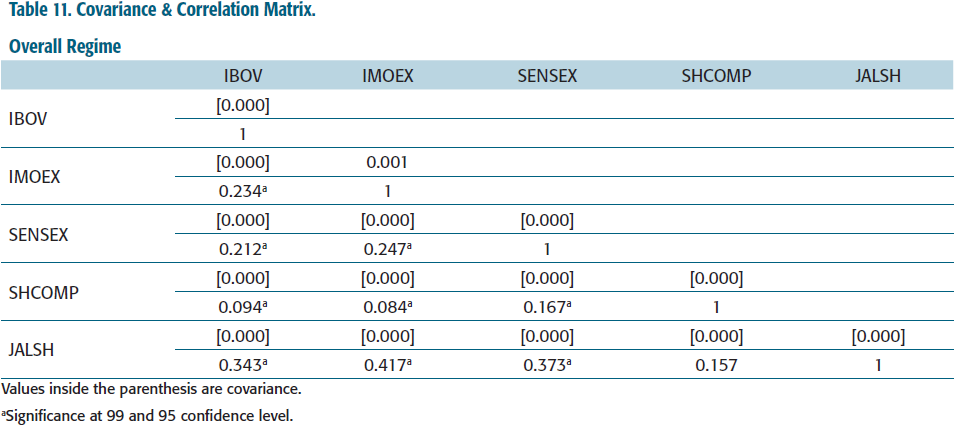
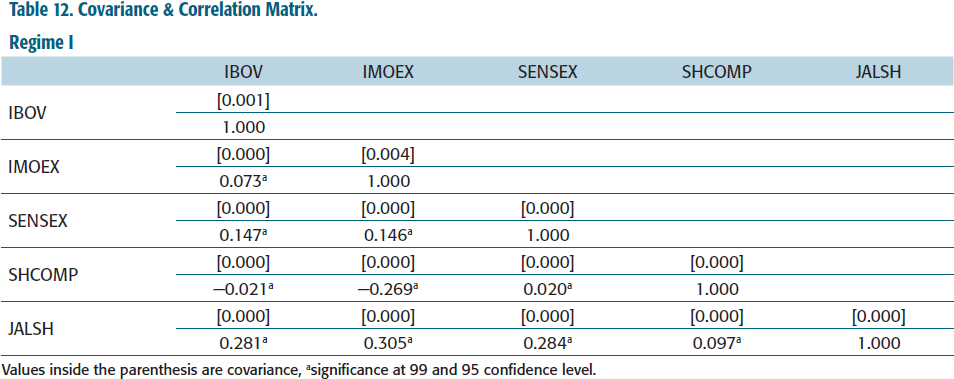
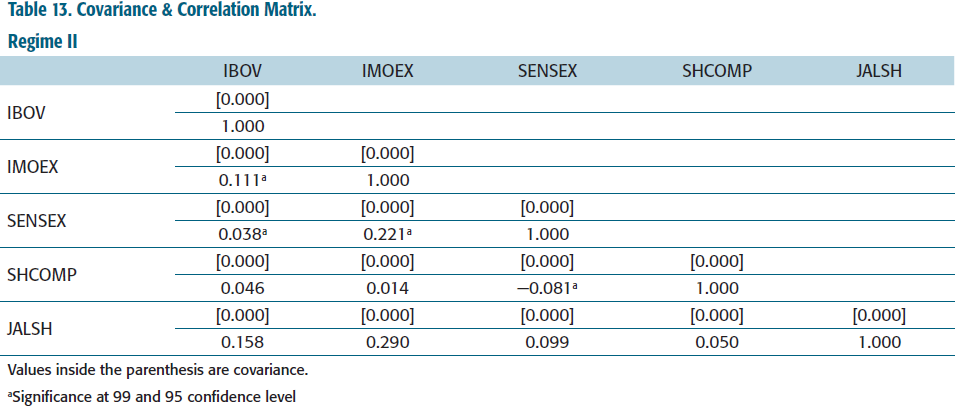
The results of correlation (Table 11) show that in the overall period, all the countries in BRICS are positively correlated with each other except for South Africa and China, where no significant correlation is observed. In the same way, in regime I (Table 12), all the countries had a significant positive correlation, but the coefficients were lower than the overall period. During IBB (Table 13), a significant positive correlation was observed between India, Russia and Brazil. On the other hand, India and China had a significant inverse relationship. When we move to the arena of GFC and COVID-19 (Tables 14 and 15), the correlation coefficients are higher than in the other crisis periods. Even when we compare the GFC and COVID-19, the correlation during COVID-19 is higher than the GFC, except for the association between South Africa and Russia. As a whole, it implies that the greater the crisis, the more the spillover. This usually happens due to the fear of losing the mind and following the flow, which can be related to the theory of herding behaviour and the theory of risk aversion. In other words, the country-wise market risk and the association between the nations of BRICS prove that the investors are risk averse and panic when there is bad news in the market. The impact of such news is faster to transmit to the markets of other countries than it was in normal times. Further, diversification benefits are limited among these nations.
CONCLUSION
The article assessed the stock market downside risk during four crises, that is, AFC, IBB, GFC and COVID-19. The results point out that the stock markets of India, Brazil, and South Africa suffered the worst crisis during the COVID-19 period. Further, Russia and Brazil are the all-time riskier markets, but Russia has managed to cope during COVID-19 better than other BRICS nations except for China. China shocked the world by recovering very quickly compared to other countries. China was the first nation to register the infection of the virus, and the stock market results also confirmed it. Moreover, it remained resilient in all the crises except during the GFC. In the case of the overall period 1998–2021, India and South Africa are the least risky markets in the bloc, which falls in the non-critical zone. Further, the increased association between different markets is observed depending on the severity of the crisis. As the association between these countries is positive, diversification will not be beneficial. Thus, the findings clearly indicate the risk to the stock markets of all the countries in the BRICS and the association.
The study observed that in a pandemic, when markets are highly associated and driven by technology, they can be highly volatile and lead to substantial losses. But it differs from trade-related crises, where stock markets are equally affected by country-specific factors and international trade. However, a pandemic-led crisis mostly depends on the disease’s severity in one’s nation. Therefore, well-laid monetary and fiscal policies during the crisis can help in stabilizing the markets to a greater extent, which can be referred from Russia’s stance on the pandemic situation. On the other hand, as the information transmission is more during a crisis, investors must also consider the statistics in other BRICS nations to make an investment decision. Regulators may also focus more on educating investors on making rational investment decisions, which will help prevent herding during crises. Concerning investment decisions or portfolio management, risk diversification will not be efficient between the BRICS nations. Still, they can wisely choose the best market to invest in based on the risk-bearing capacity.
The scope of the present study is limited to downside risk. However, as per theory, higher risk also provides higher returns. Although Russian markets are riskier than the other BRICS nations, they may also offer higher returns. Further, other factors affect the stock market behaviour. Country-specific risks are one of them. Again, even though risk diversification does not seem possible within the bloc regularly, short-term strategies could be possible. The assessment of the aspects discussed above is not taken into consideration in the present work, which can be explored in the future.
ANNEXURE
VaR Estimation Overall Regime.
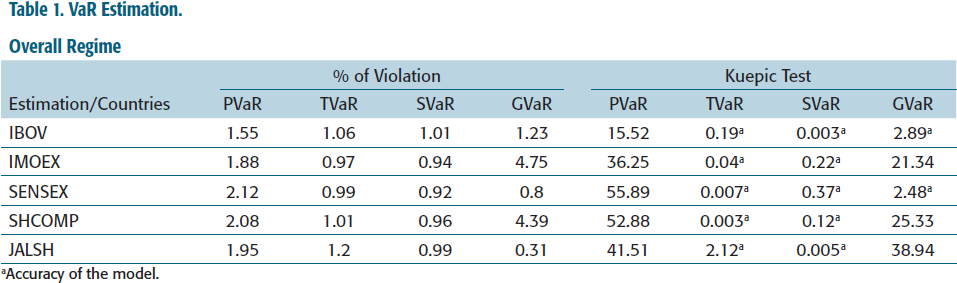
aAccuracy of the model.
Violation & Kuepic Test Estimation Regime I.
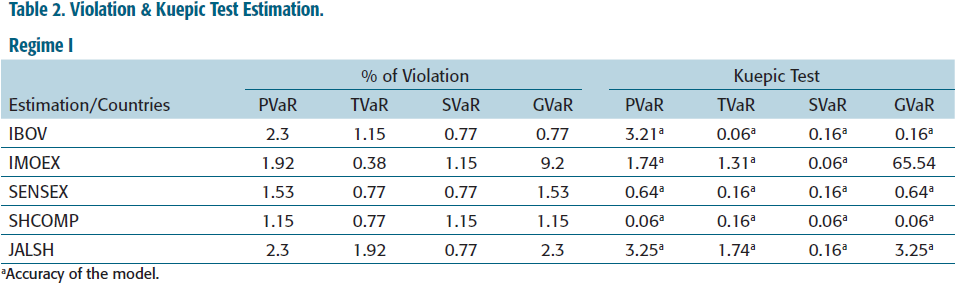
aAccuracy of the model.
Violation & Kuepic Test Estimation Regime II.
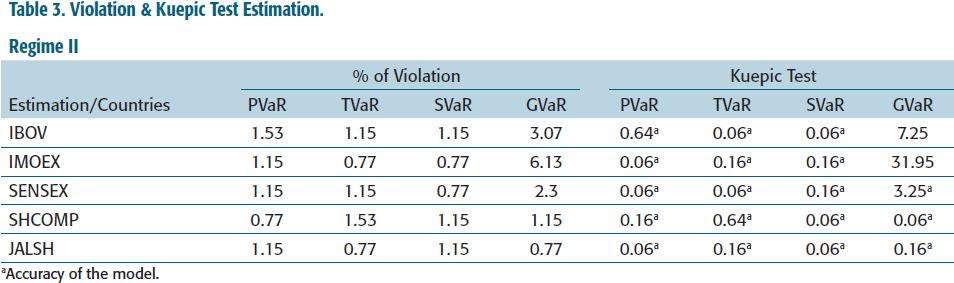
aAccuracy of the model.
Violation & Kuepic Test Estimation Regime III.
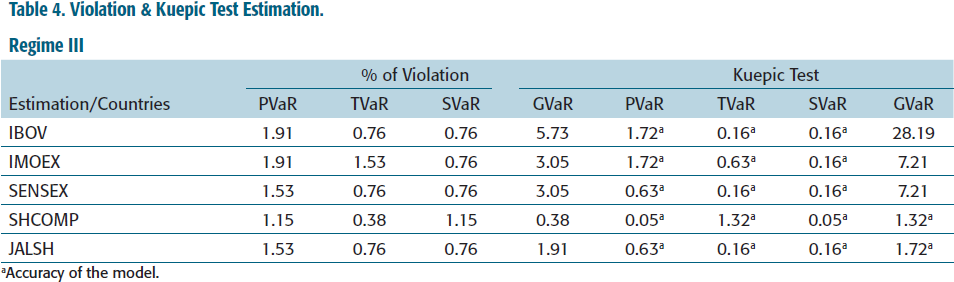
aAccuracy of the model.
Violation & Kuepic Test Estimation Regime IV.
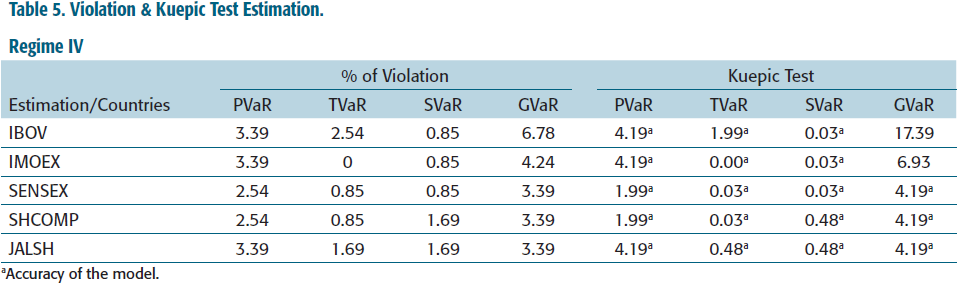
aAccuracy of the model.
VaR Estimation Overall Regime.
VaR Estimation Regime I.

VaR Estimation Regime II.
VaR Estimation Regime III.
VaR Estimation Regime IV.
Covariance & Correlation Matrix Overall Regime.
Values inside the parenthesis are covariance.
aSignificance at 99 and 95 confidence level.
Covariance & Correlation Matrix Regime I.
Values inside the parenthesis are covariance, asignificance at 99 and 95 confidence level.
Covariance & Correlation Matrix Regime II.
Values inside the parenthesis are covariance.
aSignificance at 99 and 95 confidence level
Covariance & Correlation Matrix Regime III.
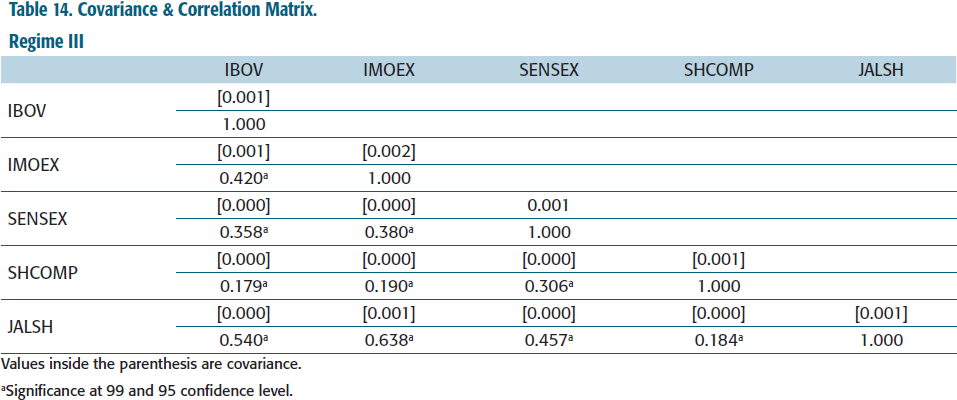
Values inside the parenthesis are covariance.
aSignificance at 99 and 95 confidence level.
Covariance & Correlation Matrix Regime IV.
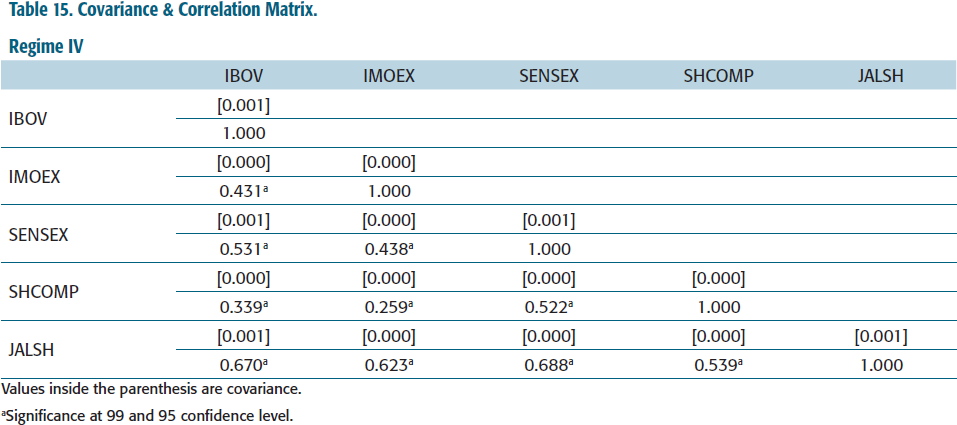
Values inside the parenthesis are covariance.
aSignificance at 99 and 95 confidence level.
Footnotes
DECLARATION OF CONFLICTING INTERESTS
The authors declared no potential conflicts of interest with respect to the research, authorship and/or publication of this article.
FUNDING
The authors received no financial support for the research, authorship and/or publication of this article.
e-mail:
e-mail: