
Abstract
The purpose of this article is to show that internationalization can be studied and described as different dynamic patterns in relation to the international evolution of firms by following a process approach. The article adopts a process approach jointly with a configuration-oriented perspective, to evaluate the strategy as a group of decisions instead of isolated and unrelated variables. Besides, a dynamic approach is incorporated in this study. For achieving the objective, we have studied the changes occurring in some of the variables involved in the internationalization process along a 4-year period (2002–2006). By means of a cluster analysis of the dynamic variables, seven different groups were identified and their external validity studied. The results obtained allow us to pose that the internationalization process cannot be generalized. A complex index and the consideration of evolution over time is a must. Besides, these patterns have been associated to different international status or profiles and to demographic variables, and show the existence of certain relationships between the internationalization status at a certain moment (static perspective) and its latter evolution (dynamic perspective). One of the key implications is the importance of understanding the internationalization process as a complex and interrelated decision. The fingerprints in such process should not be considered as isolated facts but as a part of a greater position. Despite the use of a similar methodology in other studies, this article is original in the introduction of the time (speed) approach to the configurational analysis of the internationalization process.
Introduction
The complexity of the internationalization process is without doubt a key element for its study (Aggarwal et al., 2011; Cerrato et al., 2016). International behaviour encompasses a wide range of decisions and events, which affect both the organization’s externally visible aspects and its internal profile (Nassimbeni et al., 2018; Welch & Luostarinen, 1988; Zahra & George, 2002). Thus, there is no single internationalization process (Spence & Crick, 2006), and therefore, the need of introducing aggregate indexes in its study is crucial (Cerrato et al., 2016), as in order to understand the internationalization process, we need to look at the firm as a whole rather than each of the different decisions separately (Cerrato & Depperu, 2011). However, the temporal aspect of the process has been omitted, until recently, in most of the existing studies that have dealt with the internationalization process from a configurational perspective (Cerrato et al., 2016; Ciravegna et al., 2018), albeit the importance of such approach is necessary (Casillas et al, 2012).
According to the authors from the sequential approach (Bilkey & Tesar, 1977; Johanson & Vahlne, 1977; Welsh & Luostarinen, 1988), internationalization can be described as an iterative and continuous process between the commitment of resources for foreign markets and the knowledge acquired about those markets (Andersen, 1993), considering a temporal order between each stage. These ideas have served as a basis for recent development about internationalization speed (Casillas & Acedo, 2013).
Casillas et al. (2012) suggested the possibility of describing the internationalization evolution by means of fingerprint patterns (Jones & Coviello, 2005) by considering aspects relating to (a) the degree of commitment; (b) the degree of resource commitment; and (c) localization. Jones and Coviello (2005) propose not only the existence of these state situations but also the existence of dynamic profiles, which are defined by the joint evolution of these dimensions over time, also identified as international dynamic configurations (Asmussen et al., 2009).
Most of these studies depart from the configurational theory of strategy (Meyer et al., 1993; Sort et al., 2008). According to this theory, a firm’s strategy is a combination of multiple dimensions (Nassimbeni et al., 2018) rather than a function of a single dimension. Uncovering strategic taxonomies or configurations is a research area that deserves further investigation in international management (Cerrato et al., 2016; Ciravegna et al., 2018). Among the possible development avenues in this research line and taking into account the recent process- and speed-related research (Casillas & Acedo, 2013), the inclusion of a dynamic approach into the study of archetypes or configurations seems adequate.
Review of Literature
There is no such thing as the internationalization process (Viisak, 2010). Indeed, some firms exist, in which periods of internationalization are intertwined with periods of de-internationalization. Likewise, as mentioned earlier, the stage-based models proposed by the sequential method (Bilkey & Tesar, 1977; Johanson & Wiedersheim-Paul, 1975) should be considered in a flexible way without any set trajectory being established along which companies have to move during their internationalization period (Vissak, 2010).
This question calls for two reflections—the first is conceptual in character and the second methodological. From the conceptual point of view, the existence of different processes with regard to international behaviour does not imply them as a nonexistence of companies that develop through a process of growing international involvement, in the same way that the existence of companies with a competitive profile at home does not invalidate the existence of multinational companies (MNCs). What is, indeed, important to bear in mind is that differentiation needs to be made between the different patterns of international development. Not all firms that develop active international behaviour over a specific period of time can be considered to be companies that have followed the same internationalization process. If we are to be coherent with the concept of internationalization defined by Welch and Luostarinen (1988), we should only speak about an ‘internationalization process’ when referring to those companies that reveal increased international involvement over time. From the methodological point of view, empirical research on a firm’s internationalization process should be consistent with the aforementioned comments, that is, the samples of companies to be researched should only take into consideration those companies that have increased their level of internationalization. Companies that are internationally active but do not increase the level of their international involvement represent a different sample, which may be useful to identify discriminating and/or moderating differences and variables but may not be able to explain how the internationalization process develops.
At the same time, international behaviour encompasses a wide range of decisions and events, which affect both the organization’s externally visible aspects and its internal profile. Welch and Luostarinen (1988) identified some of these aspects when they spoke of (a) the operation method (how), (b) the sale objects (what), (c) target markets (where), (d) organizational capacity, (e) personnel, (f) organizational structure and (g) finance. For their part, Zahra and George (2002) differentiate between three types of international behaviour: (a) extent; (b) width or scope; and (c) speed. Given that speed is the object of this present exercise, we have summarized the first two dimensions (extent and width) as follows:
Extent (or degree) refers to the degree of the firm’s commitment to its foreign expansion process. It is therefore possible to differentiate two visions in such a commitment. The first refers to the commitment derived from foreign sales (Zahra & George, 2002). In this sense, numerous papers have focused on analysing exporting intensity, taken to be the quotient between the firm’s exports and total sales turnover (Bonaccorsi, 1992; Calof, 1994). Sullivan (1994) incorporates this variable as one of the indicators to be used to measure the degree of a firm’s internationalization. Other studies have taken a more global vision of this commitment by considering the proportion of foreign sales (the sum of both its exports and sales by foreign subsidiaries) with regard to the multinational company’s total sales turnover (Sullivan, 1994).
However, the second dimension of commitment is based on the resources made available to the internationalization process. In this regard, companies which have production plants, subsidiaries, etc., make available a larger proportion of their resources outside their national borders, thereby demonstrating greater involvement with the internationalization process. This second approach is based on the greater risk involved in dedicating a larger amount of resources and assets overseas. From this point of view, entry modes constitute an indicator of the degree of the firm’s international commitment, from which several levels of commitment can be established and which range between simple exportation to wholly owned production subsidiaries, passing through all kinds of cooperation agreements (joint ventures, subsidiary outlets, etc). Sullivan (1994) includes various indicators related to this dimension, such as the number of foreign subsidiaries, the proportion of foreign assets, the proportion of employees at foreign subsidiaries, the percentage of added value generated by foreign subsidiaries, etc.
Width is defined as the range of markets on which the company develops its business (Zahra & George, 2002). This second dimension refers to the markets and/or countries where the company sells or manufactures its products and services (Welch & Luostarinen, 1988). In this sense, the firm’s internationalization can be measured by the number of countries to which it exports its products, the number of countries where it holds subsidiaries, the diversification of foreign markets, the physical and cultural distance between the countries where it is active, etc. The classic sequential method presupposes that firms commence their internationalization process in a small number of countries physically and culturally close to their own, and as their internationalization process advances, they progressively enter into a greater number of countries at an increasing distance from their own (Andersen, 1993; Johanson & Vahlne, 1977, 1990; Johanson & Wiedershein-Paul, 1975). Therefore, the number, distance and variety of countries represent indicators of the firm’s degree of internationalization.
The third dimension in internationalization is speed (Zahra & George, 2002). However, speed is a conceptually different dimension from the previous ones, in that its main characteristic is the explicit incorporation of time. Therefore, speed can be taken to be the rate of change within the two former dimensions—extent and width—over a specific period of time (Casillas & Acedo, 2013).
On the basis of the previous dimensions, it is possible to identify three types of speed in the internationalization process. The first two would be related to the extent of internationalization, while the third refers to the width of internationalization. These three types of speed are (a) the speed of the firm’s international commercial intensity, that is, the growth of the proportion of company sales that come from countries different than its home country over a specific period of time (e.g., the increase of export intensity); (b) the speed of its international commitment of resources, that is, the increase in resources committed by the company beyond its national borders over a specific period of time (e.g., increase in the proportion of company assets held abroad or the increase in the proportion of workers that the company employs in its foreign enterprises); and (c) the speed of the width of its international markets, that is, the increase in the amount, variety and distance of the countries where the company develops its business activities over a specific period of time (e.g., the number of new host countries, the increase in geographical diversification, etc.).
In short, internationalization process speed constitutes a dynamic construct (measured as the change of status over a period of time, that is, between two different moments of time) and comprises three different dimensions related to increases in foreign sales, entry modes and international markets within two different moments of time.
Most research has omitted the joint effect of the different variables (Sullivan, 1994) or the dynamic aspect of the configurations analysed (Cerrato et al., 2016; Knudsen & Servais, 2007; Raymond et al., 2013), leaving a gap in the literature that has only been covered partially (Casillas et al., 2012).
Objectives
The aim of the this article is to identify and describe different dynamic patterns in relation to the international evolution of firms by following a process approach (Van de Ven & Huber, 1990; Van de Ven & Poole, 1995).
The premise of this article is that firms evolve internationally, following different paths, and it is, therefore, necessary to identify differentiated evolutionary patterns, as the different international variables change over time. The identification of such patterns may be associated to the different types of firms operating internationally, but this has not been tested yet. The configurational approach will allow us to infer complex evolutionary process from a dynamic perspective.
Methodology
Sample
The source of the empirical work is the Survey of Business Strategies (SBS). 1 This is a firm-level panel of data compiled by the Spanish Ministry of Science. The sample integrates a representative sample of Spanish manufacturing firms with more than 10 employees; it is probabilistic and stratified by industry and firm size (in terms of the number of employees). Relevant information about international activities of firms was accessible in two different years: 2002 and 2006. The reason for the period selection is that the economy in Spain had not yet entered into the financial crisis and therefore the economic situation was stable. For that reason, the initial sample of firms was formed up by those firms that answered the survey in 2002 and 2006 with a total of 1,137 firms.
From that sample, we selected those firms that presented an active international behaviour in any of the studied years (2002–2006), dropping all those firms that did not export, or had foreign direct investments (FDIs), or presented lack of any international activity neither in 2002 nor in 2006. As a result, 829 firms presented an active international behaviour in the considered period. Next, extreme cases were studied, in order to avoid possible biases in the classification procedure. For that aim, we used the k-means analysis (with as many clusters as variables), dropping all those firms that conformed a cluster on their own. This process was iteratively repeated until all the clusters contained at least two firms. This procedure was repeated for clusters of two and three firms. The idea of this process is to be repeated until an important change in the structure of the clusters occurs. This happened when all the clusters conformed by three firms were depurated. Up to 64 firms were dropped from the analysis, leaving clusters with at least 6 firms. After this process, the discriminant capability of the variables used for the analysis was significant in all cases. Thus, the final sample analysed was formed up by 765 firms. The sample represents the distribution of the manufacturing firms in Spain, with an average of 301 employees and 33.7 years since their foundation. Out of the whole sample, 701 firms (91.6%) exported in 2002 and 141 (18.4%) had subsidiaries abroad (ranging from 2 to 20). In 2006, the number of exporting firms rose to 712 (91.3%) with also an increase in those with subsidiaries up to 163 (21.3%).
Variables
For identifying the dynamic patterns, we have used variables that reflected different ways of international evolution. These variables were based in the measurement of the international situation of the firms in two different moments in time: 2002 and 2006. The static variables related to the international activity in those moments were:
Export activity (EXPORTi): binary variable with value 0 if the firm does not export, and 1 if it exports, in the year i. Export intensity (EXPINTi): quotient between the export sales and the total sales in year i. Export volume (EXPORTVOLi): Export sales in year i. Foreign direct investment (SUBSi): binary variable with value 0 if the firm does not have any foreign investment, and 1 otherwise, in the year i. Number of FDIs (NSUBSi): number of foreign investments of the firm in year 1. Initial mode of entry to foreign markets (MODOEXPi): This variable reflected in five intervals, from a lower to a greater commitment, the way of entering into foreign markets. The levels are (a) use of an agent; (b) access to foreign markets by means of cooperation; (c) use of its own distribution channel; and (d) access by means of FDI. Physic distance of the exports (PHYSDISEXPi): The percentual distribution of the exports was analysed in four geographical zones (European Union—EU, Latin America, OECD and rest of the world). As our sample was composed of Spanish firms, the geographical distance was measured as the percentage of the export related to the closest zone (EU); it is therefore the inverse of the proximity. Cultural distance of the exports (CULTDISEXPi): This variable was measured as the percentage of the export related to the closest cultural zone (Latin America). Again, we used the inverse of the proximity. Physic distance of the FDI (PHYSDISSUBSi): Similarly, the number of FDIs in each of the four geographic areas was counted. Again, we observed the number to the FDIs in the EU as the closest zone. Cultural distance of the FDI (CULTDISSUBSi): As it was done with the export variable, we observed the closest cultural zone among the four available, using the inverse to proximity. Dispersion of the foreign markets (INDDISPEXPi): This variable was calculated using an index previously proposed in the literature (Denis & Depelteau, 1985). Such index is the sum of the percentages of the exports to each zone considered multiplied by its logarithm. Zero is the value for the greatest concentration, while negative values imply dispersion.
For measuring the variables of the international evolution, we took as a starting point the aforementioned static variables. As each of them was referred to a certain moment in time, 2002 and 2006, we observed that the variations occurred in each variable between the two moments. These dynamic variables are those that we will use in the identification of the internationalization patterns over time. These variables were:
Evolution of the export intensity (EXPINTINC): Measured as the variation in percentage of the export intensity between 2002 and 2006, being the export intensity as the quotient between export sales and total sales. This evolution has only been calculated for those firms with exports in both years. Evolution of the export volume (EXPVINC): This variable reflects the percentage of variation of the export volume between 2002 and 2006. As in the former variable, this variable has only been calculated for firms with exports in both years. Evolution of the export behaviour: this change has been measured with a dummy variable and tries to show the evolution of the firm regarding the export behaviour. Such variables can be classified in four dummy variables: (a) STARTEXP = 1, the firm did not export in 2002 and exported in 2006, beginning its international activity between 2002 and 2006; 0 = otherwise; (b) NOEXP = 1: the firm did not export in 2002 neither it did in 2006; 0 = otherwise; (c) LEAVEEXP = 1: the firm exported in 2002 but did not export anymore in 2006 (the firm quit the international activity between 2002 and 2006); 0 = otherwise; and (d) KEEPEXP= 1: the firm exported in 2002 and kept on in 2006; 0 = otherwise. Evolution, in percentage, of the number of subsidiaries (INCNSUBSPOR): Measured as the variation in percentage of the number of subsidiaries. This was only calculated for firms with FDIs in both years (2002 and 2006). Evolution of the number of subsidiaries (INCSUBSNUM): This is the difference in the number of FDIs in both years and was calculated for firms with FDIs in 2002 and 2006. Evolution of the FDI behaviour: Similarly to the evolution of the export behaviour variable, four Dummy variables were created to express the variation in the situation regarding FDIs of the firm: (a) STARTSUBS = 1: the firm had no FDIs in 2002 but had in 2006; 0 = otherwise; (b) NOSUBS = 1: the firm had no FDIs neither in 2002 nor in 2006; 0 = otherwise; (c) LEAVESUBS = 1: the firm had FDIs in 2002 but did not in 2006; 0 = otherwise; and (d) KEEPSUBS = 1: the firm had FDIs both in 2002 and in 2006; 0 = otherwise. Variation in the mode of entry to foreign markets (INCMODOEXP): Measured as the difference in the commitment in the entry mode to foreign markets in 2002 and 2006 (MODOEXP2006 − MODOEXP2002). Variation in the physic distance of the exports (INCDISTFEXP): Measured as the difference in physic distance of the foreign markets, where the firm is in 2002 and 2006 (DISTFEXP2006 − DISTFEXP2002). Variation in the cultural distance of the exports (INCDISTCEXP): Measured as the difference in cultural distance of the foreign markets where the firm is in 2002 and 2006 (DISTCEXP2006 − DISTCEXP2002). Variation in the physic distance of the FDIs (INCDISTFSUBS): Measured as the difference in physic distance of the location of the FDIs in 2002 and 2006 (DISTFSUBS2006 − DISTFSUBS2002). Variation in the cultural distance of the FDIs (INCDISTCSUBS): Measured as the difference in cultural distance of the location of the FDIs in 2002 and 2006 (DISTCSUBS2006 − DISTCSUBS2002). Variation in the Geographic dispersion of the exports (INCINDDISP): Measured as the difference of the variables regarding the geographical dispersion of the markets in which the firm participates in 2002 and 2006 (INDDISPEXP2006 − INDDISPEXP2002). Jointly with the variables that reflect the evolution over time, we selected a number of static variables that could help in identifying the firm’s profile, regarding its basic demographic characteristics. For this aim, we have considered: Initial size (SIZE): Measured as the log of the number of employees of the firm in 2002. Initial age (AGE): Measured as the log of the years since the firm was founded log (2002-foundation year) Use of its capacity (CAPACITY): Percentage of the total capacity used by the firm in 2002. Standardization of the products or services (STANDi): Measured with a binary variable. Industry (INDUSTRY): Categorical variable that reflects the industry in which the firm is located represented with a two-digit level of the national classification of economic activities (CNAE).
Descriptive and Correlations
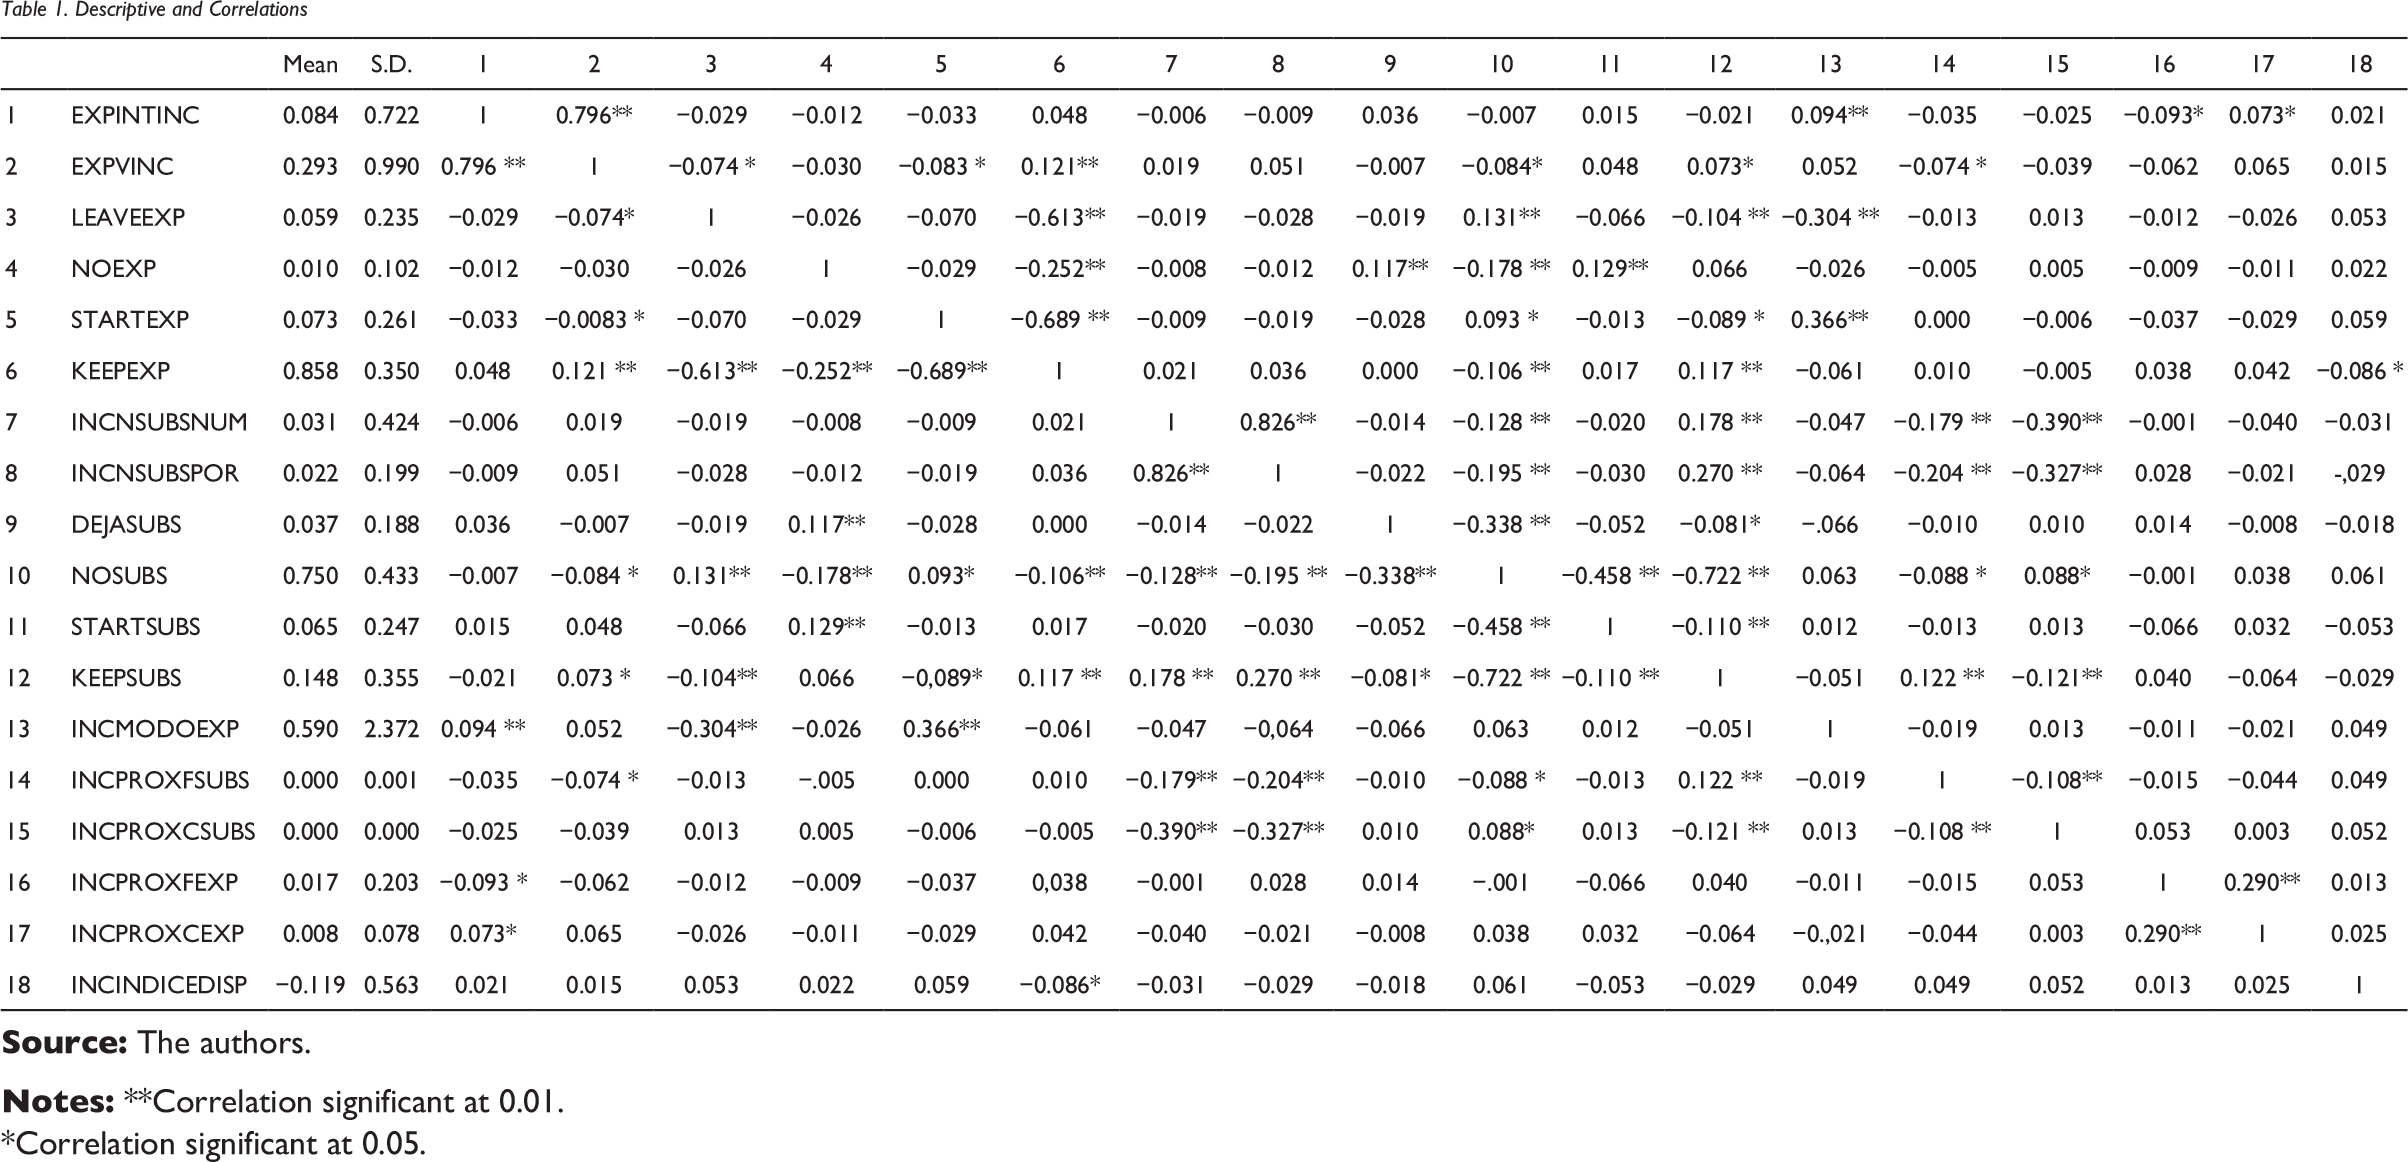
*Correlation significant at 0.05.
Method of Analysis
Cluster analysis procedures were used to develop patterns of international evolution, using the 18 variables of international evolution (Table 1 represents the descriptive statistics and correlations), using a similar methodology applied to the literature about growth of firms (Davidsson & Wiklund, 1999; Delmar et al., 2003).
Cluster analysis is not based on probabilistic statistics, so there is not a single best solution. Because of this, it is first necessary to determine the adequate number of clusters. The number of clusters can be assessed either empirically by examining the changes in the agglomeration schedule or theoretically by paying attention to ease of interpretation (Hair et al., 1995). From an empirical perspective, we used the elbow criterion to find the more adequate solution. This method poses the idea that if we observe the percentage of variance explained by the clusters against the number of clusters, the first clusters will explain a lot of variance, but at some point, the marginal gain will drop. This point will determine the number of clusters to be used (Aldenderfer & Blashfield, 1984).
Using standardized variables (z scores), we identified that the more stable solution was that of using seven clusters. Using K-means clustering, the centroids of each of the seven clusters were calculated, as well as the analysis of the variance of each of the variables used between the different factors identified, in order to identify to what extent there were significant differences between the clusters.
Analysis
Cluster Analysis
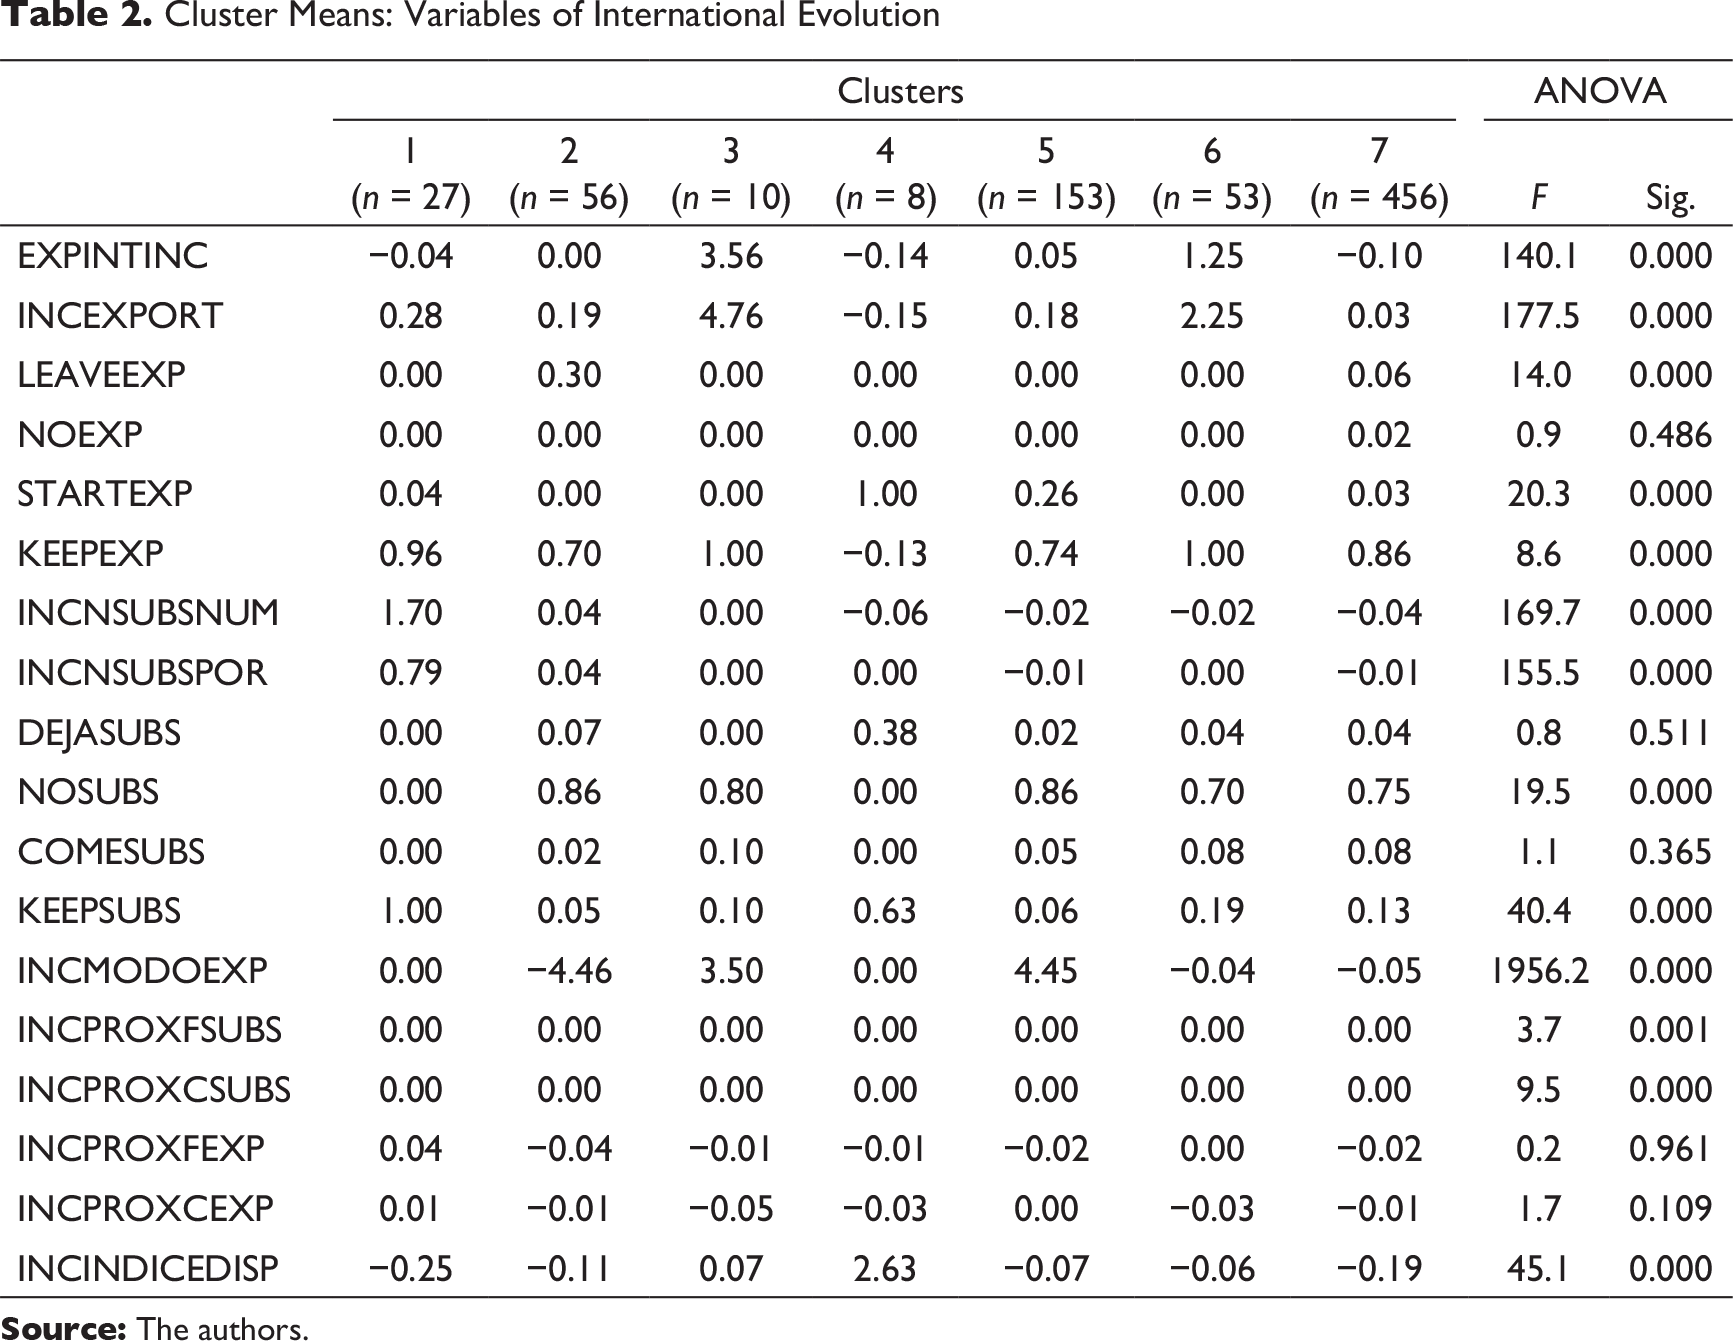
As was formerly described, the number of clusters that offered a better description of the sample was seven. The mean of the variables used in the process for each cluster is presented in Table 3. From these means, it is possible to identify which are the characteristics that differentiate each cluster in comparison with the rest. Besides, the variance of analysis (ANOVA) of each of the used variables in the clustering procedure shows that in 13 out of the 18 variables used, there are significant differences between the 7 identified clusters (Table 2).
The resulting groups obtained from the K-means clustering are:
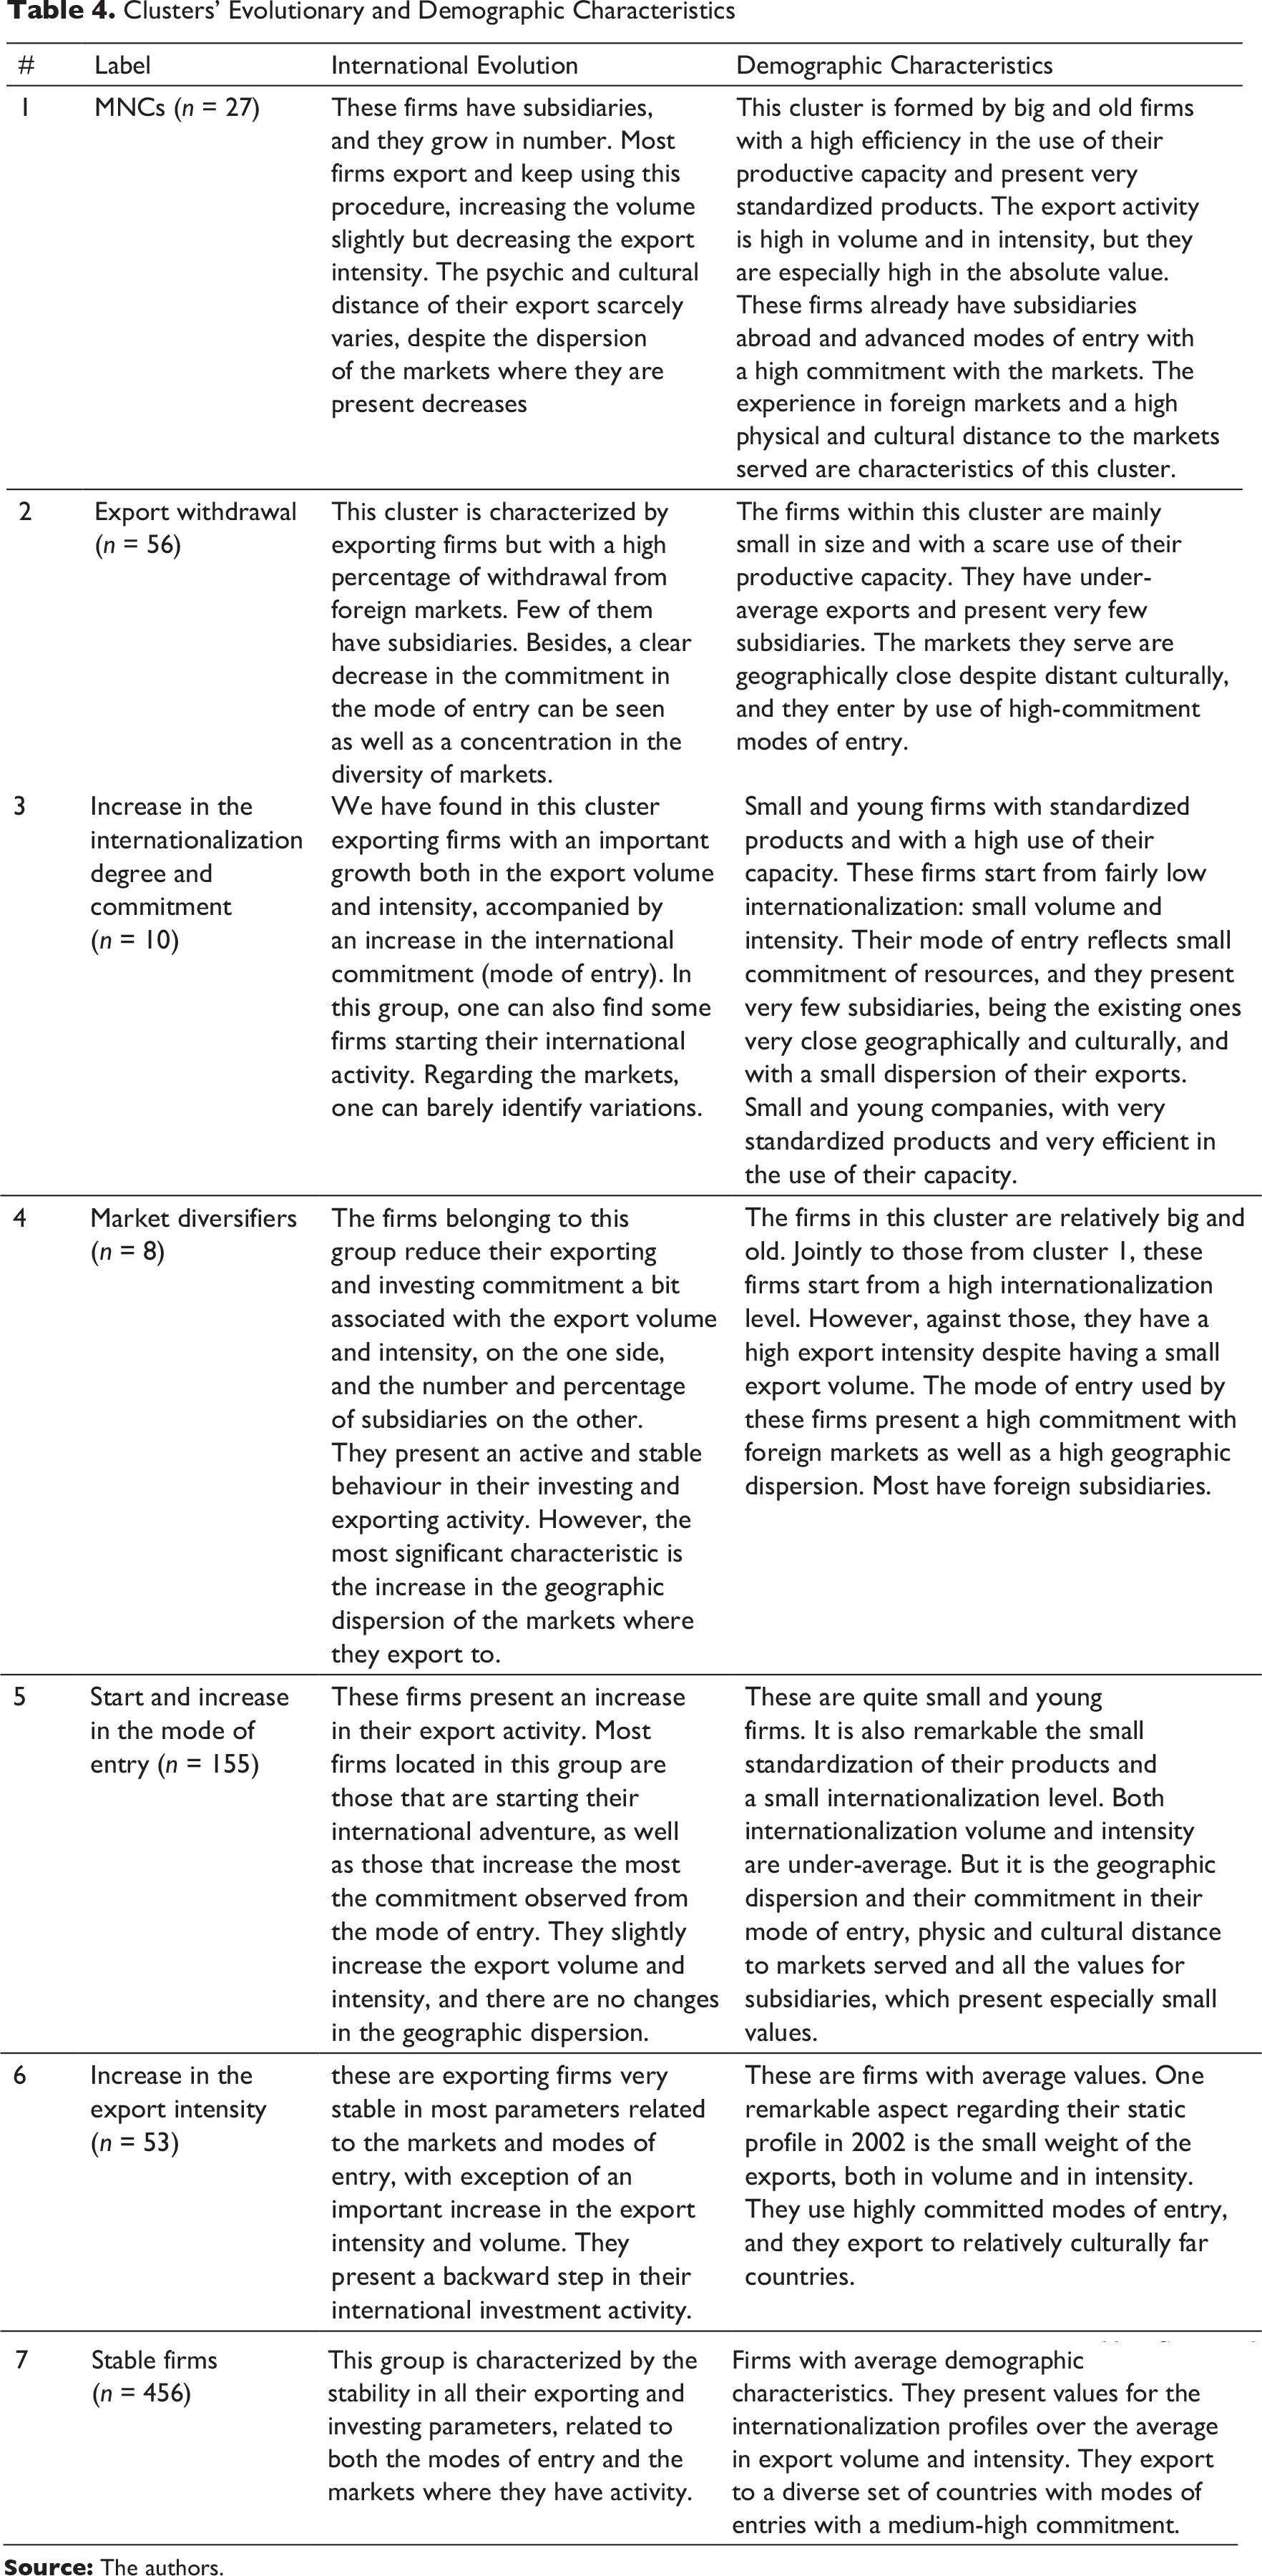
Group 1 (n = 27): MNCs—these firms have subsidiaries, and they grow in number. Most firms export and keep using this procedure, increasing the volume slightly but decreasing the export intensity. The psychic and cultural distance of their export scarcely varies, despite the dispersion of the markets where they are present decreases. Group 2 (n = 56): export withdrawal—most of them are exporting firms but with a high percentage of withdrawal from foreign markets. Few of them have subsidiaries. Besides, a clear decrease in the commitment in the mode of entry can be seen as well as a concentration in the diversity of markets. Group 3 (n = 10): increase in the internationalization degree and commitment—we have found in this cluster exporting firms with an important growth both in the export volume and in intensity, accompanied by an increase in the international commitment (mode of entry). In this group, one can also find some firms starting their international activity. Regarding the markets, one can barely identify variations.
Cluster Means: Variables of International Evolution
Group 4 (n = 8): market diversifiers—the firms belonging to this group reduce their exporting and investing commitment a bit associated to the export volume and intensity, on the one side, and the number and percentage of subsidiaries on the other. They present an active and stable behaviour in their investing and exporting activities. However, the most significant characteristic is the increase in the geographic dispersion of the markets where they export to. Group 5 (n = 155): start and increase in the mode of entry—these firms present an increase in their export activity. Most firms located in this group are those that are starting their international adventure, as well as those that increase the commitment observed from the mode of entry the most. They slightly increase the export volume and intensity, and there are no changes in the geographic dispersion.
Group 6 (n = 53): increase in the export intensity—these are exporting firms very stable in most parameters related to the markets and modes of entry, with exception of an important increase in the export intensity and volume. They present a backward step in their international investment activity.
Group 7 (n = 456): stable firms—this is the biggest group, characterized by the stability in all their exporting and investing parameters, both related to the modes of entry and the markets where they have activity.
Demographic Contrasts
The identified clusters are acceptable, as they have a high degree of stability, and they are interpretable (Hair et al., 1995), which means that there is a high internal validity. However, to evaluate the external validity, we included more variables not used in the clustering procedure. As was aforementioned, two groups of variables were considered. First, we considered the static international profile of the firms in 2002. Second, different demographic variables, like age and size were also included. For the continuous variables, we used the variance analysis, in order to contrast if there were significant differences between clusters, while for dichotomous variables, we used the chi-squared test, in order to observe the differences in the means of the clusters. The results obtained from these analyses are presented in Table 3.
Cluster Means: Demographic Variables
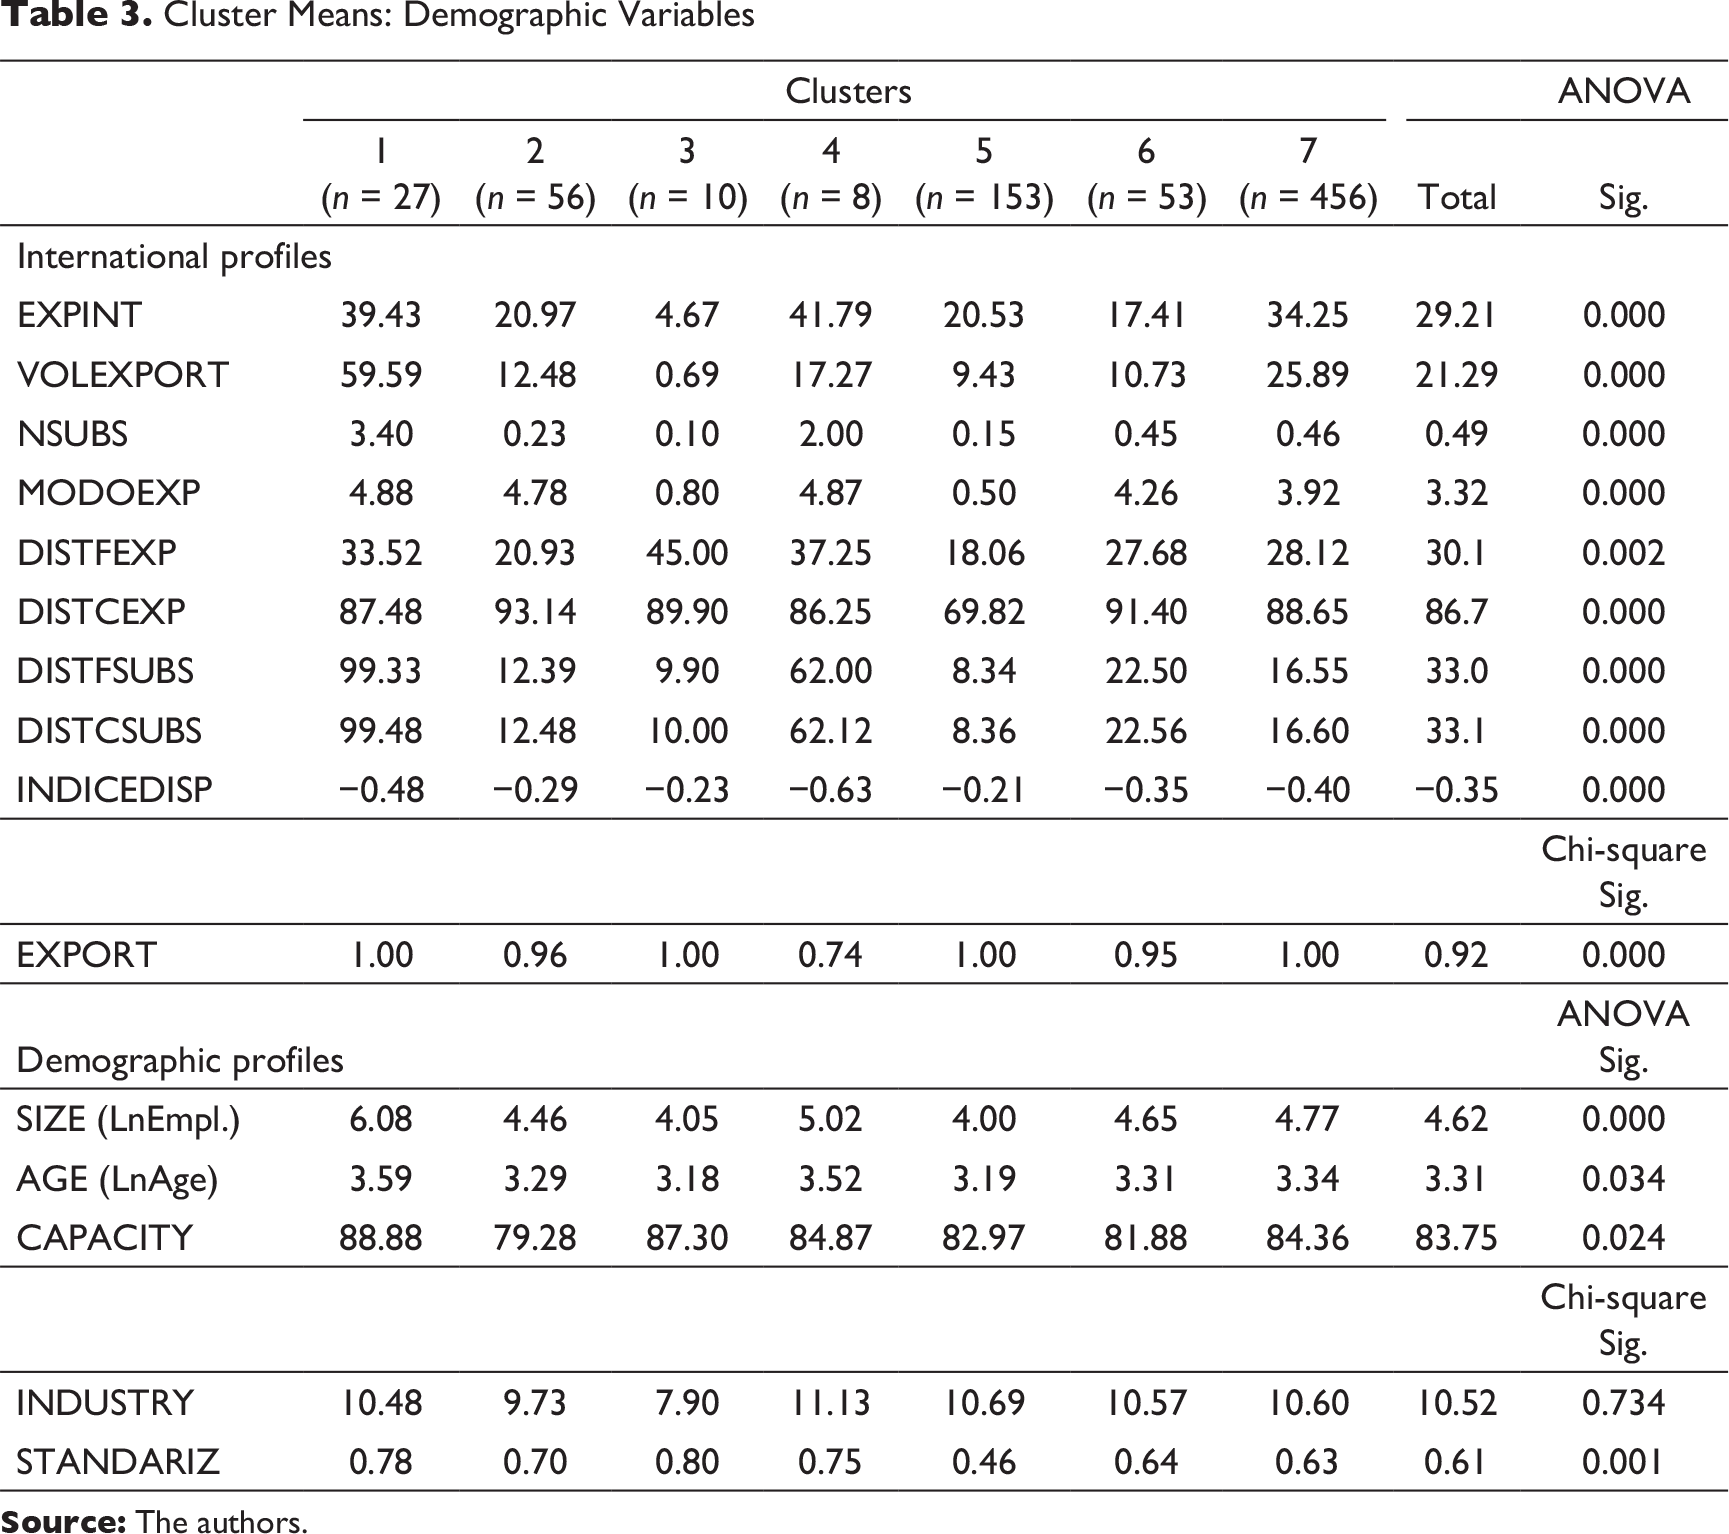
Related to the variables of the international profile, results show that there are significant differences in both export volume and intensity (export/total sales). Thus, cluster 1 presents a very high export volume, as opposed to cluster 3, which has very small volumes. Also, clusters 1 and 4 show a high export intensity against clusters 3 and 7 with a significant small export intensity. Regarding the commitment in the mode of entry into the markets where they export to, clusters 1, 2 and 4 have significantly higher values than the rest. At the other extreme, one can find clusters 3 and 5. In relation to the distance to the export markets, results show significant differences in both the geographic and cultural dimension. Clusters 3, 4 and 1 are those that present a higher mean geographical distance, against clusters 5 and 2. From the other perspective, clusters 2 and 6 show a greater cultural distance to their export markets, as opposed to cluster 5. As for the geographic dispersion of the export markets, results show significant differences between the clusters, being clusters 4, 1 and 7 the ones with a higher dispersion in their export activity, against clusters 5 and 3 with a greater concentration. Finally, regarding the subsidiaries of the firms, results show that the firms in cluster 1, followed by those of cluster 4, are those with more subsidiaries in 2002. Clusters 3 and 5 are those with a lesser number of subsidiaries. In terms of geographic and cultural distance of the subsidiaries, results convey that the firms in cluster 1 and cluster 4 present a higher distance. Again, clusters 3 and 5 are placed in the opposite pole.
Clusters’ Evolutionary and Demographic Characteristics
Discussion
In this article, we have selected a simple of 765 firms located in Spain with international activity in the 2002–2006 period. These firms have been classified according to 18 dynamic variables related with their international activity. These variables were selected to reflect how the international activity of the firms during the studied period had evolved in aspects related to the mode of entry, their commitment, their export intensity, the distance to the served markets, etc. By observing the changes in these variables, we have identified seven different evolutionary clusters. These clusters present differences in 15 out of the 18 variables considered, showing a high internal validity. Each of these clusters represents a different change pattern in relation to the international behaviour. These results are interesting, as they allow to observe different ways of how firms evolve in their international behaviour, serving as a starting point for the classic question of how firms evolve in the international arena (Van de Ven & Huber, 1990).
However, this article tries to get further when it aims at identifying the main characteristics of firms at the initial stage, in order to understand the underpinning factors of such evolutionary patterns. Advancing prior works (Casillas et al., 2012; Cerrato et al., 2006), we have selected two sets of variables referred to our initial observation point (2002). The first group is formed by the static international situation of the firm at the initial year (10 variables). By means of this, we try to confirm if the different international patterns during the analysed period are somehow determined by the situation of the firm during the year 2002. Results show that, indeed, there are significant differences between the seven identified clusters in all the static variables considered. These results give external validity to the identified clusters (Hair et al., 1998) and allow us to confirm the relationship between the dynamic and static aspects in the internationalization process (Jones, 1999; Jones & Coviello, 2005).
The second group of variables is related to the demographics of the firms, due to the need of assuming the role of internal capabilities in the evolution and competitiveness (Bhawsar & Chattopadhyay, 2015). Being specific, we have considered five variables (size, age, industry, use of capacity and standardization of the product). All of them, but the industry, showed significant differences between the clusters. Again, these results are to confirm the external validity of the identified clusters, at the same time, that enhance the importance of these variables when considering the internationalization patterns.
All these analyses allow for a better identification of the dynamic patterns of each of the seven clusters and their interpretation by means of a set of static characteristics at the initial moment of the study. The characteristics of each of the clusters are summed up in Table 4.
All in all, this article identifies different ways of international evolution and suggests the existence of certain relationships between the internationalization status at a certain moment (static perspective) and its latter evolution (dynamic perspective). However, this article presents certain limitation, mainly related to the temporal horizon analysed (only 4 years), the measurement of certain variables (due to the nature of the panel data) and the origin of the firms (a whole Spanish sample). Even though the obtained results suggest new ways of deepening into the understanding of the internationalization process from a longitudinal perspective, we think that it is important to deepen, theoretically and empirically, the existing relationship between the static and dynamic perspectives of the internationalization process. This perspective may help in establishing prescriptive studies about international behaviour. Besides, it would also be interesting to improve the measurement of certain variables, as well as increase the length of the analysed period and the geographical origin of the sample. Finally, the obtained results suggest that it may also be interesting to include new dimensions related to the firm’s performance.
Conclusion
We build on and extend previous research on the internationalization process. Our results enhance the need of analysing the internationalization process as a configuration (Cerrato et la., 2006; Ciravegna et al., 2018) as firms do may present different behaviours on different dimensions as firms evolve (Casillas et al., 2012). Our results also advance in the knowledge about internationalization speed (Casillas & Acedo, 2013), although a more precise approach must be undertaken, in order to provide conclusions in this sense.
This article analyses simultaneously static and dynamic variables and therefore contributes to the need of the consideration of time in the internationalization process evaluation (Welch & Paavilainen-Mäntymäki, 2014). Thus, our results reinforce the importance of the path-dependent nature of the internationalization process being inaccurate other approximations to internationalization (Eden, 2009; Hutzschenreuter et al., 2007; Jones & Coviello, 2005; Kutschker et al., 1997). These results are important to the literature, as they open a research path that allows the development of the configurational approach to international business. With this approach, we go back to the Uppsala Model (Johanson & Vahlne, 1977). The results present significance for future research, as they remark the importance of sample selection or the usage of control variables as they may distort the results obtained due to the differences in their configurations.
The configurational approach allows us to ascertain certain interdependences between three dimensions of export behaviour, with regard to extent, entry mode and scope (Zahra & George, 2002), and requires further research on whether speed also develops in a configurational way along these dimensions (Casillas & Acedo, 2013).
Managerial Implications
Our results can also be useful for practitioners. The path-dependent nature of export process in our results affect the process followed by managers in determining the future export goals, to some extent. The explicit premise of this relationship could be useful for planning activities, serving as a guide to export managers to develop coherent plans for export development in the long term. Moreover, we remark to export managers that export development process is a multidimensional process, and it has to be managed assuming such consideration. Finally, and for export promotion agencies, these results may be useful in order to improve their programme designs, achieving a more efficient targeting and improving the results achieved.
Limitations and Future Research Lines
This article is not absent from limitations. The sample selection of a specific country calls for further replication in other countries. Similarly, the dates are taken prior to the economic crisis for stability purposes. A longer period and a multilevel approach for this study will help to introduce different contingent effects that surely affect the internationalization process. Besides, the introduction of latent class identification may contribute to identifying more complex relationships in the internationalization process of firms. The inclusion of new variables, such as the number of countries, or the specific parts of the value chain that are developed in other countries, could enrich the results obtained significantly.
Besides, the consideration of the internationalization of firms as a dynamic process keeps on attracting the attention of researchers and presents numerous research gaps yet to be answered, mainly due to its complexity and the difficulty in obtaining data over time. This research is a further step in our understanding of how firms internationalize over time.
Footnotes
Acknowledgement
This research was supported by the research group GIRCO (Grupo de Investigación sobre Recursos y Capacidades Organizativas), funded by the Spanish Ministerio de Economía y Competitividad (Grant no. ECO2017-84364-R). The authors are grateful to the anonymous referees of the journal for their extremely useful suggestions to improve the quality of the article.
Declaration of Conflict of Interest
The authors declared no potential conflicts of interest with respect to the research, authorship and/or publication of this article.
Funding
The authors received no financial support for the research, authorship and/or publication of this article.