
Abstract
This study examines the impact of the COVID-19 outbreak on the stock markets of G-20 countries. We use an event study methodology to measure abnormal returns (ARs) and panel data regression to explain the causes of ARs. Our sample consists of indices in G-20 countries. The observed window comprises 58 days post the COVID-19 outbreak news release in the international media, and the estimation window consists of 150 days before the event date. We find statistically significant negative ARs in the four sub-event windows during the 58 days. Negative ARs are significant for developing as well as developed countries. The findings of this study reveal that cumulative average abnormal return (CAAR) from day 0 to day 43, ranging from –0.70 per cent to –42.69 per cent, is a consequence of increased panic in the stock markets resulting from an increased number of COVID-19 positive cases in the G-20 countries. From day 43 to day 57, CAAR ranging from –42.69 per cent to –29.77 per cent indicates the recovery of stock markets after a major stock price correction due to COVID-19. Additionally, the results of panel data analysis confirm the recovery of stock markets from the negative impact of COVID-19.
Introduction
The extant literature provides several empirical pieces of evidence on stock market responses to the major systemic events. The studies investigate the impact of major events, for instance, the Severe Acute Respiratory Syndrome (SARS) pandemic disease outbreak (Chen et al., 2007, 2018; Loh, 2006), natural disasters (Caporale et al., 2019; Tavor & Teitler-Regev, 2019; Wang & Kutan, 2013), corporate events (Maitra & Dey, 2012; Ranju & Mallikarjunappa, 2019; Seal & Matharu, 2018), public news (Li, 2018; Ormos & Vázsonyi, 2011) and political events (Beaulieu et al., 2006; Bash & Alsaifi, 2019; Ismail & Suhardjo, 2001; Nazir et al., 2014; Shanaev & Ghimire, 2019) on the stock markets. The negative impact of the recent coronavirus disease (COVID-19) outbreak on the world economy and capital markets is inevitable. In the initial phase of academic research on COVID-19, studies conducted by Al-Awadhi et al. (2020), Liu et al. (2020), Ahmar and Val (2020) and Zhang et al. (2020) witnessed a negative impact of COVID-19 outbreak on stock markets.
COVID-19 is an infectious disease caused by a newly discovered coronavirus. As reported by the World Health Organization (WHO), most people infected with the COVID-19 virus will experience mild to moderate respiratory illness and recover without requiring special treatment (WHO, 2020). The first case of COVID-19 was confirmed in Wuhan city in Central China on 31 December 2019. Later, in January 2020, the WHO declared the COVID-19 outbreak a public health emergency of international concern. After the 13-fold spread of the deadly COVID-19 cases outside China, the WHO declared COVID-19 a pandemic on 11 March 2020 (Cucinotta & Vanelli, 2020). However, the WHO guidelines on spread and cure keep changing regularly due to a lack of sufficient scientific knowledge about COVID-19. Most recently, Banik et al. (2020) suggested that the COVID-19 fatality rates differ across countries and factors; for instance, the public health system, population age structure, poverty level and bacillus Calmette–Guérin (BCG) vaccination are powerful contributory factors in determining fatality rates.
With the WHO declaration of COVID-19 as a pandemic, stock markets across the world started plummeting. A number of COVID-19 studies investigating the stock price reactions documented the evidence of panic trading and increased volatility in national and international stock markets. Due to exacerbated fear and panic trading, the National Stock Exchange (NSE) and Bombay Stock Exchange (BSE) halted trading using a circuit breaker on 13 March and 23 March 2020, two times within 15 days. In March 2020,the US stock market witnessed the circuit breaker four times in 10 days (Economic Times, 2020). The majority of the stock markets reacted negatively to the COVID-19-induced crisis.
With the purpose of conducting a detailed investigation, in this article, we examine how the stock markets in the G-20 countries behave in the period of the COVID-19 outbreak. To the best of our knowledge, this study is a pioneering research work to examine the performance of financial markets across the G-20 countries under the present conditions of the COVID-19 pandemic. The results of the article confirm that the COVID-19 outbreak badly influences the performance of the stock markets across developing as well as developed economies. The downfall of stock markets can partially be attributed to a halt in economic activities and partially to the price pressure due to economic uncertainty and exacerbated investor fear. Recovery following a downfall confirms the notion of investor overreaction hypothesis (ORH) of De Bondt and Thaler (1985, 1987) and Boubaker et al. (2015) and challenges the weak form of market efficiency and, in fact, semi-strong and strong forms as well. ORH indicates the departure of stock prices from the fundamental value; therefore, this implies a hindrance in the fair allocation and disciplinary functions of the stock markets (Baumol, 1965).
The remainder of the article is structured as follows: the second section contains a review of relevant literature. The third section discusses the objective of the study. The fourth section includes the rationale of the study. The fifth section explains the methodology applied in the analysis of data. The sixth and seventh sections discuss the results of the analysis of the data. The eighth section concludes the findings.
Literature Review
COVID-19 and Stock Market Reaction
Most recently, Liu et al. (2020) investigated the impact of the COVID-19 outbreak on the most affected countries’ stock markets using the event study method. They documented that the stock markets responded negatively to the COVID-19 outbreak, which had weakened their performance. Zhang et al. (2020) measured the general pattern of country-specific risk and systematic risk across world financial markets in the presence of COVID-19 outbreak fear. They documented that global markets have become highly volatile and financial market risk has increased in response to the uncertainty of market conditions. In the case of the USA, they suggested that non-conventional policy interventions (quantitative easing) could increase more problems for the economy. Regarding the impact of the deadly virus on financial volatility, Albulescu (2020) documented that new confirmed cases of COVID-19 and death reported positively influence market volatility index (VIX) both within and outside of China. Additionally, he proposed that the higher the spread of the deadly virus in the country, the higher would be the financial volatility in the stock market. In the context of Spanish capital markets, Ahmar and Val (2020) predicted a short-term effect of COVID-19 on the IBEX index using the ARIMA and SutteARIMA methodology. Based on the results, they suggested that SutteARIMA is better for predicting the impact of the coronavirus on the stock market than ARIMA.
Linkages Between the Outbreak of Disease and Stock Market Behaviour
Several past research studies have examined the relationship between the outbreak of disease and stock market reaction. Loh (2006) established a strong relationship between the spread of SARS and the performance of airline stocks across the sectional financial markets of Canada, China, Hong Kong, Singapore and Thailand. Further, she revealed that non-aviation sector stocks are less sensitive compared to aviation sector stocks.
Stock Market Indices in G-20 Countries
Concerning stock market behaviour and contagious animal disease outbreaks, Pendell and Cho (2013) found that daily returns with the smaller companies facing the largest changes in volatility. In the context of Taiwan, Wang et al. (2013) investigated the impact of diseases, for instance, Enterovirus 71, dengue fever, SARS and H1N1, on allied biotechnology companies’ stocks’ performance. They documented that investors rationally evaluate the performance of biotechnology stocks during the outbreak of disease.
Lee and McKibbin (2004) documented the severe impact of the SARS epidemic on human society as well as on financial integration. Chiang et al. (2007) investigated a high-degree correlation among the Asian countries during periods of major events. Morales and Callaghan (2012) reported that due to globalization, markets are becoming interdependent, and disaster in one country is likely to affect other connected countries as well. Donadelli et al. (2017) and Zouaoui et al. (2011) documented that the impact of a disease outbreak on an investor’s sentiment is more prominent in culturally interdependent countries. Contagious disease outbreaks persuade a negative impact on an investor’s sentiments, which results in wrong investment decisions and affects the prices of the stocks (Liu et al., 2020). In line with the previous studies, we examine stock markets’ reactions to the outbreak of COVID-19 and delve into the theory of information efficiency and ORH.
The analysis is conducted in two parts. First, we perform an event study to assess the stock market reaction to the COVID-19 outbreak. Second, we regress abnormal returns (ARs) on the number of confirmed cased of COVID-19, trading volume, market returns and proxies of developing and developed economies. The number of confirmed cases accounts for direct impact of COVID-19 on the stock market; trading volume accounts for the market activity (Bradley et al., 2001; Brau et al., 2004; Field & Hanka, 2001; Plerou et al., 2001); the performance of Dow Jones global index accounts for market return; and proxy of developing and developed economies accounts to check whether the outbreak of coronavirus in developing economies significantly impact the abnormal return.
Objectives of the Study
The objective of the article is to study the reaction of stock markets across the G-20 countries to and around the COVID-19 pandemic. Additionally, our study attempts to develop a predictive model that examines the relationship between ARs, index return, market return, confirmed COVID-19 cases, abnormal trading volume and status of the respective countries (developing and developed).
Rationale of the Study
Perhaps no other area of finance has been subject to such a humongous empirical investigation during the last four decades as the behaviour of stock markets across countries (Saravanakumar, 2011). The expanding body of literature has established the relationship between corporate events (i.e., dividend announcement, stock split, merger, acquisition, etc.) and the reaction of stock markets but has not given the required attention to the Black Swan events, such as terrorist attacks and epidemics, that cause shock, fear and panic among international investors and result in a sharp panic-selling response (Burch et al., 2016). The ongoing deadly COVID-19 outbreak has wreaked havoc all over the world, affecting countries’ economies, as well as weakened stock markets’ performance, hurting the sentiments of stock market participants. The G-20 countries have felt the major waves of the COVID-19 outbreak during the study period. Hence, our article attempts to study the behaviour of indices in G-20 countries during and around the COVID-19 pandemic.
Methodology
Event Study Methodology
In this study, the empirical work is based on the event study methodology, as we seek to reveal how financial markets, particularly the stock markets, behave after the outbreak of the coronavirus news. The event study methodology is considered one of the most popular and suitable methods to examine the impact of an event on securities returns over an event period. Event studies facilitate forecasting how securities and indices will behave in relation to the announcement of an event (Anwar et al., 2017). The announcement of an event could have either a positive or a negative impact on the prices of stocks. Generally, the event study methodology is used to examine the relationship between the performance of the stock market and the occurrence of corporate events such as mergers and acquisitions, splits, stock dividends, bonus shares, amalgamation, etc. Numerous researchers use the event study methodology to study the impact of a non-corporate event such as the outbreak of the disease on stock markets (Chen et al., 2017, 2018; Liu et al., 2020; Pendell & Cho, 2013).
Previous research suggested that the event study methodology is the most useful tool to estimate ARs after the announcement of an event (Brown & Warner, 1985; MacKinlay, 1997). As proposed by Bowman (1983), we estimate the ARs using an event study, and it includes decisions over choice of the event of interest, the event window, the estimation window and the estimation model.
Event of Interest and Event Date
Several recent studies have attempted to investigate the short-term effect of the COVID-19 outbreak on stock market returns (Liu et al., 2020; Nicola et al., 2020; Zhang et al., 2020); in the same way, the event of interest of this study is the outbreak of news about COVID-19 on Chinese media. In the first interview about the disease outbreak, on 20 January 2020, Zhong Nanshan (expert group leader of National Health and Fitness Commission (NHFC), China) proposed that the new coronavirus could be transmitted among people (Liu et al., 2020). After his interview, information about transmitted diseases attracted the attention of people and grabbed the headlines of print and electronic media around the world. Therefore, the event date in this study is chosen as 20 January 2020, when for the first time news of the virus appeared in the media.
Event Window
To examine the effect of COVID-19 on stock indices, the event window chosen is of 58 days, including the 57 days after the announcement of information about the transmitted disease along with the announcement day itself. The impact of the COVID-19 pandemic on stock returns is longer as compared to that of corporate events. We argue that the stock markets may behave differently in different phases of the pandemic cycle. Therefore, to examine the influence of outbreak on different periods, the entire event window is subdivided into six event windows: (0–9), (10–20), (21–30), (31–40), (41–50), and (51–57).
Estimation Window
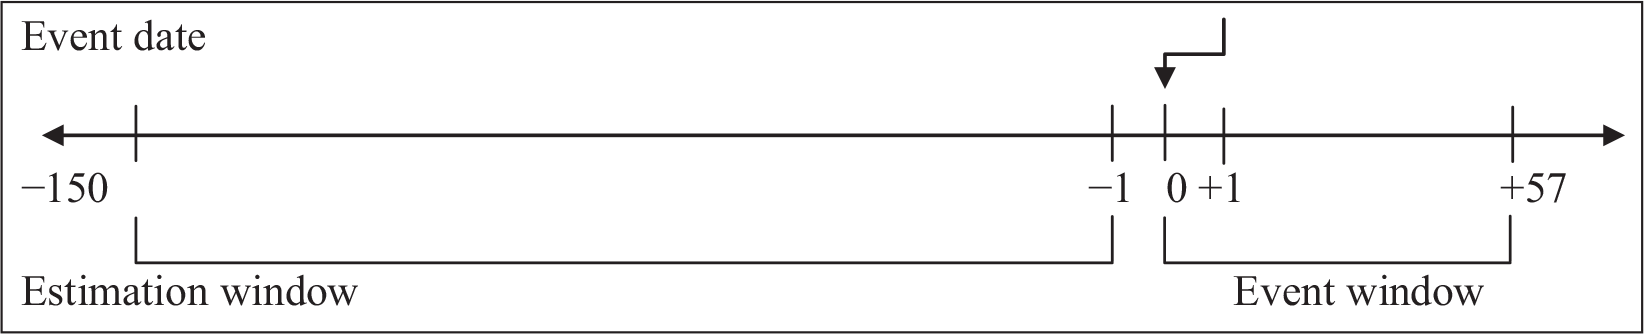
As shown in Figure 1, an estimation window is used to estimate the expected returns. On par with previous research (Anwar et al., 2017; Lalwani et al., 2019), the estimation window is from the day –150 to day –1, the day prior to the event day when information about the new coronavirus floated in the stock market, hence consisting of 150 trading days.
Estimation Model
In the first step of the event study, we calculate the daily return using Equation (1):

where Ri,t is the return for index i on day t, ln is the natural logarithm, Pi,t denotes the closing price for an index i on day t, and Pi,t−1 is the closing price of index i in the previous trading day.
Equation (2) is used to derive the expected mean return for index i, where Ri,t is the daily return of index i during the estimation window (−150 to −1).

After deriving the expected mean return [E(
Cumulative abnormal return (CAR) of index i over a window from t0 to t1 is calculated using Equation (4):

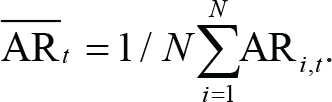
Average abnormal returns (AAR) are calculated using Equation (5), where we compute the arithmetic average of ARs for all the indices on each event day. N represents the number of indices.

To investigate the accumulated impacts of the event during a specified time period, cumulative average abnormal returns (CAARs) are obtained. CAAR refers to the aggregate of daily AARs for the pre-defined event window (t0 – t1). CAAR for the pre-specified window is calculated using Equation (6):

The standard deviation is calculated using the time series of AARs of the estimation period, as shown in Equation (7):

Where
and
heck the significance of the coefficient of AAR on event day t and of CAAR for a particular event window (t1 – t2), t-statistics are calculated as per Equations (8) and (9), respectively:


Sampling and Data Collection
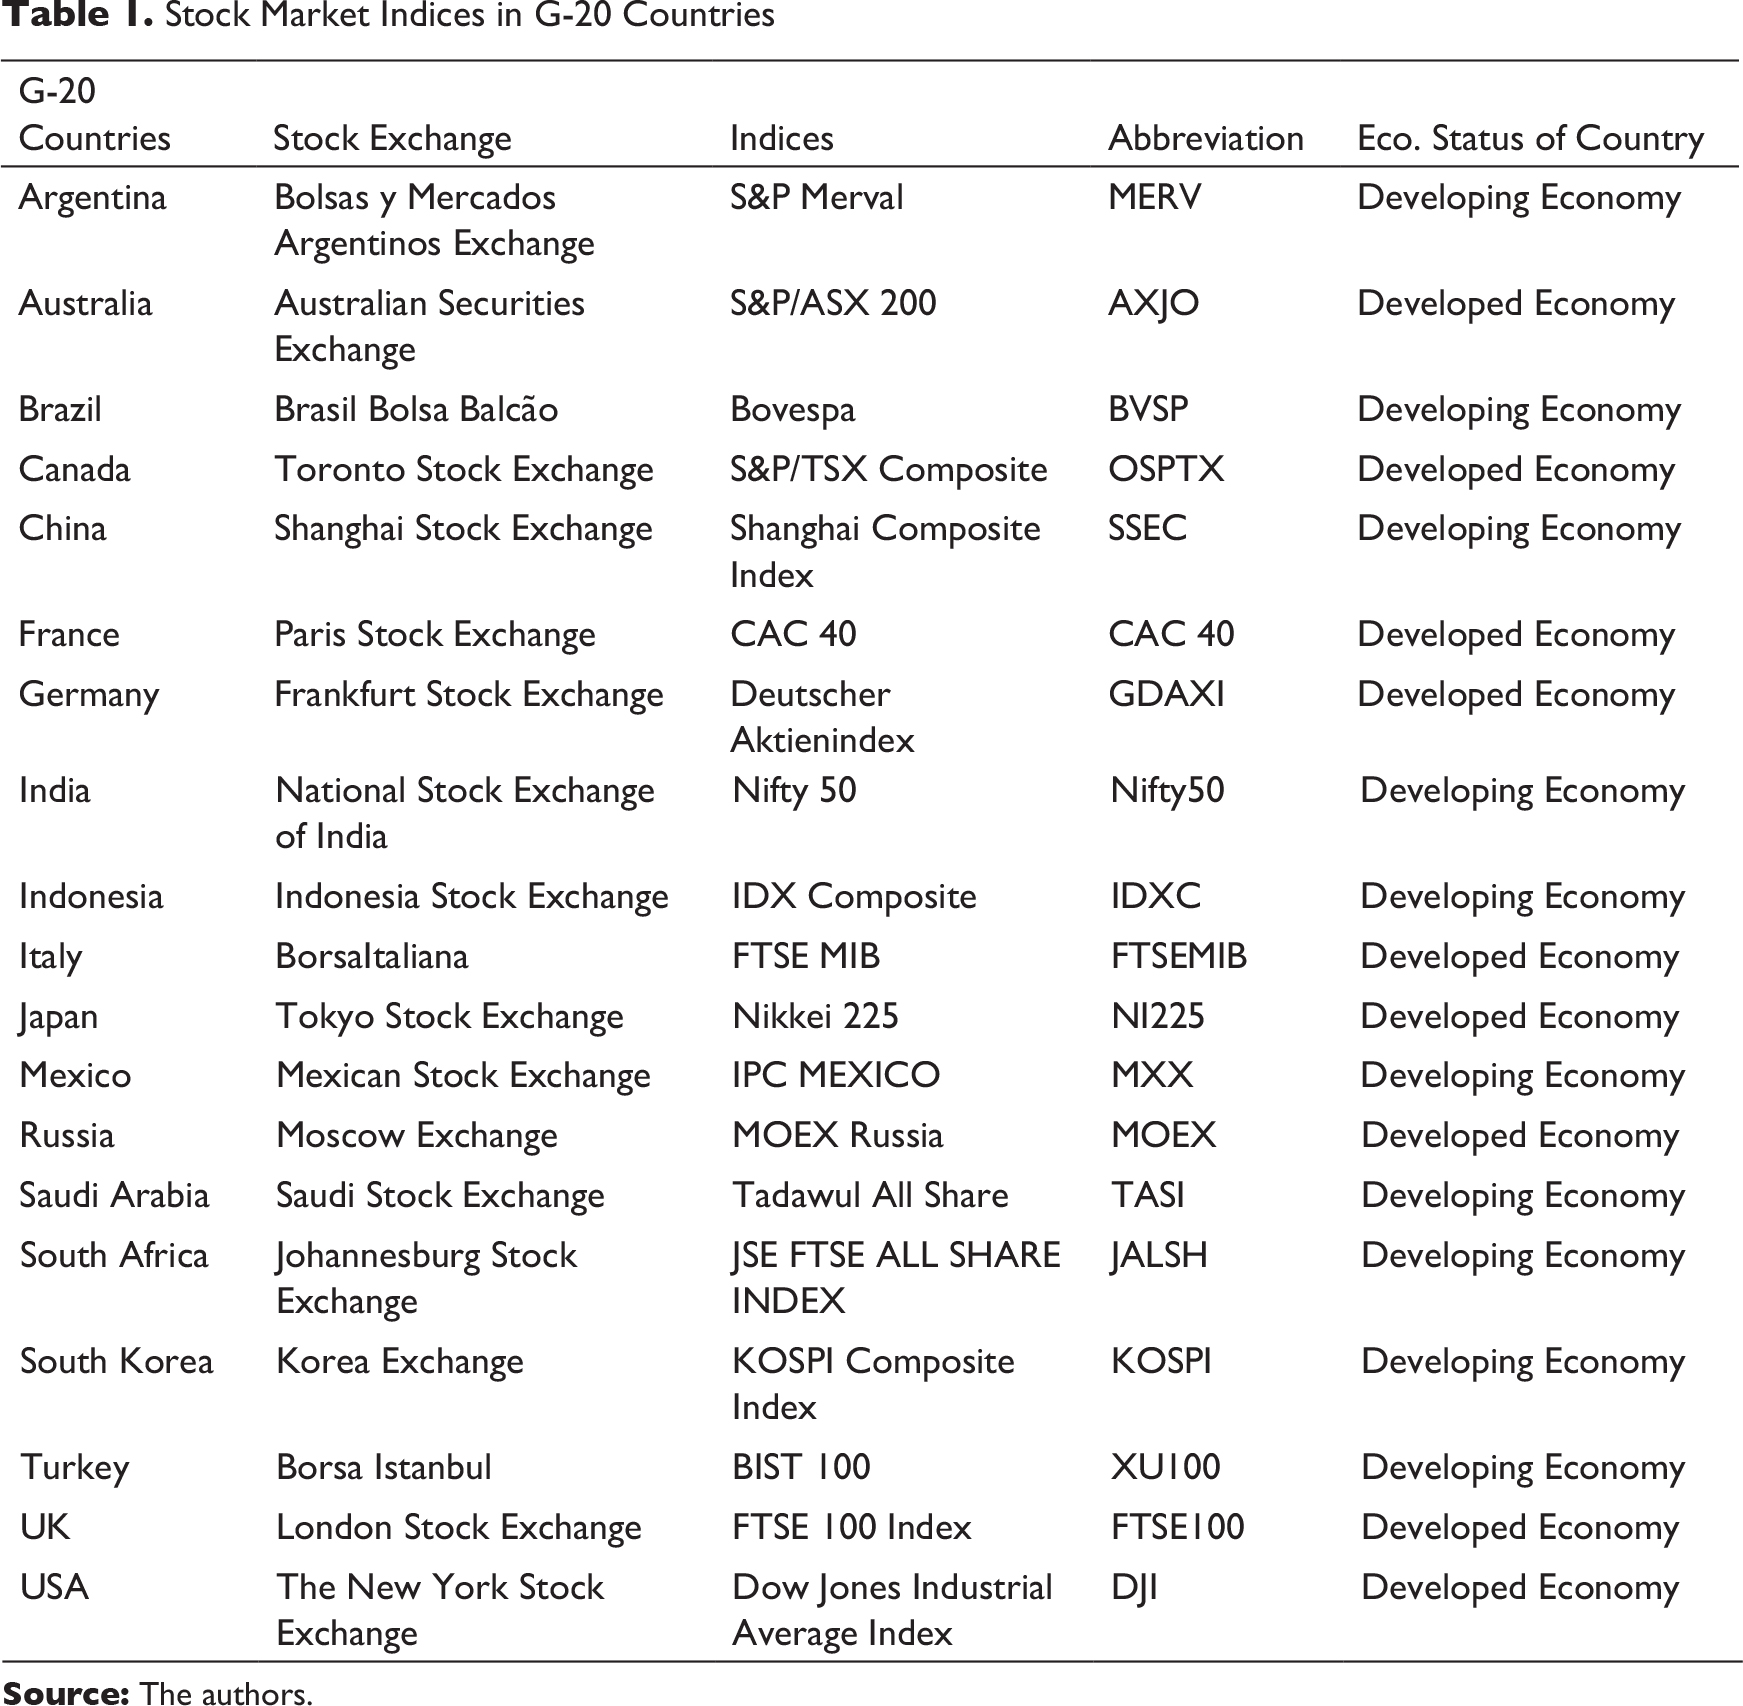
As the purpose of the study is to examine the impact of the COVID-19 outbreak on stock indices around the world, we select the G-20 countries’ indices as a sample for this study (see Table 1). G-20 comprises the most developed and developing economies. The sample comprises 19 economies’ indices (excluding the European Union). According to media reports, G-20 countries are facing huge difficulties in containing the spread of the novel coronavirus. Since COVID-19 is a systemic event, global indices, for example, the Dow Jones Global Index, are also affected negatively. We use a comparison period mean-adjusted model to compute expected returns for corresponding countries.
Data on the intra-day closing prices of G-20 countries’ indices from 18 February 2019 to 17 April 2020 were collected using the website investing.com (an open-access website that reflects real-time stock and index prices over the world). Additionally, data on confirmed cases of coronavirus across the G-20 countries were collected using the website ourworldindata.org (a website that offers data on coronavirus cases around the world). Further, the entire data set was analysed using Microsoft Excel spreadsheets and Stata.
Results and Discussion
Mean Returns of G-20 Indices
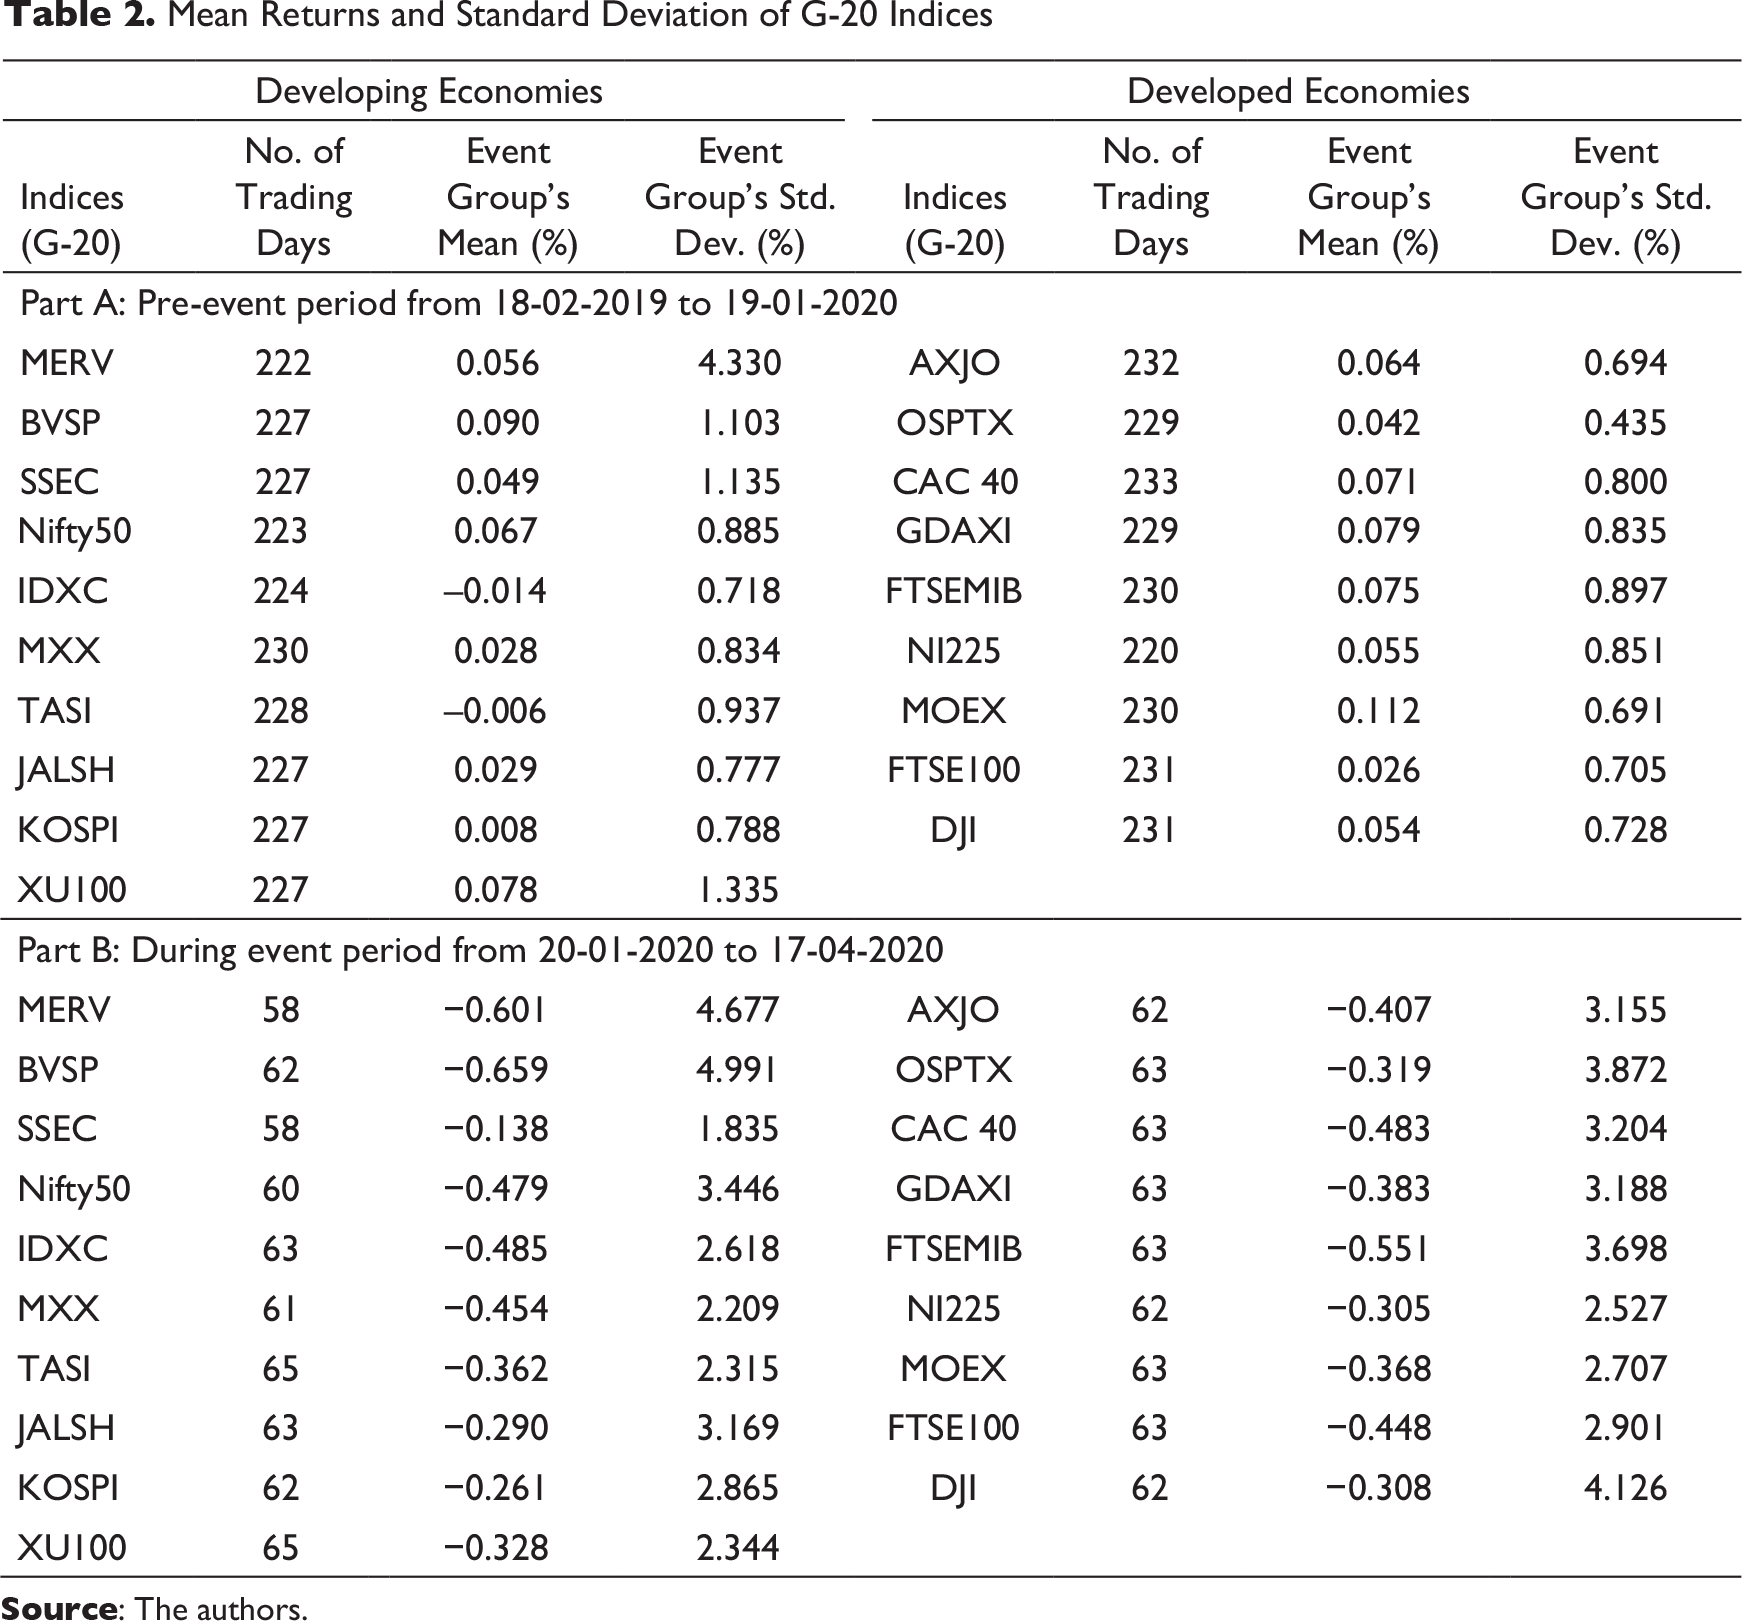
The mean returns and standard deviation corresponding to G-20 indices are shown in Table 2. In Table 2, part (A) reports the pre-event mean and standard deviation, and Part (B) reports the post-event mean and standard deviation.
All the G-20 indices yield positive mean returns before the outbreak of COVID-19 except IDXC and TASI, as shown in Part A. After the outbreak of the deadly coronavirus, mean returns corresponding to G-20 indices are negative, with increased standard deviation as compared to the pre-COVID-19 period, implying increased stock market volatility. Indices for Brazil, Argentina, Italy, Indonesia, India, Mexico, France, Australia and the UK respond more negatively to the outbreak of the coronavirus. As the major impact of COVID-19 was experienced in the USA and Italy after China, their stock markets reported –0.31 per cent and –0.55 per cent mean returns, respectively, during the event window. Despite the major outbreak of COVID-19 in China, SSEC (–0.14%) shows a relatively lower negative mean return than major stock markets, which may be attributed to the quick remedial actions and virus containment by the Chinese government. The outbreak of COVID-19 negatively influenced the stock markets in developing as well as developed economies.
Mean Returns and Standard Deviation of G-20 Indices
Abnormal Returns of G-20 Indices
AR on the event day (the first time the breaking news about COVID-19 hit the international media) and the next day are shown in Table 3. On the event day, stock markets in the developing countries India, Indonesia and South Africa showed a negative AR. Similarly, stock markets in developed countries, such as France, Italy and the UK reported a negative AR as well. We also report the ARs on the next day after the breaking news about the coronavirus was widely telecast across world media. On t1, the event day, all G-20 country indices reported a negative AR except Turkey’s stock market. The COVID-19 news on international media failed to dent investor confidence in the Turkey stock market on event day t1, whereas markets in Indonesia, Brazil, South Africa, China, South Korea, Japan, India, Italy, France and Mexico reported negative ARs. The sell-off was uneven across stock markets, with close geographical or economic links to China more than others. Therefore, on that day, MERV reported the highest negative AR and IDXC lowest negative AR among all the G-20 countries. The stock markets in developing countries bore a greater negative impact due to COVID-19 than developed countries’ markets.
Abnormal Return on t0 and t1.
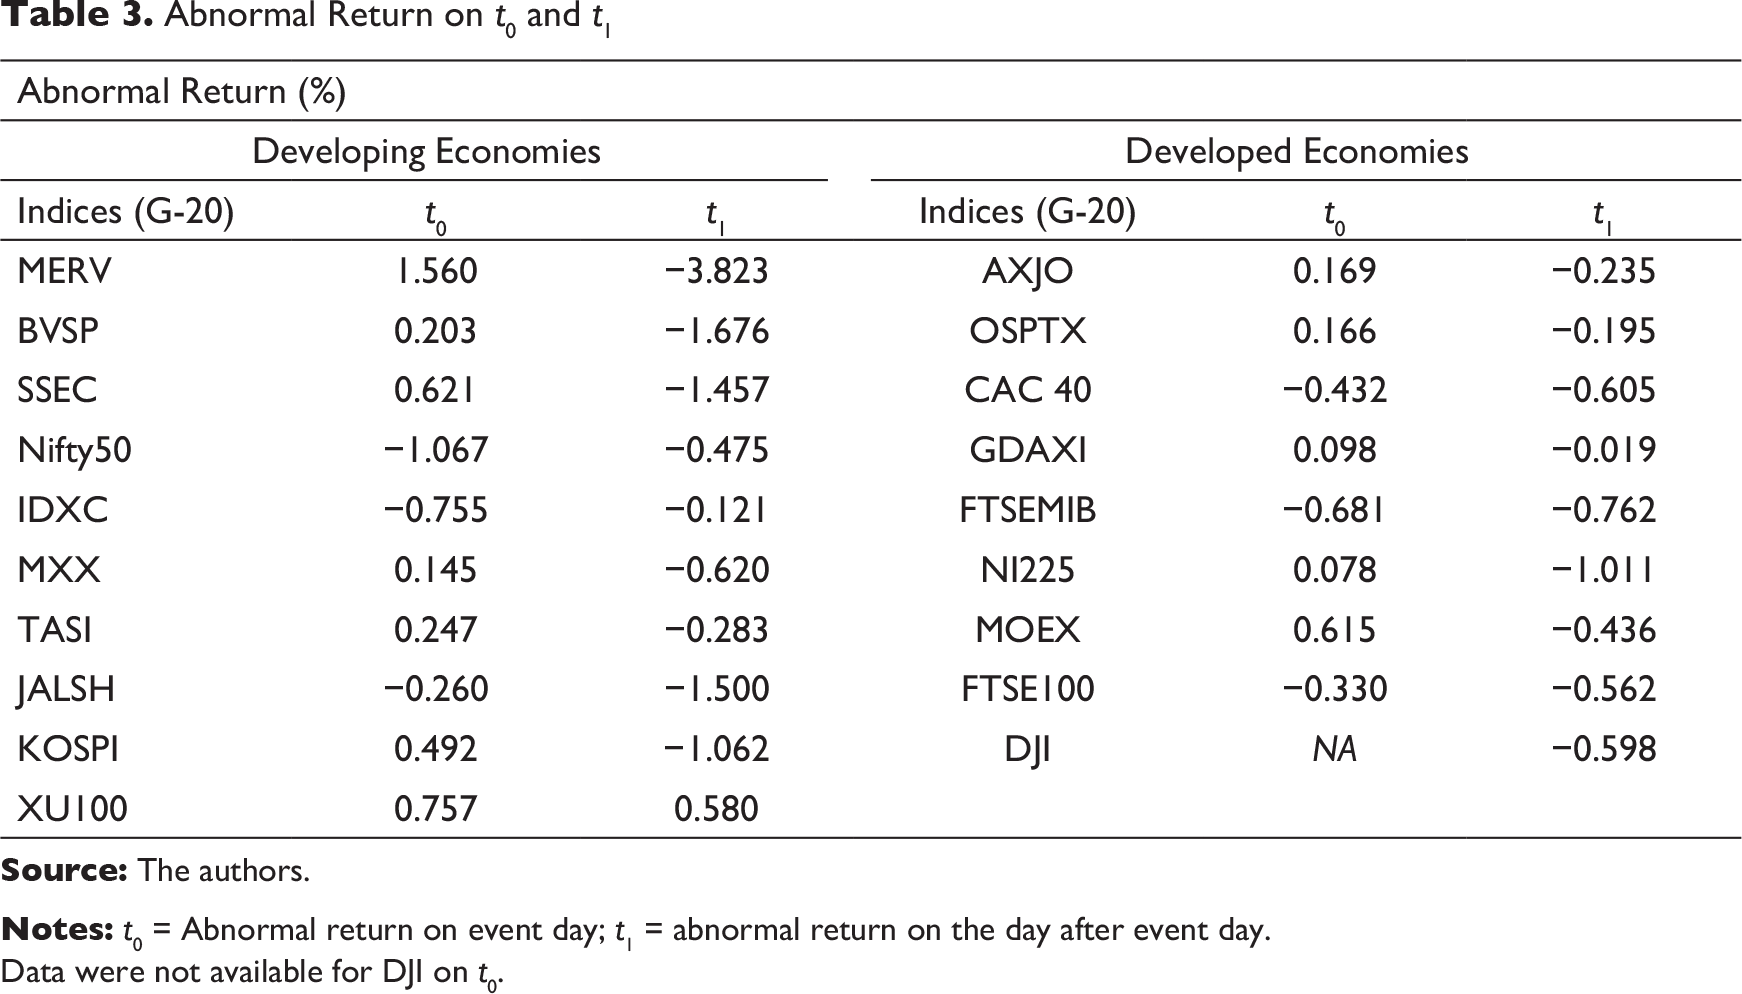
Data were not available for DJI on t0.
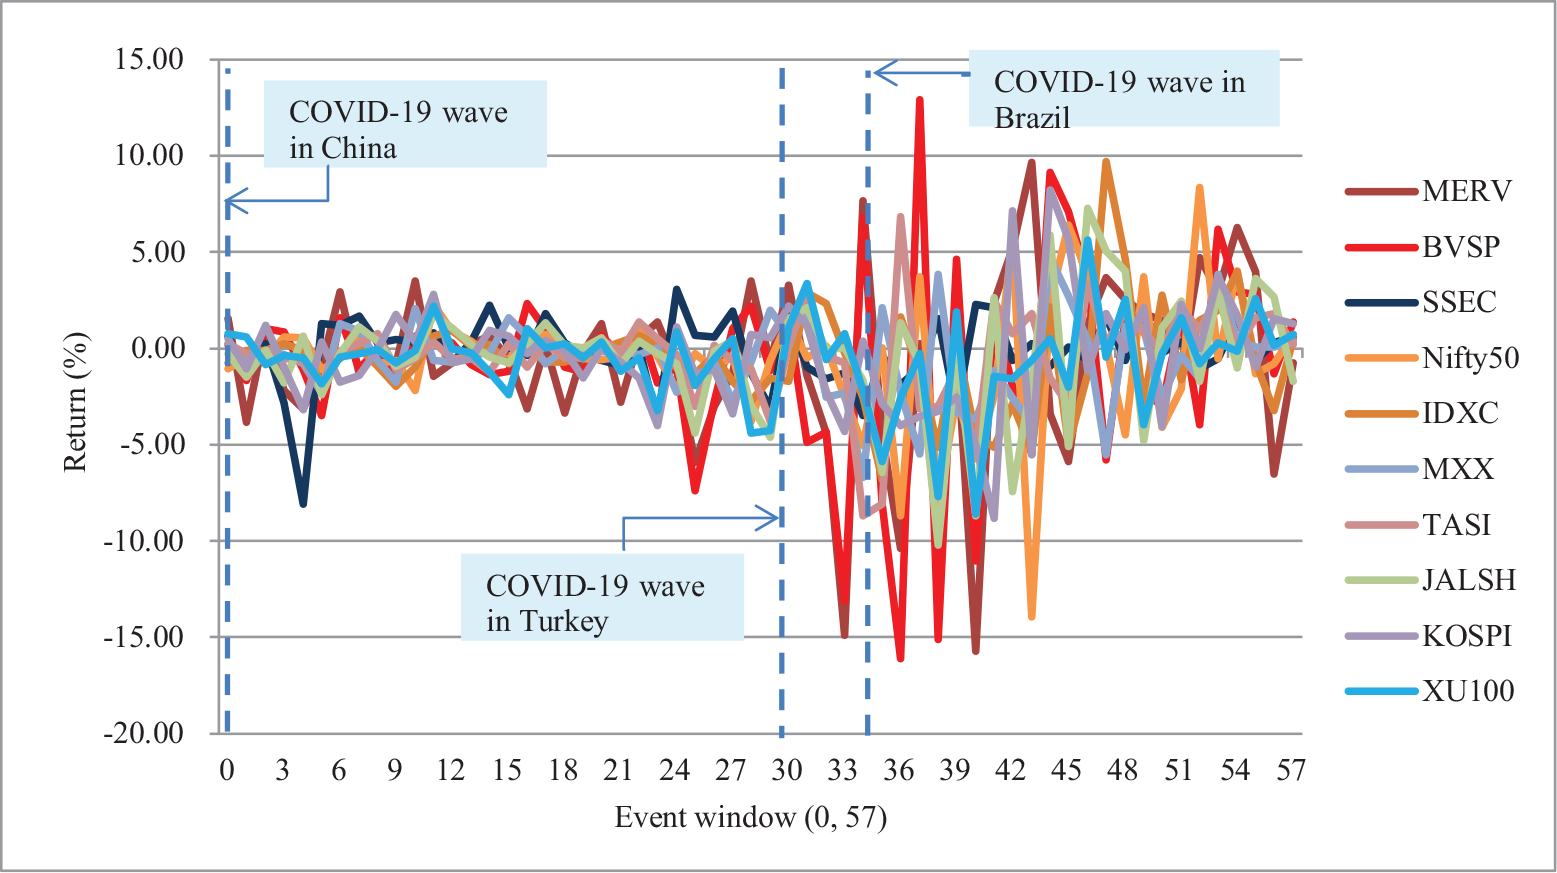
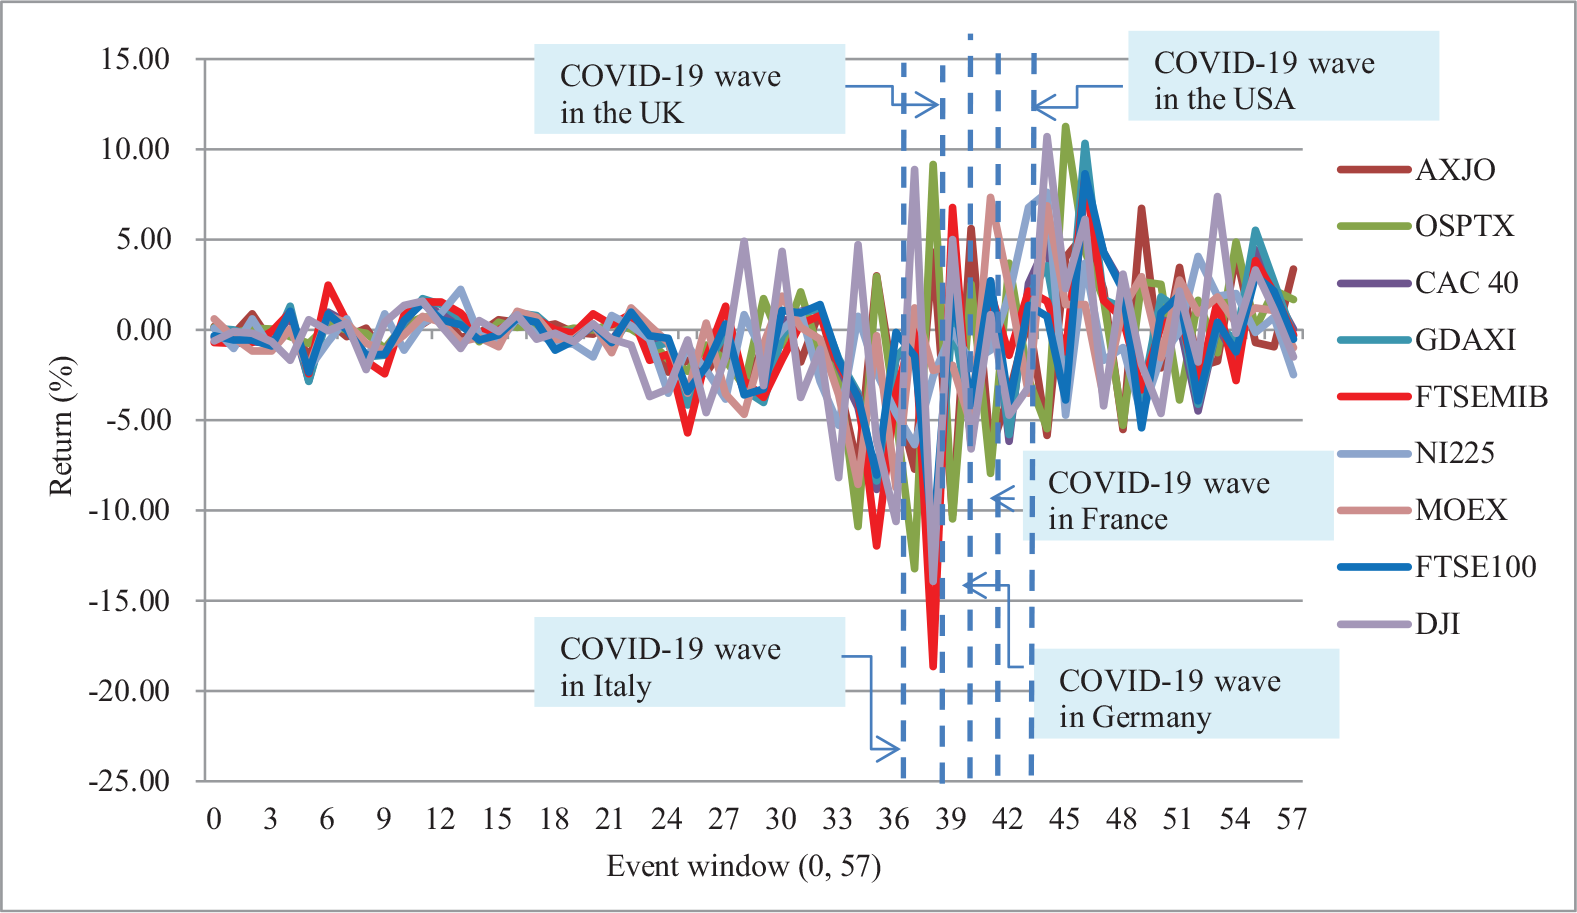
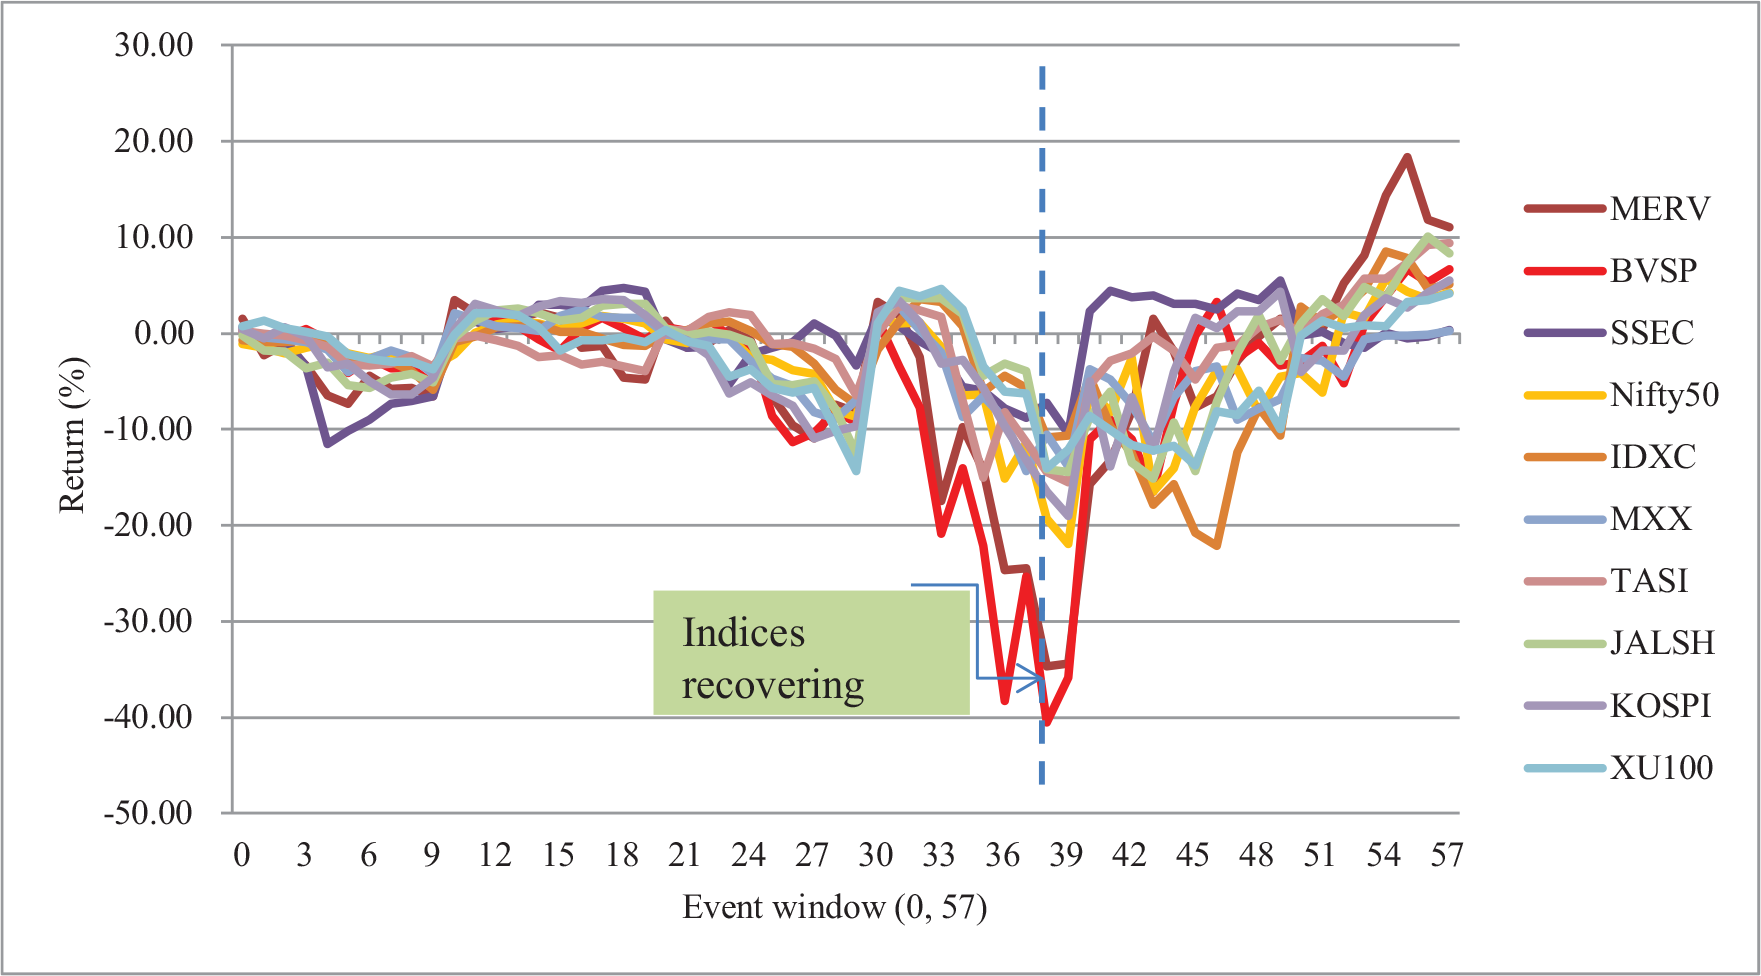
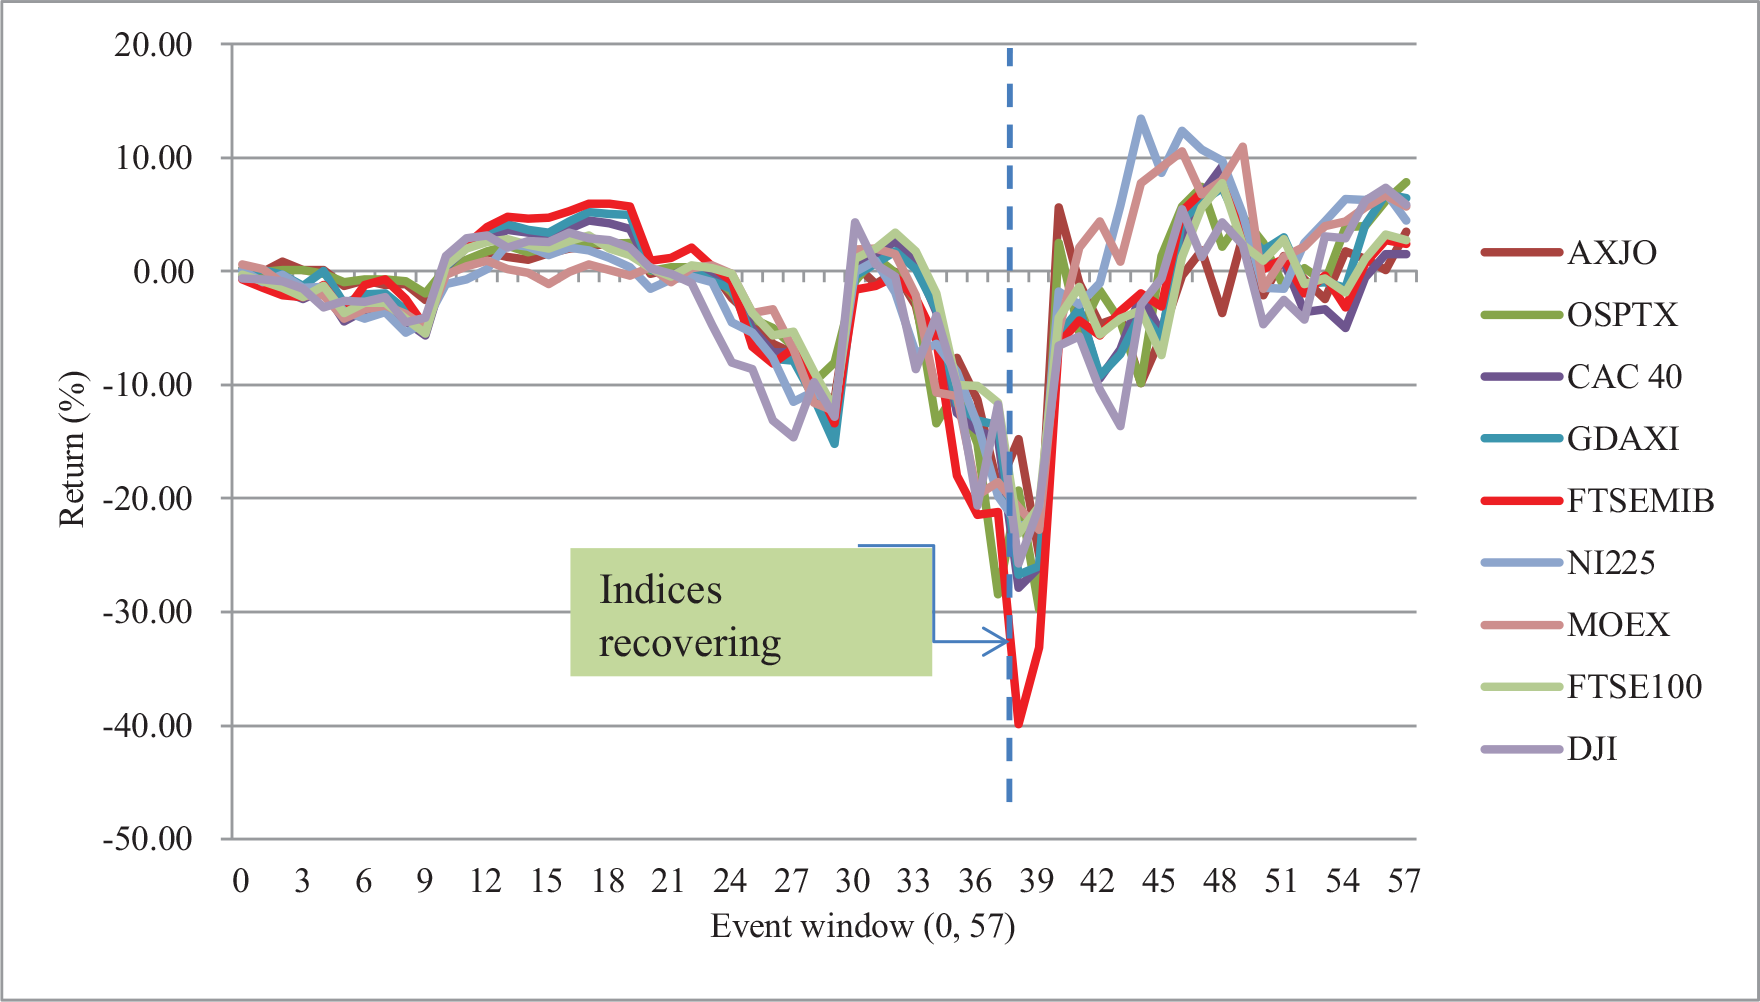
ARs of indices in developing and developed G-20 economies are depicted in Figures 2 and 3, respectively, from day 0 to day 57. All the indices show a high fluctuation in AR from day 0 to 57. Figure 2 shows that after the breaking news in the media, the Chinese market fluctuated more than the other developing markets. In the case of developing economies, BVSP, IDXC, Nifty50, SSEC, XU100, MERV, JALSH and KOSPI showed the highest variation in AR. After day 24, the stock market responded more rapidly to the outbreak of COVID-19. High volatility is seen in the Brazil, Indonesia and India stock markets; on the other hand, China showed less volatility in the SSEC index. The COVID-19 outbreak in Brazil post day 33 to event day causes the high volatility in Brazilian stock market. During the event window (0–57), the outbreak weakened the stock markets in Turkey, India and Indonesia. With respect to developed economies, AR from day 0 to day 57 highly fluctuated. The wave of COVID-19 weakened the stock markets in Italy, the UK, Germany, the USA and Canada. After the outbreak, on day 36 in Italy and day 38 in the UK, the ARs of FTSEMIB and FTSE100 reported the highest negative values. After a rapid outbreak in Europe, the Russian market (MOEX) showed high negative ARs.
Cumulative Abnormal Return of G-20 Indices
Cumulative Abnormal Return in the Event Window (0–9)
Daily ARs corresponding to G-20 indices are aggregated to derive the CAR in the coronavirus-affected developing and developed economies (see Tables 4–9). Table 4 depicts the CAR for days 0–9 of the G-20 stock market indices. In the first 10 days of the full event window, all indices over the world generated negative CARs because of the breaking news of the outbreak of the novel coronavirus in the media. In the event window (0–9), the stock market of China responded most negatively to the COVID-19 outbreak. During this event window, the SSEC fell by −6.57 per cent, the highest among all the G-20 indices, which is significant at the 1 per cent level of significance. In the event window (0–9), Argentina, Indonesia, Brazil, South Africa, France and the UK reported significant negative CARs more than 5 per cent. The US DJI reported a negative CAR of –4.07 per cent (significant at 10%). During this event window, the outbreak of news about the coronavirus spread fear among stock markets around the G-20 developing and developed economies.
Cumulative Abnormal Return in the Event Window (10–19)
Table 5 presents the performance of stock market indices in developing and developed economies over 10 trading days 10 days post the outbreak of the news. In this event window (10–19), the major stock markets recovered and absorbed the outbreak of news of COVID-19 to some extent. SSEC, OSPTX, GDAXI and FTSEMIB earned significant positive CARs of 4.38 per cent, 2.48 per cent, 5 per cent and 5.73 per cent, respectively. Nifty50, MXX, JALSH, KOSPI, AXJO, CAC40, NI225, FTSE100 and DJI recovered with CARs of 0.99 per cent, 1.64 per cent, 3.10 per cent, 1.91 per cent, 2.39 per cent, 3.75 per cent, 0.39 per cent, 1.39 per cent and 2.10 per cent, respectively. On the other hand, the indices in Argentina, Brazil, Indonesia, Saudi Arabia, Turkey and Russia probably followed the noise trading and panic selling that caused their negative CARs. The indices in developed economies recovered faster during this event window (10–19) than those in developing countries.
CAR in Event Window (0–9) for G-20 Indices
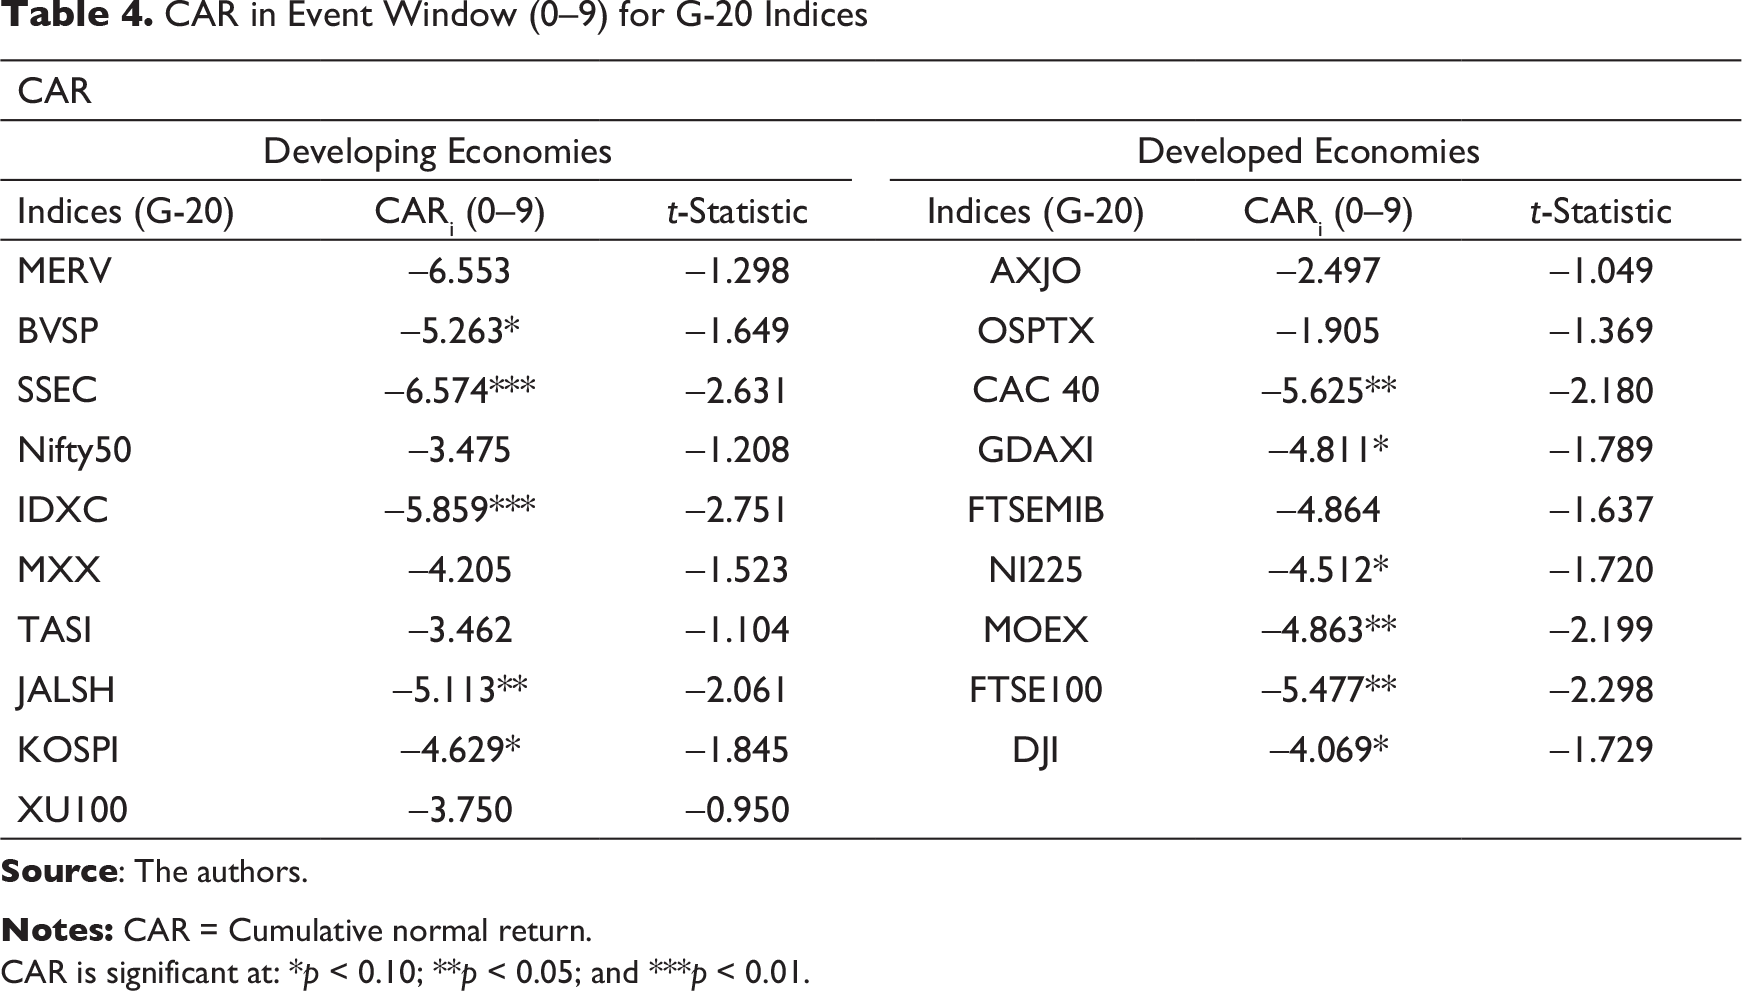
CAR is significant at: *p < 0.10; **p < 0.05; and ***p < 0.01.
CAR in Event Window (10–19) for G-20 Indices
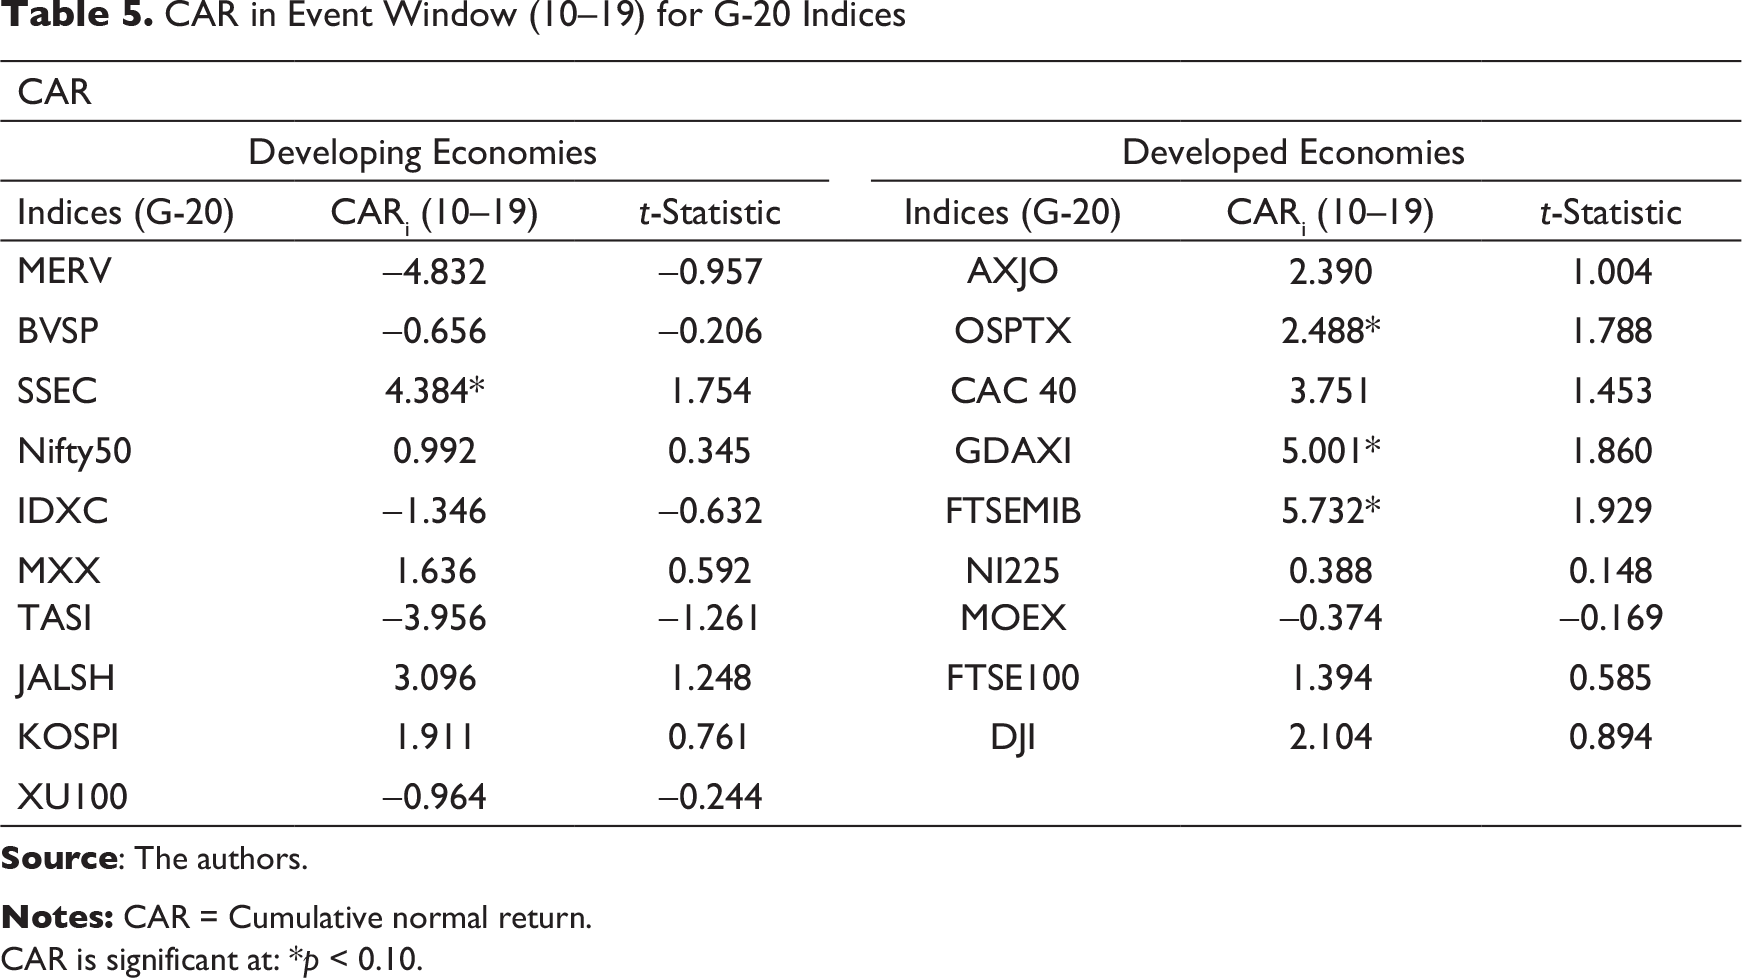
CAR is significant at: *p < 0.10.
Cumulative Abnormal Return in the Event Window (20–29)
Table 6 shows negative CARs during the event window (20–29) for all the market indices. As Figure 2 shows, the major wave of COVID-19 started in Turkey. In this event window, indices in developed countries significantly went down, by more than –11 per cent, in Australia, France, Germany, Italy, Japan, Russia, the UK and the USA. In developing economies, the major indices in Turkey, South Africa, Brazil, South Korea, India and Argentina significantly decreased, by −14.35 per cent, −12.58 per cent, −9.25 per cent, −9.65 per cent, −8.71 per cent and −8.23 per cent, respectively. In mid-March 2020, more than 6 weeks after the Chinese leadership shut down the world’s second-largest economy to stop a relentless coronavirus outbreak, factories started reopening and offices started to function (The New York Times, 2020). Unlocking the economy facilitated a revival in the Chinese stock markets, and therefore SSEC reported a CAR of −3.31 per cent, which was significantly lower than that of other countries’ indices. More specifically, during this event window, indices in developed economies responded negatively and rapidly as the wave of coronavirus cases started in the European continent.
Cumulative Abnormal Return in the Event Window (30–39)
Table 7 shows CARs in the event window (30–39) for indices in G-20 economies. The major outbreaks of COVID-19 in Brazil, Italy, the UK and Germany (see Figures 1 and 2), and in many other countries, caused high volatility and fear across the world stock markets. In this event window, indices in all G-20 economies reported a significant negative CAR. Indices in developed countries reported CARs of more than −20 per cent. The CARs for all the indices were significant at the 1 per cent level of significance. Major outbreaks were experienced in Italy and the UK; therefore, FTSEMIB and FTSE100 reported CARs of −33.11 per cent and −20.69 per cent, respectively, in this event window. Argentina and Brazil responded more negatively to the spread of coronavirus in the world, as MERV and BVSP showed CARs of −34.35 per cent and −35.87 per cent, respectively. In this event window, indices in Canada, Australia, France, Germany, Japan, Russia, the US, India, South Korea, South Africa, Turkey and Saudi Arabia reported CARs of −29.73 per cent, −25.00 per cent, −26.09 per cent, −26.01 per cent, −22.43 per cent, −22.80 per cent, −20.70 per cent, −21.90 per cent, −19.02 per cent, −14.47 per cent, −12.12 per cent and −15.50 per cent, respectively. In the case of China, SSEC reported a CAR of −10.48 per cent, which was very low compared to that of other countries’ indices, because China had resumed its economic activities. More specifically, in that event window, Chinese market experiences less downfall compared to other countries stock markets.
CAR in Event Window (20–29) for G-20 Indices
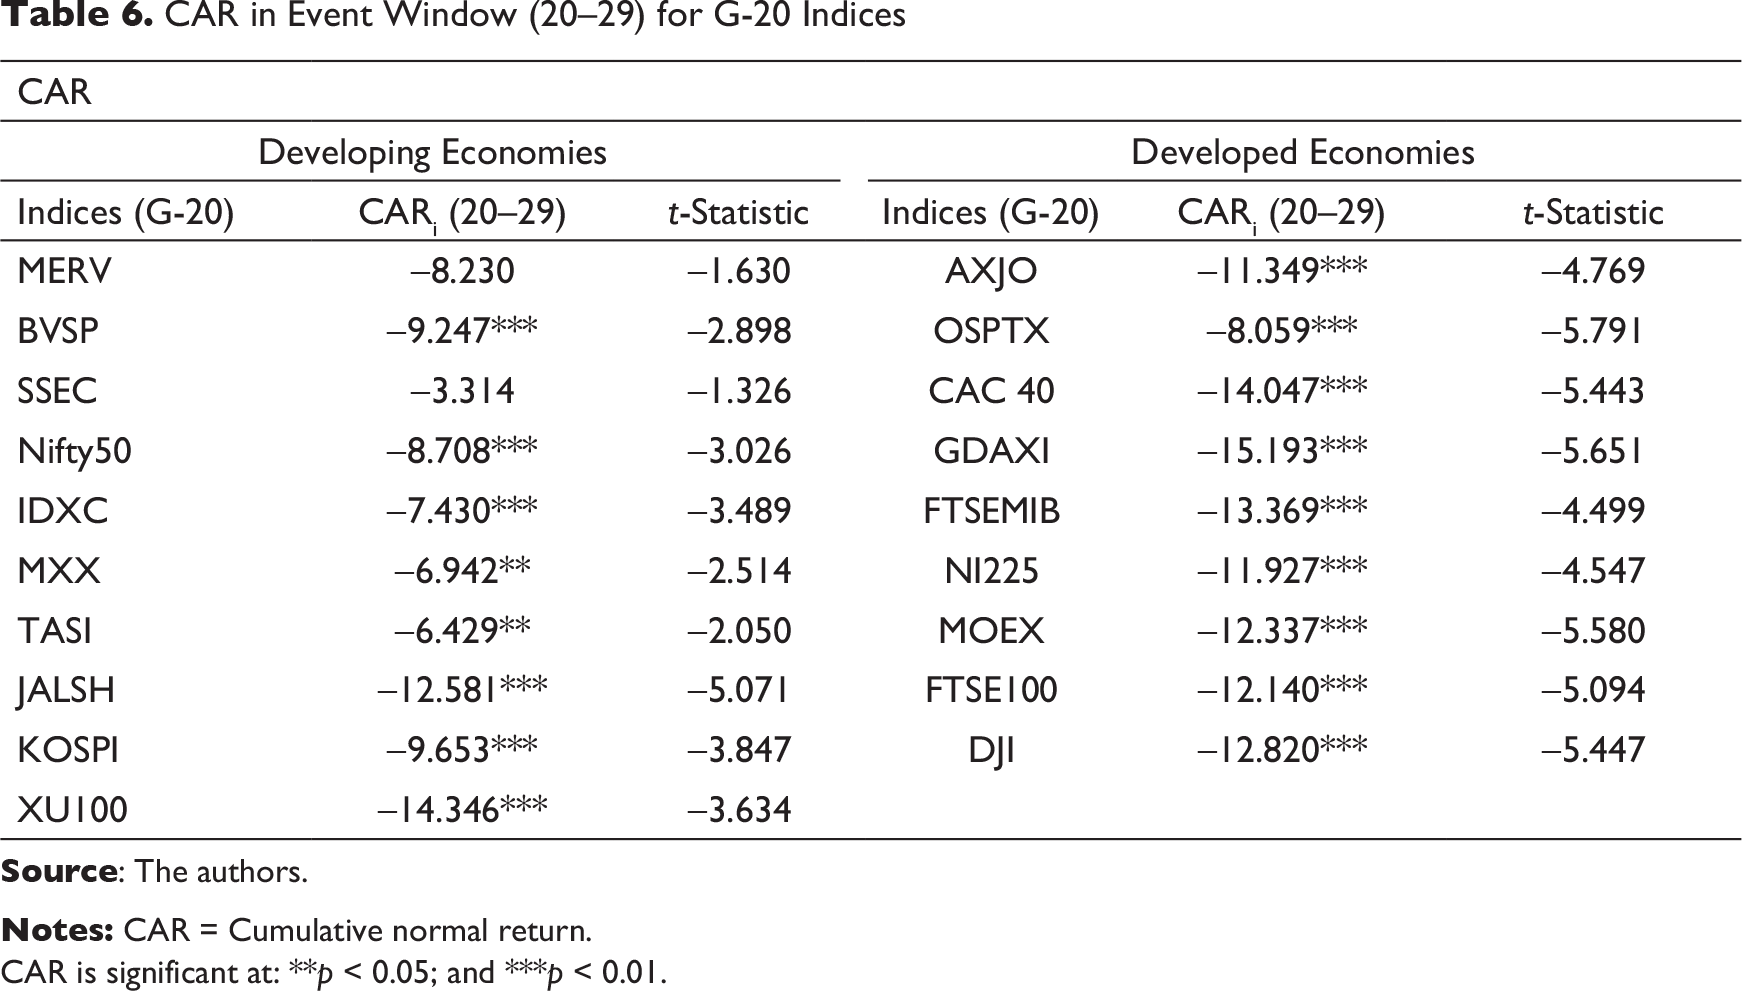
CAR is significant at: **p < 0.05; and ***p < 0.01.
CAR in Event Window (30–39) for G-20 Indices
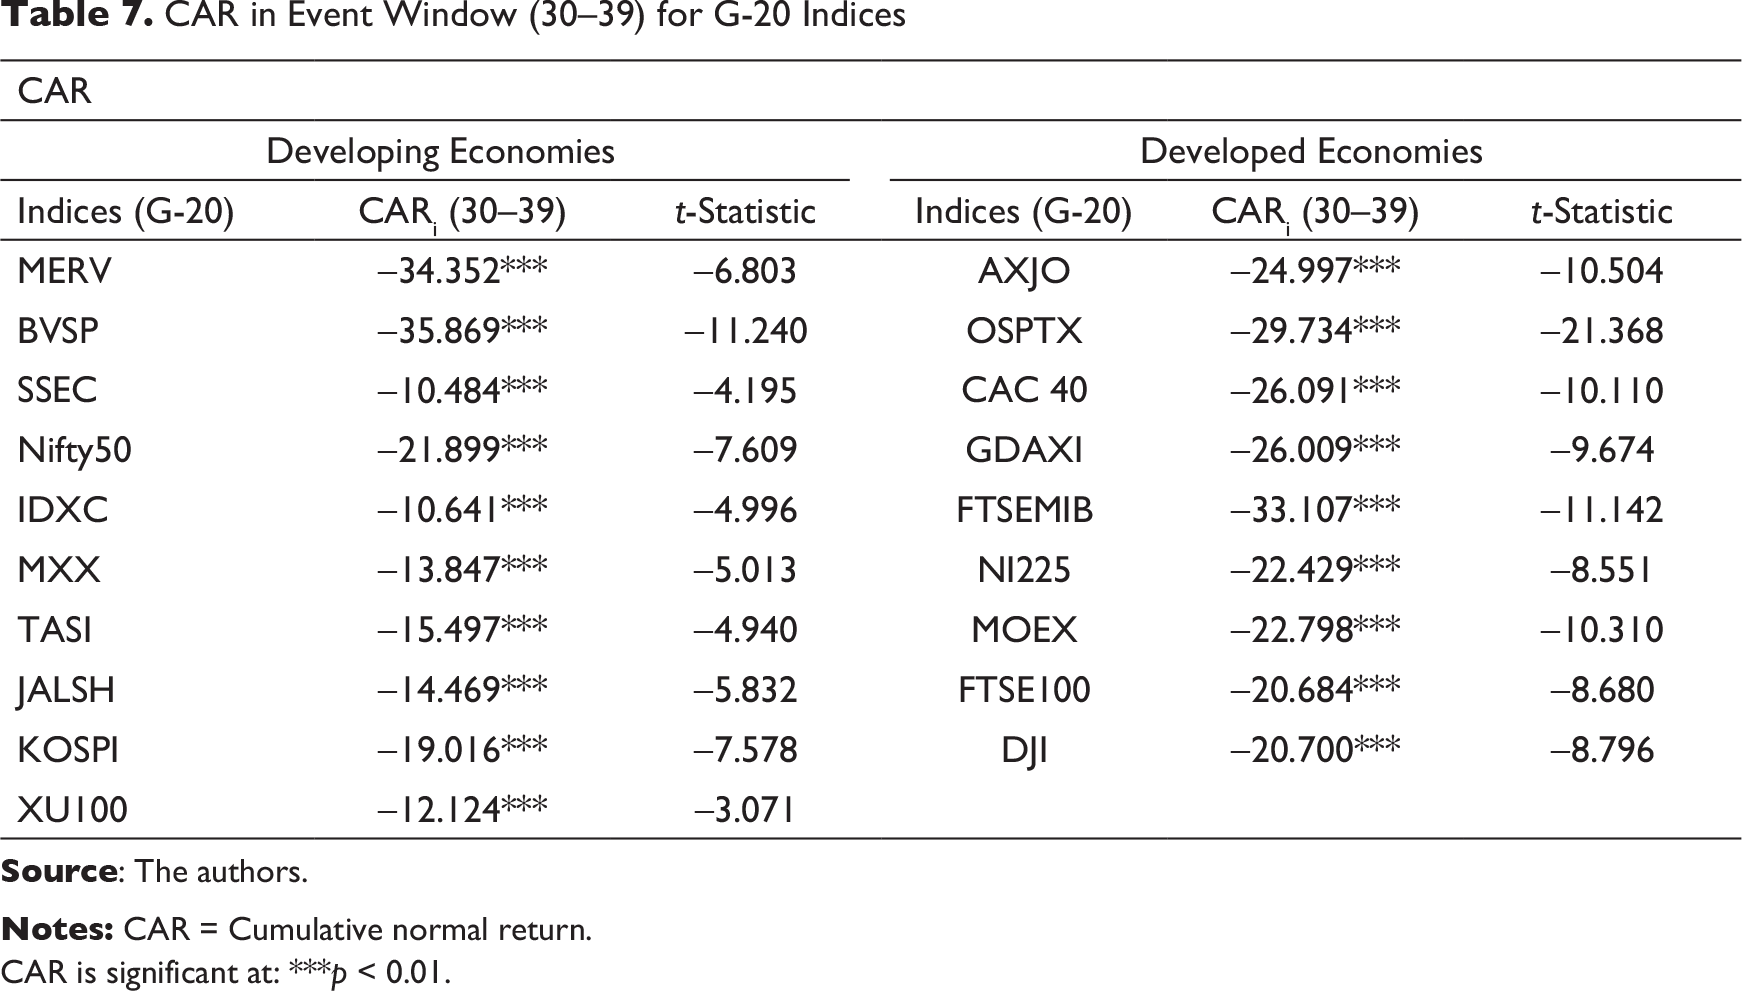
CAR is significant at: ***p < 0.01.
Cumulative Abnormal Return in the Event Window (40–49)
In the event window (40–49), the major indices in developing and developed economies showed positive CARs after reporting a 52-week low in stock markets (see Table 8). Moreover, indices in all developed economies earned positive CARs. Indices in Russia, Japan, Canada and France earned statistically and economically significant CARs of 10.99 per cent, 5.04 per cent, 4.82 per cent and 4.83 per cent, respectively. FTSEMIB, GDAXI, AXJO, FTSE100, and DJI reported CARs of 4.25 per cent, 3.54 per cent, 3.04 per cent, 2.37 per cent and 2.37 per cent, respectively. However, major indices in developing economies showed negative CARs; for instance, IDXC reported –10.70 per cent, XU100 –9.96 per cent, MXX –6.86 per cent, Nifty50 –4.47 per cent and BVSP –3.36 per cent. On the other hand, some indices generated positive CARs, such as those in Argentina, China, South Korea and Saudi Arabia. This window gives some evidence of the recovery of indices, as the majority of indices showed upward-trending CARs. These outcomes were a result of major interventions implemented by different national and international bodies to dilute the negative impact of coronavirus around the world.
Cumulative Abnormal Return in the Event Window (50–57)
Regarding CAR in the event window (50–57), Table 8 provides evidence of the recovery of stock markets in developing and developed economies. Further, Table 9 suggests that stock markets around the world re-emerged after the outbreak of the coronavirus. All indices in developing as well as developed countries showed positive CARs. Indices in Argentina, Brazil, Indonesia, Saudi Arabia, South Africa, South Korea, Canada, Germany, Japan, Russia and the USA earned significantly positive CARs of 11.09 per cent, 6.70 per cent, 5.09 per cent, 9.36 per cent, 8.33 per cent, 5.52 per cent, 7.88 per cent, 6.45 per cent, 4.49 per cent, 5.70 per cent and 5.88 per cent, respectively. This came as a result of major interventions implemented by different national and international bodies during the previous event window (40–49) to curb the COVID-19 outbreak around the world. Table 9 reports the positive sign of bringing the economies out of the trap of the coronavirus.
CAR in Event Window (40–49) for G-20 Indices
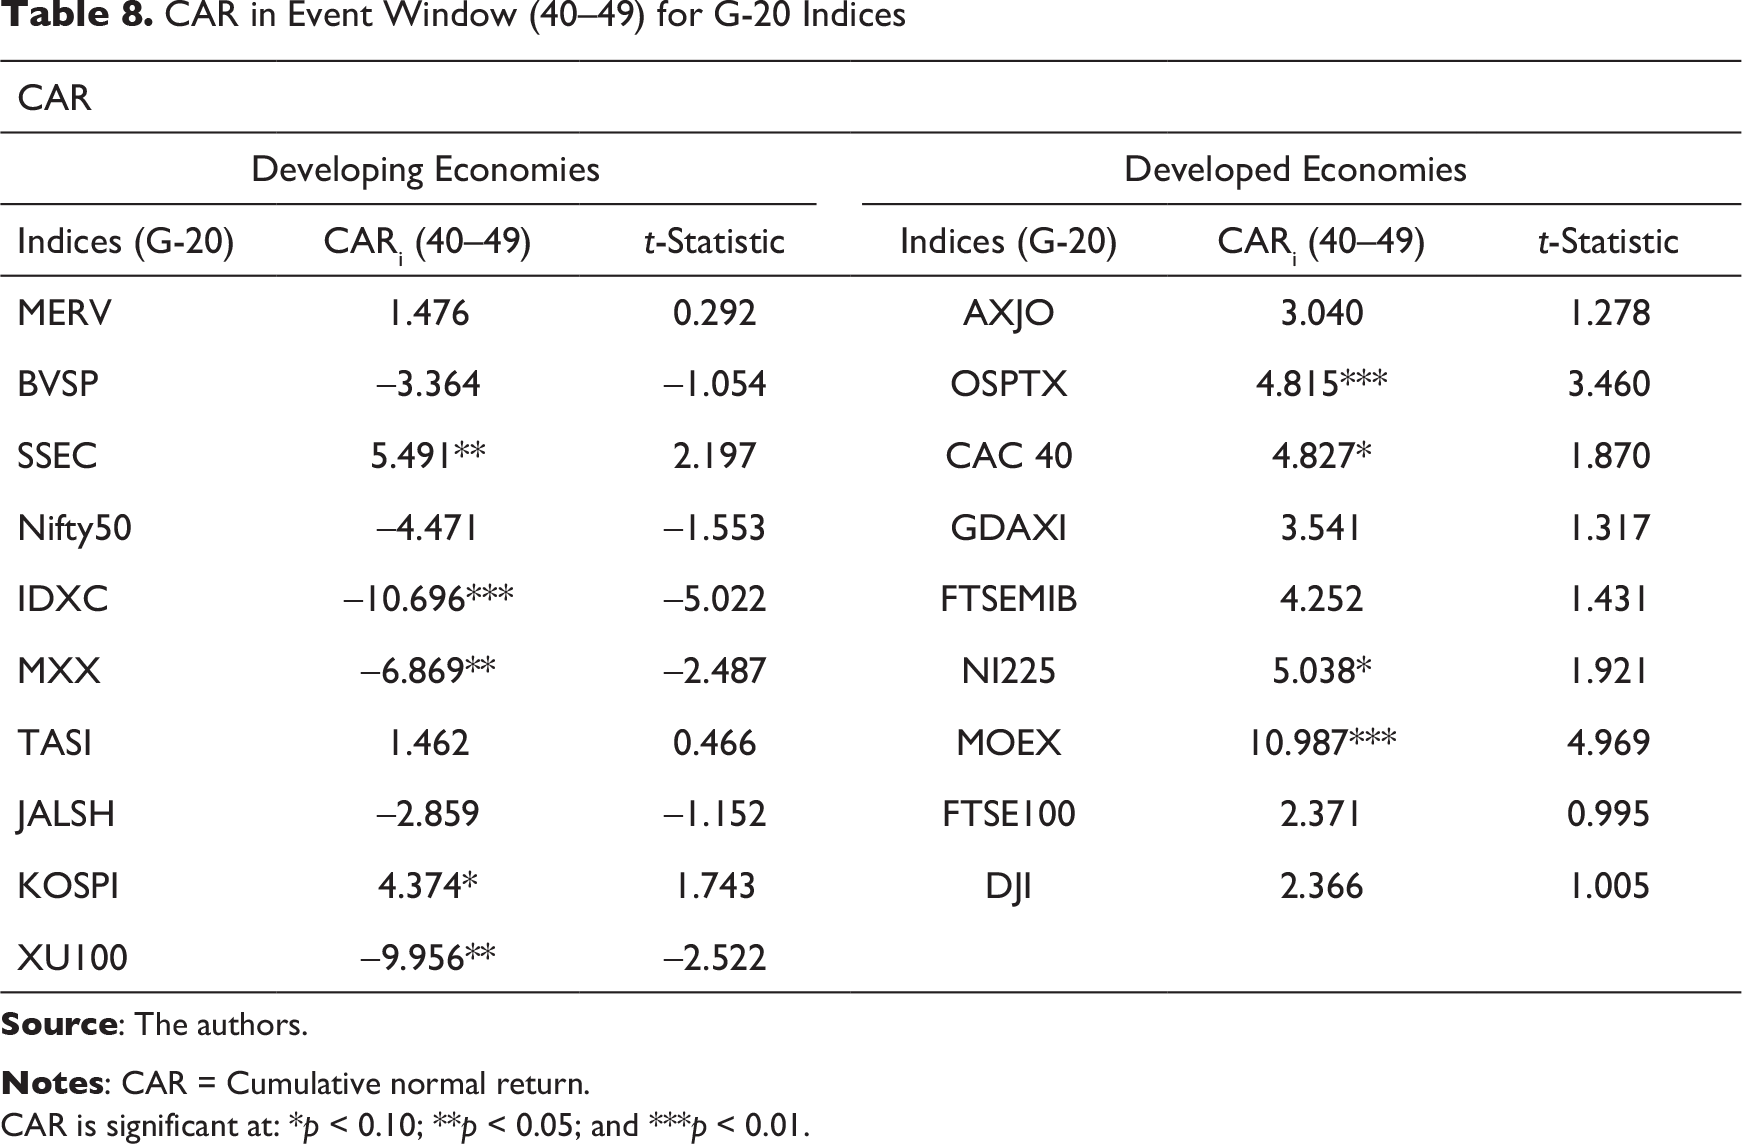
CAR is significant at: *p < 0.10; **p < 0.05; and ***p < 0.01.
CAR in Event Window (50–57) for G-20 Indices
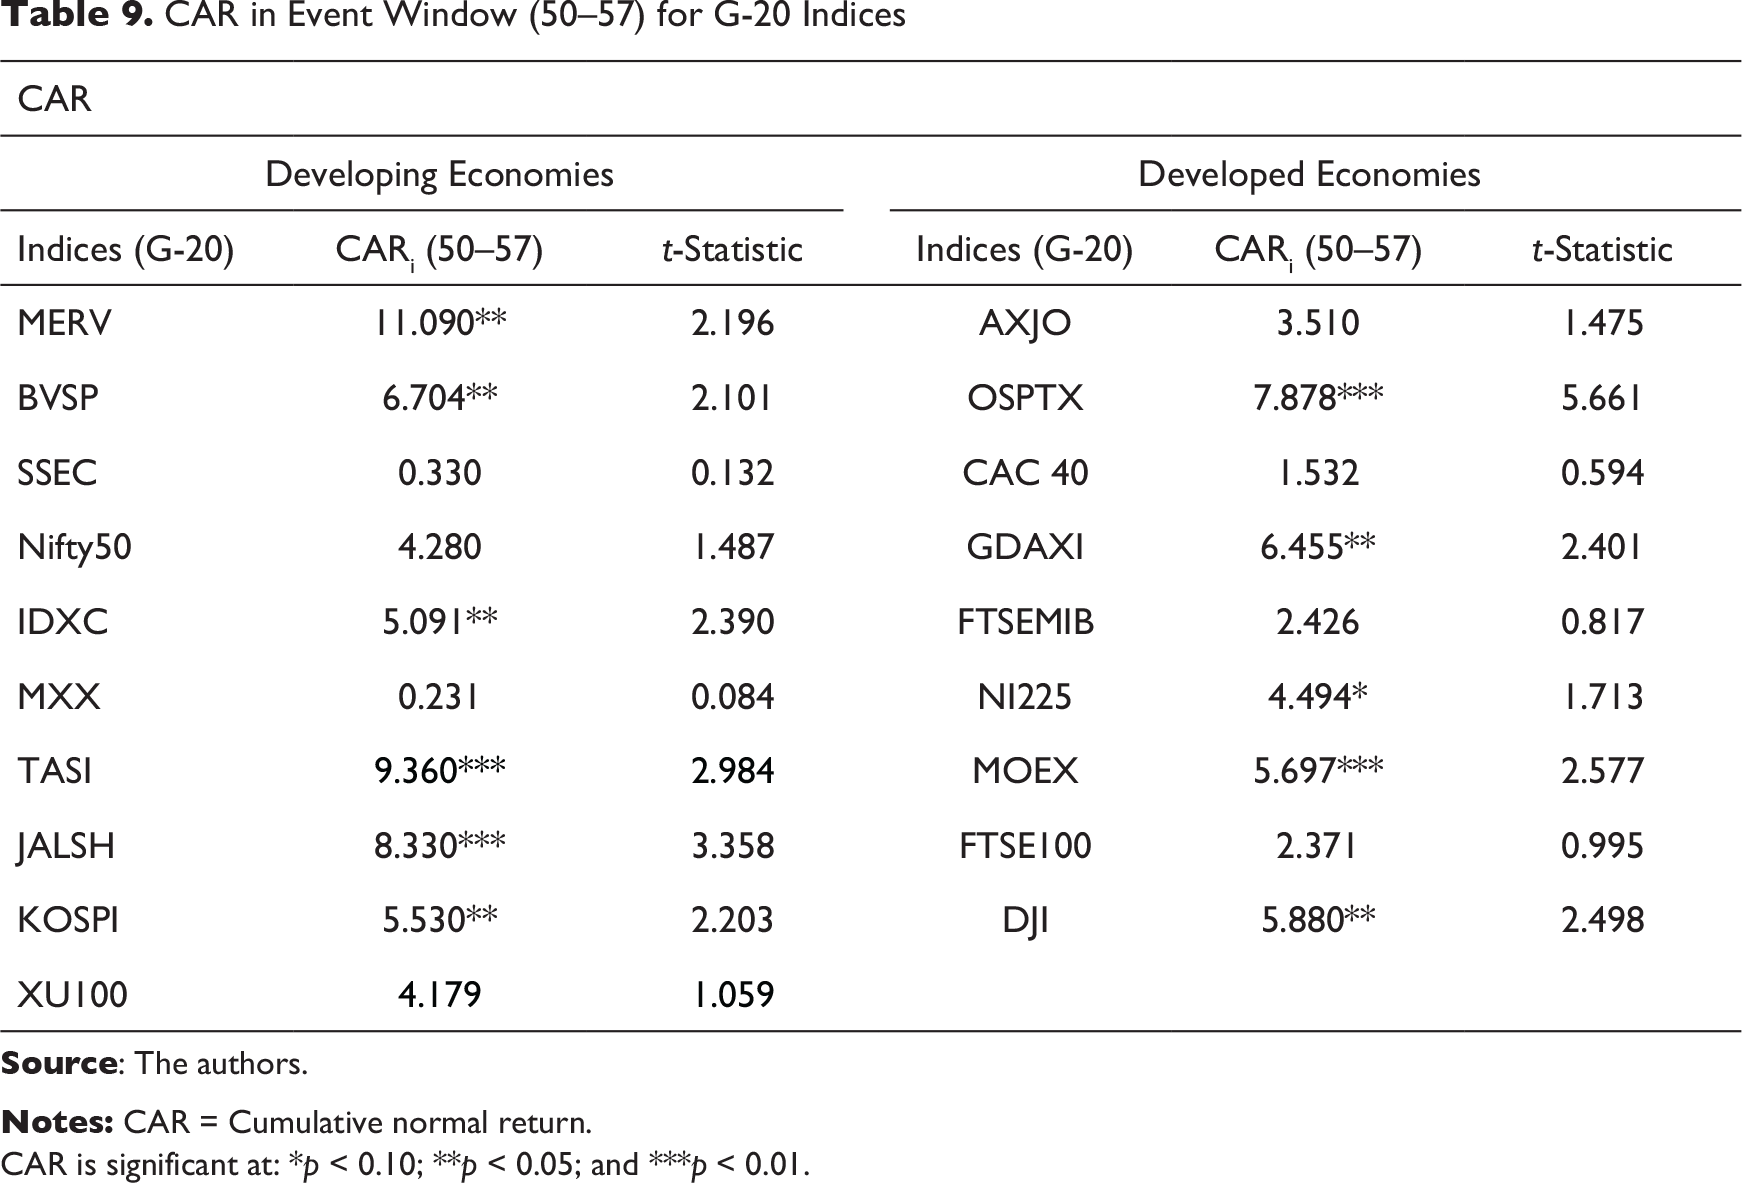
CAR is significant at: *p < 0.10; **p < 0.05; and ***p < 0.01.
Figures 4 and 5 show the whole picture of CARs in developing and developed economies from day 0 to day 57. CARs of indices started declining with an increase in the cases of the coronavirus around the world and continued declining till day 37 in developed and till day 38 in developing countries. After this point, the major indices in developing and developed economies recovered.
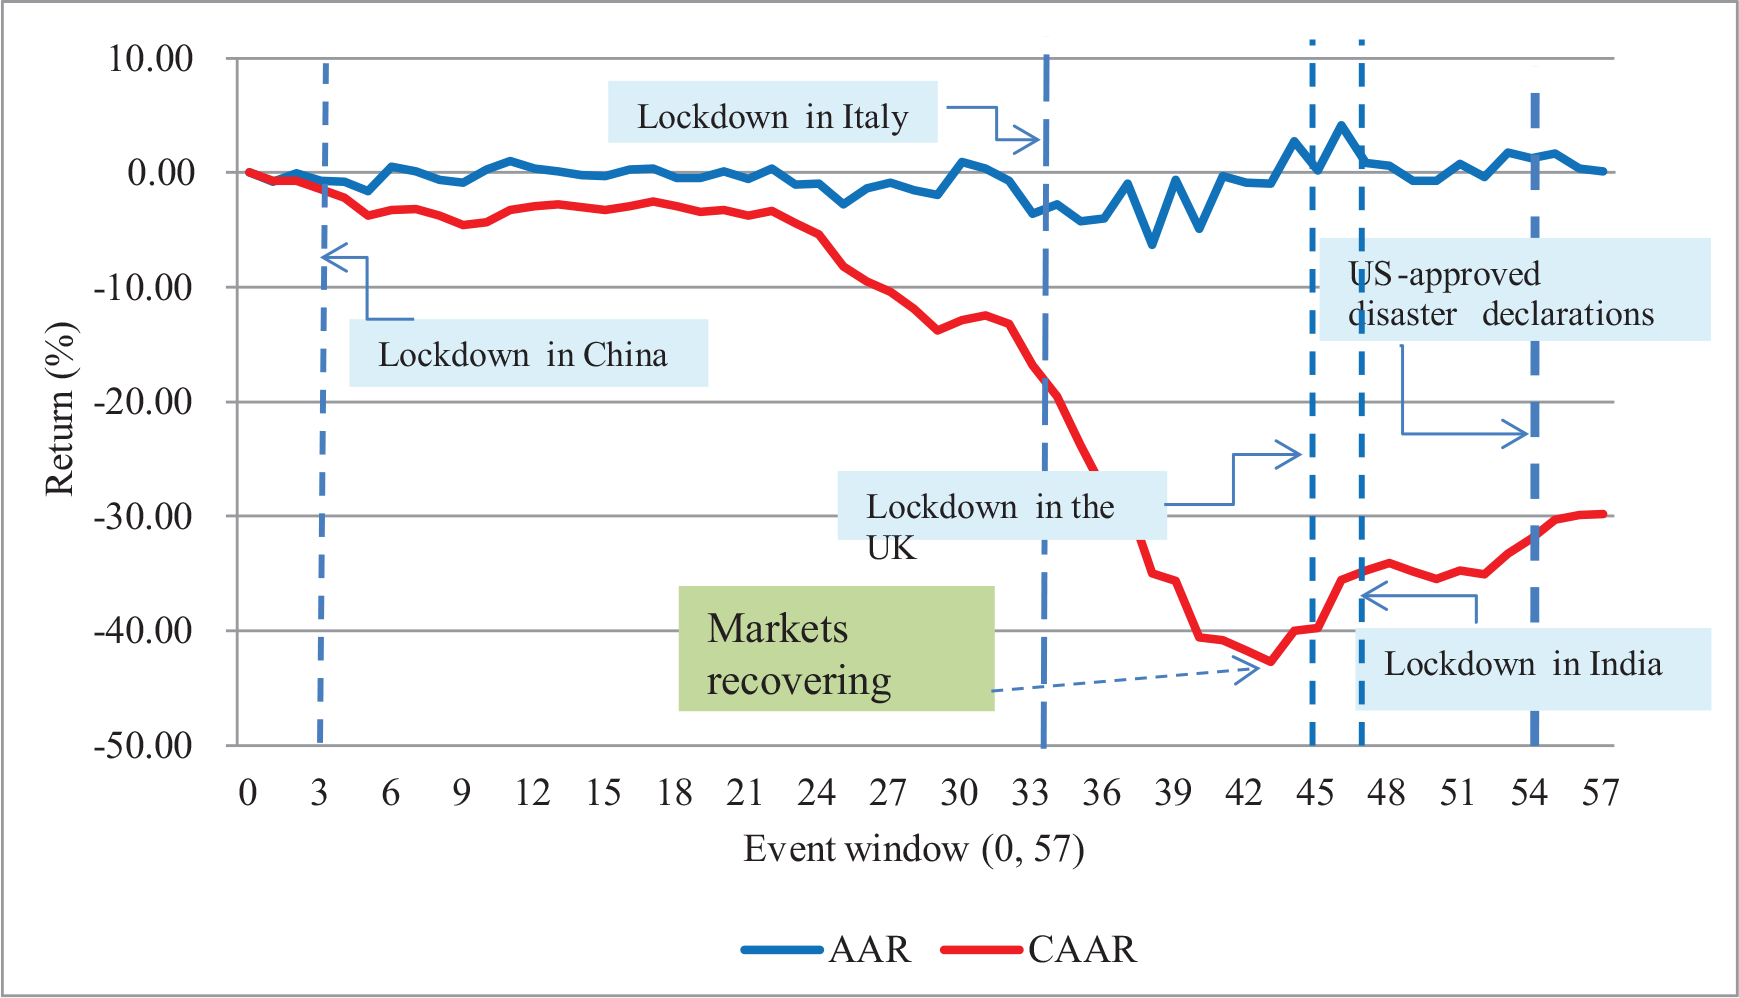
Table 10 shows AAR and CAAR of all indices from day 0 to day 57. As seen in Table 10, AAR from day 0 to day 38 decreased with the increase in panic among investors due to the outbreak of COVID-19 around the world. On day 1, AAR was significant at the 10 per cent level, showing the negative impact of the coronavirus news on stock markets all over the world. On day 38, AAR was highest negative in the entire event window (0, 57) and significant at 1% level. Daily AAR from day 23 to day 38 is significant at different levels of significance, and AAR on most days is negative.
Further, Table 10 indicates that CAAR ranged from −0.70 per cent on day 1 to −29.77 per cent on day 57. We can divide the 57 days’ CAARs into two parts to understand the behaviour of indices all over the world. The first part shows CAAR from day 0 to day 43, and the second part from day 44 to day 57. In the first part, CAAR went from −0.70 per cent to −42.69 per cent, since panic among stock markets increased as the outbreak of COVID-19 among countries increased.
In the second part, CAAR went from −42.69 per cent to −29.77 per cent, indicating the recovery of stock markets after the major setback caused by the coronavirus. Daily CAAR from day 3 to day 57 is significant at different levels of significance. As shown in Figure 6, stock markets recovered post event day 42.
AARs and CAARs of Indices in G-20 Economies
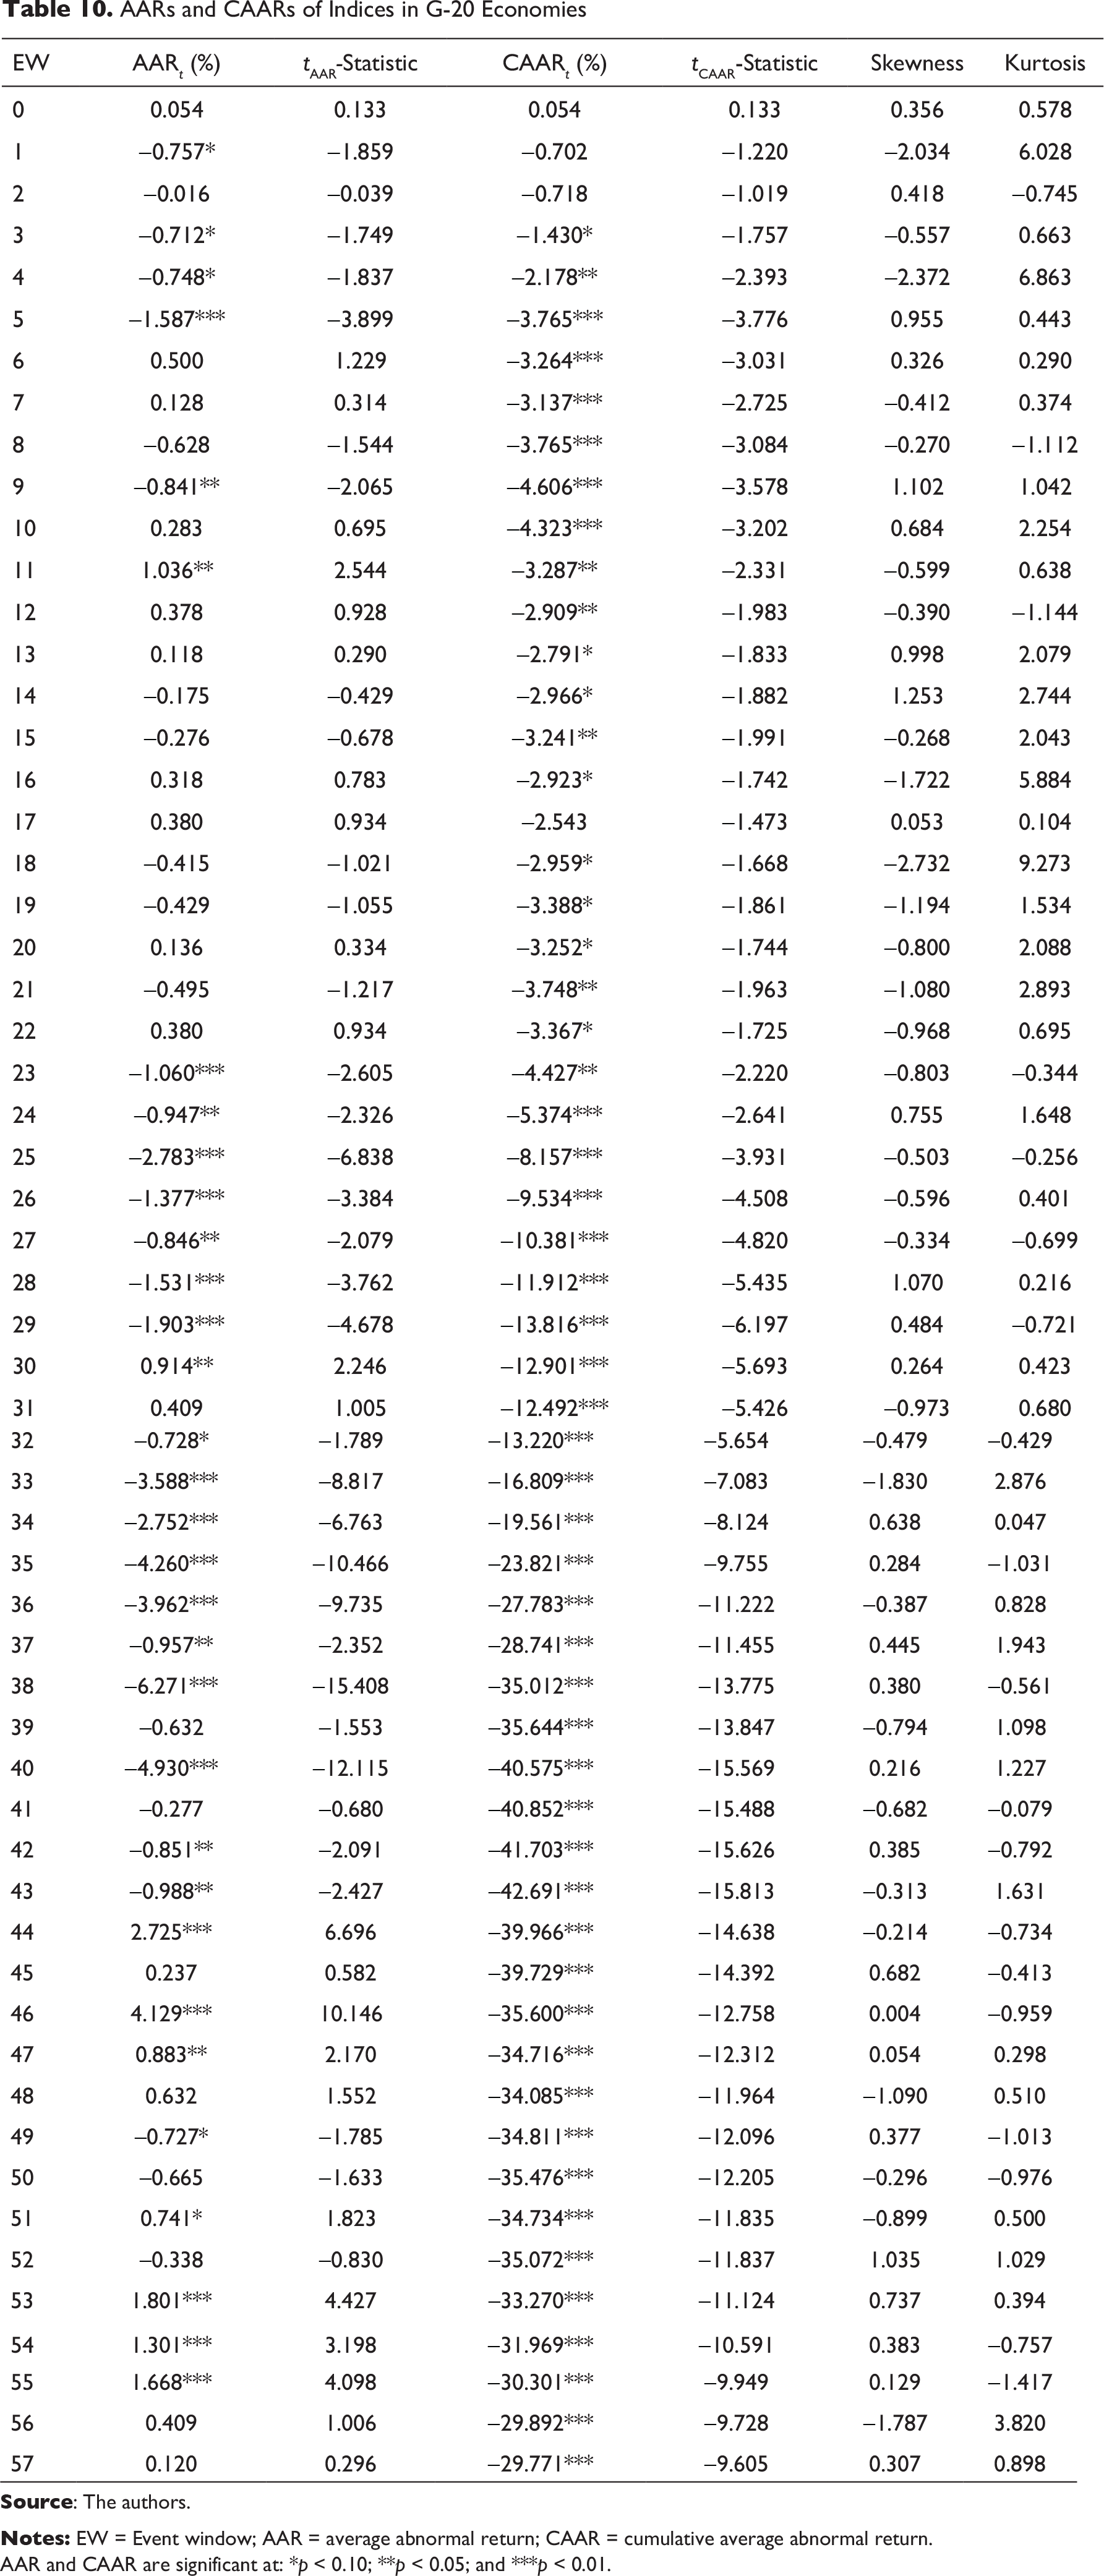
AAR and CAAR are significant at: *p < 0.10; **p < 0.05; and ***p < 0.01.
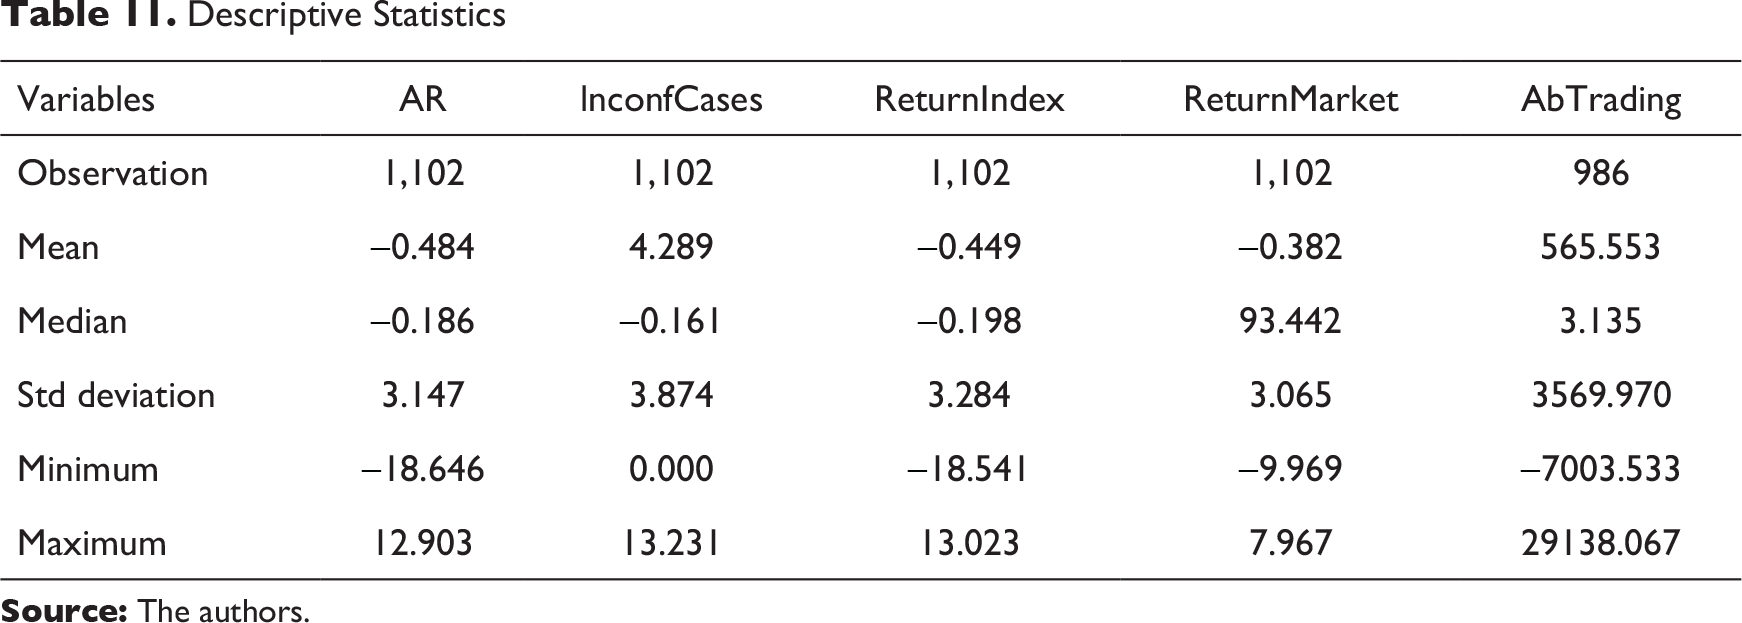
As seen in Table 11, the mean of AR, ReturnIndex and ReturnMaket all are negative after the outbreak of the coronavirus. Therefore, we propose a panel regression analysis to find the robust results. A panel data analysis is used to investigate whether there has been a decrease in abnormal return of index since the outbreak of coronavirus in a country. We take the AR of index as the dependent variable, with certain regressors for AR: confirmed cases of coronavirus, the daily return of the index, the corresponding return of the global index, abnormal trading volume and a developing economy dummy. In a market with information asymmetry and noise traders, it is difficult to explain stock market returns and volatility with the fundamentals. The heavy involvement of noise traders in the market can significantly divert asset prices from their fundamental value (De Long et al., 1989, 1990). Chordia et al. (2001) found a significant change in the trading volume and market liquidity around macroeconomic announcements. Similarly, Bradley et al. (2001), Eli and Richardson (2000) and Field and Hanka (2001) found a significant association between the trading volume and ARs around company-specific events. Trading volume represents the market activity. A large trading volume accompanied by declining stock markets indicates stressful selling in the markets. Hence, in line with extant literature, we include abnormal trading volume in our panel regression model, in addition to the number of confirmed cases of COVID-19. The developing economy dummy accounts for the difference between developed and developing countries with respect to information efficiency, income levels and other variables that differentiate the two types of economies. Return on index and market control for the performance of individual indices and the Dow Jones global indices. The panel data set comprises a cross-sectional dimension (19 indices across the G-20 countries; i = 1, 2, 3, …, 19) with a time dimension (58 trading days: t = 0, 1, 2, …, 57). A total of 1,102 observations are used to examine the relationship between the dependent and independent variables. Therefore, we strive to examine the following relationship:
Descriptive Statistics
Empirical Results of Panel Data Regression
AR = f (lnconfCases, ReturnIndex, ReturnMarket, AbTrading, DevelopingE)

where ARi,t is the AR of index i at day t, lnconfCases is the natural logarithm of confirmed coronavirus cases in country i at day t, ReturnIndex is the daily return of index i at day t, ReturnMarket is the daily return of Dow Jon Global Index corresponding to country-specific index i at day t, and AbTrading is the abnormal trading volume corresponding to index i at day t. Later, we set the dummy variable DevelopingE to group the market indices to see whether the outbreak of coronavirus in developing economies significantly affects AR. Then, if the index belongs to developing economies, developing economy is assigned a value of 1, and 0 otherwise.
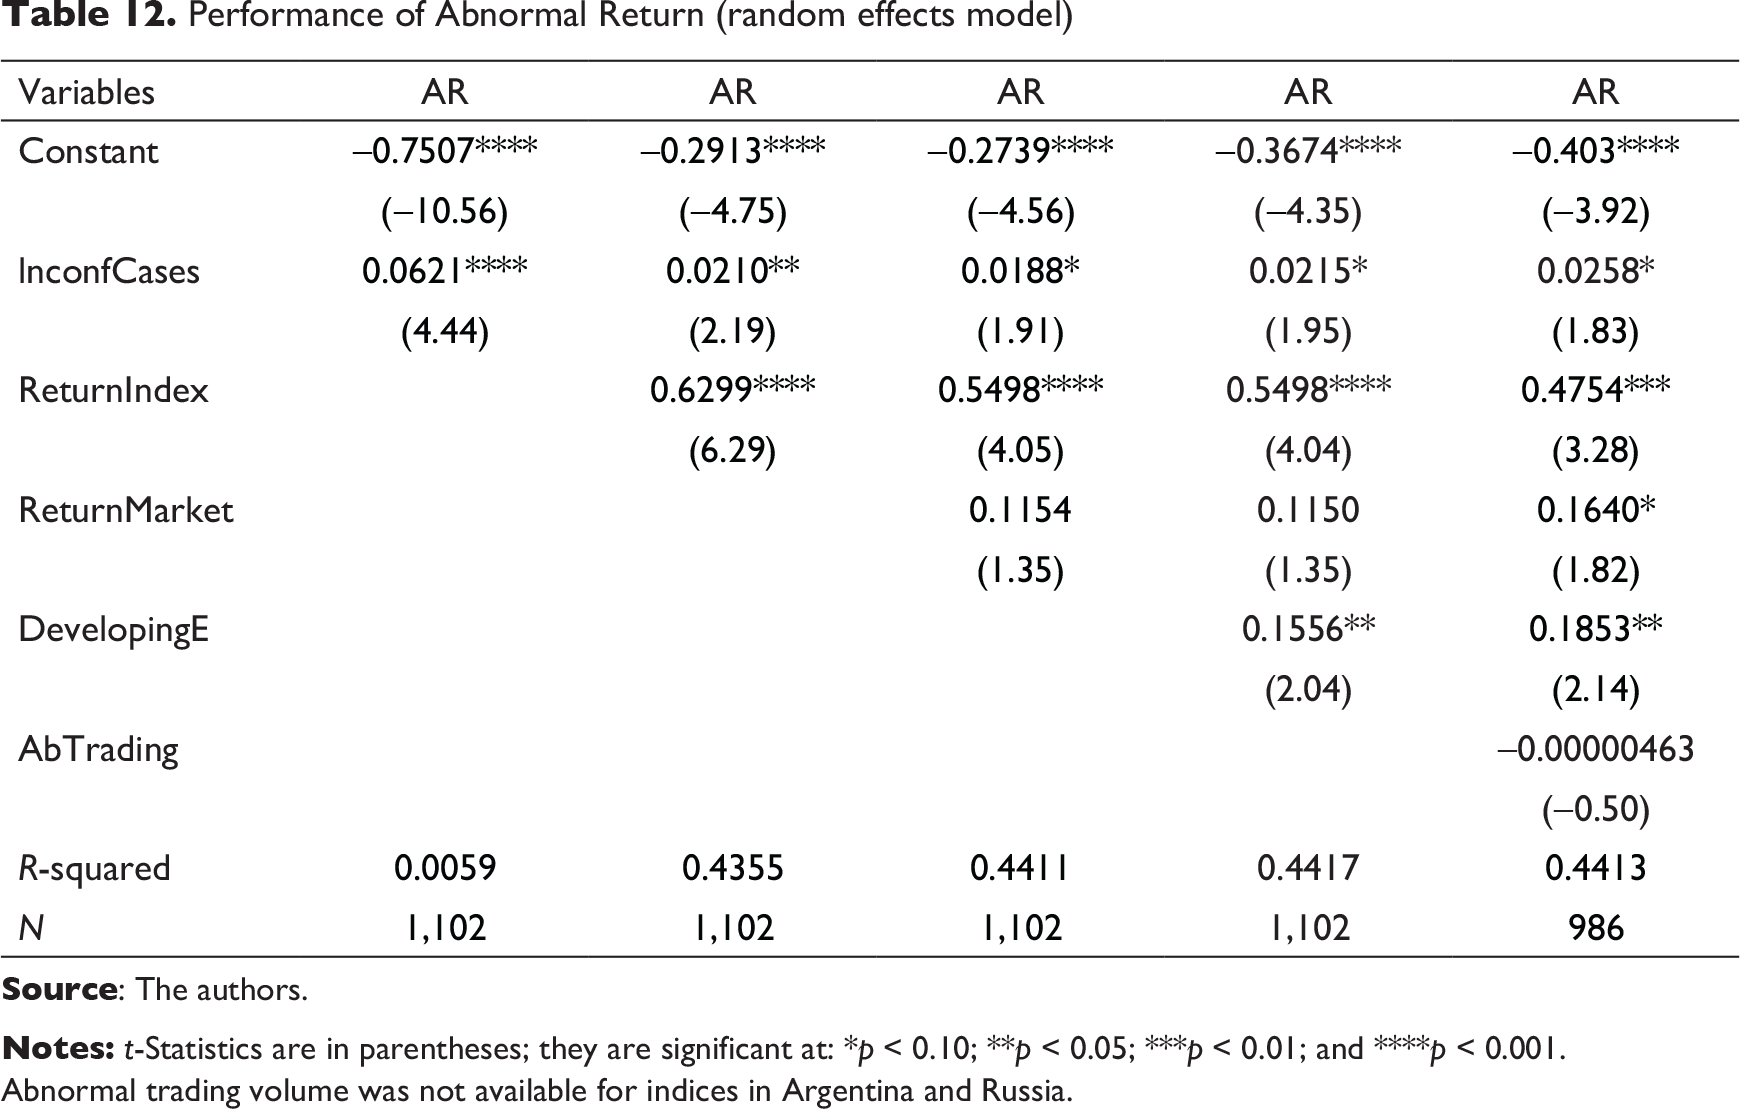
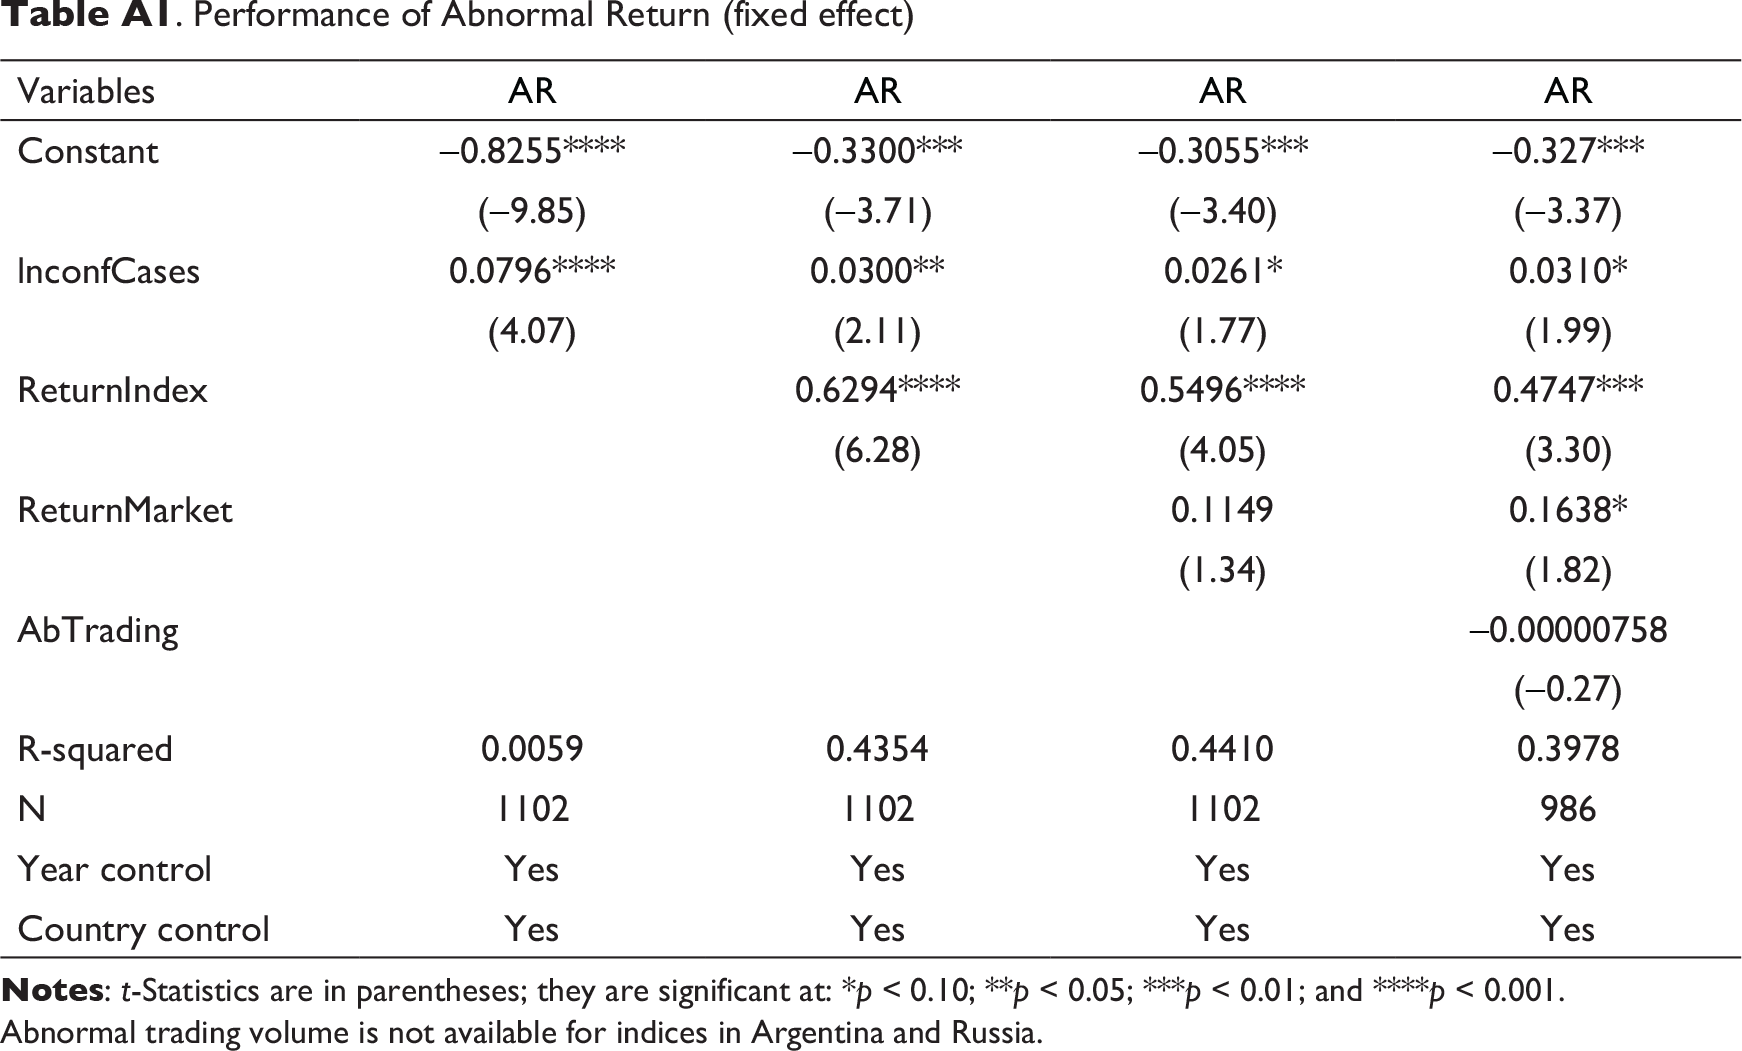
The results’ analysis with a fixed effects model (see Table A1) does not support the dummy variable DevelopingE. Then, we analyse the data with a random effects model; the results of the analysis with AR as the dependent variable are given in Table 12. The constant coefficient is significant and negative, which indicates AR will be negative in the absence of other variables. Against the expectation, the coefficient of confirmed cases is significant and positive, which reveals the effect of the coronavirus on ARs. As earlier discussed in Tables 8–10, the market indices are recovering. The results reported in Table 12 are consistent with the results of the event study and confirm the notion of investor ORH and the resulting recovery in the stock markets. As expected, coefficients of the daily AR of the indices and global index are positive, which means indices in G-20 countries are following the global index after the outbreak of COVID-19, which indicates co-movement in the stock markets. The coefficient of dummy variable DevelopingE is positive, implying that indices in developing economies are recovering. Further, the coefficient of abnormal trading volume is not significant, hence not confirming any observable pattern in trading volume with respect to the index returns.
Performance of Abnormal Return (random effects model)
Abnormal trading volume was not available for indices in Argentina and Russia.
Conclusion and Managerial Implications
The COVID-19 outbreak has wreaked havoc all over the world. In view of the current pandemic, the majority of economic activities across the globe remain halted. As a result, all the major macroeconomic indicators are showing gloomy future scenarios. The immediate effect or financial implications of COVID-19 can be felt through stock market fluctuations.
In view of this, we analyse the impact of the COVID-19 outbreak on the stock market using an extensive sample of G-20 countries. Our results reveal that post the COVID-19 outbreak, stock markets all over the world performed badly and experienced negative returns, as indicated by Table 10. However, in the later stages of the event window, we discover, the stock markets were gradually recovering from the setback of the coronavirus outbreak, as indicated by positive CARs. The results of panel data regression also report evidence in support of the stock market recovery after the negative impact of COVID-19. Overall, our results suggest that future uncertainty due to the COVID-19 outbreak, initially, caused panic selling in stock markets across the globe. Now, stock markets are experiencing the influx of capital, which is facilitating their recovery. The article has practical implications for decision-makers such as central banks, stock market regulators, investors and government authorities. The confirmation of ORH suggests that investors make rational decisions and central banks, stock market regulators and government officials in the G-20 countries introduce further interventions to boost confidence among investors. Finally, markets are driven by noise trading in this period of uncertainty. There is a need to delve into market volatility, considering the noise trading theory, and we suggest that this can be investigated in the coming research studies. Our study suggests that investors could adopt long-term investment strategies in weakened market conditions, and the suitable response would be to buy stocks.
Annexure A
Performance of Abnormal Return (fixed effect)
Abnormal trading volume is not available for indices in Argentina and Russia.
Footnotes
Acknowledgement
We are thankful to Professor (Rtd.) Ajit Singh Boora, former Dean and Director, Institute of Management Studies and Research, Maharshi Dayanand University, Rohtak, for his insights and suggestions. The authors are grateful to the editor of Global Business Review and the anonymous referees for their extremely useful suggestions to improve the quality of the article. All usual disclaimers apply.
Declaration of Conflicting Interests
The authors declared no potential conflicts of interest with respect to the research, authorship and/or publication of this article.
Funding
The authors received no financial support for conducting research, authorship and/or publication of this article.