
Abstract
COVID-19 quickly spread all over the world and dramatically affected the financial markets in almost everycountry. Its spread created havoc in the market, and investors fearing risk suffereda significant amount of financialloss in a very short time. This article aims to analyze the impact of COVID-19 on stock markets in the top six affected countries based on the total number of cases confirmed. In addition, it also analyzes the stock market volatility caused by the virus and the abnormal returns generated by the markets during the pandemic. We employevent study methodology in different sub-periods to examine the most volatile event periods with the daily rise in the Covid cases and subsequent returns generated by the markets during these sub-periodsin relation to the daily rise in the case. The increase in volatility and the presence of significant abnormal returns among the sample indices show the impact of COVID-19 on stock markets. The result reveals that Brazilian stock indices show the highest decline among the selected countries, with a fall of more than 50% during the pandemic, while Mexican indices show the lowest fall of around 30% during the same period.
Introduction
Globally, COVID-19 cases have crossedthe 100 million mark with more than 2 million deaths. This is one of the deadliest pandemics in recent times, which not only caused loss of human lives but also led to billions of dollars of loss to world economies. Many economies saw historic contractions and disruptions in financial and labor markets. At the beginning of 2020, the virus was believed to be a China-specific problem, and people outside China hardly discerned it as a major concern. But with the rapid spread of the disease and the subsequent declaration of the virus as a pandemic by (World Health Organization [WHO], 2020; Sohrabi et al., 2020) on March 11, 2020, the attention shifted dramatically and people were gripped by fear and uncertainty. Investors all around the world initially shunned stocks with China’s exposure, and with the spread of disease, markets weighed the economic consequences of these crises on firms (Ramelli & Wagner, 2020).
The first half of the year 2020 saw one of the most dramatic stock market crashes in history. The crash was caused by the virus that originated in Wuhan, China. The first case of COVID-19 was reported in December 2019 in Wuhan city. Initially, it was not believed that this virus could be deadly and could spread to every part of the world. The rapid spread of the virus across the globe and the subsequent fear it created finally led to the halt ofvarious economic activities. Many countries imposed strict lockdowns to contain the further spread of the virus and halted all major economic operations, which ultimately were received negatively by stock markets, hence the inevitable market crash in March 2020. Stocks generally react to events that may be perceived either positively or negatively by investors and traders, depending on the type of event. But black swan events like COVID-19 are rare, unlike corporate events, and very limited research has been carried out to study the impact of such events. Stocks across the sectors reacted differently to COVID-19 based on the effect it has on the operations of the business, for example, in S&P 1,500 sample sectors like natural gas, food, healthcare, and software stocks earned positively higher returns as compared to shares in petroleum, real estate, entertainment, and hospitality sectors which fell drastically (Mazur et al., 2020). Similarly, the effect of COVID-19 on the US economy is more lethal than that of the Spanish Flu of 1918–1919 (Baker et al., 2020). These kinds of events provide us with an opportunity to learn more about the psychology of investors and human behavior in the context of crises. COVID-19 not only created havoc around the world but also shattered the lives of people. Many people lost their loved ones, many lost their jobs and millions of people around the world were pushed into poverty. At the macro level, many economies shrunk by a quarter or more of their GDP values. The uncertainty and fear created by COVID-19 remain due to the non-availability of vaccines so far in many countries.
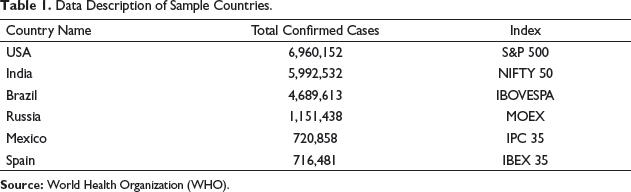
This study aims to analyze the effect of COVID-19 on six major indices from the most affected countries by the virus. These countries include the USA, India, Brazil, Mexico, Russia, and Spain. Even though Peru and Columbia also fall into the top affected countries by COVID-19, due to the inconsistent data availability for major stock indices in these countries, we have omitted them. COVID-19 increased volatility and led to panic trading in many major indices. US S&P 500 was halted many times during March 2020 when it fell by 7% or more (Bloom et al., 2020; Shieber & Crichton, 2020). Similarly, the Indian indices NIFTY 50 and Sensex were halted twice in 15 days in March 2020 when the market fell by 10% (Dasgupta, 2020).Therefore, this study tries to document the overall market response by applying event study methodology in these six affected countries.
The remainder of the article is structured as follows: the second section discusses a detailed review of the literature, followed by the data and econometric model in the third section. The fourth and fifth sections present the results and discussion, and conclusion and policy implications, respectively.
Literature Review
The World Health Organization (WHO) declared the COVID-19 virus a global pandemic on March 11, 2020 (WHO, 2020), and this pandemic severely impacted the financial markets all over the world, including stock markets, commodity markets, and debt markets. Amidthe pandemic, the oil price war between Saudi Arabia and Russia resulted in an oil market crash and a subsequent stock market crash all over the world. Needless to mention markets all over the world reacted to such news very resentfully. As per the report of the World Economic Forum (WEF, 2020), by the end of February 2020, the volatility in financial markets had increased manyfold due to the sell-off by investors and traders to protect their capital. This led to a crash in equity markets amounting to a loss of 30% to market capitalization which is higher compared to the global financial crises of 2009.
The reaction of stock markets to different global events has been documented by various prior studies, for instance, natural and manmade disasters (Kowalewski & Śpiewanowski, 2020), events about sports (Buhagiar et al., 2018), politics (Bash & Alsaifi, 2019) and disease outbreaks like Ebola and severe acute respiratory syndrome (SARS) (Chen et al., 2007; Ichev & Marinč, 2017). Uncertain events like the assassination of Jamal Khashoggi strongly affected the returns in Saudi stocks. This reaction was majorly found to be driven by local investors (Bash & Alsaifi, 2019). Withstanding the fact that there is adequate research available regarding the behavior of stock markets in pandemic outbreaks/diseases. It is quite obvious that some of these events have hugely impacted certain industry sectors, leaving the others with marginal impact, for instance, the effect of SARS on Taiwan’s economy showed that the tourism sector was badly affected as compared to other sectors (Chen et al., 2007). Similarly, aviation sector stocks were more reactive to news about the SARS outbreak as compared to non-aviation stocks (Loh, 2006). However, not all events have a negative impact on stock markets. Chen et al. (2009) found that hospitality sector stocks were sensitive to SARS but the stock returns of biotech companies in Taiwan had positive surprises during the SARS period. SARS was the first deadly disease of the twenty-first century. It also originated in China in November 2002 in Guangdong province. By mid-2003, it had spread to around 29 countries and 3 regions across the globe, causing 916 deaths among more than 8,000 confirmed cases. The overall impact of SARS on economic activity was short-lived, and it did not cause much disruption to trade exports, specifically for the imports of goods from mainland China (Siu & Wong, 2004). But its impact on the Chinese economy was not negligible. The estimated total loss to the Chinese tourism industry due to SARS could be US$6.0 billion and the total loss to the Chinese economy could be US$25.3 billion in 2003 amounting to about 2% of Chinese GDP in 2003 (Hai et al., 2004). Many other black swan events impact the stock market. Political events like regime change in a country give shift in economic policies and these policies changes may be perceived either way by the investors and ultimately reflect in the stock prices of firms. In a similar stance,Ang and Timmermann (2011) analyzed regime change usinga regime-switching model and suggested that with a change in regime volatility, autocorrelation and cross covariances across asset returns also change, signifying the change in investor expectations and stock returns. Murtaza et al. (2015), using event study methodology, analyzed nine political events in Pakistan from 2007 to 2012 and found that political events which brought change in government policies have shown a significant impact on stock markets in Pakistan. Incidents of terrorist attacks have been evident across the globe, and hence these kinds of events also affect the stock markets. The number of human lives lost may also affect the stock returns. Any increase in the loss of human life leads to a decrease in the market return (Aslam & Kang, 2013).
In disease outbreak events, the severity of the disease also defines the magnitude of the effect on market volatility and returns. The daily growth rate of confirmed cases and the total number of deaths related to COVID-19 significantly affected the stock returns across the Chinese stock markets (Al-Awadhi et al., 2020). Further, it is contended that the impact of disease outbreaks has never been as drastic as caused by COVID-19, including the famous Spanish flu. In this vein, the severity of reaction from US stock markets can be attributed to guidelines and restrictions imposed by the government on commercial activities with voluntary maintaining of social distancing to contain the spread of COVID-19 which led to a crash of service dominated economy (Baker et al., 2020). The unprecedented impact gradually stabilized and recovered to some extent, but not before markets have performed badly and generated negative returns (Singh et al., 2020). A study by (Ramelli & Wagner, 2020) suggests that stock market members foresaw the genuine economic impacts of the COVID-19 wellbeing emergency being intensified by financial channels, but it is not yet clear that the continued policy interventions and liquidity injections would change the economic disruptions caused by this virus. Globalization has made markets work in co-integration. Bhuyan et al. (2010) found a significant co-integration among the Asian equity markets in their study during and after-SARS periods. More recently, Narayan et al. (2020) examined the effects of government policies regarding lockdowns, stimulus packages, and the ban on travel on stock returns in G7 countries. Although the effectiveness of all three policies could not be compared because all the policies were in force simultaneously, the aggregate impact of policies did have a positive effect on market returns. An event study (Liu et al., 2020) evaluated the short-term impact of COVID-19 on 21 stock indices of major affected countries across the globe. The results indicate that stock markets’ reaction were quick, which led to their fall immediately, and Asian stock markets generated more negative abnormal returns as compared to other countries. The increased number of confirmed cases also added to investors’ worries about future returns and unexpected future market behavior.
Data and Econometric Model
Data
Data Description of Sample Countries.
Econometric Model: Event Study Methodology
Event study methodology has been employed to analyze how the stock markets react after the occurrence of an outbreak of a disease like coronavirus. An event study is primarily used to analyze the behavior of security with the occurrence of an event or any information announcement. The event can be earnings reports, corporate actions, deals, mergers, etc. The impact of the event on stock prices can either be positive or negative. Many researchers have used event study as an important tool to examine the returns on securities post the occurrence of an event (Mackinlay, 1997; Warner & Brown, 1983). Also, there have been many studies that employed event studies for non-corporate events like diseases (Al-Awadhi et al., 2020; Albulescu, 2020; Chen et al., 2007; Liu et al., 2020).
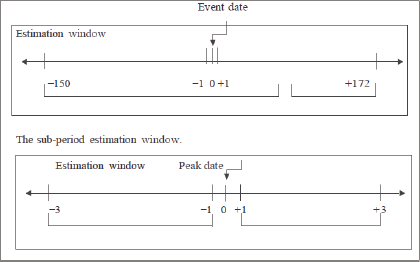
Event Window
The number of days in the window period ranges from 143 to 172 days based on available trading days for eachcountry in the sample from the date when the first case of COVID-19 was confirmed in the countrytill September 24, 2020. We argue that the daily number of confirmed cases may have affected stock markets differently. Therefore, to examine the impact of a daily rise in confirmed cases, we take the peak date as a 15% or more increase over the cumulative confirmed cases on the previous day and examine the abnormal return 3 days post the peak date in comparison to an average return of 3 days before the peak date with sub-periods amounting to a total of 7 days. In case there is a rise of more than 15% within the sub-period, the date with the highest rise over the previous day is taken as the peak date. Each country’s number of peak dates is determinedby applying the criteria of a 15% or more increase in daily confirmed cases till September 24, 2020.
Estimation Window
An estimation period of 150 days, as used by (Al-Awadhi et al., 2020; Singh et al., 2020), beforethe event day for each country, has been used to calculate the average return and standard deviation.
Estimation Model

where Ln is the natural logarithm, Pt close price of the index on a given day, and Pt − 1 denotes the close price of the index on the day prior.
Expected return:

A mean return is calculated by taking an average of estimation periods (−1 to −150)
An abnormal return (AR) is calculated by subtracting the mean return

CAR of the index for the window period t0 to t1 is calculated using Equation (4)

t-
t-Statistic for abnormal return is calculated using the abnormal return on a day divided by the standard error of the estimation period returns as given in Equation (5)

where standard error
Volatility is calculated using the standard deviation of log returns.
Results and Discussion
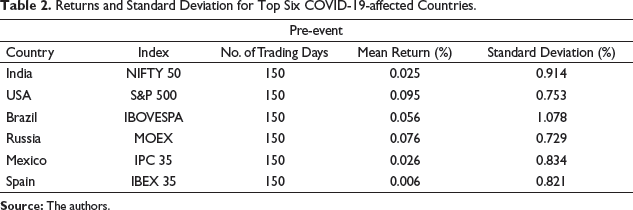
Returns and Standard Deviation for Top Six COVID-19-affected Countries.
Abnormal Returns on and After the Event Day.
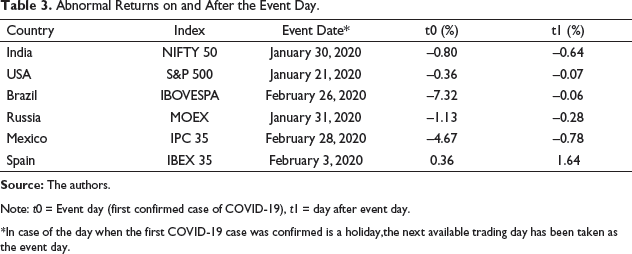
*In case of the day when the first COVID-19 case was confirmed is a holiday,the next available trading day has been taken as the event day.
Abnormal Return of Sample Countries with their Significant Values.
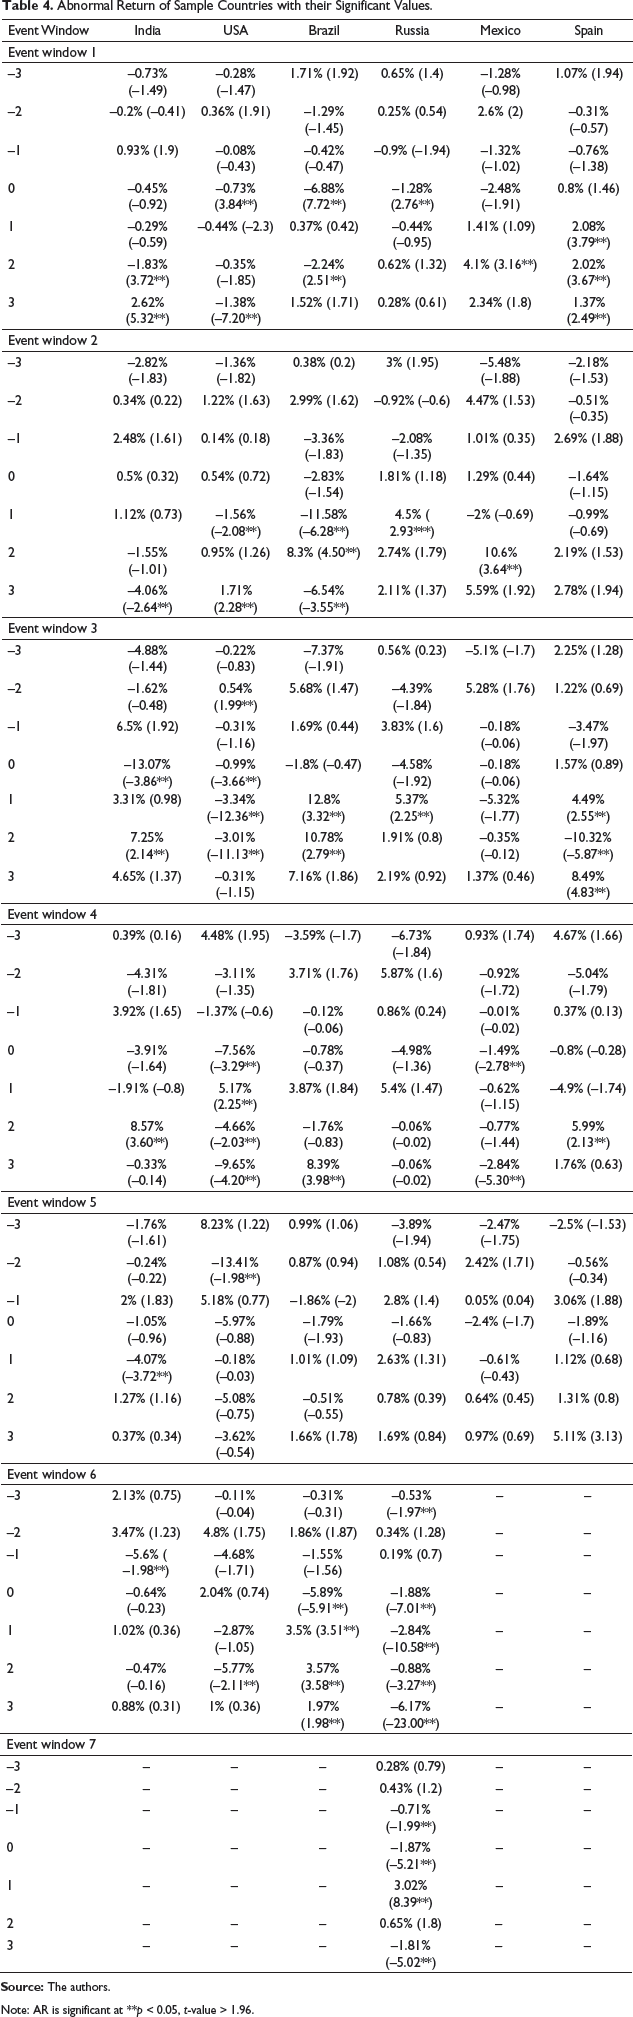
The increase in volatility in stock markets around the world started in the last week of January 2020, with many countries reporting the first cases of novel coronavirus. After January 30, 2020, India’s NIFTY 50 showsan increase in volatility. In the first event window, day 1 does not show any significant abnormal returns, but days 2 and 3 show daily returns of −2.15% and 2.29% with an abnormal return of −1.83% and −2.62%, respectively. This signifies the impact of the occurrence of COVID-19 in India and the presence of abnormal returns in the market during event window 1. Event window 2 shows significant abnormal returns of −4.06% on day 3. Accordingly, event window 3 shows significant and highest abnormal returns of −13.07% on event day and 7.25 % on day 2 of the event period. This is the biggest fall in the NIFTY 50 in its history.
Similarly, during event window 4, the index shows the presence of abnormal returns of 8.57% on day 2. On this day,the NIFTY 50 index has the highest rise in its history. In event window 5, the index shows the presence of abnormal returns on day 1. Last,event window 6 does not show the presence of abnormal returns during the event period but during the estimation period (day 1) which are significant and the reason for the same could be attributed to the trailingimpact of previous dates. After the 5May 2020, rise in COVID-19 in India stabilized and remained ata daily increase of 15%, which also led to the stabilization of markets and a decrease in volatility.
The first case of COVID-19 in the USA was reported on 21January 2020. In event window 1, the S&P 500 index provides daily returns of −0.27% on the event day with significant abnormal returns of −0.73% for the same day.Postevent day, onlyday 3 shows −0.91% daily returns with significant abnormal returns of −1.38%. This signifies the reaction of US markets towards the news of the arrival of COVID-19 in the USA and the subsequent start of a downward trend in the market. With the increased number of cases, the markets started tumbling further. Event windows 4– 6 show the highest volatility in the market with the index falling by −12.77% on March 16, 2020, which is the third-highest fall of the S&P 500 in its history (Herron & Hajric, 2020). The USA reported the highest rise in the daily case in the world in March and April 2020, but the daily increase rate stabilized from the first week of April onwards and remained under the daily rise of 15%, which also stabilized the volatility in equity markets in the USA.
Brazil reported its first case of COVID-19 on February 26, 2020, with IBEVOSPA tumbling by −7.26% on the same day with a significant abnormal return of −6.88%. This is one of the sharpest reactions seen among the countries under study, and the reason for this decline in the index can be attributed to the fact that most of the countries reported the arrival of novel coronavirus at the end of January 2020 and the first half of February 2020. Therefore, already existing fear among the markets and investors, pulling out their moneynot to further their losses, made the arrival of COVID-19 in Brazil in the last week of February 2020 weigh heavy on indices. With the increase in cases,the IBEVOSPA index fell by −12.98% with significant abnormal returns of −11.58% on the day of event window 2 dated March 10, 2020. Event windows 3 and 4 further show the high volatility in the overall period. From April 28, the markets stabilized and provided some continuous days of positive returns.
Russia reported the first case of COVID-19 on January 31, 2020, and the MOEX index fell by −1.03% on the same day, generating abnormal returns of −1.28%. After this initial reaction of the index towardsthe arrival of a novel coronavirus,the remaining event days in event window 1 are stable and do not show abnormal returns. In event windows 2 and 3, the index shows abnormal returns on event day 1 for each. This signifies that the arrival of COVID-19 in Russia did not impact the stock markets in the country muchinitiallyas compared to other countries in the sample. Event windows 4 and 5 do not show any significant abnormal returns,but event window 6 shows the impact of rising COVID-19 cases with significant abnormal returns on all days throughout the event window. Similarly, event window 7 also provides abnormal returns throughout the event window except for day 3 dated April 23, 2020. Post April 2020, the daily rise in COVID-19 cases in Russia remained under 15%, and markets also stabilized with the decrease in volatility.
Mexico confirmedthe first case of COVID-19 on February 28, 2020 and the IPC 35 index fell by −4.59% on the same day. Event window 1 shows significant abnormal returns of 4.10% on event day 3, followed by abnormal returns of 10.60% on event window 2 day 2. This signifies the impact of the arrival of COVID-19 in Mexico on the stock markets. Event windows 3 and 5 do not provide any evidence of the presence of abnormal returns, but event window 4 shows the presence of abnormal returns on event day and event day 3. Hence, after the end of April 2020, COVID-19 cases in Mexico remained under a 15% daily rise, and hence overall market volatility also decreased and market returns stabilized.
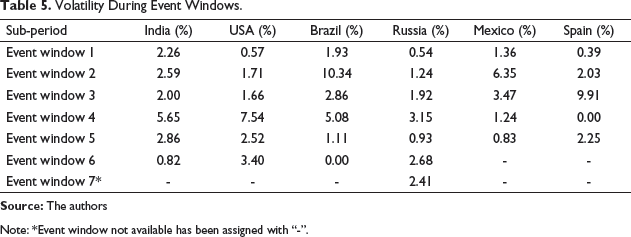
Volatility During Event Windows.
Cumulative Abnormal Return
Figure 1 shows the CAR for the indices during the entire event window starting from January 21, when the USA reported its first case of COVID-19, till September 24, 2020. The downtrend in global markets started in the last week of February 2020, and the majority of indices touched bottom levels from March 15, 2020 to March 25, 2020. On March 16, 2020, IBEX 35 index Spain fell by 8.21%, and the Index shows the lowest CAR of −47.05% for the same day. MOEX Russia saw its lowest point on March 18, 2020, with a CAR of −44.65%. On the same day, IPC 35 Mexico showeda CAR of −42.08%.
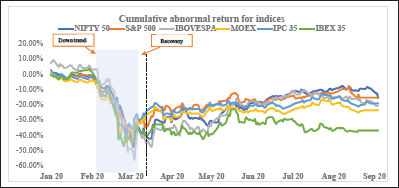
During the same period NIFTY 50 India and S&P 500 US indices fell to their lowest levels on March 23, 2020 with CAR of negative 47.50% for NIFTY 50 and CAR 43.94% for S&P 500, respectively.The lowest CAR value in the event window is for IBOVESPA Brazilon March 24, 2020 when it fell by 5.36% with a CAR of −55.98%. Post March 25, 2020, Indices show the recovery from the bottom levels and decrease in the volatility. Figure 1 shows the upward trend of indices at the end of the first week of April 2020. On September 24, 2020, it appears that the indices have recovered from the downfall caused by the pandemic, but these indices are still below the pre-January 2020 levels with continuing negative CAR. The least recovered index during the event is IBEX 35 Spain with a CAR of −36.86%, followed by MOEX Russia with a CAR of −23.58, Brazil’s IBOVESPA with a CAR of −20.68, Mexico’s IPC 35 with a CAR of −19.08%, India’s NIFTY 50 with a CAR of −15.57% and USA’s S&P 500 with a CAR of −15.25%, respectively. Spain’s IBEX 35 has underperformed duringthe last decade. Even after the Global Financial Crises of 2008–2009, the index never recovered to pre-crisis levels. It has followed a similar pattern with the COVID-19 pandemic as well and has been underperforming among the sample indices as well.
Conclusion and Implications
We examine the impact of the COVID-19 outbreak on the stock market in the top six most affected countries by thecumulative number of confirmed cases of the virus. The outbreak of COVID-19 disease has had a devasting impact on world economies. Most countries initially responded with lockdowns to stop the spread of the novel coronavirus, which in turn paralyzed economic activityand further trembledeconomic growth. The majority of stock markets were open for trading during the lockdown period, and the impact of COVID-19 on economic activities created fear among market participants.It was found that the initial reaction of markets was mild, but with the arrival of the virus in new places, an environment of fear was created. Therefore, it furnished motivation to examine the impact of COVID-19 on stock returns.
First, we check the summary statistics of the various stock exchanges of sample countries and find the positive mean return of each stock exchange before the pandemic COVID-19 outbreaks, while post-event, each country is witnessed with a negative average return except Mexico. Second, we examine the impact of the COVID 19 outbreak on the stock return using event study methodology. For it, seven-event windows have been identified. The overall results indicate that COVID19 affected stock markets severely and elevated the volatility many folds, especially in March 2020. Brazilian stock indices show the highest decline among the selected countries, with a fall of more than 50% during the pandemic, while Mexican indices show the lowest fall of around 30% during the same period. The highest volatility during the event is also seen for Brazilian indices, followed by US indices, with standard deviations above 3.5% and 2.5%, respectively. US and Indian markets were the first to recover from the crash by more than 85% by September 2020. While Spanish markets are least recovered with IBEX 35 index continuing to underperform by more than 35% till last week of September 2020. Even though the effect of COVID-19 is evident among all the sample country indices, the severity of the effect varies across indices and the same could be attributed to the adoption of different policies regarding lockdown types and timely declaration of packages by governments during the pandemic. The markets are also responsive to the scale of economic activities in an economy and the disruption that COVID-19 created to these activities.
The findings of the results obtained from this article have three different implications for investors. First, investing in the Mexican stock market will give a robust return in a pandemic like COVID-19 as it generated a positive return comparatively (see Table 4). Second, every economic crisis brings an opportunity. Hence, one should invest during such a time to capitalize on the opportunities created by the downfall of the stock market. The crisis is realized by stock markets because of COVID-19 and the same is witnessed by the negative return of the majority of the stock markets. Third, an investor can analyze the market based on volatility because risk propensity is aligned with an individual’s risk appetite, which helps to decide whether one has to invest or exit from an investment. The present study corroborates the study of Singh et al. (2020).