
Abstract
Abstract
In this article, we analyse the factors that determine the fatality rates across 29 economies spread across both the developing and developed world. Recent emerging literature and expert opinions in popular media have indicated various factors that may explain cross-country difference in fatality rates. These factors range from access to public health infrastructure, BCG vaccination policies, demographic structure, restrictive policy interventions and the weather. In addition, articles are examining different kinds of fatality rates that can be explained. Progressing beyond fragmented databases and anecdotal evidence, we have developed a database for such factors, have explored various econometric models to test the explanatory power of these factors in explaining several kinds of fatality rates. Based on available data, our study reveals that factors such as public health system, population age structure, poverty level and BCG vaccination are powerful contributory factors in determining fatality rates. Interactions between factors such as poverty level and BCG vaccination provide interesting insights into the complex interplay of factors. Our analysis suggests that poor citizens’ access to the public healthcare system are worse in many countries irrespective of whether they are developed or developing countries.
Keywords
Introduction
It is believed that the determinants of fatality rates 1 due to coronavirus disease (COVID-19) across countries may be influenced by factors such as poor health infrastructure and access to public health prevailed in a country, BCG vaccination (The Economics Times, 2020) and demographic factors. Indeed, there is extensive evidence in recent times that not only developing countries but some developed countries are also characterized by poor conditions of public health infrastructure (The Guardian, 2016). Again, access to healthcare may not be the same for all inhabitants. For instance, it appears that the ethnic minorities are dying of COVID-19 at a higher rate in both the USA and the UK. Recent research revealed that ethnic minorities in both the countries are dying in disproportionately high numbers compared to the white people (Barr et al., 2020; O’Neal, 2020). For example, The Guardian analysis found that of 12,593 who died in hospital in England up to 19 April 2020, 19 per cent are Black, Asian and minority ethnic (BAME) even though these groups make only 15 per cent of the general population in England. Likewise, in the USA, contraction rates and fatality rates of coronavirus disease (COVID-19) are stronger across all States among minority population than the other groups. For example, in Michigan, the Black population contributes 15 per cent of the total state population but constitutes 35 per cent of people diagnosed with COVID-19. This implies that Blacks in Michigan are 133 per cent more likely to contract the novel coronavirus relative to their overall representation in the state. According to a report published by Brookings Institution, with a fatality rate poised to near 4 per cent in Michigan, Blacks are also over-represented for fatality rate related to COVID-19, accounting for 40 per cent of all fatalities state-wide. For comparison, Whites represent 25 per cent of people diagnosed with COVID-19 and 26 per cent of deaths while they constitute over 75 per cent of the state population (Ray, 2020). Thus, it appears that in both the economies there have been health inequalities.
However, fatality rates are also high in Italy and Spain partly explained by demographic factors such as population age structure (Dowd et al., 2020). The current fatality rate due to this pandemic in the rest of the economies is just the reflection of their woeful public health infrastructure made by the respective governments. Evidently, most of the economies including India are now turning to their governments and public healthcare systems to combat this pandemic. The citizens of these economies are looking with suspicion at the countries’ ability to fight the COVID-19 because of their hapless public healthcare system. The question remains whether existing private sector linked healthcare system prevent a large section of the population from taking advantage of health benefits that are assumed to be available to all. It is now well established that the real beneficiaries are rich households in the current system and they can easily access and exploit the system in most of the countries including India.
This article contributes to our understanding of how COVID-19 spread in select countries in both developed and developing economies. A large literature in recent time has drawn general inferences such as lockdowns and their effectiveness, hotspot-based lockdowns, case fatality rates (CFRs) and number of affected persons by self-reporting mechanism and mass testing procedures. However, these studies are primarily based on partial information, and hence, one might not expect to derive an appropriate solution. From the policy point of view, it seems that accessibility of such information in the short run is like ‘low hanging fruit’. Therefore, such ‘one size fits all’ solutions may call for many distortions. We have gone deeper into the problem and found that conditions are heterogeneous within variables such as access to public health structure, BCG vaccination—as a proxy for active immune response, 2 population age structure, poverty rates as a proxy of economically and socially backward population. We then try to interpret empirically, the explanatory powers of a select country-level characteristics and the fatality rates.
This article proceeds as follows: The second section motivates the framework of our approach. The third section describes the sources of data, methodology and their limitations. The fourth section presents the empirical model, defines the variables incorporated in the empirical model and discusses the variables. The fifth section illustrates the results, and the sixth section concludes.
Framework of the Study
In this section, we design a simple framework to identify a range of factors yet powerful that determines CFRs due to COVID-19 in select countries in the world. There are some unsettled questions regarding the use of the word ‘death rate’. 3 According to the BBC (Henriques, 2020), fatality rates are defined in two ways. One, people who die and have tested positive for the disease. This is termed as the ‘CFR’. The second is overall, the people who die after having the infection; as many of these will never be picked up, any estimate of this figure is likely to lead to wide-ranging error. This is known as the ‘infection fatality rate’. In other words, the CFR describes how many people, health professionals are sure, are killed by the infection versus how many people the virus kills overall (Henriques, 2020). The recent literature has focused on misinformation about affected patients of COVID-19 such as number of patients and their identifications. We accept that data relating to affected people of COVID-19 are inaccurate since available data in the context of developing economies are based on patients’ self-reporting to the concerned authority. More surprisingly, sometimes tests are denied by the concerned hospital authorities due to poor availability of kits and technical experts. However, data collected to define the number of COVID-affected people in the developed countries are constructed on mass testing. Hence, for the purpose of the study, we have initially considered number of confirmed deaths reported due to COVID-19 divided by the number of cases as well as deaths to total population ratio as of 26 April 2020 to define our fatality rate. Noting the fact that countries have different timelines of COVID-19 outbreak, we have refined the CFR definition later on in our empirical framework by taking the cases and deaths as on the 45th day from the first reporting of the COVID case in a country and replicated the empirical model.
Consider a country that is affected by COVID-19. The country’s CFR over a timeline may be determined by factors such as citizen’s easy access to public health, population age structure, poverty level, specific immunization drives such as BCG vaccination, government’s stringent actions such as either total lockdowns or hotspot-based lockdowns as well as climatic conditions. This may be particularly so in both developed and developing economies.
Public Health Infrastructure and COVID
In the absence of actual data, sometimes number of hospital beds per thousand population may be considered as a proxy of access to public health. In a given set up, it is likely that more lives can be saved due to greater number of hospital beds. When hospitals are overwhelmed by the number of patients, it is a simple question of how the common people are able to access it. For instance, South Korea has been exemplary as of April 2020 from the point of view of keeping the CFR to as low as around 2%. The number of hospital beds in South Korea has definitely assisted in bearing the burden of massive hospitalization. While South Korea possesses 12.3 hospital beds per 1,000 inhabitants, the USA, the UK, Italy and Spain have only 2.8, 2.5, 3.2 and 3 beds, respectively, per 1,000 individuals. 4 South Korea has also carried out quick, large-scale and rigorous COVID-19 testing, isolation of infected individuals. The country has been able to provide timely medical care and could put forth social distancing and other norms effectively which have helped in a remarkable performance without any lockdown.
Age Factor and COVID-19
It is widely presumed that the importance of demographic factors such as population age structure may play a powerful role in explaining the difference in fatalities across countries due to COVID-19. Although the novel COVID-19 is affecting all sections of the global populace, it is observed that the elderly cohort is facing significant health risk and threat. A study based on 191 patients from hospitals in China established older age to be associated with increased likelihoods of death in patients with COVID-19 (Zhou et al., 2020). Guo et al. (2020) while reviewing the characteristics of the novel COVID-19 mentioned that the disease tends to progress faster in persons aged 65 years or more. A recent research report reveals that COVID-19 mortality risk is highly concentrated at older ages, particularly those aged 65+ (University of Oxford, 2020). As of 1 May 2020, on the basis of the cases in New York City (NYC) which include its inhabitants as well as foreign inhabitants being treated in NYC, it is seen that about 74% of the total deaths represent people aged 65 years and above. 5 Statista (2020) 6 reports that as of 27 April 2020, about 84% of the people who died from the novel coronavirus in Italy were of age 70 years and above. In Spain, the mortality rate of coronavirus is seen to be rising with age. As of 29 April 2020, the rate has been 0.3% for the age group of 0–9 years, for individuals between 40 and 49 years the figure is 0.6%; however, it rises to 13.6% among those between 70 and 79 years of age and to as high as 21% for those between 80 and 89 years and also among people over 90 years. Around the same time in Japan, the highest number of deaths were seen in patients aged 80 years or above. India is however depicting a slightly different story. As of the end of April 2020, about 49 per cent of the total COVID-19 deaths have been of individuals aged under 60 (News18, 2020). A majority of the COVID-19 cases in India are people between ages 21 and 40 as of 27 April 2020. Again, based on 44,672 confirmed cases of the novel coronavirus COVID-19 in China published in February 2020, most patients were aged between 30 and 69 years. It is useful to mention here that the emerging economies are in general characterized by younger population and that is directly affecting the COVID-19 cases (Statista, 2020).
According to the WHO report (Kluge, 2020), the reasons behind elderly populace being immensely affected by the coronavirus are the ageing-associated physiological changes, reduced immunity and multi-morbidity. Nonetheless, according to the organization, age is not the lone risk for such serious ailments and young people are also vulnerable and getting seriously impacted. There are several cases of fatalities among the young populace as well. On the other hand, there are reports stating that certain individuals over 100 years have recovered. Thus, what matters is the condition of the health of the people prior to the pandemic and policies for healthy ageing should be there on the priority list of any society’s agenda.
Specific Vaccination Policy and COVID Case Fatality
A few ecological papers are recently being published though still in the preprints stage; one such paper mentions that national differences in COVID-19 impacts could be partially explained by BCG vaccination policies (Miller et al., 2020). Another study also finds countries with universal vaccination policies associated with lower incidence and death rates from COVID-19 (Hegarty et al., 2020). A similar result is reported by another study positing a protective link of BCG vaccination (Dayal & Gupta, 2020). Randomized controlled trials have provided evidence that the BCG vaccine’s immunomodulatory properties can protect against respiratory infections, such as COVID-19 (Curtis et al., 2020). However, the limitations of such ecological studies have been underlined by many who have emphasized the need for randomized trials to check such causation (Pai, 2020). WHO has stated that ‘There is no evidence that the Bacille Calmette–Guérin vaccine (BCG) protects people against infection with COVID-19 virus’ (World Health Organization, 2020). This is based on lack of evidence until now, as two clinical trials are underway to verify this hypothesis. While WHO waits for the results of their clinical trials and experts are debating, may be one can try to correlate fatality rates and try to work out a connection which many papers are mentioning.
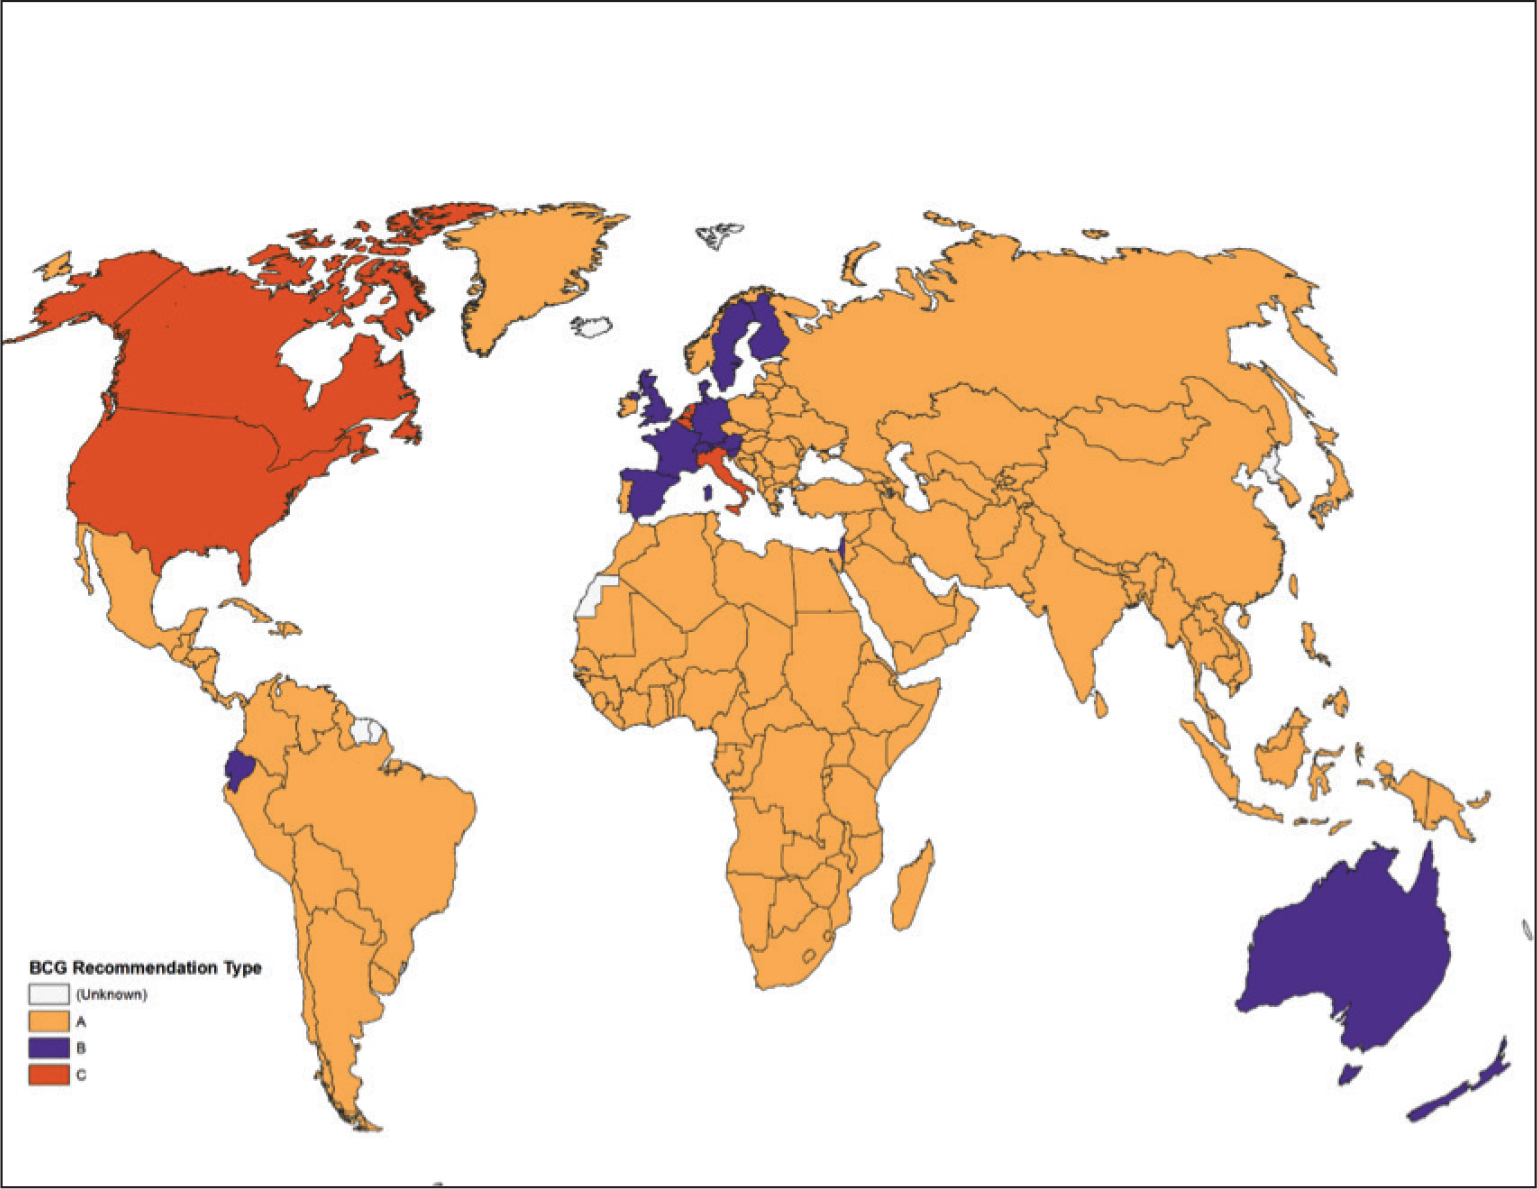
An exploration of the global BCG vaccination policy reveals that countries like the USA, Canada and Italy did not have any universal BCG vaccination policy; countries such as the UK, Spain, France, Germany, Norway, Sweden, Finland and Australia used to have universal vaccination policies earlier. Most of the other countries including India, China and others still have universal BCG vaccination in place (Figure 1).
Tabulation of 180 Countries in Terms of Income Profile and BCG Policy Status
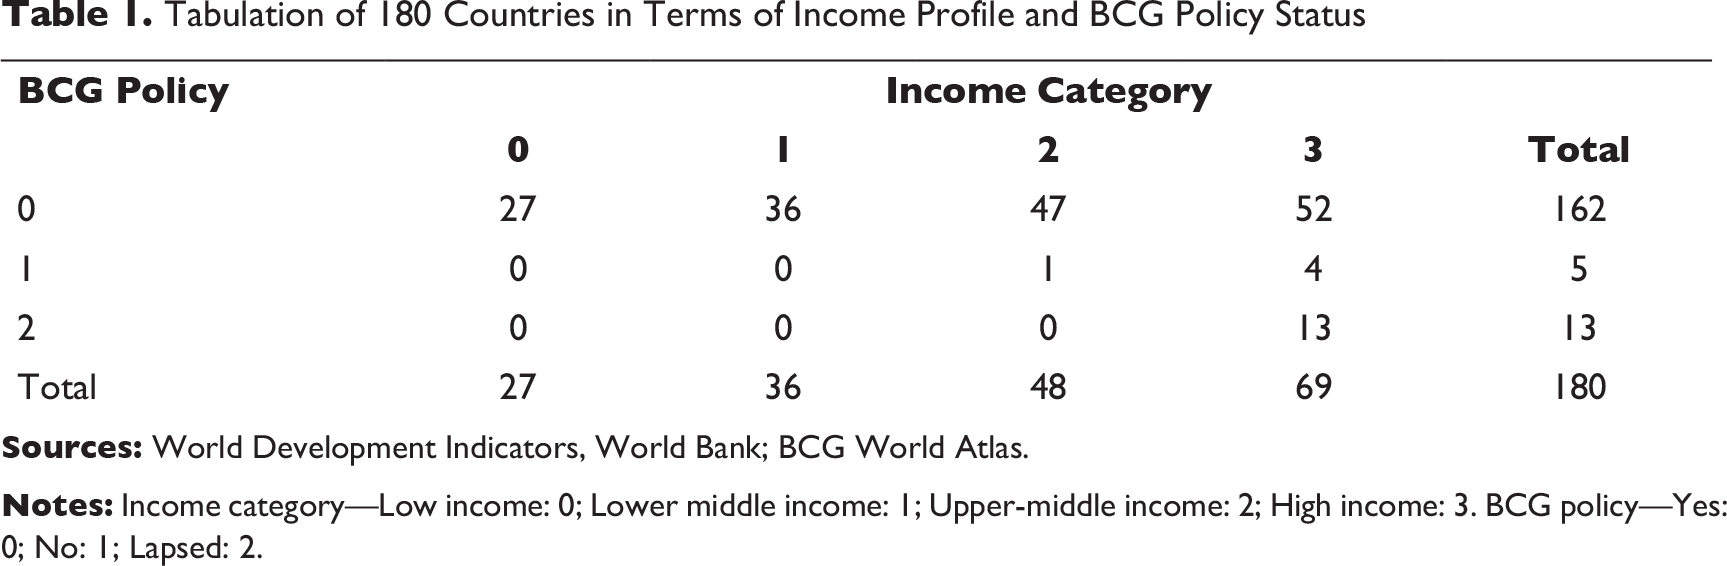
In the backdrop of the discourse held on BCG vaccination, in this article we wanted to do some casual empiricism to understand whether BCG policy has some causal connection with the morbidity rate in COVID-19. As it is noted from Table 1 that most of the low/low-middle income countries (L-LMI) in a sample of 180 countries have active BCG policy unlike the upper-middle or high income (UMI-H) countries which are a mixed bag of no/lapsed BCG and active BCG countries.
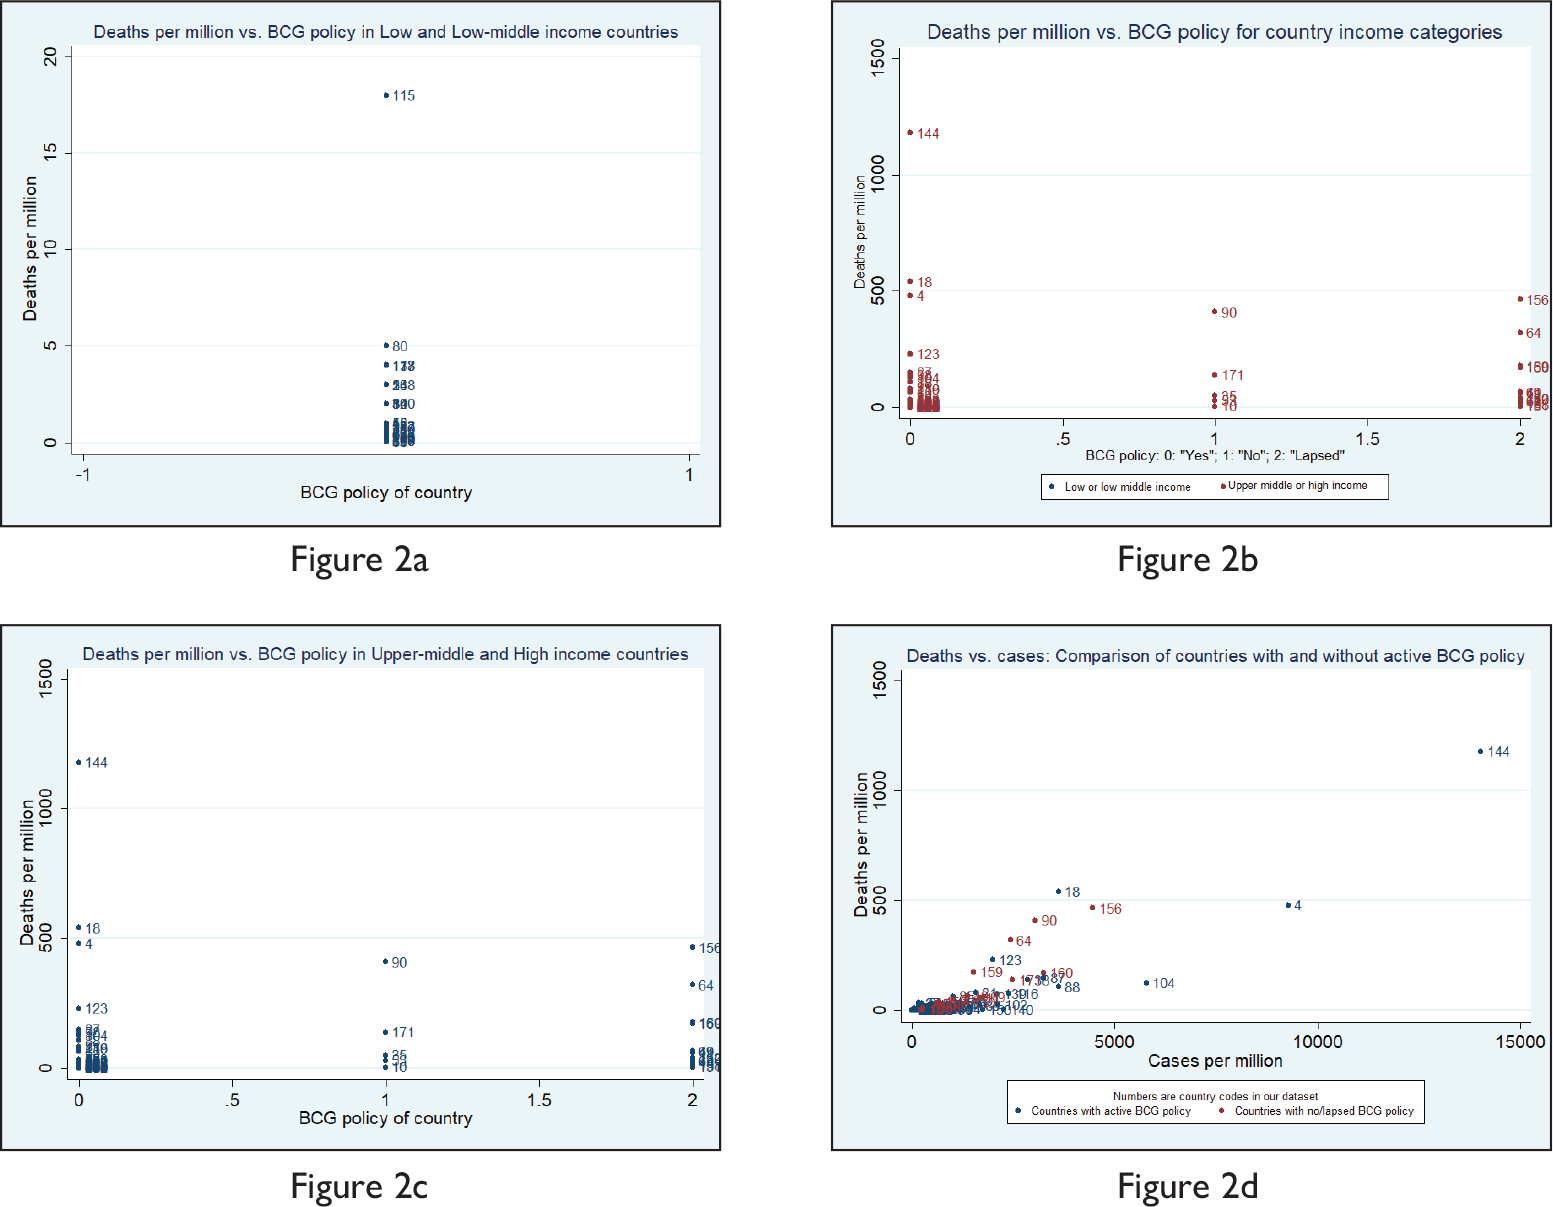
To understand this better, we have looked at the death numbers per million rather than the cases per million. Figures 2a and 2b show that L-LMI have by far low death per million of population in levels for whatever varied reasons, as compared to the UMI-H countries. Since UMI-H has both BCG and non-BCG countries, it is interesting to make a within-group comparison whether BCG countries in this group did well in terms of low deaths per million. Figure 2c, however, does not provide any such evidence, in fact, BCG countries in this group have shown high deaths per million. However, if we look at the cases per million vis-a-vis deaths per million and compare the morbidity among the BCG and non-BCG group of countries irrespective of the income levels, Figure 2d shows clear tendencies of high deaths per million for the non-BCG group of countries in comparison with their cases per million, which probably signals higher immunity among BCG populace against COVID 19.
There may also be an interaction effect of the variables on the fatality rate across countries. This implies fatality rates may be higher because of the poverty rate differences across 29 countries considered. However, BCG vaccination may neutralize the magnitude of fatality rate. This assumption is plausible especially when citizens were vaccinated mostly in emerging economies that includes Portugal. In our empirical model, we have shed some light on this as well.
Weather and COVID
A debate has been also raging in the popular media whether soaring temperatures or high humidity in developing countries like India will apply a much sought-after balm on the COVID-19 spread. Many of the well-known international agencies have been quick to dismiss it due to lack of evidence. However, studies are slowly emerging. A study by MIT researchers has at least acknowledged the possibility of weather being a factor, though a lot of other environmental factors are at play (Bukhari & Jameel, 2020). Another study has hinted at the possibility of using weather to predict regions of increased risk from COVID-19 (Sajadi et al., 2020). Again, a study by Harvard researchers, Stephen Kissler and Christine Tedijanto, found no evidence that warm weather led to weaker transmission (Powell, 2020). And the nascent data does not allow researchers to use ‘ceteris paribus’ as for highly infectious diseases, these environmental factors play a great role. Hence, using a proxy (dummy) variable whether a country belongs to the tropical climate or not, we try to figure out in this study whether climatic conditions influence COVID-19 outcomes.
Government Interventions to Mitigate COVID Case Fatality: An Event Study
Finally, we try to understand how prompt and effective government policy interventions have been to mitigate the risk of contagion. The importance of building efficient public health infrastructure and active involvement of the government has been realised century back at the time of cholera and flu outbreaks in the Western European nations primarily; the COVID-19 outbreak reinstates the significance further. Nobel laureate economist Angus Deaton also mentions the same in his famous book in 2013 The Great Escape: Health, Wealth, and the Origins of Inequality. As soon as COVID-19 outbreak shakes the globe, different countries adopted prompt policy actions to restrict the contagion such as sealing international borders, cancelling public events, closing workplace and educational institutions. Although policies to deal with this contagion has not been too different but the time of interventions have been very different and no surprise, the outcomes have been grossly different across nations irrespective of their hierarchy in terms of the economic indicators. Whereas some countries could restore ‘business as usual’ and smoothen the COVID cases curve very fast, some countries struggled to do so.
Oxford University launched tools to record and compare governmental measures in response to the coronavirus worldwide. 7 The 11 indicators and the information on strategic government intervention date wise, help understand whether increasingly strict measures affect the rate of infection, and identify what causes governments to implement stricter or less strict measures. It is no surprise that government responses to handle COVID-19 vary across countries and are highly contingent upon societal considerations and politico-economic set ups. A study by Brookings (Brahma et al., 2020), which uses the above-mentioned data, makes a country comparison of the responses. China reported their case to the WHO on 3 December 2019 when it was a full-fledged outbreak in China, while the first case got reported on 17 November 2019. The study has considered for the analysis the strictest measures by the government and not the advisories, to see whether early interventions have indeed helped countries in successfully smoothening out the curve. It took 42 days to reach the 100th case in the USA, 31 days in Japan and 29 days in South Korea but soon the rate of progression started declining upon strict government intervention in Japan and South Korea. South Korea first cancelled public events and adopted policy of stringent testing while developing their own test kits emphasizing on contact tracing. As of March 29, the USA, South Korea and Japan had over 140,000, 9,000 and 1,800 confirmed cases, respectively. Both Singapore and France reached 100 confirmed cases in approximately same number of days (37 and 36, respectively). Singapore instituted strict screening and quarantining measure, while France adopted only screening of international travellers a few days later. Singapore reported 844 confirmed cases and France reported over 40,000 confirmed cases as of March 29. India reported the first confirmed case 29 days after the outbreak in Italy, the UK, Spain and Belgium. Italy confirmed 100 cases in another 23 days compared to India’s 45 days. India started taking social distancing measures like closing workplaces and schools much before reaching 100 confirmed cases. As of March 29, India had over 1,000 confirmed cases, while Italy, the UK, Spain, Belgium had over 97,000, 19,000, 80,000 and 10,000 confirmed cases, respectively. Austria, Netherlands and Switzerland all confirmed their first case 56 days from the outbreak. However, all these countries have adopted social distancing and other strict measures after the cases rose significantly.
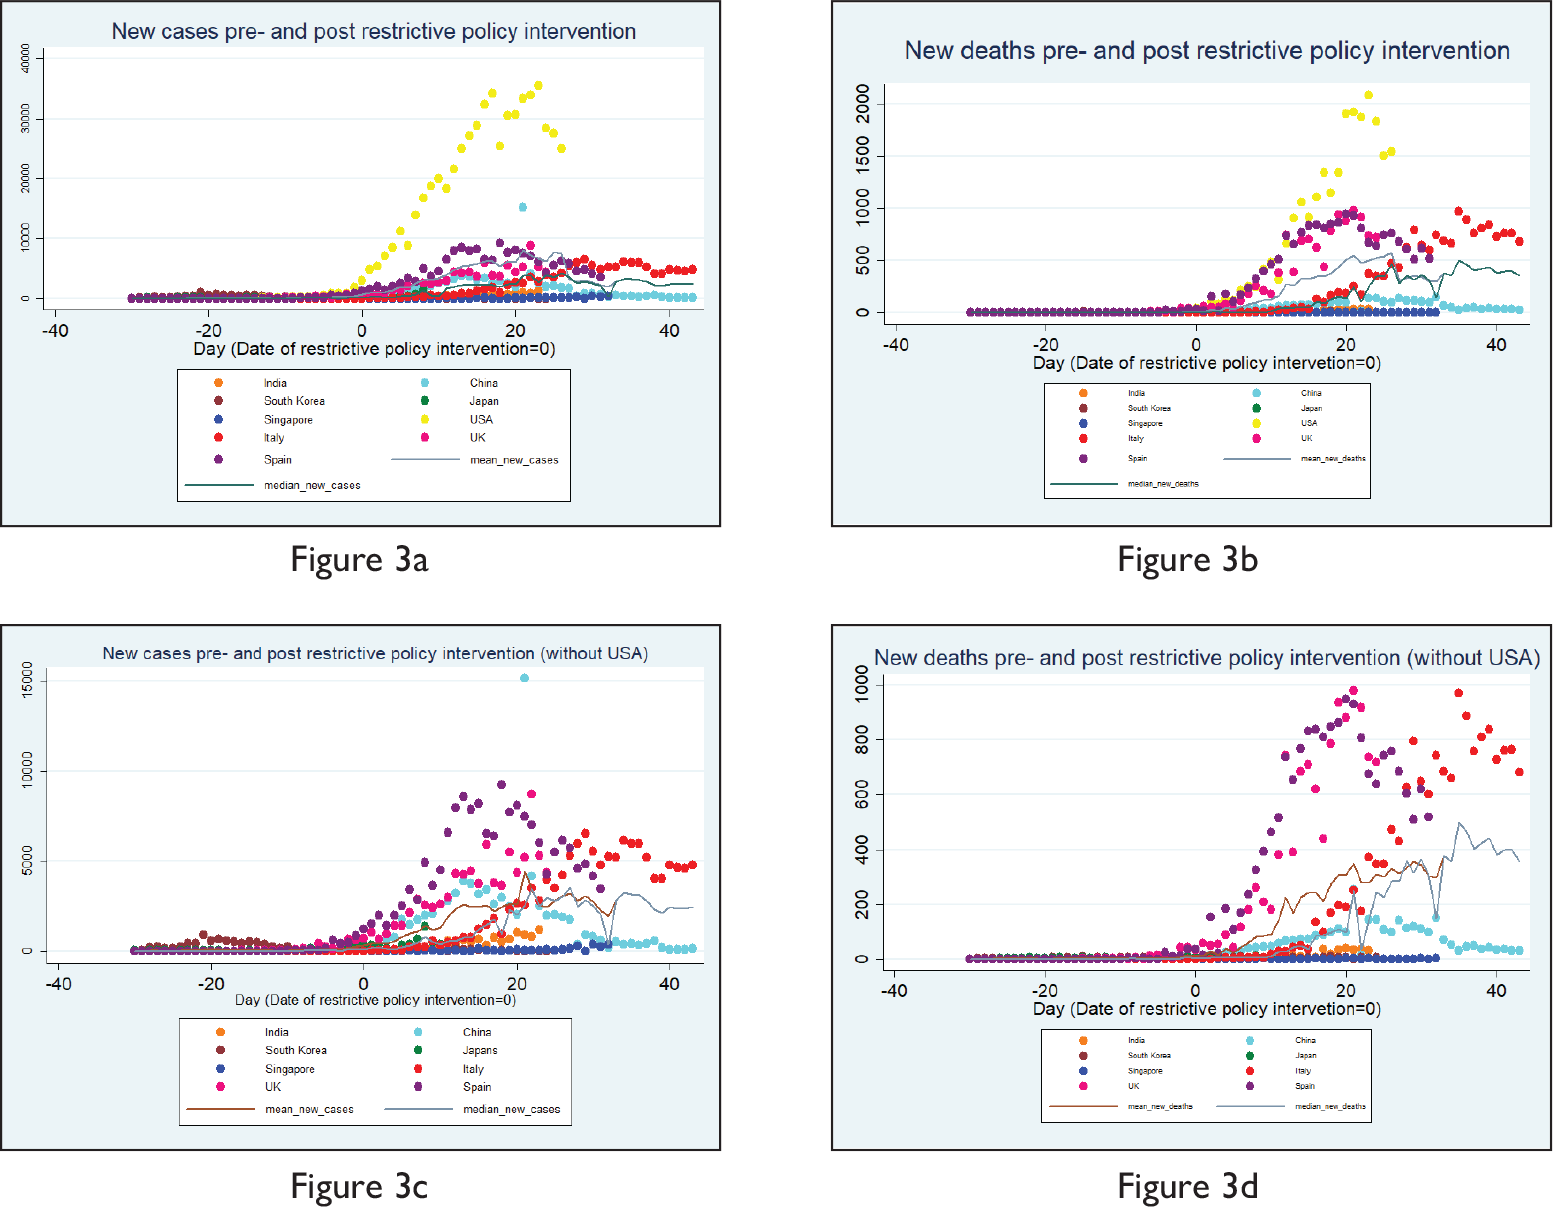
As we have already mentioned above that different countries intervened at different time points as and when the cases evolved, the question that arises is that how effective have been these intervention policies given the fact that countries did intervene at different time points in the timeline of the emergence of COVID-19 positive cases? Did the curve flatten post-intervention and after how many days it started showing signs of flattening remain the pertinent questions. This article does an event study to understand the impact of interventions. It takes nine countries where COVID-19 cases have been quite significant in number and is a mix of Asian and non-Asian countries (the USA, the UK, Japan, China, India, Italy, Spain, Singapore and South Korea). Only restrictive policy interventions have been considered and not the advisories issued and the government intervention database used is the Oxford Government Response Tracker. 8 In Figure 3a, the date of restrictive policy intervention (say Day t) has been taken as ‘Time 0’, days before the date of intervention have been depicted in negatives (e.g., t – 1 = –1, t – 2 = –2 and so on), while days after the date of intervention have been depicted in positives (e.g., t + 1 = 1, t + 2 = 2 and so on). The figure shows that generally within 20 days of restrictive intervention, the select countries could arrive at their peaks and then the cases started falling (as the plot of the mean and median also depict), which implies that such restrictive interventions have in general been quite effective, with Italy remaining an exception. Nonetheless, the steepness of the curve varies by a notable extent. The case of the USA has been starkly different in terms of ‘levels’ and steepness of the curve. That is why the article does the event study without the USA and finds that Singapore has done extremely well in terms of maintaining low ‘levels’ and India did well in terms of flattening of the curve (Figure 3c). Looking at Figures 3b and 3d depicting the ‘death’ numbers in our event study, we find similar trends. Here, we plot with and without the USA and find that the UK in terms of levels and Italy in terms of reaching the peak (and in flattening of the curve) remained exceptionally different.
Sources of Data, Methodology and Limitations
The data on the variables considered have been collected from various sources. Information on BCG vaccination policy has been obtained from The BCG World Atlas (2020). Percentage of population aged 65 years and above and poverty headcount ratio at $1.90/$3.20/$5.50 a day (2011 PPP; expressed in percentage of population) have been compiled from the World Bank database. 9 While the data on the number of hospital beds per 1,000 people have been collected from the OECD 10 and World Bank database, information regarding ICU beds per 100,000 people has been collected from various reliable international documents or sources. Current health expenditure (CHE) as a percentage of GDP and out-of-pocket (OOP) expenditure as a percentage of CHE have been compiled from the WHO database. 11 Government interventions data have been collected from the Coronavirus Government Response Tracker of the University of Oxford. The information whether a country in our sample is tropical or non-tropical is based on our own understanding and knowledge. CFRs and deaths as a percentage of the total population as of 26 April 2020 for the sample countries have been calculated based on the data put forth by Worldometer 12 . On the other hand, CFRs on the 45th day since the first reported case/s have been calculated based on the data put forth on the platform by Our World in Data. 13 This current study based on the 29 economies across the world employs multivariate cross-sectional regression analysis to find whether climatic conditions, BCG vaccination (a proxy for active immune response), poverty level, population age structure, number of hospital beds, health expenditure and government interventions have some explanatory power over the CFRs, or deaths to population ratio or the fatality rate as on the 45th day since the commencement of the first case/s. The 29 countries considered for this study are: India, Canada, France, Germany, Italy, Spain, Netherlands, Portugal, Sweden, Denmark, Norway, Switzerland, Turkey, Iran, The United Kingdom, The USA, South Korea, Russia, China, Japan, Bangladesh, Pakistan, Mexico, Brazil, Indonesia, South Africa, Nigeria, Ethiopia and Egypt.
The present study suffers from certain limitations. First, data collected on each variable pertain to the latest year available. Second, as we are conducting a study during the outbreak of a pandemic scenario in different countries, the data are subject to change over any plausible short durations. Also, there are numerous discussions and debate over the quality and authenticity of the data provided by each of the countries and then the countries trying to justify their reasons. At this stage, to do this academic piece of work, we would rather like to skip these controversies and take the COVID related numbers as furnished by the countries as sacrosanct and proceed with our analysis.
People have recognized for long that various infectious diseases are intimately associated with poverty. The impoverished, the marginalised, the malnourished, those living in precarious conditions are the most vulnerable to a contagion and likely to spread the same to the community. The novel coronavirus pandemic however has proved this statement wrong. The virus mostly travelled to the poor masses in different nations from the rich and middle class travelling from the infected countries to these nations. And when the poor are helpless and are not able to abide by the stay-at-home orders inflicted to contain the contagion, they again tend to suffer the most.
In the context of India too, it is the passport holders who brought the disease into the country. The country’s first COVID-19 patient who hails from Kerala is a medical student at the Wuhan University. The virus was again imported through foreign nationals coming to the country. These initial virus carriers therefore infected many as they came in contact to them and led to local transmission. An article published in Business Today on 29 April 2020 puts forth that most COVID-19 cases in India are of individuals having a travel history to the coronavirus infected nations or of individuals who had come in contact with a person who had travelled overseas recently.
The virus surprisingly has been ravaging several rich countries which have been the epicentre of the contagion. Of late, it has spread all across the world speedily being carried especially from the rich or powerful nations and has affected all sections of the population without any discrimination.
Indian states have again depicted diverse scenarios in terms of their share in total confirmed cases in the country. Certain states that are affected the most may be due to one or more of the following reasons:
They attract many foreign nationals for tourism/business/other purposes. They have more workers/employees/students abroad who tend to come to India on a regular basis while their family/friends visit them as well. They are more urbanized in comparison to the other states.
In this backdrop, the hilly north-eastern regions in India need special mention. Although the states have been immensely successful in keeping the disease at bay by adhering to various norms put forth diligently, factors such as less accessibility, some sort of geographical isolation, fewer overseas migration and less population density also definitely have helped them to combat the disease effectively.
Definition of Variables, Descriptive Statistics and the Empirical Model
The variables considered initially to develop the empirical model are defined below.
Descriptive Statistics
The linear regression models that we have considered are provided below:


We had to finally drop the health expenditure variable to avoid multicollinearity issues. We have later on focused on the interaction between variables when the effect of one explanatory variable on the dependent variable is thought to different for different values of another explanatory variable.
Results
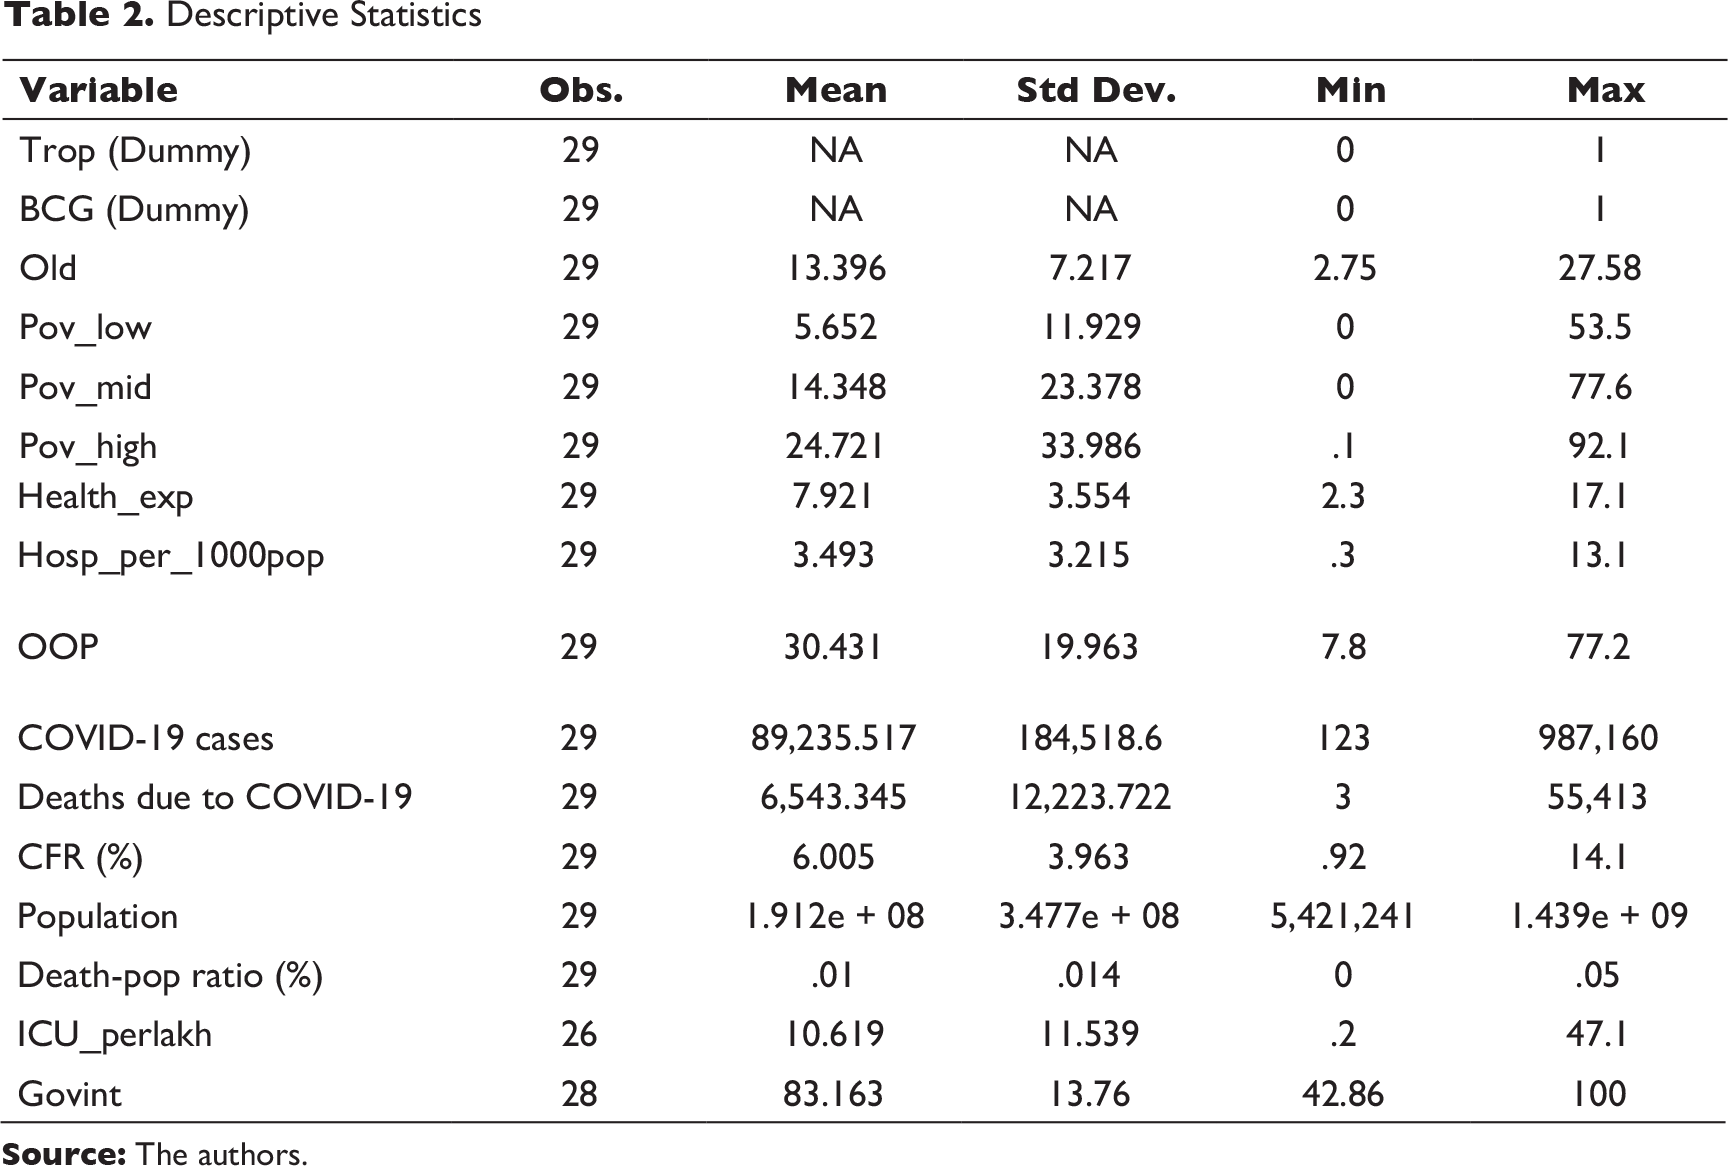
Data reveal that countries have been quite varied in all possible dimensions that relate to the COVID-19 crisis, starting from the timeline of reporting the first case, the rate of spread, death rates due to COVID-19, fatality rates, efficiency in mitigating fatality and so on. This empirical analysis investigates the contributory roles of certain chosen criteria which are identified to be playing some role in either preventing the risk of spread or mitigating its morbidity. In identifying the determinants, we have followed various COVID-19 related literature that speak about plausible connections of demographic factors (age of population), availability and access to basic health infrastructure and amenities to mitigate COVID-19 risks (hospital beds per thousand population, critical care units, health expenditure in general), country weather (tropical or non-tropical), whether BCG vaccination has been in practice in the populace (a proxy for immunity), how far health amenities are accessible to the poor (poverty rate as proxy) etc. These are taken for all the select 29 countries in our data set, which are a mix of countries from tropical and non-tropical weather zones. The variables considered along with the descriptive statistics have been already put forth in the previous section.
Factors Explaining Case Fatality Rate due to COVID 19: A Cross-country Empirical Exercise
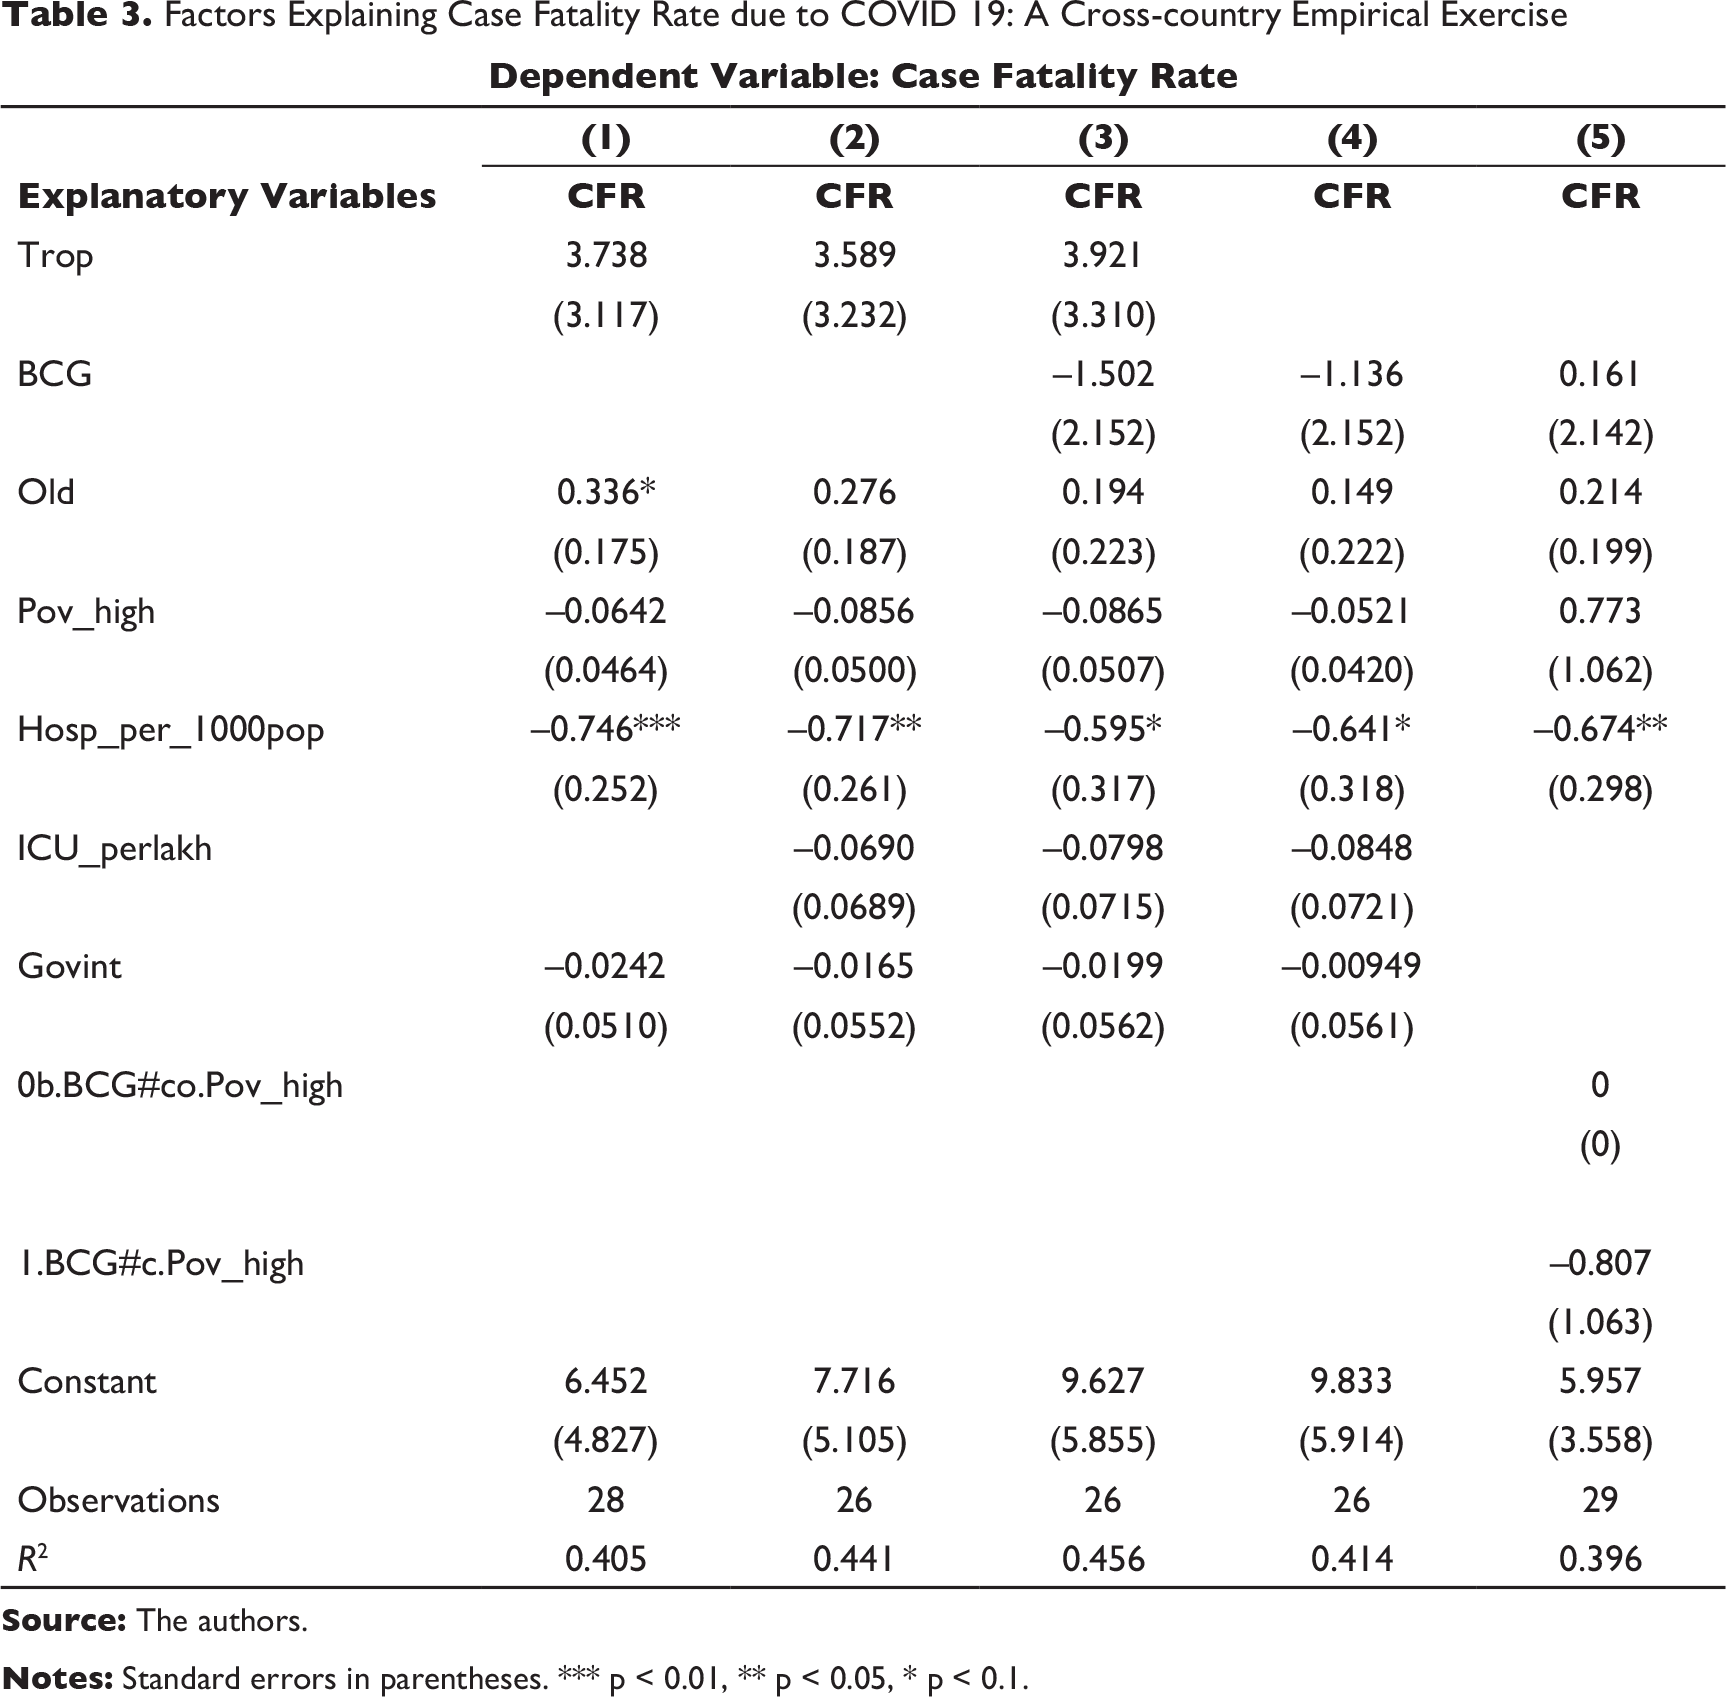
We find from Table 3 that neither the weather factor (tropical) nor the practice of BCG vaccination criteria has been significant contributing factors in explaining high CFR in the chosen set of countries. In the first model (Column (1)), proportion of the old population is coming to be significant with a positive coefficient implying that countries with higher old age population are likely to have higher CFRs. Notably, in all the models above, as depicted in Columns (1)–(5) in Table 3, we find availability of hospital infrastructure as a proxy of access to public health remains a significant contributory factor.
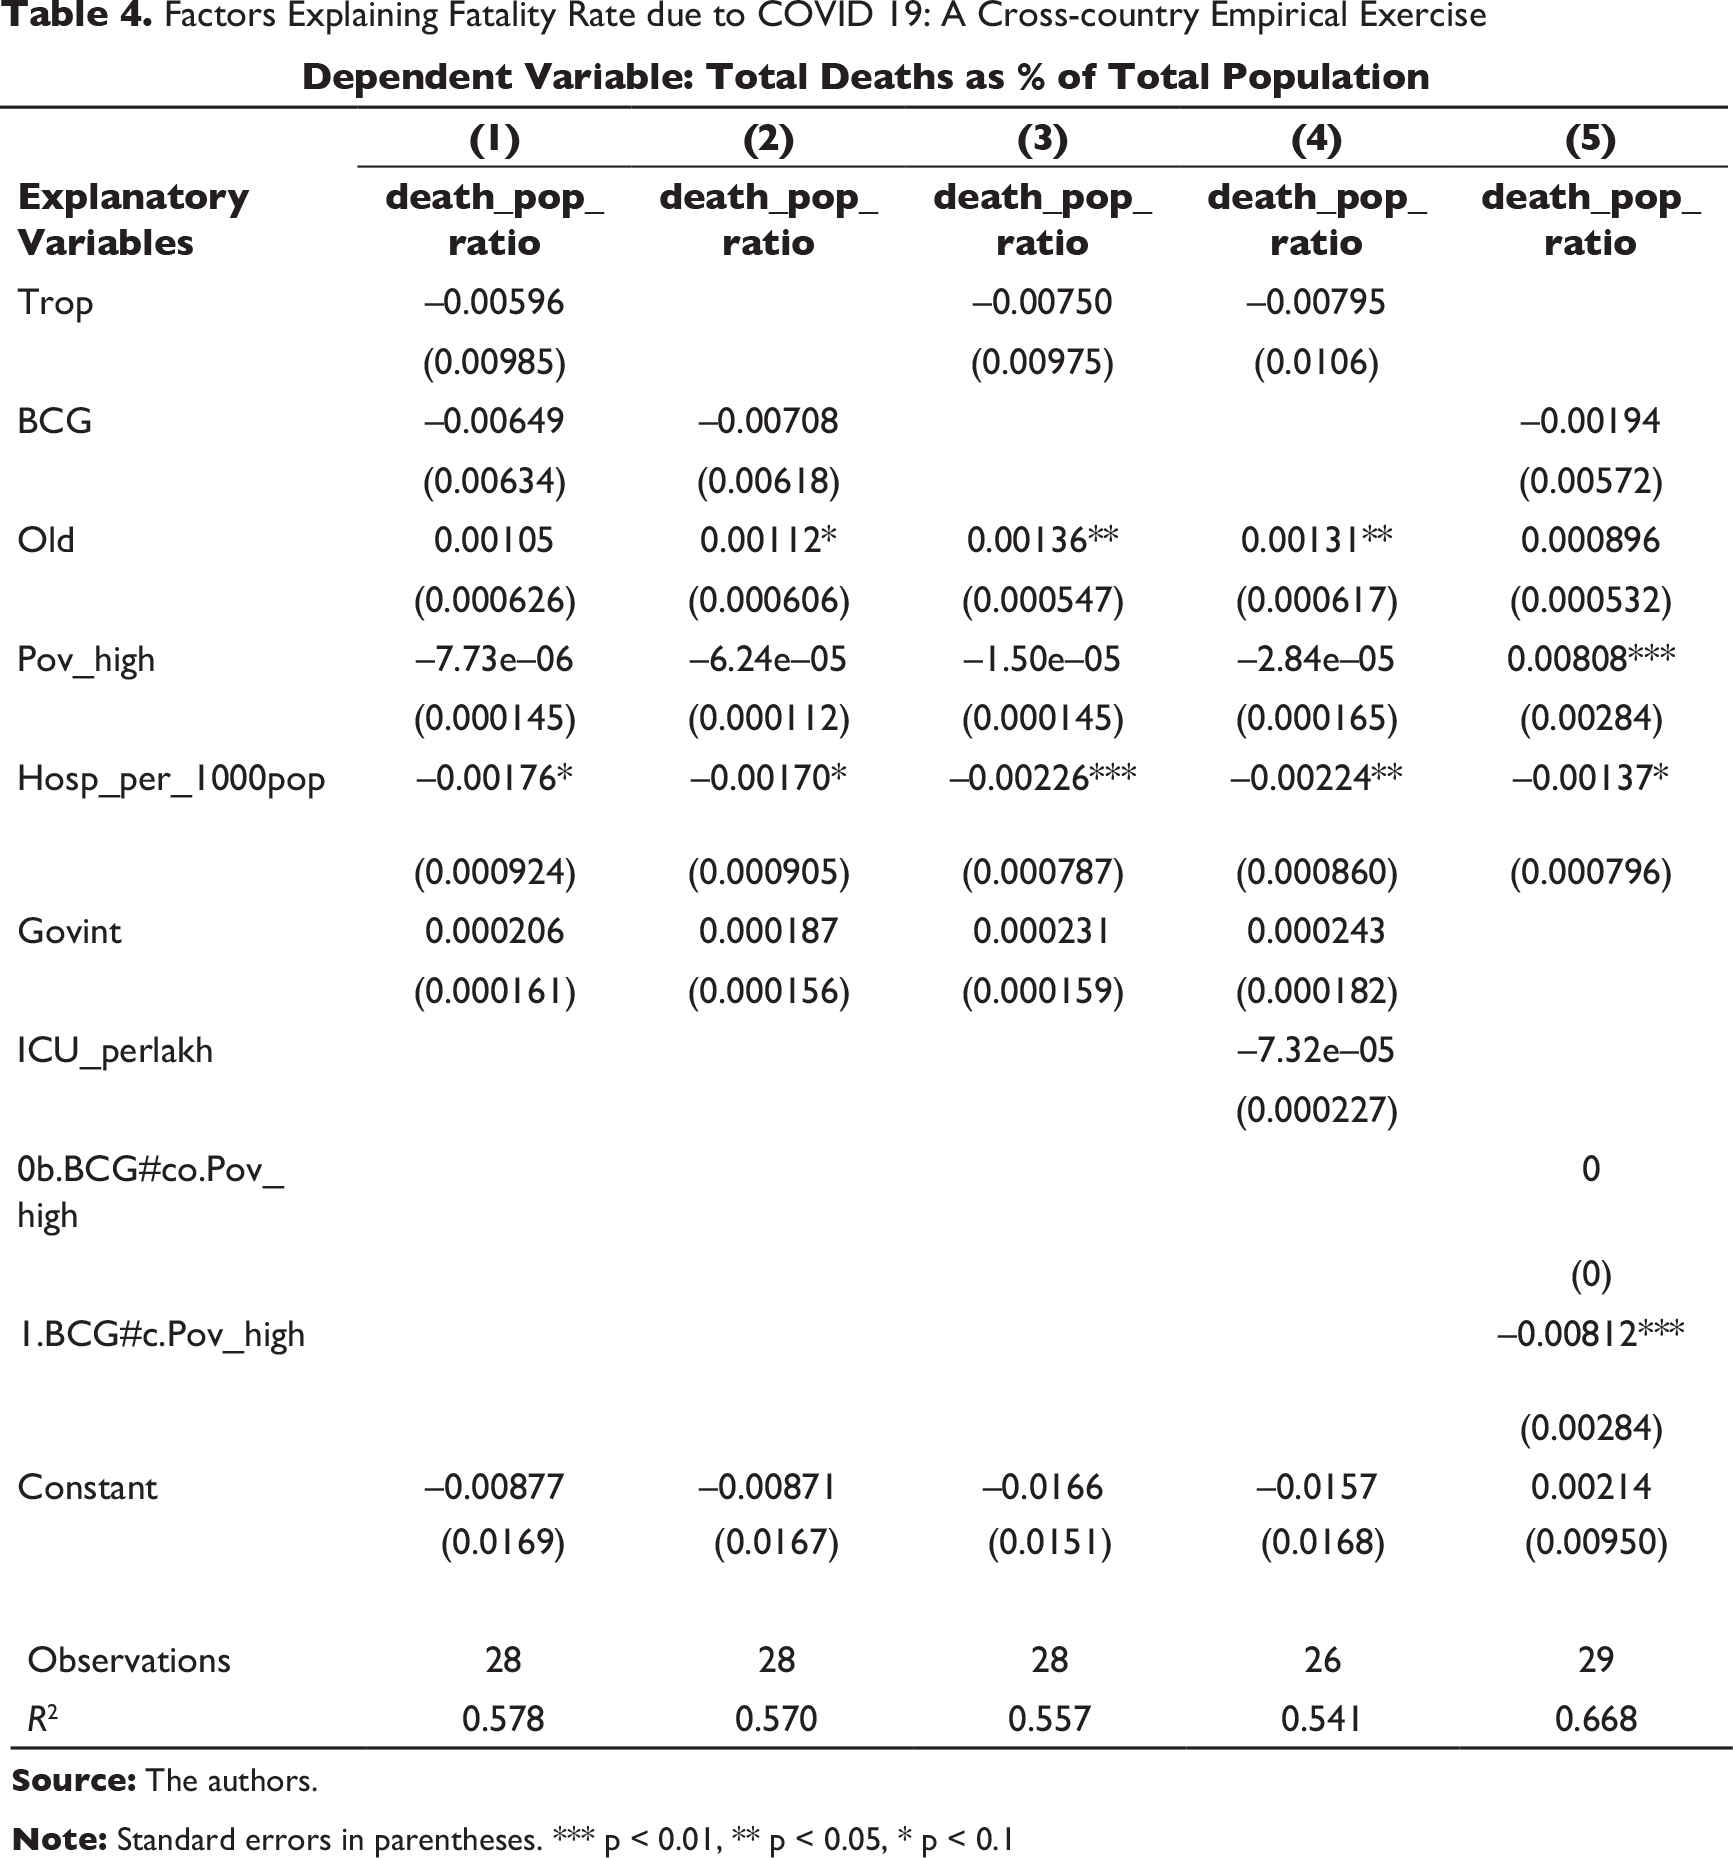
When total deaths as a percentage of the population (reported as of a fixed date 26 April 2020) is taken as the dependent variable (Table 4), we find that again the old population proportion and hospital infrastructure remain significant contributors. Additionally, in the last model (Column (5)), we find that poverty rate is positively significant implying countries with a higher proportion of poor population (with supposedly less access to health infrastructure and service facilities) have higher chances of fatality. However, among these countries, those with higher poor population or the countries who have active BCG policy remained relatively less vulnerable (e.g., many tropical emerging market economies including India); this is depicted by the negative (and significant) poverty-BCG interaction term in Column (5). Notably, government interventions (strictest mode) is coming to be insignificant in mitigating the CFR or death risks related to COVID.
Various countries are approaching to contain this pandemic in different ways and varying impacts. Although social distancing has been handed down as a response to this pandemic, implementing that through public measures as well as though citizen actions is a daunting task. Various models are prevalent—on one hand, we have the lockdown model like many countries and, on the other hand, we have the open model like South Korea. We first trace the ingredients of the lockdown versus open models and try to get some glimpses of what may be some of the options.
Some countries have been outliers in tackling the global pandemic. While South Korea focussed on data transparency and local isolation, countries like Sweden adopted a ‘low-scale’ lockdown approach. Singapore tried to follow South Korea but buckled down due to widespread cases due to its migrant population. Some open models for South Korea and Singapore are discussed.
South Korea: No National Lockdown, Contact Tracing, Large-scale Testing, Data Transparency and Dissemination, and Local Isolation: South Korea received its first case in January and it has focussed heavily on contact tracing, large-scale testing, sharing information and hotspot containment. If a person tests positive, the local authorities in the country send a message to those living nearby the infected person. The message typically contains the infected person’s age, gender and details of their movements. These are of course highly technology-enabled using sources from closed-circuit camera, mobile phones, credit card transactions and other digital sources. This may have raised privacy concerns but the policymakers have long back authorized publication of such data through the act ‘Middle East respiratory syndrome (MERS) in 2015’—a vestige from their last major outbreak. In fact, data are updated on their
Lessons: Early preparedness, data transparency and high testing helps.
Singapore’s Response in Early Days: No National Lockdown, Contact Tracing, Public Awareness and Local Isolation: The Singapore’s response was initially similar to the South Korean model and seemed to be working. Singapore had the experience of SARS 17 years ago, and being an island nation had some advantages over others and controlling the borders with Malaysia seemed to have paid off. Positive patients were not allowed back in the community and kept in the hospital until they tested negative. However, cases which were quite low escalated to 5,900 in a population of 5.7 million, which is significant. Some say that the answer lies with the huge migrant labour population from South Asia was perhaps overlooked. Maybe it was difficult for them to be home quarantined as groups of people were living in very small dormitories (Griffiths, 2020).
Lessons: Overlooked pockets if any can be major causes of concern.
Sweden: Low-scale Lockdown—Sweden had depended on voluntary action and advised people to work from home as far as practicable. Even large gatherings were not prohibited.
China: Local Lockdown, Early Detection, Isolation and Travel Restrictions: Many experts say that the Chinese model may seem to have been working in suppressing the spread of the infection, though the numbers are open to interpretation. Wuhan was put into complete lockdown with testing, isolation and travel restrictions which may have helped the country suppresses the spread of the virus.
India: National Lockdown, Limited Testing, Contact Tracing, Public Awareness and Isolation—India has taken a national lockdown approach like many of the European countries and the USA. While Italy has been highly criticized for their late response which started with a lockdown in northern Italy and later on extended nationwide. The merits of the lockdown model still need to be seen compared to other models which depend heavily on information exchange, contact tracing and isolation. However, the lockdown model undoubtedly has an impact on the national economy which needs to be estimated and the fine balance between life and livelihood needs to be maintained.
Factors Explaining Fatality Rate due to COVID 19: A Cross-country Empirical Exercise
Descriptive Statistics
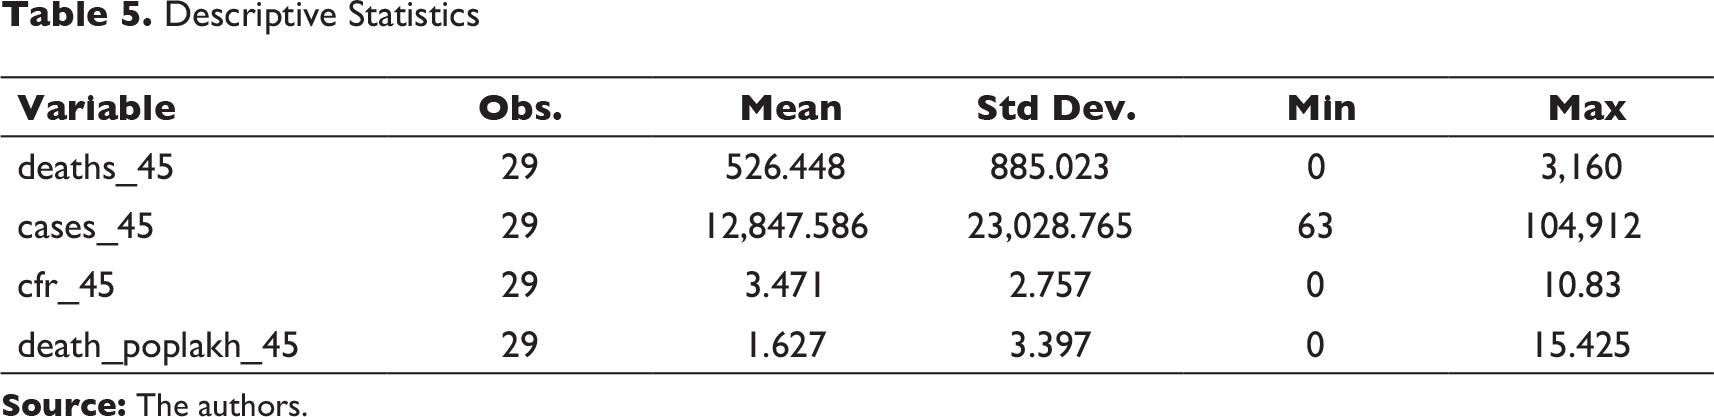
In order to avoid concerns related to the controversies over the numbers reported by the countries in the denominator of the factor CFR, we have defined a proxy dependent variable—death in lakh population on the 45th day of the onset of the disease—to capture the country vulnerabilities. This has been separately looked at because countries have had different timelines of their COVID-19 case histories; a comparison of country performances in terms of CFRs and death levels after a fixed number of days (45 days chosen here) might lead to interesting observations. We tried to find how our chosen set of co-variates explain the variations in this newly defined dependent variable, the descriptive statistics are given in Table 5. We have removed the outlier while doing this exercise and found that hospital infrastructure remains the significant factor in explaining the death rates after 45 days of the onset of this disease in our chosen set of countries. The descriptive statistics of this exercise is given in Table 5.
Conclusions
This article provides a comprehensive assessment in determining ‘fatality rates’ across a diverse set of 29 economies. Our results suggest that there are stark differences in accessing public health across select countries. Our findings indicate that poor and marginalized are the hardest hit by coronavirus because of their non-accessibility to the public healthcare system. It often argued that the healthcare system has actually collapsed in many countries because of the practice of neoliberalism. The USA and the UK are prime examples. Unfortunately, such healthcare system is also now relevant in emerging economies that includes India.
Our results also point to the fact that population age structure can lead to high fatality rate across countries. The study shows that the population above 65+ are at a significant risk from COVID-19 contagion. Such findings are consistent in the context of Europe. According to WHO report (Kluge, 2020) of the top 30 countries with the largest percentage of 65+ population, except Japan, all are the member states in Europe, and these countries are severely affected by the COVID-19. Evidences show that over 95 per cent of these deaths occurred in those older than 65 years; more than 50 per cent of all deaths were people aged 80 years or older. More importantly, the WHO report also suggests that 8 out of 10 deaths are occurring in individuals with at least one underlying co-morbidity, in particular those with cardiovascular diseases/hypertension and diabetes but also with a range of other chronic underlying conditions. However, the average age of patients who died in the USA is less than 50 (Mooney et al., 2020). Most of the young people suffered from underlying conditions such as asthma, diabetes and hypertension. This example has a strong relevance in the context of many emerging economies.
We have considered explanatory variables such as poverty rate and BCG vaccination as a proxy for active immune system, on CFR. We find that the poverty rate has had a proportionally higher impact on the fatality rate in the deprived region or society in a country. A recent study reveals the devastating scale of the death toll in the poorest part of the USA and the UK (Pidd et al., 2020). Ideally, the impact of BCG vaccination on fatality rate may be negative according to our framework. We see BCG and poverty rate add an interaction term to our model and thus drastically changes the interpretation of all the coefficients. Logically, if there is no interaction term, both the variables are expected to be interpreted as the unique effects on fatality rate. Our findings indicate that the interaction means the effect of poverty rate on fatality rate is different for different values of BCG vaccination. This approach implies that the magnitude of the devastation would have been very high due to COVID-19 in poor economies. But, it is BCG vaccination that has to some extent neutralized the loss in poor economies.
Footnotes
Acknowledgement
We are thankful to Professor Arup Mitra, Dean, Faculty of Economics, South Asian University, New Delhi, for his insights and suggestions. We also thank anonymous referees of the journal for comments on our earlier draft of the article. Thanks to Meher Khan for her assistance. All the usual disclaimers apply.
Declaration of Conflicting Interests
The authors declared no potential conflicts of interest with respect to the research, authorship and/or publication of this article.
Funding
The authors received no financial support for the research, authorship and/or publication of this article.