
Abstract
The NACE-based Q sector, which represents human health and social service activities, has a significant share of employment in Turkey. In the Q sector, the supply of qualified labour process of supplying qualified takes a long time and requires high-cost investments. Due to uncertainties about how and when the demand for health services will arise, the supply should always be higher than the demand. In this context, planning the supply of health services and making predictions about their demands are vital in terms of creating economically effective health service policies. Therefore, this article aims to forecast physicians’ supply and demand for health services. We employed machine learning (ML) methods for time series forecasting. In order to forecast the demand, two data sets from the health care sector between the years 1980–2020 and 2000–2020 were analysed. The supply of physicians per 1,000 people could be 3.04, and the demand 3.12 in 2030, and thus, a shortage in the supply of physicians could be expected in 2030. The main findings of the study demonstrate that there could be an imbalance between the rate at which physicians are expected to be demanded and the rate at which physicians are expected to be supplied.
Keywords
Introduction
The healthcare sector has similar characteristics to many areas of the economy. However, it is quite different in terms of the size of public intervention, high uncertainty in demand and asymmetric information exchange between the doctor and the patient health care service consumer. Therefore, it is distinguished from other sectors (Phelps, 2018). On the other hand, as the supply of health services is not elastic, especially in the short and medium term, healthcare services should be evaluated through an economic perspective. In Abuhanoğlu et al.’s (2012) study, the annual average education cost of a medical student for the 2009–2010 years was calculated to be 32.974,77₺ (≈$3.290) in Turkey. Therefore, it could be asserted that the cost of each physician to the public is quite higher than the cost of different departments.
New diagnosis and treatment methods, which are developed in order to meet the needs of today’s health care services, bring up the need for more employees. Such an assertion means that the availability of more treatment options correspondingly increases the demand for medical services (Folland et al., 2017). Besides, it is observed that the increase in the elderly population in Turkey has led to a greater demand for medical services in recent years.
In addition, since the prices of medical services are lower compared to some developed countries, Turkey attracts people from all over the world who visit the country just to make use of its health services, all of which increases the demand.
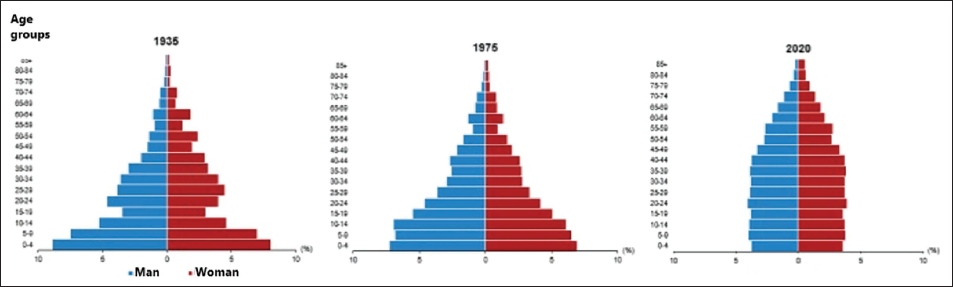
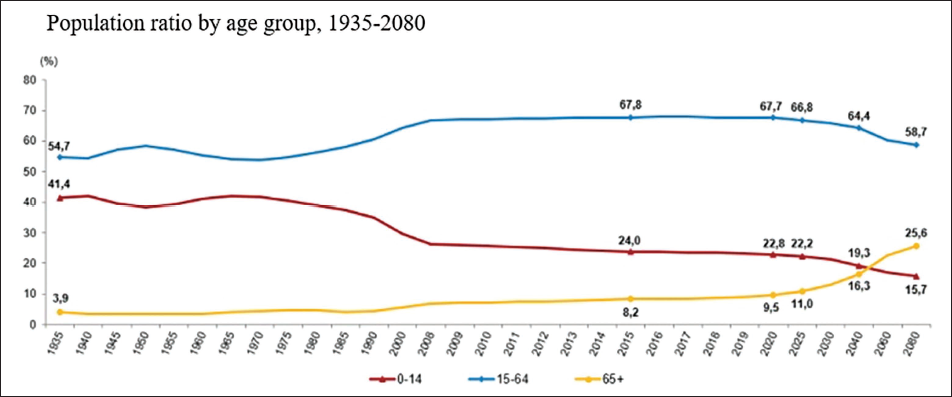
In Turkey, the elderly population alone has increased by 22.5% in the last 5 years. The proportion of the elderly population in the total population has increased from 8.2% in 2015 to 9.5% in 2020. Figure 1 indicates the increase in the population of 65+ for men and women over the years.
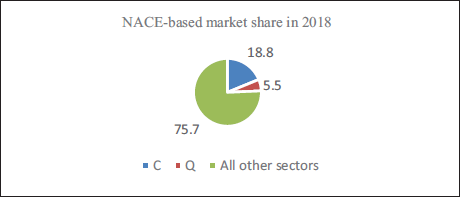
Health services stand as one of the most important sectors in the Turkish economy in terms of employment. In the classification of economic activity branches (NACE—The Statistical Classification of Economic Activities in the European Community), the Q sector represents human health and social work activities, where the number of employees in this field in Turkey constitutes approximately 5.5% of the entire working population (TURKSTAT, Elderly Statistics, 2020, 2021).
In the sector classification of NACE, the manufacturing (C) sector has the highest proportion, with an 18.8% share of total employment in the country. Accordingly, it could be suggested that the Q sector has a remarkable share in employment. The planning, regulations, and policies set in this sector are of vital importance. Therefore, we investigate how many physicians could be needed in Turkey in the next 10 years as part of healthcare sector planning.
In this study, the health workforce supply and demand forecasts for 2030 are made by considering economic, demographic, and health indicator factors. In order to forecast medical service supply and demand, only supply-based or only demand-based models are generally used. In that literature, there seem to be limited studies that assess the supply and demand in the health workforce by using machine learning (ML) methods. Furthermore, a lot of medical faculties have been founded since 2007 in Turkey. We would like to find out whether there is a sufficient number of faculty for the demand for physicians. Therefore, we aim to forecast physician demand and supply by 2030 for Turkey. In this study, both supply and demand are discussed using the ML method, which is one of the most novel techniques in the forecasting approach. The data for the past 20 and 40 years were used for the supply and demand models, respectively. It was foreseen that the number of available data points was slightly low for ML approaches. Hence, synthetic data was produced by using the synthetic data vault (SDV). Using data similarity tests, it was confirmed that synthetic data and real data were statistically similar. The ML algorithms were applied to real data and synthetic data. The forecasting results obtained from the real data and synthetic data were found to be coherent. It was illustrated that ML algorithms are feasible and reliable methods for forecasting the healthcare workforce.
Literature Review
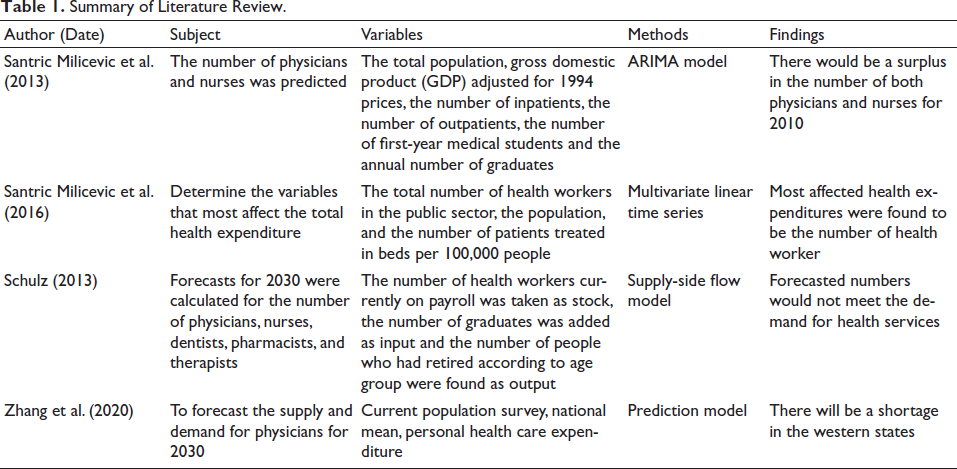
Summary of Literature Review.
In parallel with the given literature, we use a time series model to forecast physician demand and supply. As a contribution to the literature, we use ML and deep learning methods instead of ARIMA or VAR methods. The ML and deep learning approaches are used to predict or forecast many outputs of the health sector, such as forecasting blood supply (Shih & Rajendran, 2019). There is limited study to use ML and deep learning methods for human resource planning and forecasting.
Theoretical and Conceptual Background
Physician Services Shortage or Surplus
The shortage or excess of physicians is closely related to the capacities of medical faculties. It takes a long time to initiate a new medical faculty and train physicians. Therefore, there is a time lag that cannot be ignored between enrolling in medical school and graduating from it (Sloan & Hsieh, 2017). Moreover, since there is no substitute for a physician in general, physician supply planning becomes very important.
There are different approaches to forecasting medical personnel planning (Safarishahrbijari, 2018): these are time series models, optimisation models, mathematical models, statistical models and regression, the stock-flow approach and simulation methods. In this study, since forecasts are made by using time series, the used ML methods will be examined. The most frequently used methods in examining historical data are Box–Jenkins, exponential smoothing and vector autoregressive (VAR). ML algorithms can be used in regression like Box–Jenkins, such as ARIMA or VAR model, to forecast.
Healthcare supply and demand models are only supply-based, only demand-based or need-based, as established in the forecasting models with time series. The simultaneous assessment of the supply and demand of the health workforce using ML methods has not, to date, been addressed in the literature. In this study, both the supply side and demand side models are developed using the ML method, which is one of the latest developments in the time series and forecasting approach.
Research and Methodology
The ML and deep learning methods can be used for forecasting. Like the time series approach, supervised ML algorithms use ordered data in a regression and can make predictions or forecasts.
Since the data on physicians is annual, it is sequential. Therefore, forecasts could be made by using ML algorithms. In this study, we use deep learning and ML algorithms.
Deep Learning
Deep learning is a special type of ML algorithms and better version of artificial neural network (ANN).
Long Short-term Memory (LSTM) Recurrent Neural Network (RNN)
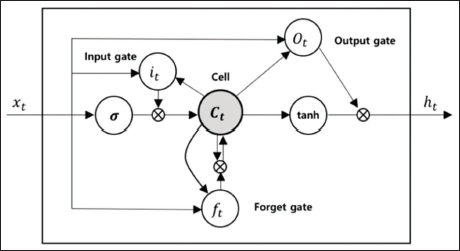
The LSTM network is one of the deep learning models. RNN is a deep learning network with internal feedback between neurons. These internal feedbacks allow for recollection of certain past events and participation in future experiences. LSTMs are sets of cells where data is retrieved and held. Cells in RNNs are analogous to transport lines and connect modules within the network. The historical data is taken and combined with the existing current data in the cell. Each cell has several gates, and through these gates the data is filtered, discarded or transferred to another cell. Gates in the sigmoid neural network layers allow data to be passed or discarded. Each sigmoidal layer has a value in the range of 0–1, a value of 0 indicates that no information is allowed to pass, and a value of 1 indicates that all information is allowed to pass. There are three kinds of gates in the LSTM cell. These are input, output, and forget gates, as seen in Figure 1. Each gate performs continuous operations for the cell. Cells are responsible for transmitting status values at time intervals. Each gate can read, write or delete these values (Gers et al., 2002).
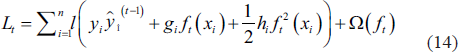
The calculation process for an LSTM block is illustrated in Figure 3. If the input gate so allows, the input value is kept in the cell state. The input value and the candidate values of the memory cell 
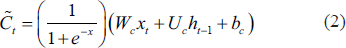
where W and U are weight matrices and b are the deviation values. The weight of the state unit is governed by the forget gate, and the forget gate value is calculated using Equation (3).

Currently, the memory cell’s new situation updated as

The new state of the memory cell and the output value of the gate are also defined as

In this case, the last output value of the cell is
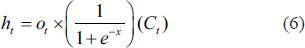
The output gate can block the output value of the cell, and all gates use sigmoid nonlinearity. Here, state units act as inputs to other gate units (Gers et al., 1999). Thus, the LSTM structure can calculate long-term dependencies at low computational cost (Kim et al., 2017).
ML Algorithms
Tree-based Methods
Tree-based methods are used in both regression and classification problems (James et al., 2016).
Random Forests
Random forest algorithms are one of the ensemble learning methods. Ensemble learning is the collective learning of more than one algorithm or more than one tree, where weak learners come together and try to predict the fitting function. Basically, the random forest algorithm is one of the tree-based bagging methods. Hence, by using many decision trees, the method of prediction gets more efficient (Breiman, 1996).
Gradient Boosting Algorithm (GBM)
Decision trees are formed by combining weak prediction models. This method is called boosting. In incremental methods, all training data are used for regression. This algorithm attempts to create strong estimators by combining weak estimators through iterations. In doing so, it defines and minimises the loss function (Géron, 2019).
XGBoost (Extreme Gradient Boosting Algorithm)
XGBoost, which is used to predict the target variable with training data, is a supervised ML. The XGBoost uses a set of classification and regression trees. With this algorithm, the data is grouped into different leaves and scores.
Boosting is an ensemble method in which many weak learners are combined, thus obtaining a strong learner. One such approach is tree boosting, where learners are decision trees. XGBoost can be considered one of the tree boosting methods, but unlike other tree-based methods, it uses Newton boosting instead of gradient boosting.

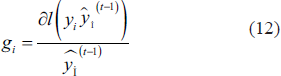
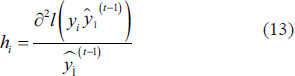
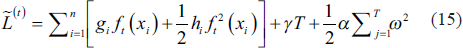
Optimal parameters in Newton boosting are found by minimising the (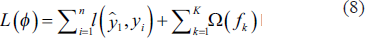
To minimise the loss of tree-based models with Euclidean space is a hard task, so instead generalised additive models can be used. In this context, t, which is expressed in the function 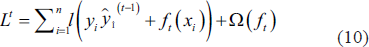
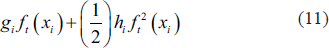
the above is obtained.
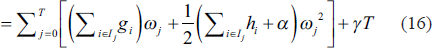
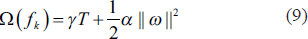
The weight of each leaf node is given by:
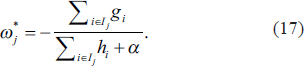
Accordingly, the tree structure q’s loss function at leaf node j is expressed as
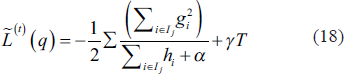
The information Gain equation from all these expressions can be defined as
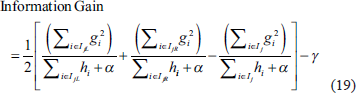
IjL and I IjR j is the sample set of the left and right leaf nodes.
XGBoost branches towards each leaf node and creates the base learners according to the criterion of maximising information acquisition. With the help of Newton boosting, XGBoost can learn adaptively.
LightGBM
With increases in data size and variety, algorithm optimisations have become important. Gradient boosting algorithm is optimised different ways such as XGBoost, LightGBM and CatBoost algorithms. The LightGBM algorithm, which allows for reduced memory usage and higher prediction success, was developed by Microsoft researchers. In traditional gradient boosting applications, the entire data set must be scanned to allow for the estimation of each variable. In this case, the computational cost increases in direct proportion to the increase in the data size and the number of variables. To solve this problem, the number of variables and the number of samples can be reduced, but since no weighting can be made in the gradient boosting algorithm, it has not been directly possible to do this (Ke et al., 2017).
Facebook Prophet
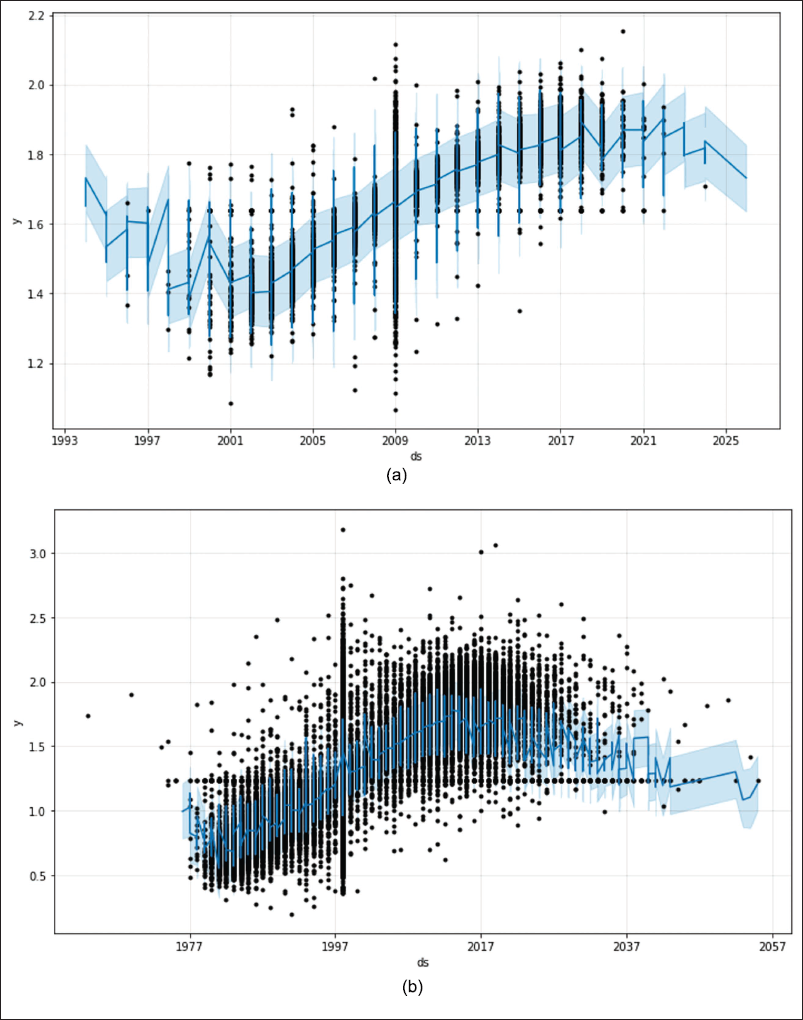
PROPHET is open-source software developed by Facebook for time series prediction. It has been developed especially for the prediction of data with non-linear weekly, monthly or annual seasonality, as well as data affected by holiday periods. It can also work with data loss or anomalies. It was originally intended to work with a single variable data set, with the date column ‘ds’ and the time series values in the ‘y’ column. By adding additional regressors, independent variables can also be added. The parameters are typically set for daily data, but since annual data are used in this study, the predictive horizon (12 × 360) is taken as days.
PROPHET time series are handled by dividing them into trend, seasonality and holiday components, similar to the generalised additive model (GAM) (Taylor & Letham, 2018)

g(t) is the trend component, s(t) is the annual or weekly seasonality component, h(t) is the one or two-day irregular holiday effect and
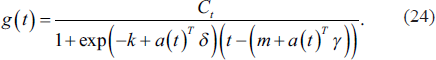
There are two types of trend models in PROPHET. The first is the Non-linear Growth Model:
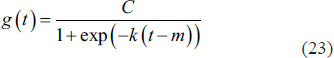
where C is the carrying capacity, k is the growth rate and m is the balancing parameter. Another trend model is the Piecewise Logistic Growth Model:
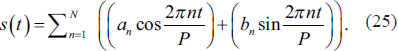
Seasonality is expressed by the standard Fourier series:
The holiday component can be expressed as:

Evaluation of Models
The goodness of fit of the solutions obtained can be evaluated via the fitness function. In this study, root mean squared error (RMSE) was chosen to evaluate the goodness of fit. The smallest RMSE is accordingly considered to represent the optimal solution. With 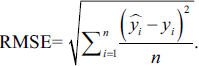
The RMSE value was chosen because it gives the highest penalty for errors.
Synthetic Data
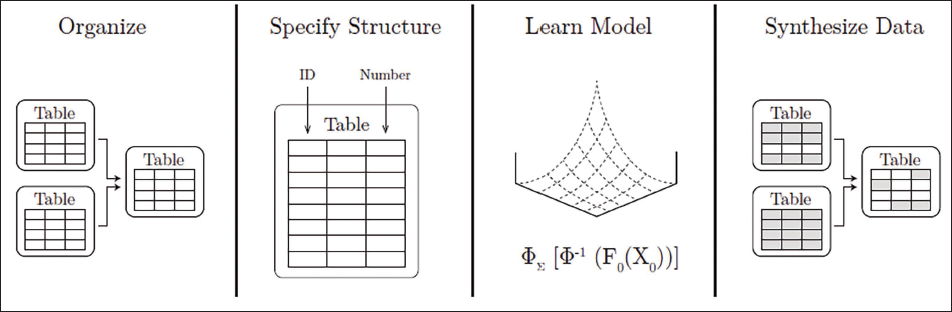
In ML methods, data size is important to the success of model training. However, when the data is annual, the data size may be small. In such cases, synthetic data generation methods developed for data scientists can be used. One of these methods is the SDV. The ‘sdv.tabular.GaussianCopula’ model is based on the copula function. The copula is a uniform distribution with
After the user enters the data and schemas into the SDV library, the model is fitted to the data. Synthetic data is generated from the fitted model and can be saved as a Python file with the extension ‘.pkl’ for later reuse.
The flowchart of the SDV library is illustrated in Figure 4.
Synthetic Generation of Time Series Data
In the SDV library, there is a specially developed ‘PAR’ model for time series data. The PAR (Probabilistic AutoRegressive) model is used for multivariate time series (MIT Data to AI Lab, 2018).
Data, Analysis and Results
In the study, data from the Organisation for Economic Co-operation and Development (OECD 1 ) between 1979 and 2018 for physician demand and 2000–2019 for physician supply were used. Data from the OECD include physicians working in the public and private sectors. For all variables, all the previous years’ data could not be obtained. Thus, the data between these years were taken. In the physician supply model, physician numbers who have migrated from Turkey are taken from the Turkish Medical Association Reports.
Physician Supply Data and Forecast
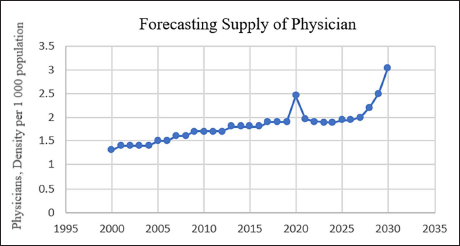
In this study, the number of doctors per 1,000 people was used as the dependent variable, and the number of medical school graduates per 100,000 people (a proxy to higher education production), the number of doctors migrating abroad and the number of foreign doctors were used as the independent variables. In this study, using the same variables, the number of physicians per 1,000 people in Turkey was forecasted for 2030.
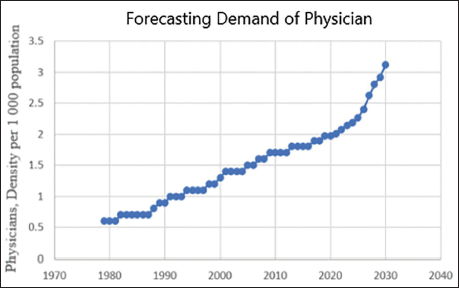
Physician Demand Data and Forecast
Scheffler and Arnold (2019) forecasted the physician demand using ARIMA. In their study, the number of physicians per 1,000 people is used as the dependent variable. On the other hand, GDP per capita calculated according to 2010 purchasing power parity, out-of-pocket health expenditures as a percentage of total health expenditures and the percentage of the population over 65 are taken as independent variable. We used the same independent and dependent variables in our forecasting model. According to Scheffler and Arnold (2019), the population older than 65 is expected to increase the demand for health services. And, as a consequence, physicians as well; the increase in out-of-pocket health expenditure, on the other hand, is expected to negatively affect the health service. According to Hensher et al. (2020), it is generally accepted that when the per capita GDP of countries increases, the demand for health services also increases.
Training Data and Test Data
80% of the whole data set is reserved as training data and 20% as test data. Training data is used to search for and define effective parameters, while test data is reserved for out-of-sample evaluation as well as for performance comparisons between predicted models. Since the used data sets were small, test data were used for validation as well. That is, for validation, data separation was not carried out.
Analyses were performed using the Spyder IDE and Jupyter Notebook in the Python 3 programme. In addition, the scikit-learn, pandas and NumPy libraries in the Python programme were the main libraries used in the ML algorithms. The TensorFlow platform and Keras API were used for recurrent neural networks. In addition to these, the PROPHET time series prediction procedure developed by Facebook was used. The SDV library was used for synthetic data generation. The PyCaret library, which allows the model to be fitted and predicted automatically with various algorithms, was used as well.
In this study, both original data and synthetic data were produced, and forecasts were made with ML algorithms. In Section ‘Forecasts with Original Data’, the study and results using the original data are included. In Section ‘Forecasts with Synthetic Data’, the forecast is performed using synthetic data. Following that, the results were discussed.
Forecasts with Original Data
Three different methods are preferred for time series data validation. These include separating the data set into training and testing, segregating many training and test data series, and finally, walk-forward validation. In this study, the walk-forward validation approach is used (sliding window), and subsamples for training the LSTM ANN are created to provide better training. Thus, the training data for physician demand is [40,6,3] and [20,6,4] for physician supply, while Xdemand = [210,6,1] and Xsupply = [90,6]. In addition, ‘n_estimator’ = 1,000 is taken at the end of the parameter-setting process in the XGBoost algorithm.
Figure 5 reveals the prediction results of training and test data in the used methods. In the figure, the estimated and expected values from the XGBoost method were closest to each other.
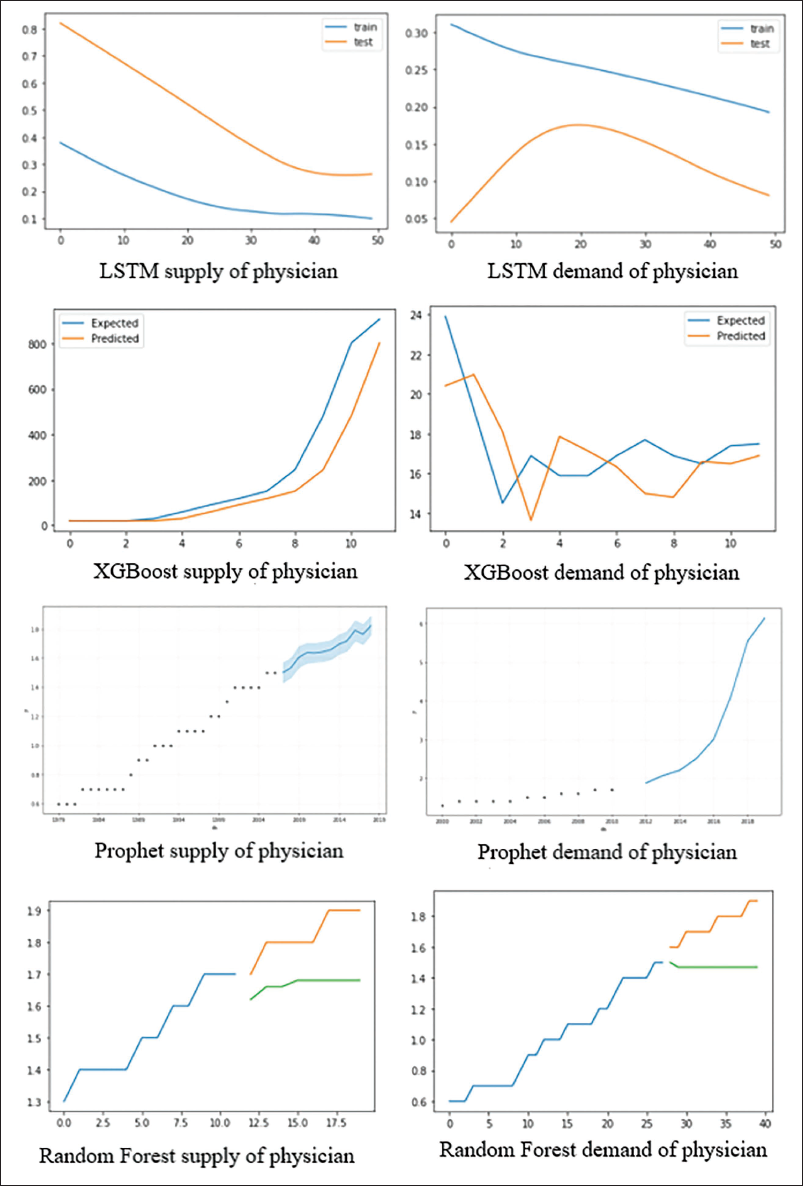
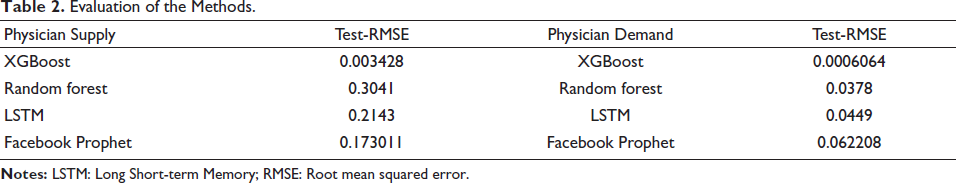
As Table 2 reveals, the model with the lowest error rate is the XGBoost model, though the LSTM and PROPHET methods also have relatively low error rates. Physician supply and demand results for this model are given in Figures 6 and 7.
Evaluation of the Methods.
Forecasts with Synthetic Data
With the SDV library, separate data were produced for the physician supply and physician demand data sets. In addition, ML algorithms were automatically modelled with the ‘PyCaret’ library and model performance comparisons subsequently made. The Facebook Prophet and LSTM methods were also used for modelling, which are not in the PyCaret library. Working with the synthetic data, Prophet could generate results. However, the TensorFlow platform, which is used for LSTM, and PyCaret libraries, failed to generate predictive results.
Due to the fewness of the original data, synthetic data with 100,000 observations were produced for both the supply and demand data sets. For both data sets, the compatibility of the original data and synthetic data was tested. The ‘evaluate’ function has been developed in the SDV library to evaluate the similarities between synthetic and original data. The ‘evaluate’ function performs various tests, such as the Kolmogorov–Smirnov (KS) test, which is used in data similarity tests and gives the average result across them. While the evaluation result for physician supply was 0.5554, physician demand was found to be 0.4779. 0 represents the worst, and 1 stands for the most successful synthetic data generation. The tests and their results are given in Appendix A (Tables A1 and A2). Furthermore, synthetic data with 2,000 and 10,000 observations were produced and evaluated as the number of samples to understand whether there was a large change between the number of data and the similarity rate. While the result of the evaluation was 0.5771 and 0.5403 for physician supply, respectively, 0.5145 and 0.4944 were obtained for the respective physician demands. The increased number of data points produced by SDV did not affect the overall similarity between the original and synthetic data. Since ML methods require great number of data points, the training and testing processes were carried out by using synthetic data with 100,000 observations.
Forecasting of Physician Demand with Synthetic Data
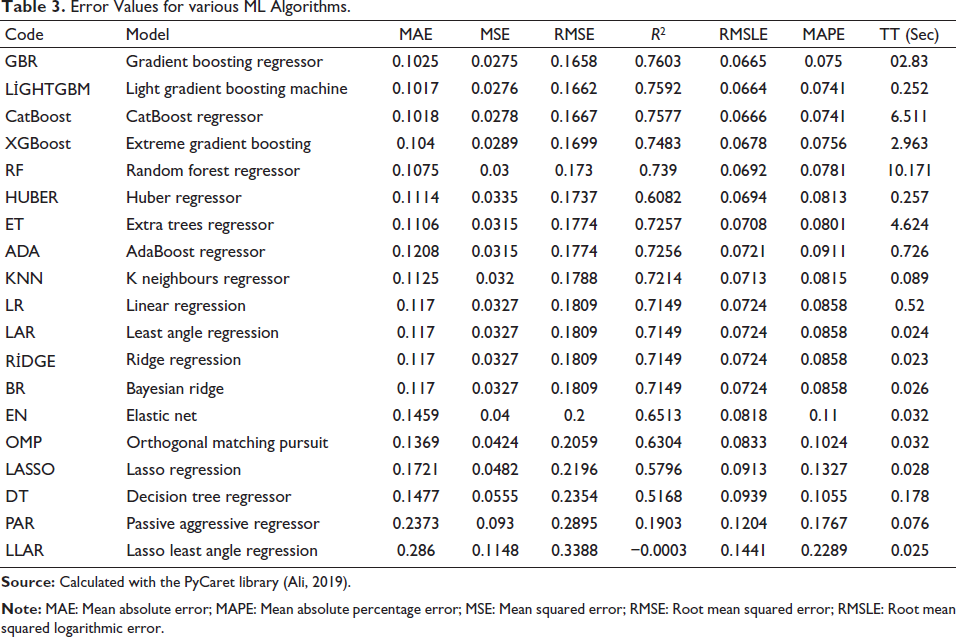
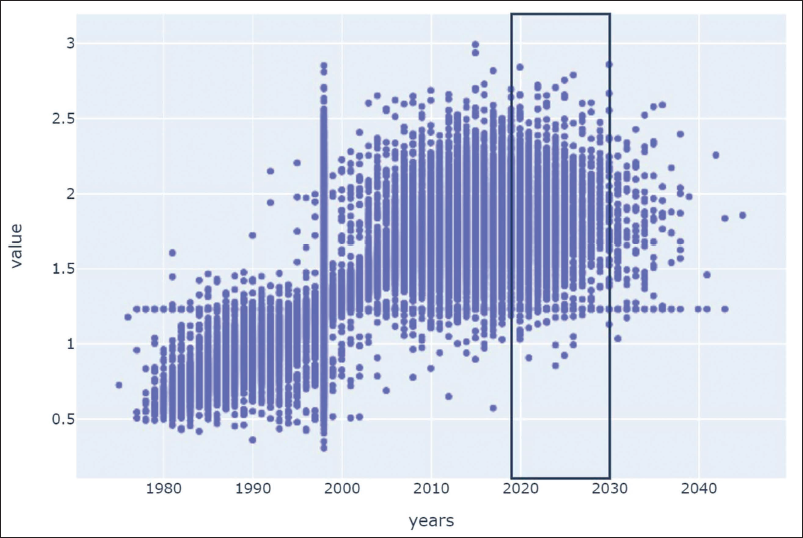
The error rates of ML methods that are obtained through the predictions of synthetic data are given in Table 3. According to the table, the gradient boosting algorithm gave the best forecast (that is, it had the smallest associated RMSE). The results could be observed in the graph in Figure 8. It is estimated that the demand for the number of physicians per 1,000 people in 2030 could be 2.86.
Error Values for various ML Algorithms.
Forecast of Physician Supply with Synthetic Data
Error Values for ML Algorithms.
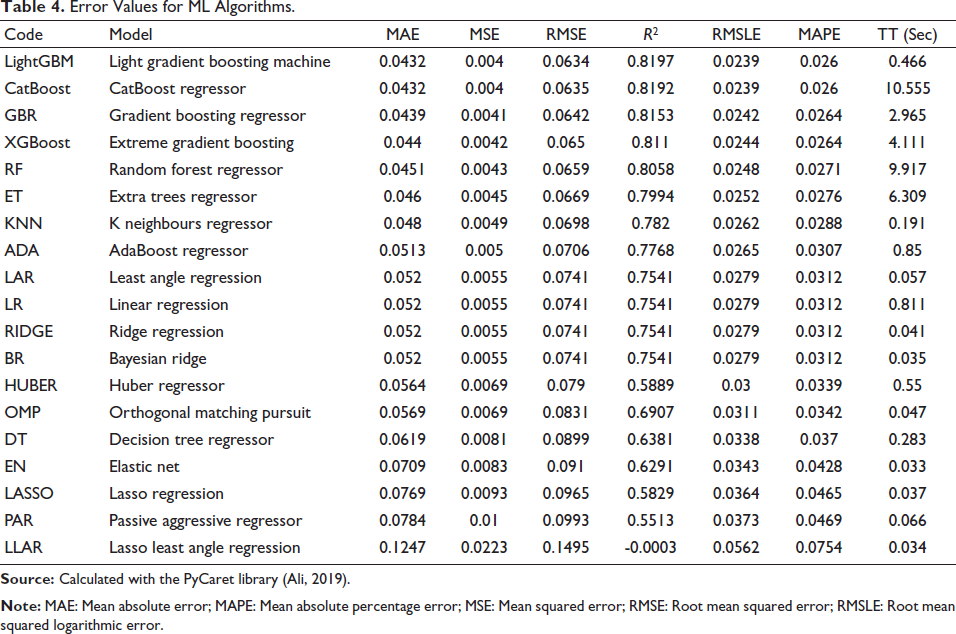
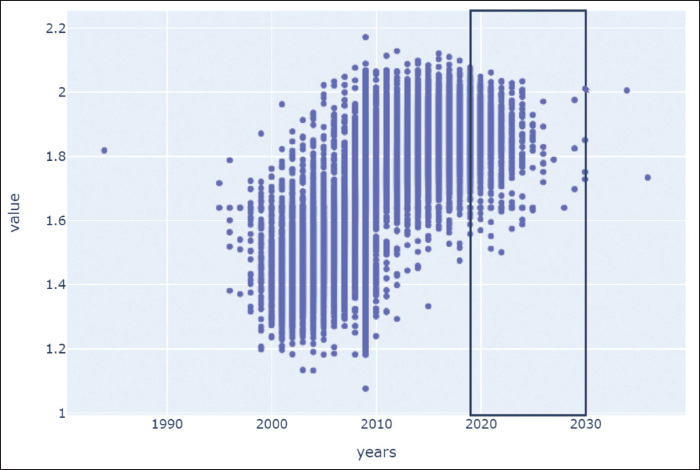
Figure 10 presents the graphs of the forecast results, which are prepared by using synthetic data with the Facebook Prophet procedure: the numbers per 1,000 people were found as (a) 1.79 for physician supply and (b) 2.5 for physician demand.
Discussion and Findings
The Q sector, which represents human health and social work activities in the classification of economic activity branches, has a remarkable share of the overall employment in Turkey. In this study, forecasts were made for the Q sector with the time series method. The number of physicians, who are vital for medical services and are expected to undergo a long and costly training process in medical education, was analysed.
In this study, we use ML methods of random forest, XGBoost, PROPHET and LSTM for the predictions of original data. In this study, the number of doctors per 1,000 people was the dependent variable for the estimation of the physician supply. Besides that, the number of physicians who migrated abroad, the rates of dropout from the medical school, the number of foreign physicians and the number of graduating physicians per 100,000 people were the independent variables. In order to predict the physician demand, the number of physicians per 1,000 people is dependent variable. On the other hand, GDP per capita, the ratio of the population over 65 to the total population and the ratio of out-of-pocket health expenditures to total health expenditures are independent variables. By comparison of RMSE errors of the estimation methods, the lowest error rate was found for the XGBoost.
According to the estimated results given by the XGBoost ML method, the supply of physicians per 1,000 people will be 3.04 and the demand 3.12 in 2030. Thus, a shortage in the supply of physicians can be expected.
Due to the paucity of the original data, synthetic data with 100,000 observations was produced for both the supply and demand data sets. The results seem to match the original data.
Gradient boosting for physician demand and LightGBM algorithms for physician supply with synthetic data gave the lowest RMSE errors, through which it was estimated that the supply of physicians per 1,000 population will be 2.03 and the demand 2.86 in 2030. In accordance with the original data, the results indicate that the supply of physicians could fall behind the physician demand.
Looking at OECD countries, the number of physicians per 1,000 people for 2018 is 3.5. Compared to this, for Turkey the number of physicians per 1,000 people for the supply side is expected to be 2.08, and demand is expected to be 2.86. Therefore, it could be claimed that Turkey will approach OECD countries, yet, remain below this average in 2030.
As Figure 11 suggests, in recent years, health tourism has excessively increased. The data could not be included in the analysis because it only covers a very short period. However, considering this, an increase in demand for medical services could be expected in the upcoming years.
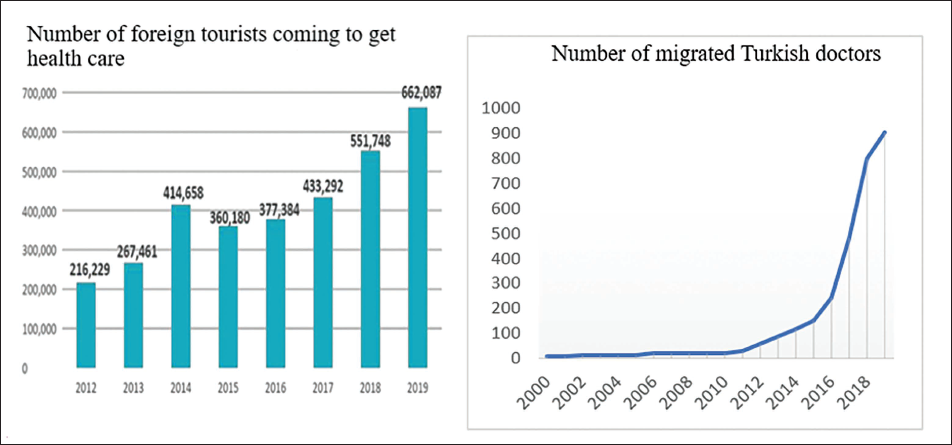
As it could be observed in Figure 11, there has been an approximately 87% increment in the number of doctors who migrated abroad between 2014 and 2019. In addition to that dramatic increase, the proportion of foreign physicians in Turkey is 3% of all physicians, which is quite low compared to other OECD countries such as Germany, which has nearly 13% foreign physicians (OECD, 2020). Increase in the number of Turkish physicians migrating abroad due to low salary, which is for practitioners nearly $1,200 and for specialists nearly $2,000–$3,000. Therefore, it is expected that the supply of physicians will lag behind demand for physicians, which supports the forecasting result.
Furthermore, according to the population change projection from TURKSTAT in Figure 12, the proportion of the population over 65 years of age will tend to increase by 2030 and, in fact, even before the arrival of 2030. With the increase in the elderly population, the demand for medical services is expected to increase accordingly. Similarly, in the foresight results, it was observed that the demand for physician services, which is the basic building block in medical services, increased.
In the study by Scheffler and Arnold (2019), predictions were made for the number of physicians and nurses for OECD countries. It was estimated that the supply of physicians for Turkey will lag behind the demand. These results, thus, support our findings that there could be a physician shortage by 2030.
Conclusion
As a result, this study found that the demand for physician services in Turkey could increase towards 2030, and the supply could not be sufficient to meet it. And we observed that ML algorithms are feasible and reliable methods for forecasting the healthcare workforce. This is a new approach to healthcare workforce planning. Therefore, it could be suggested that this approach is a new contribution to healthcare management. In the artificial intelligence era, healthcare management should not be out of this kind of novel approach.
Medical education takes a long time. Accordingly, the supply of physicians is not elastic in the short term to address this shortage. What is worse, there is no substitute for physicians. In this context, appropriate planning to meet the anticipated demand for physicians is very important within medical services. Considering all these factors, it could be stated that workforce planning in this regard is vital to avoid a shortage of physician supply in the Q sector, which is one of the sectors that makes up a considerable proportion of overall employment in Turkey. To meet these physician demands, the capacity of medical schools and physicians’ wages could be enhanced. Further to that, a research approach could be applied for forecasting the number of health workers per 1,000 people, such as physiotherapists, nurses, midwives and dentists. For Turkey, we cannot forecast these workers’ numbers, because there are no detailed national records for physiotherapists, nurses, midwives and dentists’ demand and supply model variables.
Footnotes
Acknowledgements
This article is taken from a PhD dissertation, which was supervised by Professor Dr Ercan Eren. The thesis title is ‘Agent Based Modelling and Forecasting with Machine Learning of Healthcare Supply and Demand’. Also, we really appreciate Dr Dan Sava (a PhD in Health Economics) for his contributions to this article.
Declaration of Conflicting Interests
The authors declared no potential conflicts of interest with respect to the research, authorship and/or publication of this article.
Funding
The authors received no financial support for the research, authorship and/or publication of this article.