
Abstract
The present study seeks to examine the varied asymmetric effects of Dow Jones Sustainability indices (DJSI) over a period from 1998 to 2020. Here, the study period is divided into three sub-periods (pre-recession, recession, and post-recession). The study applies ARCH and GARCH approaches to observe the nature of volatilities and their effect on their daily return. The study reports presence of significant asymmetric shocks and persistence of conditional volatilities in the daily returns during all the sub-periods. Moreover, leverage effects exist in the returns during the sub-periods except DJSI US. It is also observed that EGARCH and TARCH measures are appropriate in pre-recession and recession periods, but GARCH is gainful in post-recession.
Introduction
The movement of equity market has been topic of interest since its inception. Volatility is one of them, which occurs due to uncertainty in the market and produces both positive and negative effects (Poon & Granger, 2003). Many studies have examined the above issue with diverse evidence. In financial literature, asymmetry is related to the fact that increases volatility. However, earlier, conditional mean is considered for modelling time series data where conditional variance was kept aside. But, currently, conditional variance was given the same importance along with the conditional mean.
Mandelbrot (1963) first points out that volatility clustering is attached to the observation that big changes tend to be followed by big changes of either sign or vice versa. Further, this concept is extended by Fama (1965), Baillie (1997), and Chou (1998), and after that, various models are developed to examine the diverse asymmetric effects that lie in the stock market. Although the volatility clustering was empirically first studied by Engle (1982) by applying ARCH (Auto Regressive Conditional Heteroskedasticity) specification and this was further extended by many (see Bollerslev, 1986; Engle et al., 1987; Glosten et al., 1993) and develop GARCH (Generalized Auto Regressive Conditional Heteroskedasticity) specification. Black (1976) opines that volatility depends on both shocks, whether they may be positive or negative that does not matter, and it may be termed as leverage effect.
Similarly, Christie (1982) and Nelson (1990) observe that equity prices are adversely affected by changes in volatility, and this phenomenon is observed by Engle and Ng (1993) through news impact curve. Thereafter, various non-linear extensions of GARCH are developed to test leverage effect (see Glosten et al., 1993; Zakonian, 1994, etc.). Additionally, many studies have empirically examined the nature of volatility in different markets (see Ameur & Senanedsch, 2014; Chen et al., 2005; Engle et al., 2007; Gazda & Vyrost, 2003).
From the above, it may be said that volatility plays very crucial role in the movement of equity market, and thus the researchers are very much interested in it. There are many works that examine the effect of volatility on traditional indices, but work on sustainable, responsible indices is scanty. Thus, keeping this point in mind, the present study tries to examine the diverse asymmetric effects of the Dow Jones Sustainable Responsible Indices (SRIs) caused by volatility. The earlier studies on SRIs focused on financial performance evaluation and compared it with traditional indices (see Consolandi et al., 2009; Kurtz & DiBartolomeo, 1996; Managi et al., 2012; Schroder, 2005; Statman, 2000). But this study considers a large set of data and examines the diverse asymmetric effects that surely add value to the existing literature, which is the uniqueness of this study.
After a brief introduction in the first section, the second section deals with data and sources. The third section describes methodology. The fourth section analyses the outcomes and the fifth section is associated with conclusion and recommendation.
Data and its Sources
Here, daily closing time series data are considered, which is obtained from the official websites of
Methodology
The daily return of the DJSI is computed as follows:

Here, Pt means current price at time t and Pt-1 denotes price of the previous period.
The pattern of time series distribution is checked by applying the Jarque–Bera test statistic.
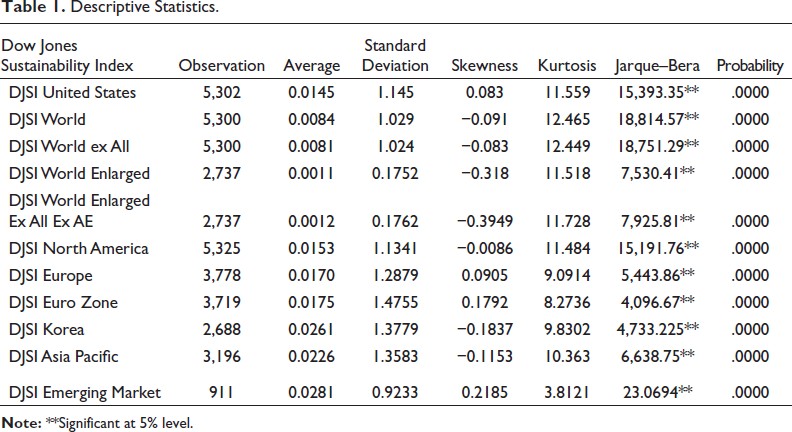
The descriptive statistics of the indices are presented in Table 1. Here, the average return of the indices is not far different with each other and shown positive sign. DJSI Emerging Market Index generates highest average return (0.0281) as compared. The highest risk is provided by DJSI Euro Zone (1.4755). The J–B statistics show data non-normality.
Descriptive Statistics.
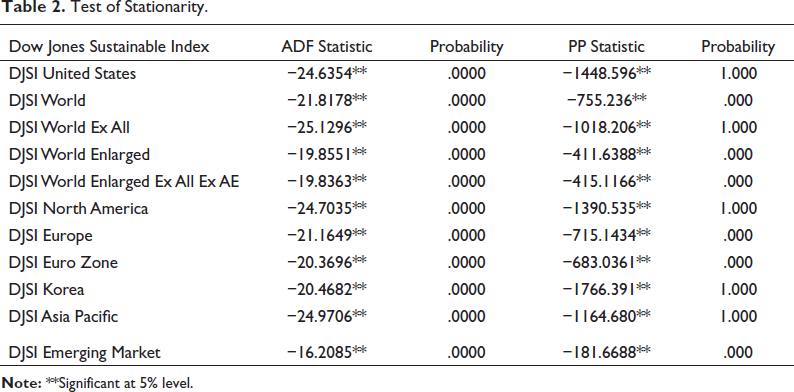
Similarly, the stationarity of the time series data is tested by applying ADF and P–P tests and the outcome is presented in Table 2. It is observed that the test statistics based on both methods are statistically significant when first difference operator is used and thus H0 is rejected that means return distribution of the DJSI Indices is free from unit root problem.
Test of Stationarity.
Box–Pierce Q statistic is applied to observe volatility clustering:

where sample size is denoted by n and l means lag length. Here, the study considers 24 as maximum lag length because there might be at most 24 trading days in a month based on the past studies.
Generally, financial time series follow a random walk (RWH), and to model such behaviour, ARCH framework (e.g., Engle, 1982) is applied:

It is assumed that the variance of the error term at current period depends on squared distributions of the previous period, which creates autocorrelation, and it may be further said that the variance of the current period depends on several lagged squared distribution terms that can be modelled as follows:

Here, the following hypothesis is formulated to test ARCH effect:
H0: β1 = β2 = ··· = βp = 0
Ha: β1 = β2 = ··· = βp ≠ 0
Therefore, Engle (1982) proposes to run an auxiliary regression equation by taking into consideration the squared standardized residuals:

where
The GARCH model is applied if there is a presence of ARCH effect. Here, the moving average specification of ARCH is corrected through GARCH mechanism. The prediction of variances, which is linked with the lagged variances of the capital assets, changes according to time. In general, sudden ups and downs of the equity prices produce excess volatility in coming periods, which can be shown by GARCH(p,q), where squared error is denoted by the p-lagged term and lagged conditional variance is denoted by q, as below:

where p and q represent ARCH and GARCH processes, respectively. Vt is the random error. Equation (7) shows the dependency of variability in current period, which is associated with the preceding period known as conditional variability. The study uses ARIMA method (e.g., Box-Jenkins 1970) to determine the degree of p and q, and thus, the optimum GARCH(1,1) model can be written as:

It is assumed that if the variance is positive, then the coefficients in Equation (8) will be positive only when variance stationarity is maintained within the condition that they (constant)
The
Even though the GARCH framework does not correctly consider the asymmetric effect that occurs repeatedly when varied volatility is documented methodically (positive and negative shocks). Martingle process says that ups and downs of equity prices are occurred due to shocks or news. Leverage effect occurs only when a fall in equity prices goes together with the enhancement of volatility higher than the volatility set on by rise in equity prices, and this whole phenomenon can be structured under the framework of EGARCH and TGARCH.
The return of the DJSI at time t can be written as:


where Zt denotes standardized residuals. Ʌ indicates conditional density function, and v means vector of the parameters.
Here, the structure of conditional variance is as below:

The conditional variance is expressed as
The EGARCH model is significant in terms of its parameters’ negative sign when conditional variance shows positive. The coefficient α in Equation (12) represents ARCH effect. Similarly, β shows GARCH effect that takes long time to die out when β is large (see Alexander, 2009). The leverage effect is measured by the negative value of λ. If the value of λ is 0, then Equation (12) is symmetric, and if it is less than 0, then good information produces less volatility than bad and vice versa.
Sometimes, it is observed that volatility reacts differently according to shocks, whether they are positive or negative. According to Engle and Ng (1993), bad news produces higher volatility as compared to the good news at same extent. In a different way, Glosten et al. (1993) and Zakoian (1994) separately develops TARCH or TGARCH model to capture the above phenomenon by adding an additional term in Equation (12) that permits asymmetric shocks towards volatility as under:

Negative shock (et–1<0) makes It–1 = 1 and positive shock (et−1>0) turns It–1 = 0
TARCH model assumes that unexpected change in equity prices is occurred due to change in et that influences conditional variance in different ways. Favourable news effects αi but the impact of unfavourable news falls on (αi + γk). The TARCH model also captures the leverage effect through the coefficient γ. Positive γ stands for presence of leverage effect. At the same time, asymmetric shock is measured by the non-zero value of γ otherwise treated as symmetric. The study also measures the shock persistence by applying the following:

Analysis and Interpretation
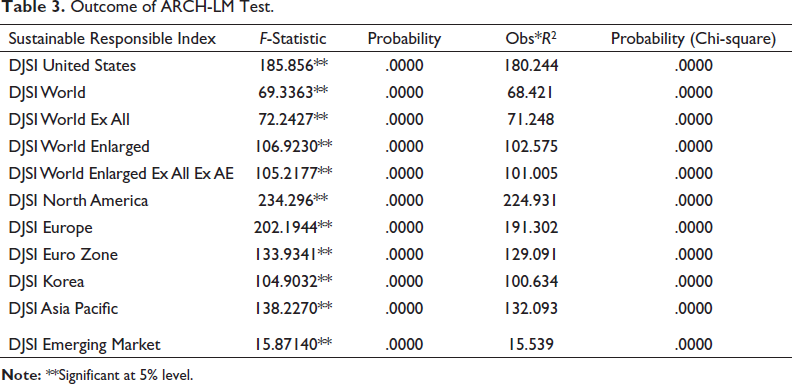
Table 3 reports the outcomes of ARCH effect. It is found that both F and LM statistics of the squared residuals of the DJSI Indices are statistically significant, which confirms about presence of ARCH effect (volatility clustering) in the time series return distribution and the outcomes are also cross-checked by Q-statistic that depicts identical outcomes, and thus, the study further allows to test GARCH model.
Outcome of ARCH-LM Test.
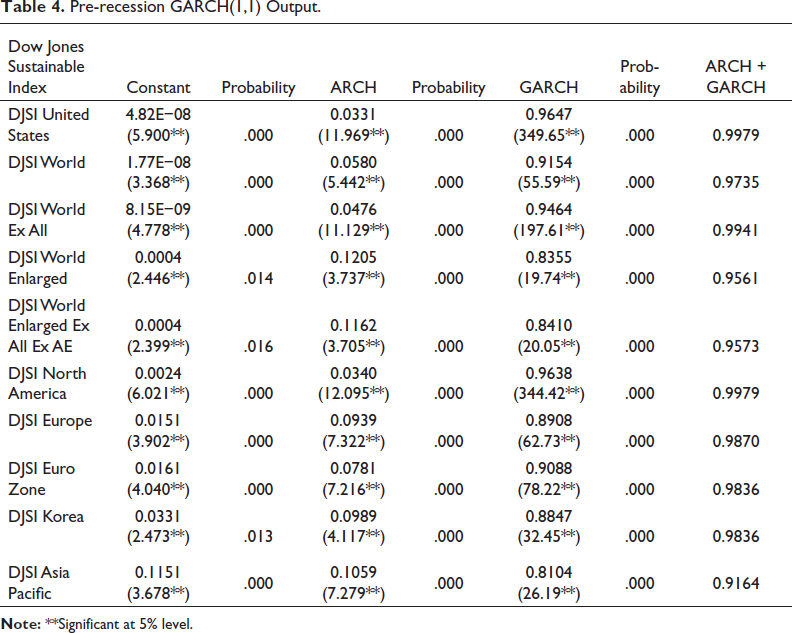
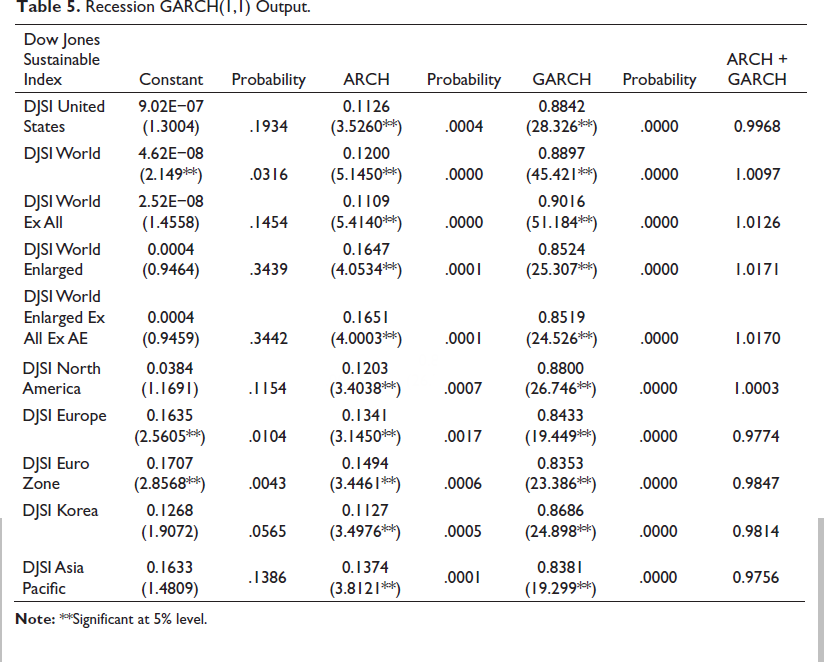
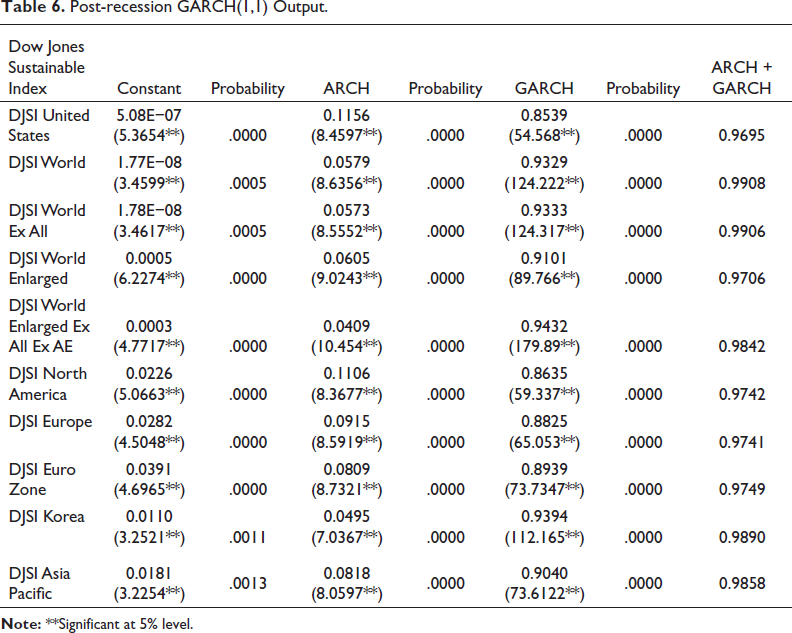
Variance and covariance stationarity are the preconditions of GARCH mechanism. The outcomes of GARCH are presented in Tables 4, 5, and 6, respectively, and it was found that the above condition is fulfilled in pre-, post-, and recession periods. Here, the shock persistence is measured through [∑(αi + βi ˂1)] and observed that four DJSI Indices do not follow this condition in recession period. It is also observed that large shock persistence generates higher volatility in the system, which exposes in the process for a long period of time. Here, the ARCH coefficients are statistically significant for all the sub-periods that signify historical squared residuals significantly influence the volatility of risk. Similarly, the GARCH coefficient is also statistically significant in three sub-periods that exhibits that historical returns’ volatility may influence the present returns.
Pre-recession GARCH(1,1) Output.
Recession GARCH(1,1) Output.
Post-recession GARCH(1,1) Output.
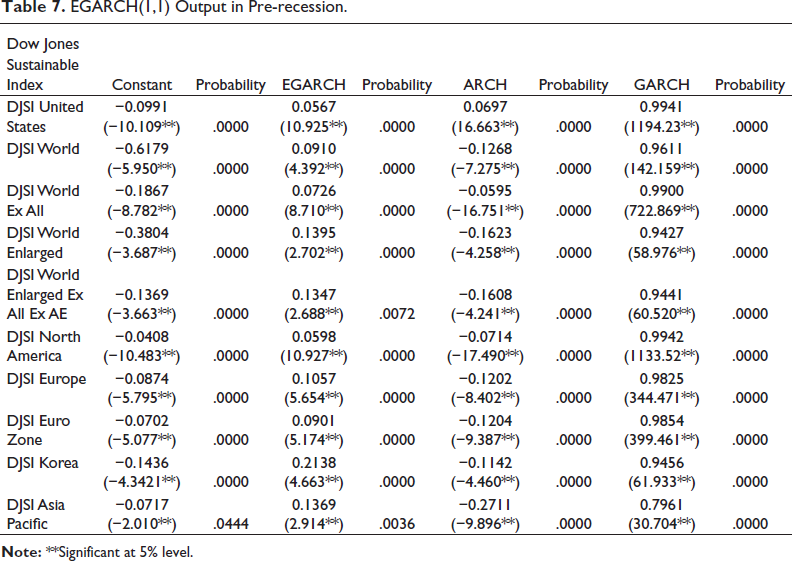
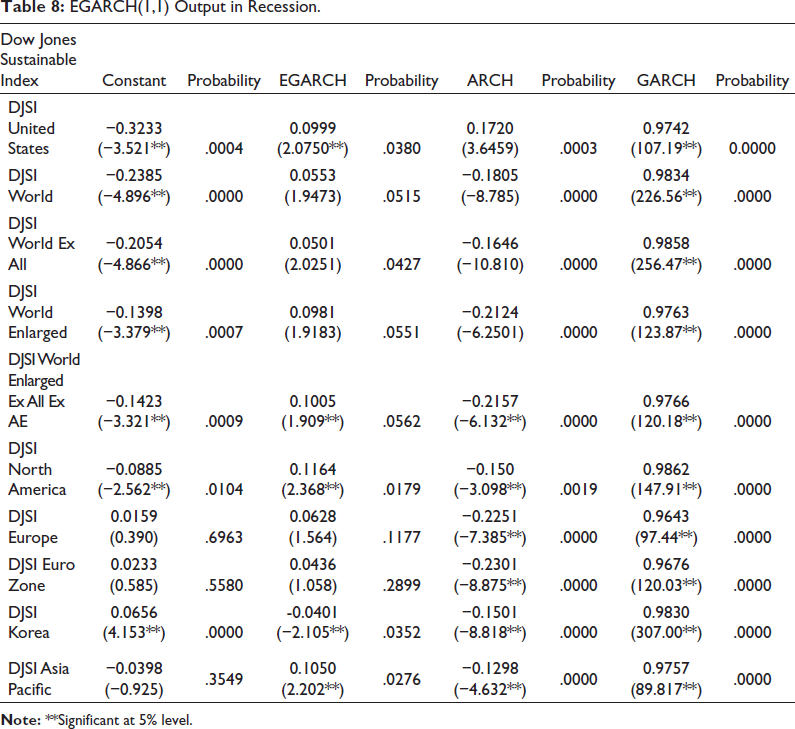
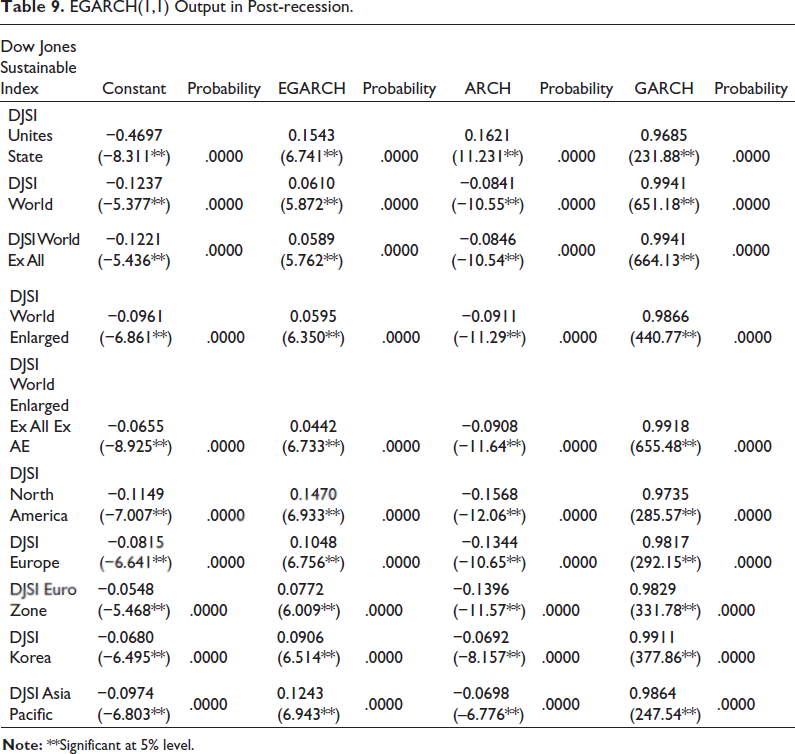
The results of EGARCH are presented in Tables 7, 8, and 9, respectively. It is observed that ARCH coefficients are statistically significant throughout the periods that mean presence of volatility clustering in the return series. Similarly, the GARCH coefficients of the DJSI Indices during all sub-periods are also statistically significant, which indicates that backward shock persistence affects current return. The EGARCH coefficients of three DJSI Indices during the recession period are insignificant but positive sign. However, DJSI Korea shows statistically significant negative sign (−0.0404) that reveals presence of leverage effect that further indicates that positive shock is more powerful than negative shock. Moreover, the EGARCH coefficients of the remaining indices during all the periods are positive and statistically significant, which means absence of leverage effect but further it says that unfavourable news creates larger volatility as compared to good news. Lastly, it may be said that return series of the DJSI Indices is affected by asymmetric shock of volatility, except DJSI Korea in recession.
EGARCH(1,1) Output in Pre-recession.
EGARCH(1,1) Output in Recession.
EGARCH(1,1) Output in Post-recession.
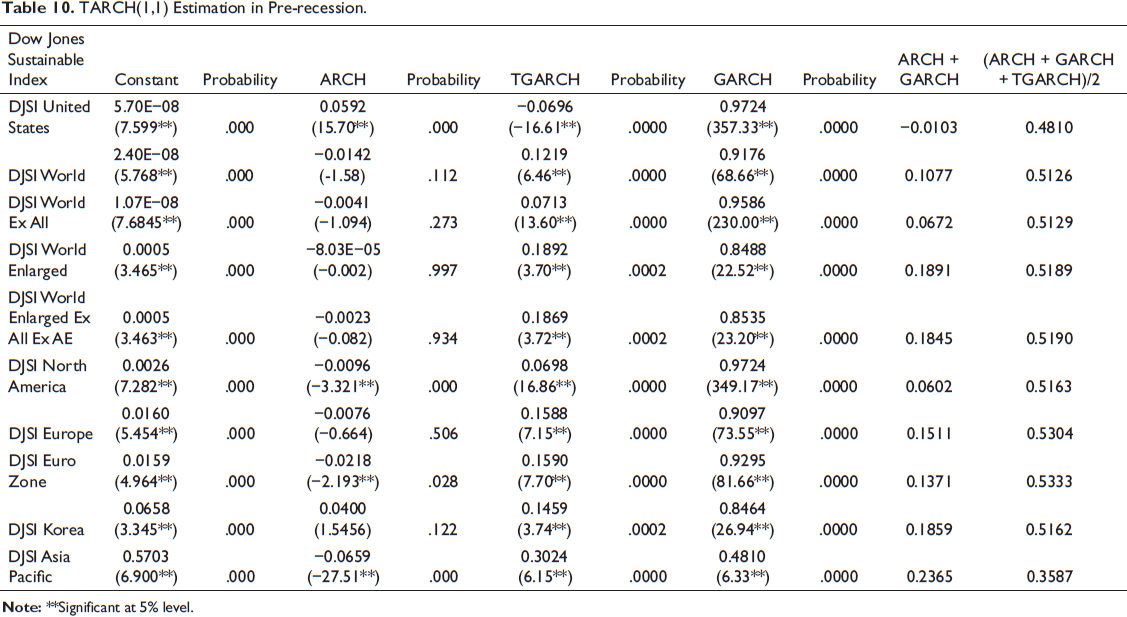
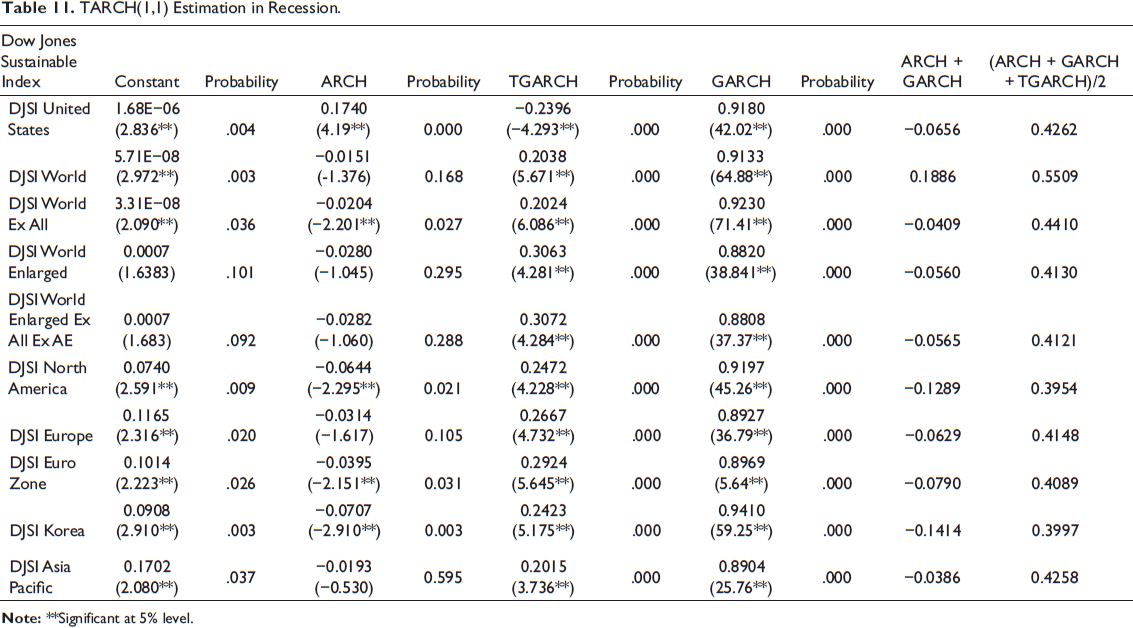
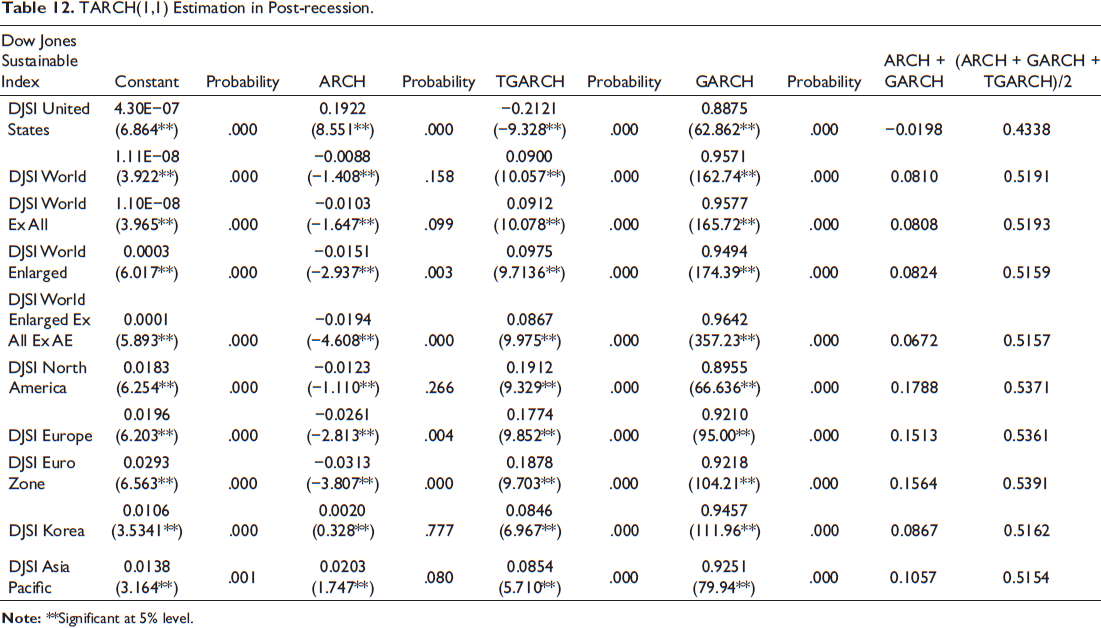
The outcomes of TARCH are presented in Tables 10, 11, and 12, respectively. It is observed that the GARCH coefficients of the DJSI Indices during the sub-periods are statistically significant, which means historical volatility influences current volatility of the indices’ returns in a significant way. The study reports that favourable news produces diverse impact on conditional volatility (column 4). On the other hand, negative information produces negative outcomes during recession period, except DJSI World (column 10). Moreover, unfavourable news produces positive outcomes during pre- and post-recession periods, except DJSI US. It may be said that positive news has largely affected conditional volatility during recessions as compared to other periods. Oppositely, bad news has strong influence in pre- and post-recession periods. It is also observed that asymmetric effect continues to exist in the returns of the DJSI Indices during all the periods, as the gamma coefficients estimated from Equation (13) are non-zero (column 6) but significant. The study also confirms about presence of leverage effect during all the periods except DJSI US.
TARCH(1,1) Estimation in Pre-recession.
TARCH(1,1) Estimation in Recession.
TARCH(1,1) Estimation in Post-recession.
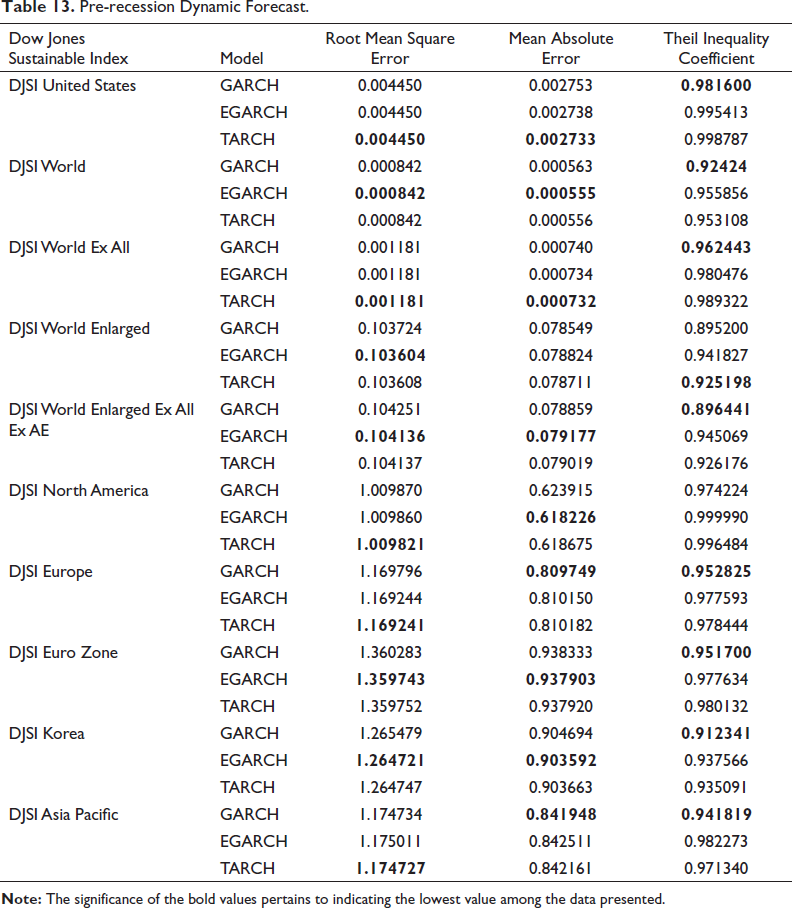
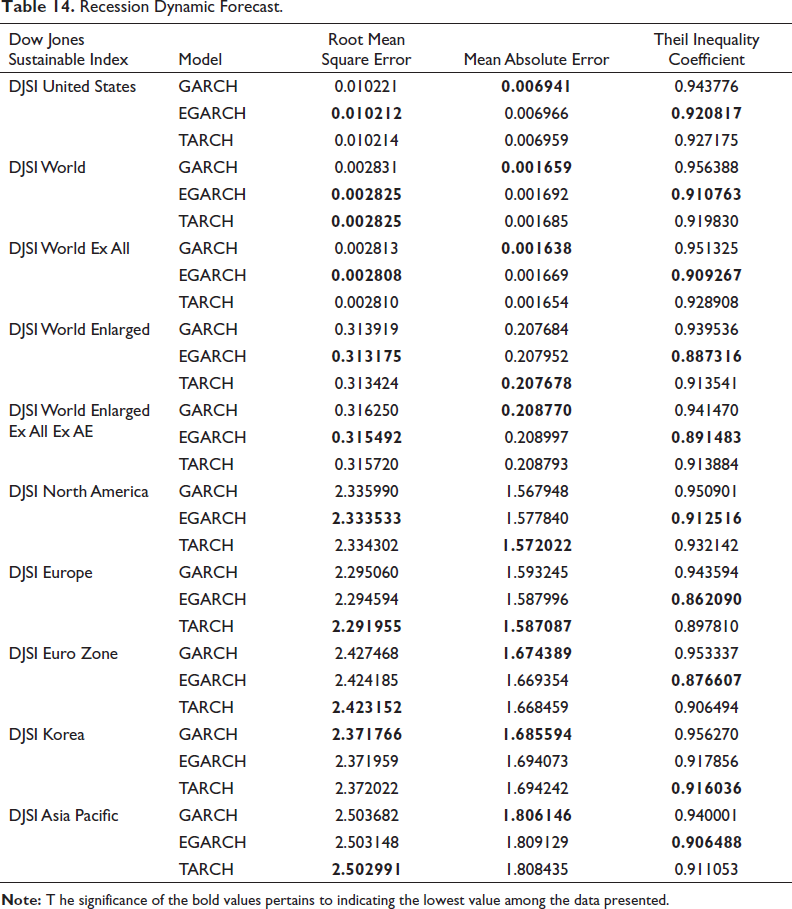
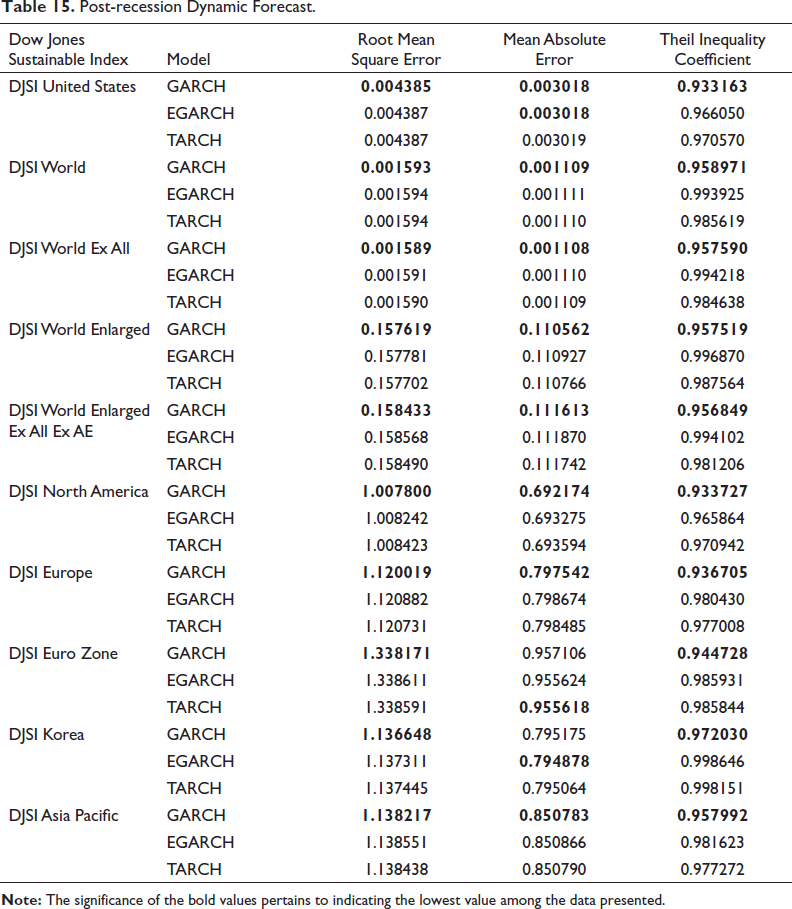
It is well documented that time series model’s appropriateness largely depends on its ability to predict the future state correctly. The study uses various measures like root mean square error, mean absolute error, and Theil Inequality Coefficient to check model appropriateness. The outcomes of various measures are presented in Tables 13, 14, and 15, respectively, and found that EGARCH and TARCH are the best-performing models to forecast volatility during pre-recession period, which is followed by recession period also. However, a slight change is found in the post-recession period where GARCH measure is appropriate.
Pre-recession Dynamic Forecast.
Recession Dynamic Forecast.
Post-recession Dynamic Forecast.
Conclusion and Recommendation
The time series return distribution of the Dow Jones Sustainable Indices (DJSI) shows volatility shock that opines that higher return is caused by higher volatility. EGARCH measures also show that past volatility may influence the current return. Here, DJSI Korea index shows leverage effect according to the EGARCH measure in recession period. Whereas, TARCH measure shows presence of asymmetric and persistent volatility shock. In the recession period, the DJSI Indices are largely affected by good news, but in other periods by bad news. Moreover, TARCH measure shows presence of leverage effect except DJSI United States. According to the model superiority, EGARCH and TARCH are appropriate in pre-recession and recession periods, whereas GARCH in post-recession. The study argues that dynamic forecast of conditional volatility based on various measures is increased but falls in 2012 and thereafter shows fairly stable behaviour. From the above, it may be concluded that volatility measures are the powerful techniques to forecast market volatility and its diverse effects, and it is also established that any particular measure is not sufficient to explain everything. Here, the outcome of this study is helpful to the investors and the market participants for investment decision-making. Moreover, these measures may be applied to other sustainable indices, and examining their diverse volatility characteristics may be the scope of further research.