
Abstract
The digitalization of the food supply chain (FSC) is reshaping food production, potentially increasing productivity and reducing food waste. However, it is still being determined whether implementing digital twin technologies in FSC can also prevent or reduce food loss and waste. This research work identified and analyzed the enablers of digital twins in implementing FSC. Very few studies have analyzed the role of digitalization in FSC, and no study was found in the open literature that has analyzed the enablers of the digital FSC to prevent food waste. This investigation employed a novel gray influence analysis (GINA) methodology for the analysis of causal relationships between factors. Using the GINA method, responses may be aggregated cumulatively without information loss. Consequently, the primary advantage of the GINA method is its capacity to execute a causal analysis model while accommodating a vast amount of data. The study has identified 17 enablers that can improve the sustainability of the FSC through the implementation of digital twin technology. After analysis, enablers visibility (ENB5) and collaboration (ENB16) received the first and second positions based on the total influence score. The digitalization of the FSC promotes better collaboration between stakeholders, enhances traceability and visibility, encourages high-quality products, and reduces food waste. This research study is helpful for the researchers, practitioners, and managers working in the field of digitalization of FSC.
Introduction
Digital twin technology (DTT) can play a crucial role in supply chain management (SCM) by increasing operational efficiency, decreasing costs, and enhancing decision-making processes (He & Bai, 2021; S. Singh et al., 2024b). A digital twin (DT) is a digital representation of a physical asset or a system, such as a manufacturing facility or a product (Ivanov & Dolgui, 2021; Kamble et al., 2022).
The utilization of a DT in SCM can enable the generation of a digital replica of the entire supply chain (SC), beginning with the procurement of raw materials, through to the delivery of completed goods to consumers (Hautala-Kankaanpää, 2022). In order to optimize the performance of their supply chains, businesses can benefit from creating a DT of their SC (Annosi et al., 2021a; Cimino et al., 2019; Jain et al., 2024; Yontar, 2023) in order to better comprehend how the various components of the SCs collaborate with one another. For instance, a digital equivalent might be used to model the impact of fluctuating product demand on a company’s SC (Rana & Daultani, 2022). By running simulations, a company can anticipate and prevent SC interruptions and capacity restrictions (He & Bai, 2021; Ivanov et al., 2019; Paul et al., 2023; Scholten & Schilder, 2015) by boosting production capacity or switching to different suppliers. He and Bai (2021) noted that DTT can be used to track and monitor the operation of specific pieces of manufacturing and delivery machinery in real time (Patidar et al., 2023). Overall, the use of DTT in SCM can aid businesses in reducing costs, enhancing efficiency, and improving decision-making processes (Anifa et al., 2024; Beata et al., 2023).
The incorporation of digital agricultural technologies into the agricultural sector provides farmers and food processors with the opportunity to leverage new and integrated technologies to enhance food production, boost food safety, minimize food wastage, and increase profitability (Annosi et al., 2021; Benyam et al., 2021; Pylianidis et al., 2021). There are also many claims that the digitalization of food supply chain (FSC) will have positive socioeconomic effects, particularly in terms of improving the employment opportunities available to farmers and those in professions connected to agriculture (Annosi et al., 2021). Recent technological advancements in FSC have been recognized as potential possibilities to improve resource use efficiency (Benyam et al., 2021; Burgos & Ivanov, 2021; Defraeye et al., 2021; Strotmann et al., 2022; Zscheischler et al., 2022). Technology advancements like digitalization give farms a chance to cut out the intermediaries and make direct connections with restaurants, retailers, and customers, reducing the likelihood of perishable goods being wasted after harvest (Burgos & Ivanov, 2021). The enhancement of the value chain gives farmers the ability to generate high-quality agricultural products. The use of digital SC practices assists in conserving energy and other resources by minimizing wastage at every stage of the supply-chain process (S. Kumar et al., 2021).
Technology like DT’s built-in tracking aids food manufacturers in isolating, verifying, and identifying potential contamination sources. By increasing visibility, DT has the potential to improve the food SC and contribute significantly to the cause of assuring the safety of the food supply. Having a complete history of where each product has been helps SC see the big picture, detect and prevent potential quality issues, and quickly identify and remove problematic items from the supply chain.
Along with providing a visual representation of SCs and the dangers they pose, DTs also provide an analysis of supplier performance and risk and the ability to predict disruptions in SC operations (Lotfi et al., 2021; Perno et al., 2022). They can also help you plan and analyze alternative paths, complete with arrival time estimates. During incidents, digital twins analyze key performance indicators to determine inventory, service level, financial parameters, and demand, as well as to compute the effect of the disruption (Lioutas et al., 2021; Zhao et al., 2019).
Increased transparency and trustworthiness of data on food product manufacturing, processing, and distribution can be achieved with the help of DT (Defraeye et al., 2021). Using blockchain technology, DT can make it easier to create a public and immutable record of all FSC transactions that cannot be tampered with. This can be useful for identifying where an item came from, how it was made, and whether there were any problems during production or distribution (Astill et al., 2019; Gupta et al., 2021). DT can also make it easier for IoT devices to be used to track and monitor food items as they make their way through the supply chain. Real-time information on environmental elements, such as temperature and humidity, that might affect the quality of culinary goods is now available, thanks to sensors and other monitoring systems (Zscheischler et al., 2022). Big data analytics tools can be used to process and analyze FSC data with the help of DT. Decisions about food safety, quality control, and logistics can benefit from this information.
DT can also facilitate the use of digital records to store and manage FSC information. This can aid in reducing the risk of fraud or error associated with paper-based records. Overall, DT can contribute to the improvement of the FSC’s traceability by enhancing the transparency, accuracy, and efficacy of data collection and analysis (Pandey et al., 2022). This can enhance food safety, reduce food waste, and increase consumer confidence in food products.
Much research has been conducted into food, specifically relating to questions concerning its quality, safety, cold chain facilities, logistics, food waste (C. Li et al., 2022; Gokarn & Choudhary, 2021), and risk mitigation. However, very few studies have analyzed the role of digitalization in FSC, and no study in the open literature appears to have analyzed the enablers of digital FSC to prevent food waste. This research study has used a novel methodology, a gray influence analysis, to identify the influence of one factor over the other. Food is one of the most widely used commodities globally, and thus, such a comprehensive approach is needed to understand its complex implications. Despite the widespread recognition of the necessity to decrease food waste in the FSC, many nations around the globe have yet to achieve success in employing digitalization in FSC. The effectiveness of digital FSC management has not been adequately emphasized by researchers in terms of understanding the role of various enablers.
The objective of this research is to recognize and analyze the enablers that influence the digital FSC and the food waste associated with it. In this regard, the aims of this research are:
RO1: What are the crucial enabling factors of the implementation of DTs in the FSC that prevent food waste? RO2: Which identified enablers have higher influence than others to facilitate food waste reduction?
The subsequent sections of this research study have been organized accordingly. The second section offers an analysis of extant literature pertaining to the FSC and its associated food waste as well as enablers for lowering food waste in the FSC. The third section analyzes the steps used in gray influence analysis, and the fourth section reports on the real case study application of the proposed model. The fifth section discusses results of the research model applied to the case study, and the fifth section offers managerial implications of the study. Finally, the seventh section summarizes contributions of the study, including the best practices for successful FSC management through digitalization, which is expected to result in a decrease in food waste. The last section also provides limitations and the basis for future research possibilities.
Literature Review
The literature review is divided into three sub-sections: extant literature related to DTs and its application in various areas, DTs and FSCs, and research framework.
Digital Twin and Its Application
The notion of DT was initially presented by Dr. Michael Grieves in a lecture in 2002 (Grieves & Vickers, 2016). Numerous definitions of DT have been suggested in academic literature, leading to a lack of consensus on the concept despite the growing body of research and publications on DT (Perno et al., 2022). Multiple definitions have been found in the literature, each differing significantly in terms of the technologies, features, and scope attributed to a DT. Overall, “DT can be defined as a virtual representation of physical assets that utilizes data and simulators to enable real-time prediction, optimization, monitoring, control, and better decision making” (Rasheed et al., 2020). In addition, DTT can be used to monitor and trace the performance of individual SC components in real time, including the performance of manufacturing equipment and the transportation of products (He & Bai, 2021; Zheng et al., 2019). Generally, the use of DTT in supply chain management can aid businesses in reducing costs, enhancing efficiency, and improving decision-making processes (Moshood et al., 2021). Table 1 provides a chronological summary of some extant literature related to DTs and its application in various areas of management.
Key Literature Related to DT and Its Application in Various Areas.
Digital Twins and Food Supply Chain
The use of enabling technologies of Industry 4.0, traceability of foods technology, and information and communication technology tools that can improve resource efficiency in food operations are a few examples of digital solutions in agriculture (Benyam et al., 2021). Aside from other applications, digital technologies have been used in food production to handle the efficient use of water and applications requiring variable or exact inputs (Pandey et al., 2022). Much research has been conducted into FSC and questions concerning its quality, safety, cold chain facilities, logistics, and risk mitigation. Yet a very few studies have analyzed the role of digitalization in FSC, and no study has analyzed the enablers of digital FSC to prevent food waste. Overall, DT can contribute to the improvement of the FSC’s traceability by enhancing the transparency, accuracy, and efficacy of data collection and analysis (Pandey et al., 2022). This can enhance food safety, reduce food waste, and increase consumer confidence in food products. Some important studies related to FSC and the role of digitalization in managing the efficiency and productivity of FSC are discussed in Table 2.
Some Extant Literature Related to DTs and Food Supply Chain.
Some important key enabling factors of the implementation of digital twins in the FSC that prevent food waste are shown in Table 3.
Enablers of DT in FSC.
Methodology
GINA is a novel and distinct method of analyzing influence that we employ in our research. This methodology is applicable to a variety of studies that rely on surveys or significant numbers of expert responses. GINA is based on gray theory (Julong, 1989) and input–output models (Li & Liu, 2008), which seek to recognize and quantify how various factors or characteristics are interconnected. In the field of SC management, researchers frequently employ causal modeling techniques such as ISM and DEMATEL to assess the correlations between multiple characteristics and influencing factors (Dash et al., 2022). However, these approaches usually rely on a limited group of experts who measure alternatives on a crisp value or a gray/fuzzy scale (Golinska et al., 2015; Rajesh, 2023). This earlier method reduces the overall data collected and increases the amount of information lost during the compilation process, limiting the study’s potential impact. This study uses the GINA methodology, which has the potential to overcome limitations in standard causal modeling approaches such as ISM and DEMATEL (Chouhan et al., 2025). Data loss during answer consolidation can be kept to a minimum with the help of the GINA technique. Furthermore, this method is recommended to include many answers in any influence analysis/causal modeling situation to improve the accuracy of the results. The direct influence coefficient, the complete influence coefficient, the gray responsibility and influence coefficient, and total influence coefficient (TIC) are the four impact measures used in the GINA method S. Singh et al., 2024a). The TIC assigns a numerical value to how important a given part of the system is, considering its dependence on and control over other factors. By comparing TIC values, managers and practitioners can measure an enabler’s significance in the system.
Next, we will go over the steps required by the GINA methodology, which can be used to examine the enablers of DT in FSC to prevent food waste. The GINA methodology, introduced by Rajesh (2023) for the goal of influence research, consists of 11 stages. Detailed explanations of each stage are as follows:
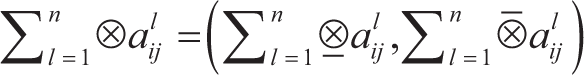
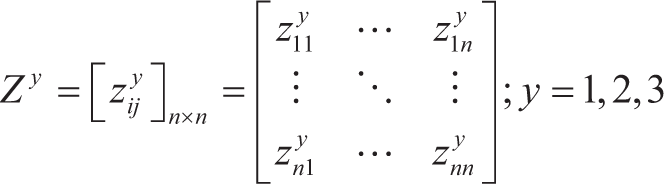
Step 1: Enabler identification for the research study: GINA’s first step is to find system-influencing enablers. Delphi, literature study, and expert opinions can identify enablers. Step 2: Evaluating the influence relationship among enablers: This involves identifying the relationships between different factors by collecting expert opinions or conducting surveys. The strength of each factor’s direct influence on others is measured using a 5-point Likert scale with linguistic terms ranging from very high to very low. Step 3: Cleaning and sorting of the responses: It is important to clean and sort the survey data to ensure the accuracy and reliability of the GINA model’s output. This can be done manually or using tools by carefully examining each response and removing any unreliable or biased ones to minimize errors that may accumulate. Step 4: Converting the linguistic values into gray numbers: To convert the linguistic labels in the survey results into a numerical gray score for analysis, a conversion table can be utilized. The survey’s analysis of influence relations can be represented by the influence matrix, denoted as ⊗αij, where i and j refer to the enablers being analyzed. The lower and upper bounds of the influence matrix can be expressed as

Now, the influence matrix will be written as follows:
where i, j = 1,2,3, …, n indicates the influence of the ith factor over the jth factor, taken in gray values.
Step 5: Aggregating the influence in gray scores: The survey results are aggregated in gray scales to ensure that all valid responses are included in the GINA analysis and to minimize data loss. This is achieved by applying the gray addition operator (Julong, 1989) to the influence responses in gray numbers. Assuming that there are n valid replies from the survey, the aggregated influence relation matrix can be produced and expressed as follows:
where l is an index varying from 1,2,3, …, n.
Step 6: Whitenizing of gray values into crisp scores: In this step,
the aggregated grey influence values are whitened using three different models. The critical model considers the lower limit of the aggregate influences as a crisp score for whitening. In the ideal model, the upper limit values of the aggregate influences are used to convert the grey values into crisp scores. (Rajesh, 2023)
The typical model, which is the third model, calculates the whitenized crisp values by taking the average of the upper and lower limit values.
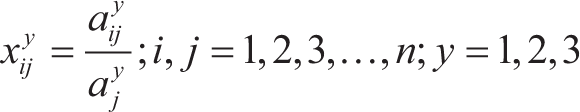
Step 7: Evaluate the direct influence coefficient: In this step,
the coefficient of direct influence will be calculated. Based on the critical model, the ideal model, and the typical model, the study found three distinct values (y = 1, 2, and 3) for the direct influence coefficient. The evaluation of the direct influence coefficient is used to describe these crisp numbers. (Rajesh, 2023)
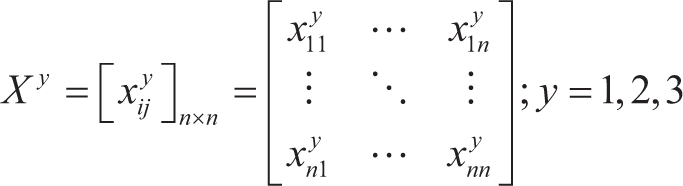
The matrices denoting values of are denoted as follows:
Step 8: Determining the complete influence matrix: The complete influence coefficient matrix can be determined by using the following equation:
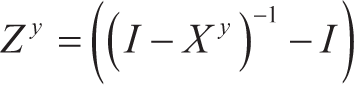
Here, I means the identity matrix of the same order as that of Zy, and it can be written as follows:
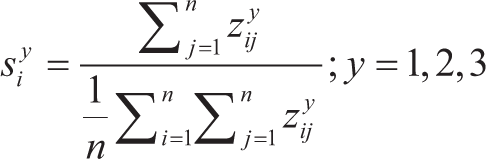
Step 9: Evaluating the gray responsibility coefficient and influence coefficients: These values are evaluated by utilizing the following equation:
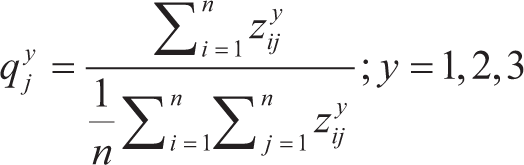
Step 10: Evaluating the gray importance coefficient: It is obtained by utilizing the following equation:
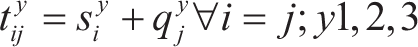
Step 11: Identification of most influential factors and analyses: By analyzing the 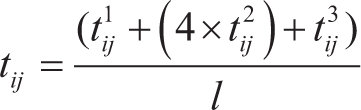
where l is typically an arbitrary number between 1 and 6. The value of tij can then be used to identify the most influential factor, which adheres to the Pareto principle, indicating that the top 20% of factors can be considered the most influential out of a collection of selected factors found during the research.
Case Study Application of the Proposed Model
To examine the relationships between significant enablers of digitalized FSC, we conducted a survey-based study, using input from academic professionals, businesspersons, and faculty members. Based on a review of existing literature and expert opinions, we identified 17 factors and used a Likert scale to rate the level of influence for each factor, with 1 representing very low influence and 5 indicating high influence. Only individuals with a PhD in management or related field and knowledge of food industry were eligible to participate. As a result, a small sample of eligible responses was chosen at random, with 27 out of 36 responses deemed useful for the analysis. Compared to other causal modeling techniques such as ISM/DEMATEL, which typically use 4–6 responses and average the results for analysis, the GINA technique allows for the use of more responses. This approach helps to avoid data loss during the averaging process and ensures that all responses are considered during aggregate operations. A detailed step-by-step procedure for implementing the research methodology is discussed below.
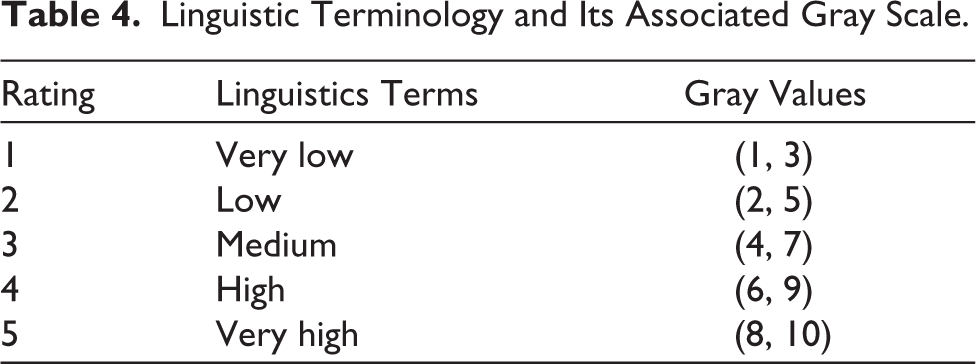
Using Steps 1–6, the initial data were sorted and purified. Next, the responses were converted into gray scales using Table 4 and then compiled using Equations (2) and (3). Table A1 was then used to compute the critical, ideal, and most typical whitenized values of the aggregated responses in gray scales, which were employed for further analysis. The most typical values of the aggregated data for the impact of factors may be utilized to demonstrate the relative degree of influence that each factor has when compared to the other factors.
Linguistic Terminology and Its Associated Gray Scale.aw
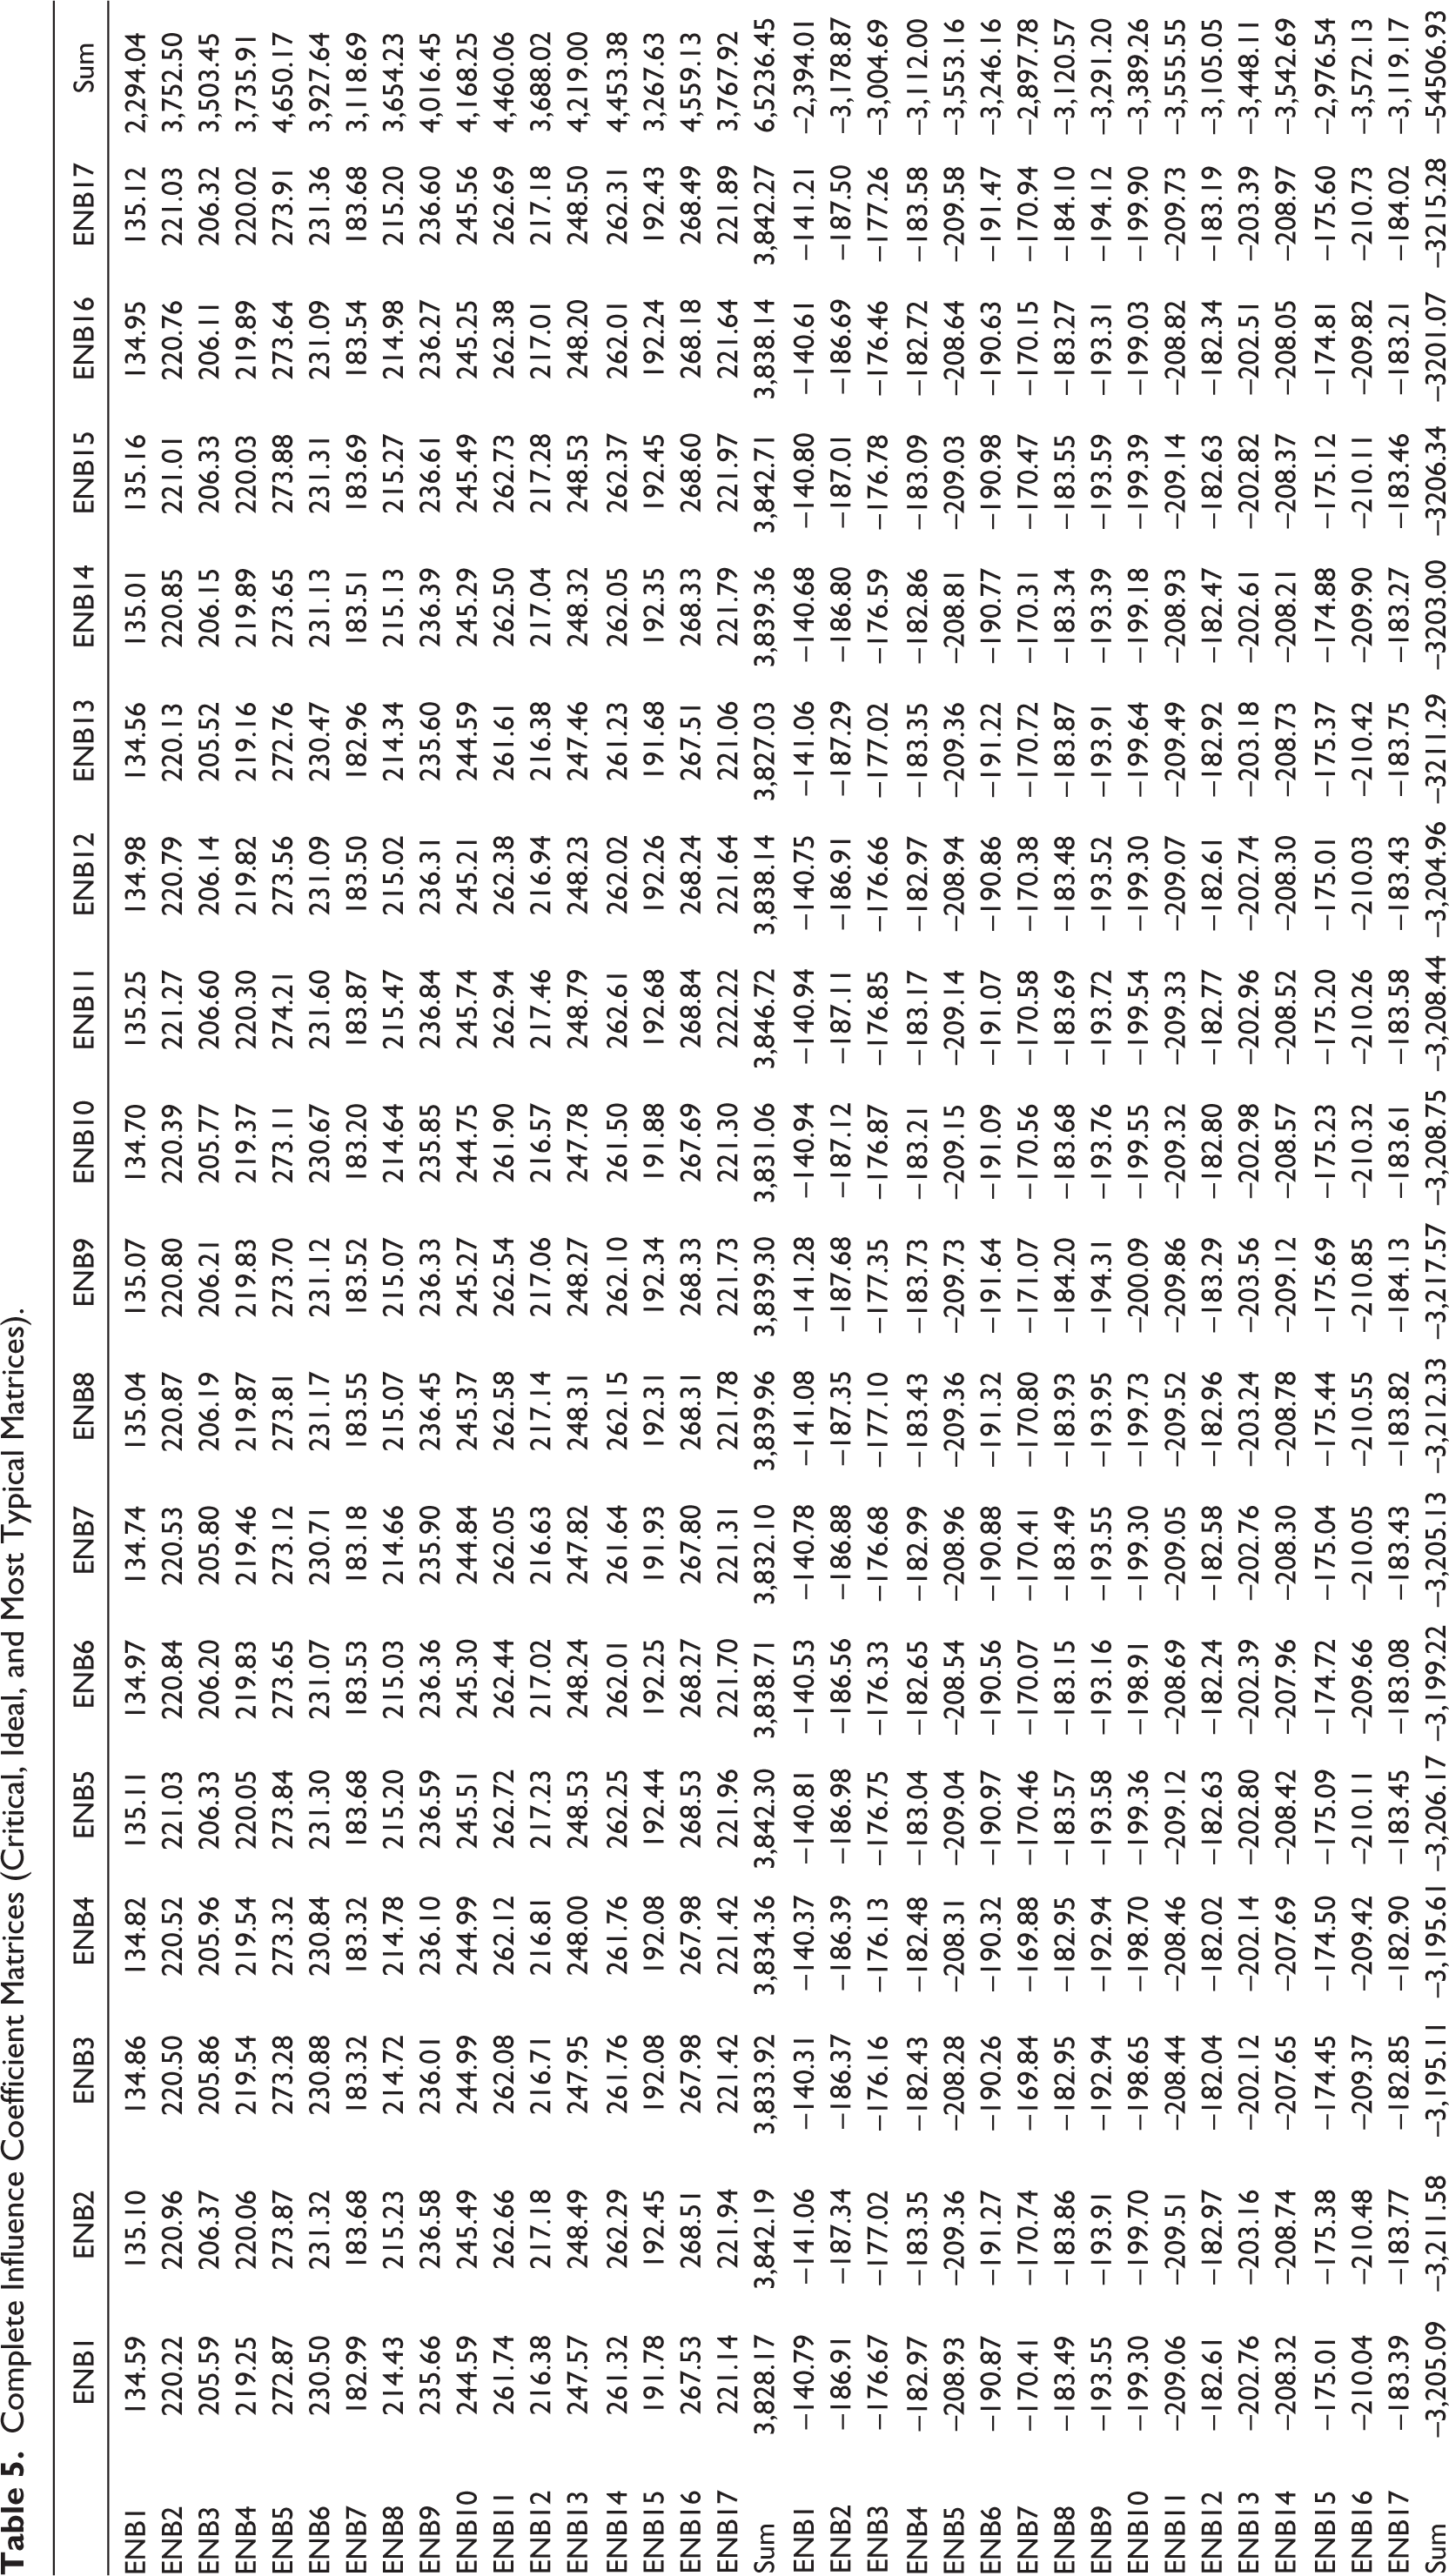
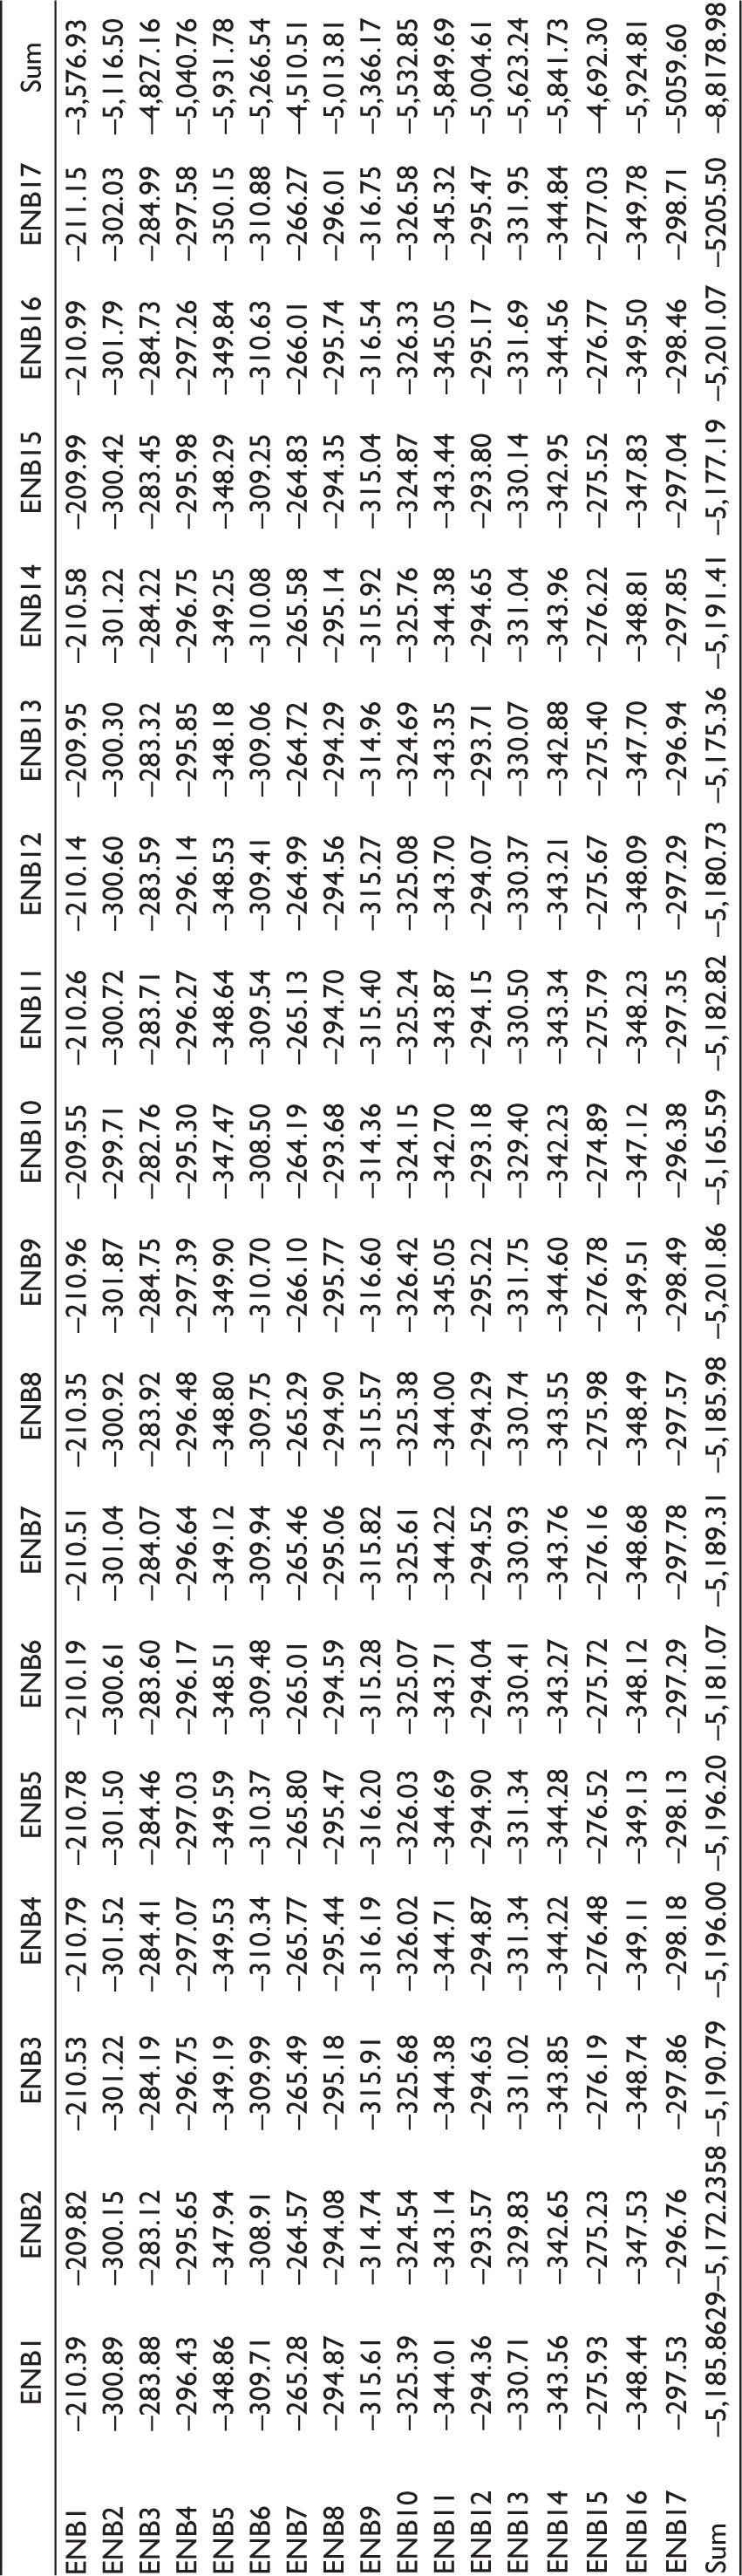
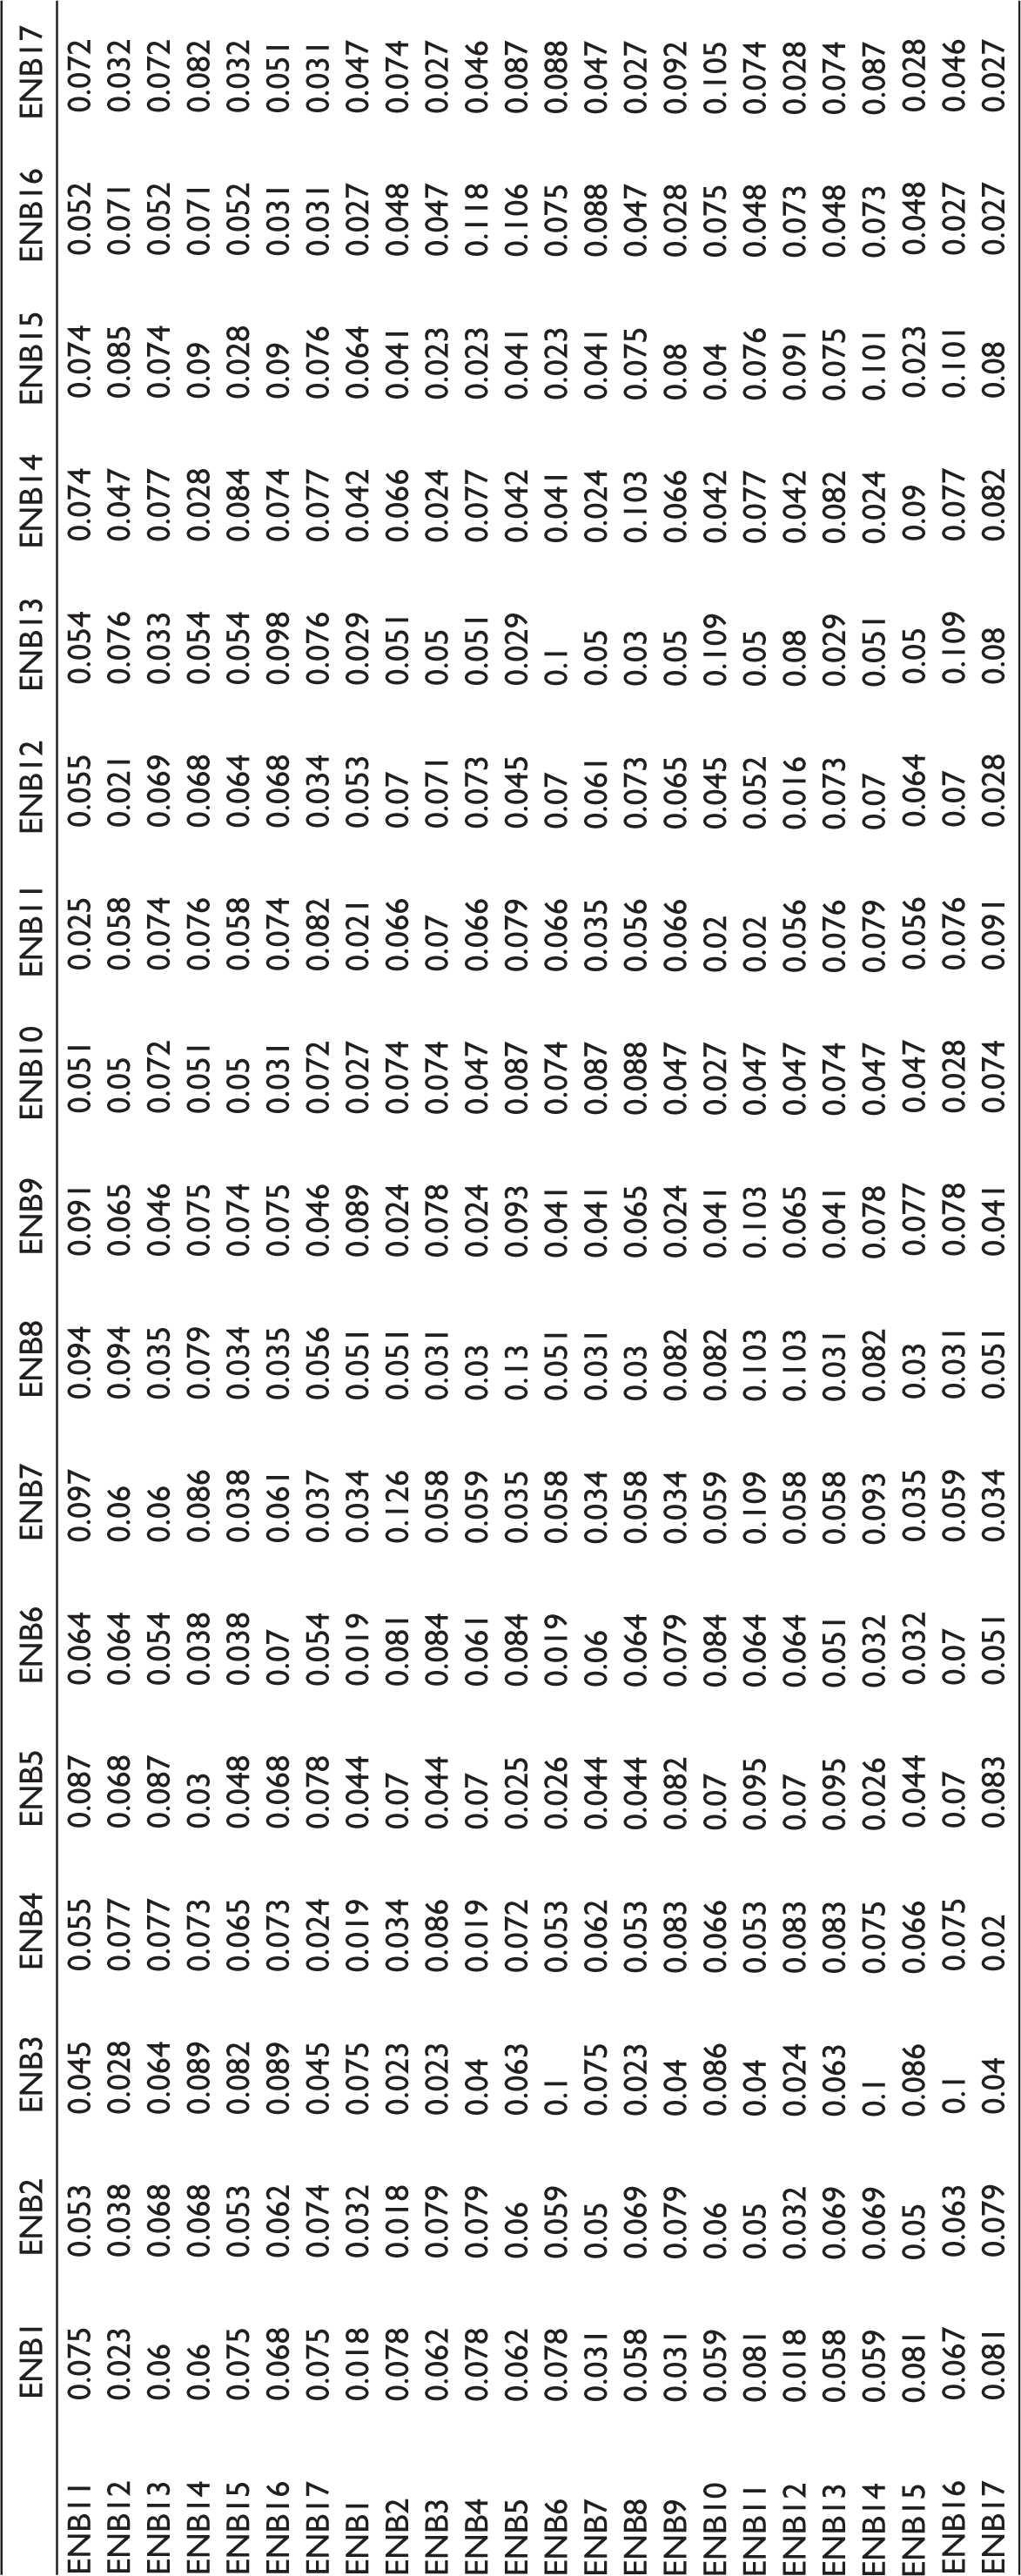
In Steps 7 and 8, we derived the direct coefficient matrices for the critical, ideal, and most typical whitenized models using Equations (4) and (5), which can be found in Table A2. Next, we created the complete influence coefficient matrices using Equations (6) and (7), which are displayed in Table 5.
Complete Influence Coefficient Matrices (Critical, Ideal, and Most Typical Matrices).
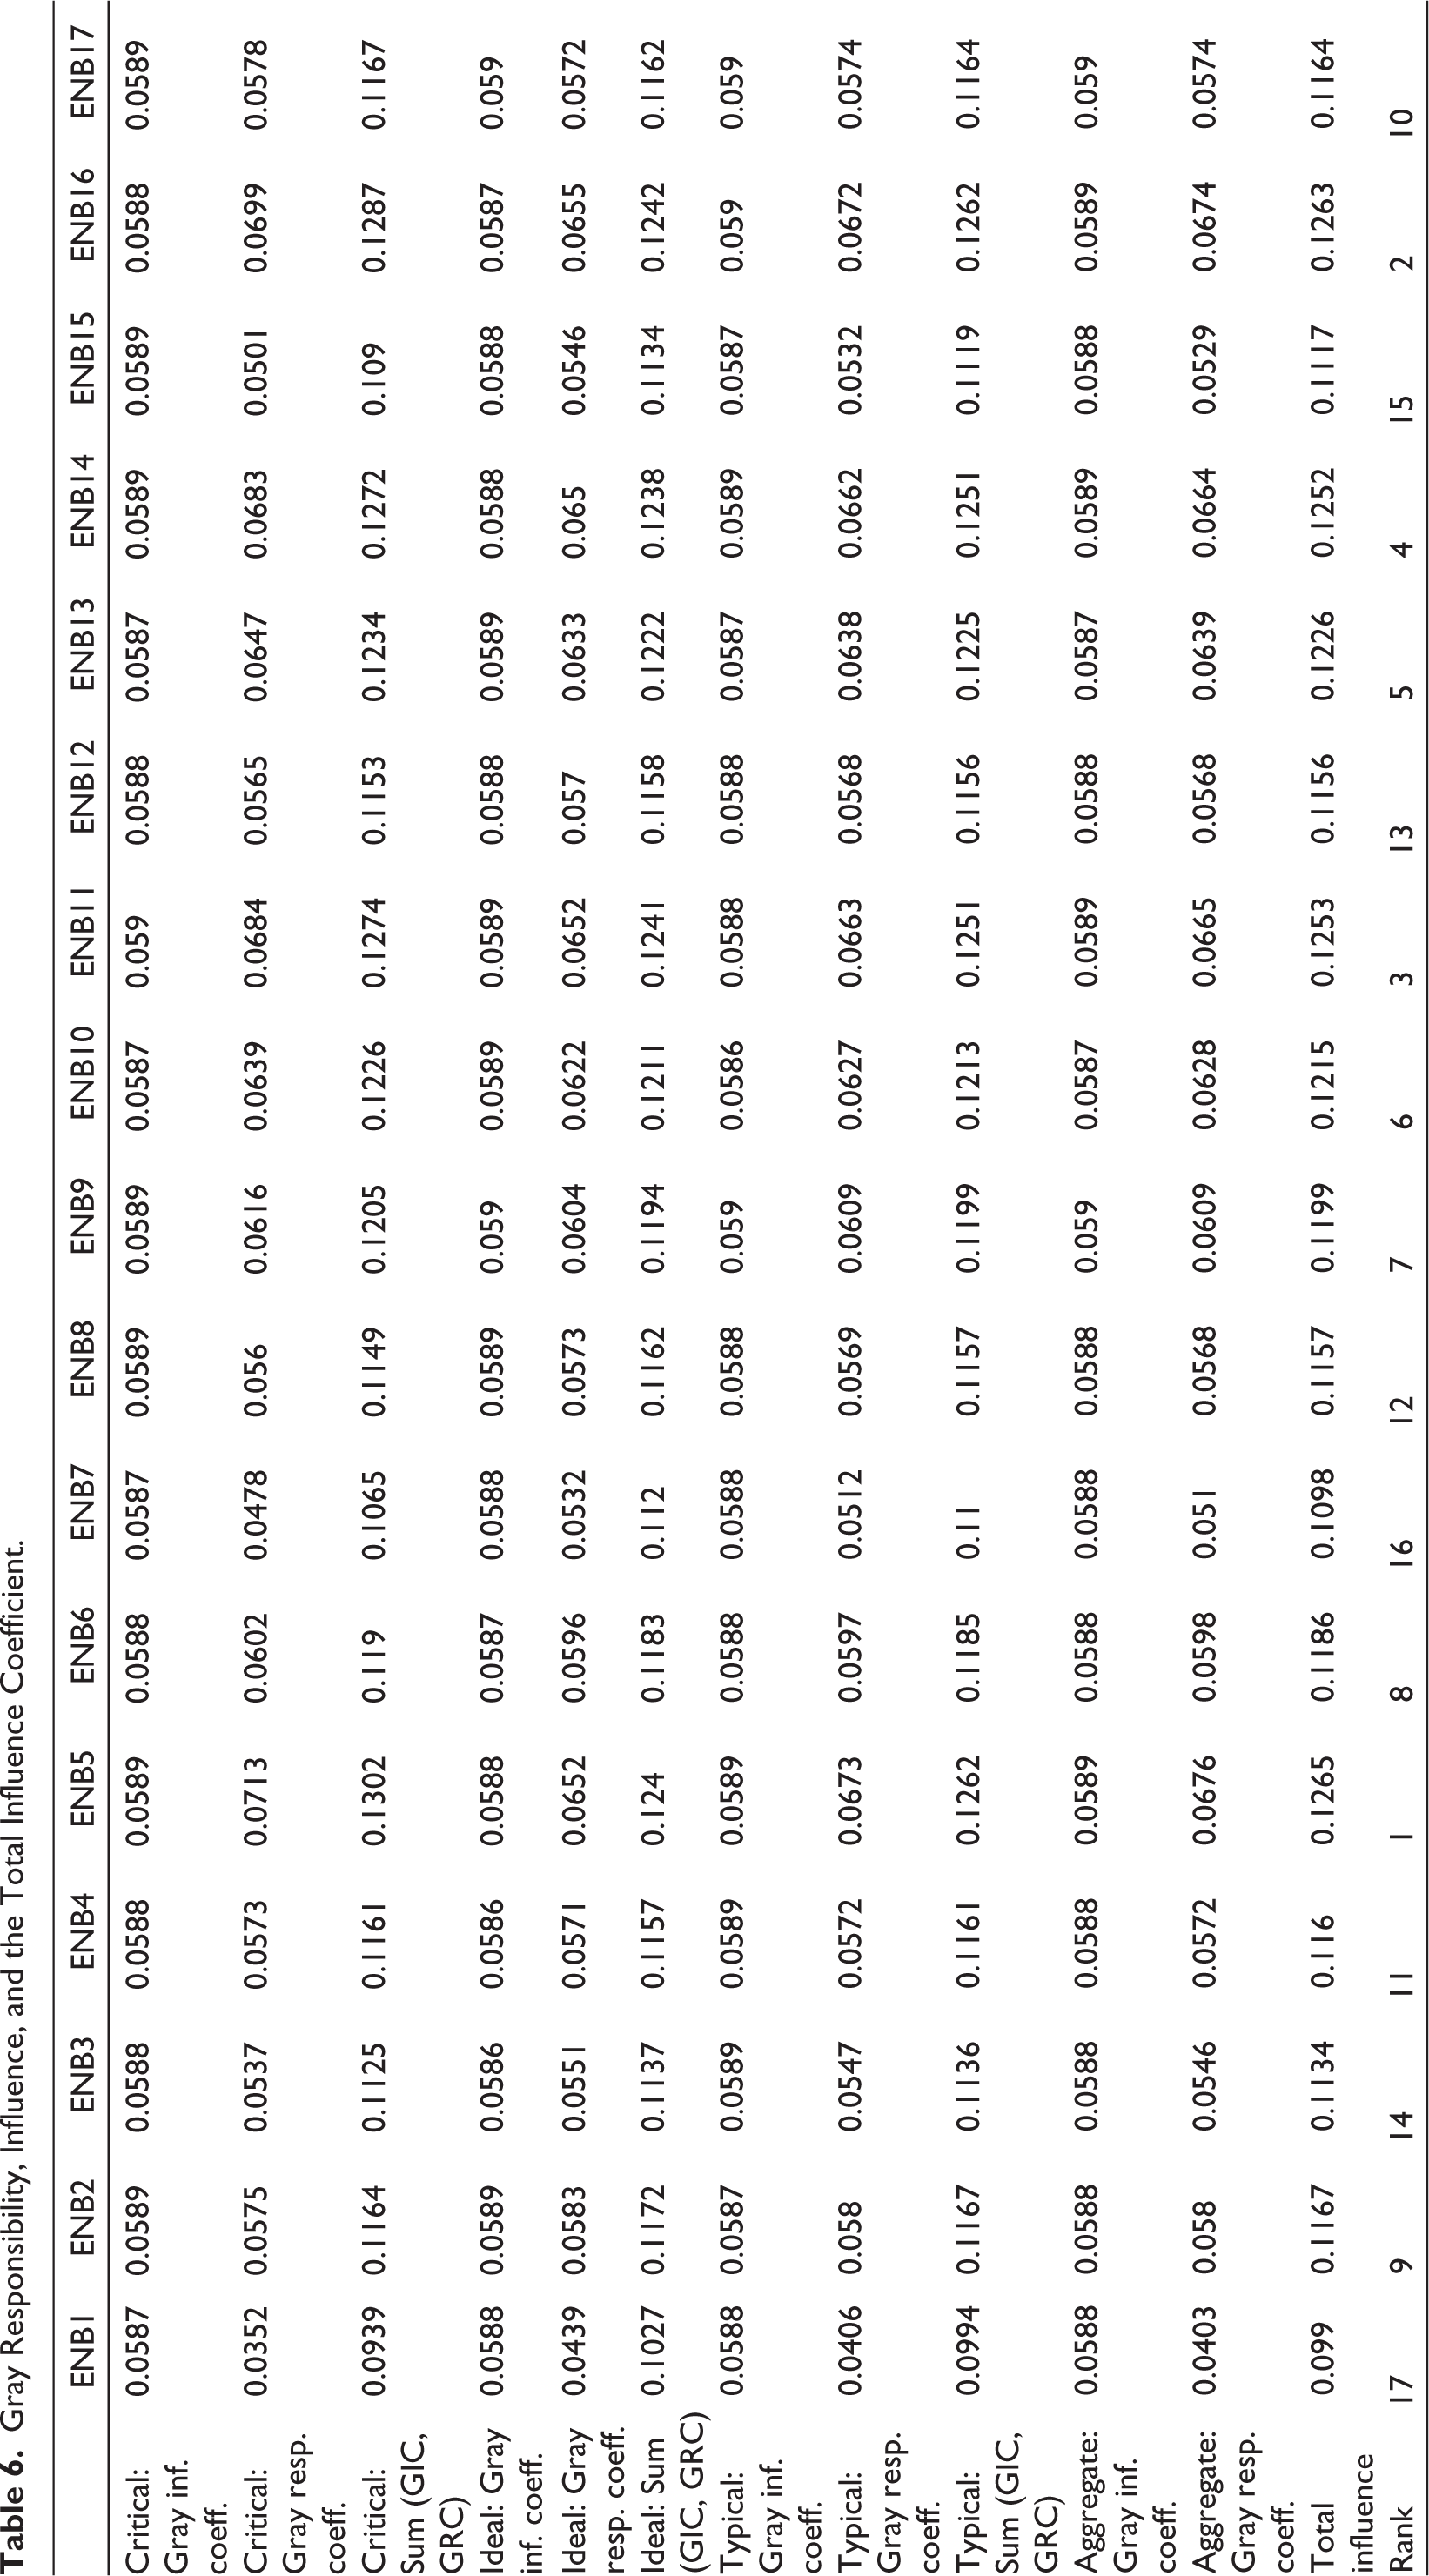
Steps 9–11 involve obtaining the overall (total) influence coefficients using Equations (8)–(11), as shown in Table 6, based on the GINA analysis. The resulting values are used to determine the most influencing enablers in the implementation of DT in the FSC. By applying the Pareto principle to the top 20% of the factors, the five most significant factors were identified as visibility (ENB5), collaboration (ENB16), flexibility (ENB 11), traceability (ENB14), and risk assessment (ENB13). These five factors have a greater influence compared to other factors. All these factors enhance the resilience of the SC and hence increase the sustainability of the FSC by reducing food waste. The ranking of these factors in terms of total influence is as follows: visibility (Rank 1), collaboration (Rank 2), flexibility (Rank 3), traceability (Rank 4), and risk assessment (Rank 5). A detailed analysis of all the factors is presented in the next section.
Gray Responsibility, Influence, and the Total Influence Coefficient.
Results and Discussions
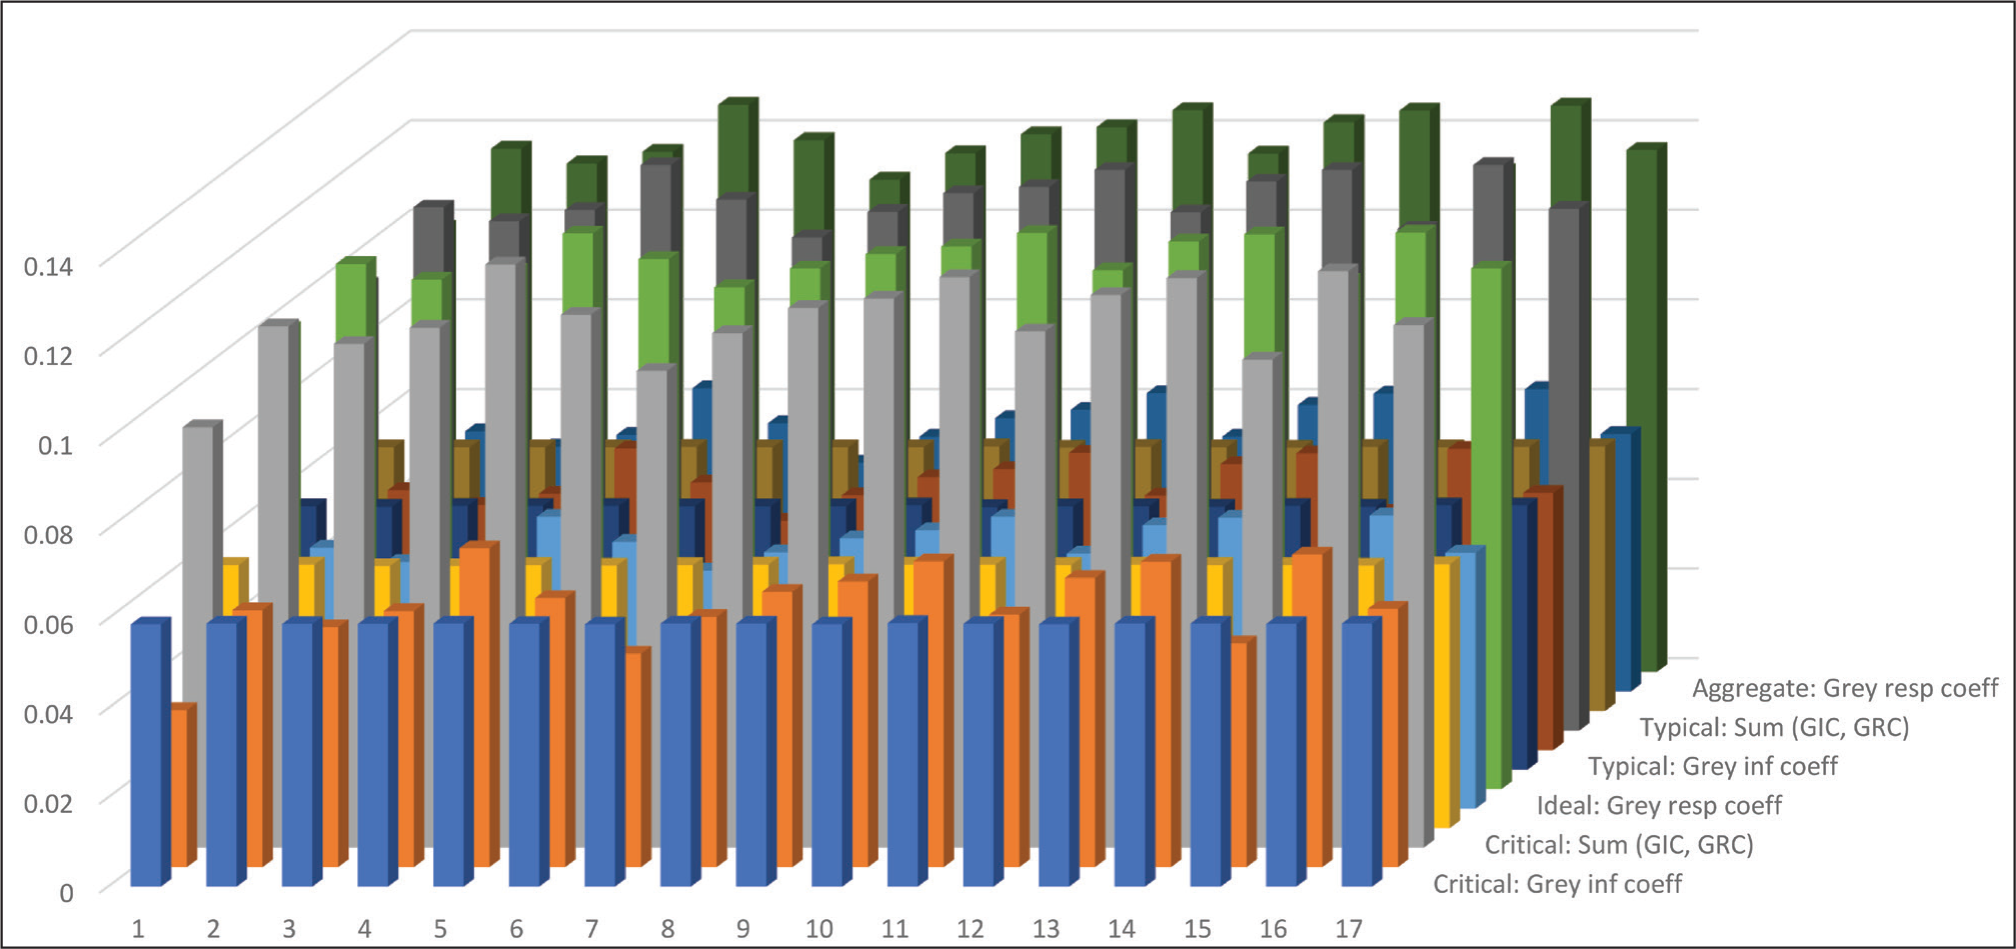
This research work has identified and analyzed the enablers in the implementation of DTs in the FSC. Seventeen enablers were identified in the application of DT in FSC through literature review, which fulfils RO1. In order to determine which enabler has more influence than the others, this research used a novel approach called GINA, which accomplishes second research objective (RO2). Table 6 provides information on gray influence coefficients (GIC), gray responsibility coefficients (GRC), and overall (total) influence scores of the 17 enablers of digitally operated FSC that were considered in the study. The rank of all the enablers is also given in Table 6. Figure 1 visually displays GIC, GRC and the sum of GIC and GRC of critical, ideal, and typical models and compares them with aggregate GIC, aggregate GRC, and total influence.
Total Influence and Responsibility coefficient of Ideal, Critical, and Typical Model.
The variation pattern of the three models is slightly different than the aggregate variation pattern. Visibility (ENB5) and collaboration (ENB16) received the first and second positions, respectively, based on the total influence score. The key enabling factors driving the adoption of DTT in the FSC are highlighted in recent research. The implementation of DT in the FSC can enhance the sustainability of the system by improving visibility and tracking processes throughout the product life cycle (Qader et al., 2022). The use of DTT can significantly benefit a company’s SC visibility and capacity to remain sustainable and competitive in the market.
Additionally, incorporating cyber-physical systems in the food industry can lead to efficient collaborations and operation of jobs, resulting in food waste reduction and greater flexibility in natural resource availability and environmental costs. To build a coordinated SC through information exchange and collective decision-making, businesses can leverage DTs (L. Li et al., 2022). The digitalization of the FSC promotes better coordination between stakeholders, enhances traceability and visibility, encourages high-quality products, and reduces food waste.
Similarly, Flexibility (ENB 11), Traceability (ENB14) and Risk assessment (ENB13) received third, fourth, and fifth positions, respectively, based on total influence score. The FSC can react quickly to changes in supply and demand because of digital technologies. Digital tools can help the SC adapt to changes in the environment by making working processes more efficient and flexible (G. Singh et al., 2023). Additionally, DT can have a significant impact on the traceability of the FSC by improving the visibility and accuracy of information related to the production, processing, and distribution of food products (Mubarik et al., 2021). Also, the digital food delivery chain might be able to handle risks well. Overproducing food or ingredients in the food business to cover for unclear demands further down the line can increase the risk of food waste.
Real-time monitoring (ENB10) and information sharing (ENB9) got ranked sixth and seventh, respectively. The use of DTT can have a big effect on how information is shared and monitored in real time along the FSC. By making a digital copy of real-world assets and processes, DTs can give real-time data and insights about how equipment and inventory are working (Cimino et al., 2019). This can make it easier to find problems early and act on them quickly, which makes SC processes more efficient and effective. In addition, DTs can facilitate communication along the FSC, facilitating teamwork and decision-making. Overall, DTT can strengthen the transparency, resilience, and sustainability of the FSC. Both cold chain performance (ENB6) and quality performance (ENB2) came in at eighth and ninth positions, respectively. There can be significant effects on cold chain infrastructure and product quality from the implementation of digital technologies. The temperature and humidity conditions in the cold SC may be carefully monitored and managed in real time, thanks to the use of digital sensors and monitoring systems. Thus, the quality of food goods is maintained and not diminished while they travel through the SC. The efficiency and effectiveness of cold chain facilities can also be improved with the use of digital technologies. Predictive maintenance using digital tools, for instance, can lessen the likelihood of equipment failures and outages in cold storage facilities. Also, digital systems can help with automating inventory management, which helps cut down on mistakes and makes sure perishable goods are used up before they go bad.
Digital technologies can help the FSC become more sustainable by increasing the efficiency and quality of cold chain facilities, which in turn helps reduce food waste and increases food safety. By increasing end-to-end visibility, encouraging SC collaborations, facilitating efficient inventory strategies, enabling capacity planning, bolstering cold chain and logistics capabilities, and enhancing traceability, the use of DTT in the FSC can increase resilience (Kabadurmus et al., 2022). The early detection of food shortages, along with enhanced planning, decision-making, and risk management made possible by digital supply networks, will increase food security around the world.
Managerial Implications
Several managerial insights that can aid in the reduction of food spoilage can be gained through the implementation of DTT in the FSC. DTT can provide SC administrators with real-time visibility. This enables them to keep tabs on their goods all the way through manufacturing and delivery. This can help pinpoint any problems or inefficiencies that are leading to wasted food. Managers can use DTT’s historical data analysis and pattern recognition with predictive analytics capabilities. They can then take preventative actions against food waste by anticipating demand and SC problems.
Using DTT, managers may determine the most effective transit routes and the best time to harvest commodities, thereby optimizing SCs. This has the potential to increase earnings while decreasing food waste. Managers can lessen their activities’ negative effect on the environment with the use of DTT. They can, for instance, reduce emissions and improve their sustainability by keeping tabs on the carbon impact of their SCs. In order to improve sustainability and cut down on food waste, managers can use data from DTs to guide their decisions.
There are a variety of ways in which DTT can aid in the fight against food waste along the FSC. The entire food distribution network may be tracked in real time with the use of DTT. This allows farmers, manufacturers, and retailers to monitor their products all the way through the distribution chain. This will aid in locating any bottlenecks or defects that could result in wasted food.
Companies in the food industry can prevent food waste from occurring in the first place by using DTT to foresee shifts in demand and the SC. Food producers, for instance, can adjust production levels or look for new markets if a DT predicts that there will soon be an oversupply of a certain food item. The use of DTT has helped the food industry determine the most efficient routes to move equipment and when to harvest crops. As a result, less food will be wasted, and more money will go to the farmers.
The FSC can also benefit from DT’s ability to improve traceability. This will aid food manufacturers in tracing the origin of any contamination or spoilage, allowing them to promptly address the issue and prevent further food waste.
Digital technologies can help the FSC become more sustainable by increasing the efficiency and quality of cold chain facilities, which in turn helps reduce food waste and increases food safety. Overall, DTT can help cut down on food waste by making it easier to see what is going on, making processes run more smoothly, and getting rid of flaws in the FSC.
Conclusion
This study has developed a decision-making framework for managing FSC systems. A case study is presented to illustrate how enablers can play an important role in reducing the food waste in digitally operated FSCs. Digital FSC (DFSC) can reduce food waste and enhance the resilience of the SC. The study has identified 17 enablers that can improve the sustainability of the FSC through the implementation of DTT.
In order to determine what causes what, this study used the cutting-edge GINA approach. It was simple for researchers to determine which variables had the most impact on a selected research issue. The GINA technique allows for progressive aggregation of replies with no loss of information. The ability to run a causal analysis model while storing massive amounts of data is the primary benefit of the GINA approach. According to the results, the two enablers with the highest combined influence are visibility (ENB5) and collaboration (ENB16).
Risks in the SC, such as product recalls, food fraud, and SC interruptions, can be identified and mitigated with the help of DTT. Managers can use these data to make educated decisions and take precautions to lessen the blow of these threats.
The study has some limitations that need to be addressed. First, the sample size of 27 responses may not be enough to provide reliable results, and future research could consider a larger sample size. Second, more research is required to explore the application of DTT in the FSC. This research offers an in-depth analysis of how digital solutions have been implemented throughout the FSC to lessen food waste. The use of DTTs in the management of real-world SCs, such as those for food products or fresh produce (fruits and veggies), could be studied in the future. It is possible that future studies could center on creating software to help put the methodology into practice and reduce the amount of computational work required.
Footnotes
Declaration of Conflicting Interests
The authors declared no potential conflicts of interest with respect to the research, authorship, and/or publication of this article.
Funding
The authors received no financial support for the research, authorship, and/or publication of this article.
Appendix A
Direct Influence Coefficient Matrices (Critical, Ideal, and Most Typical Model).
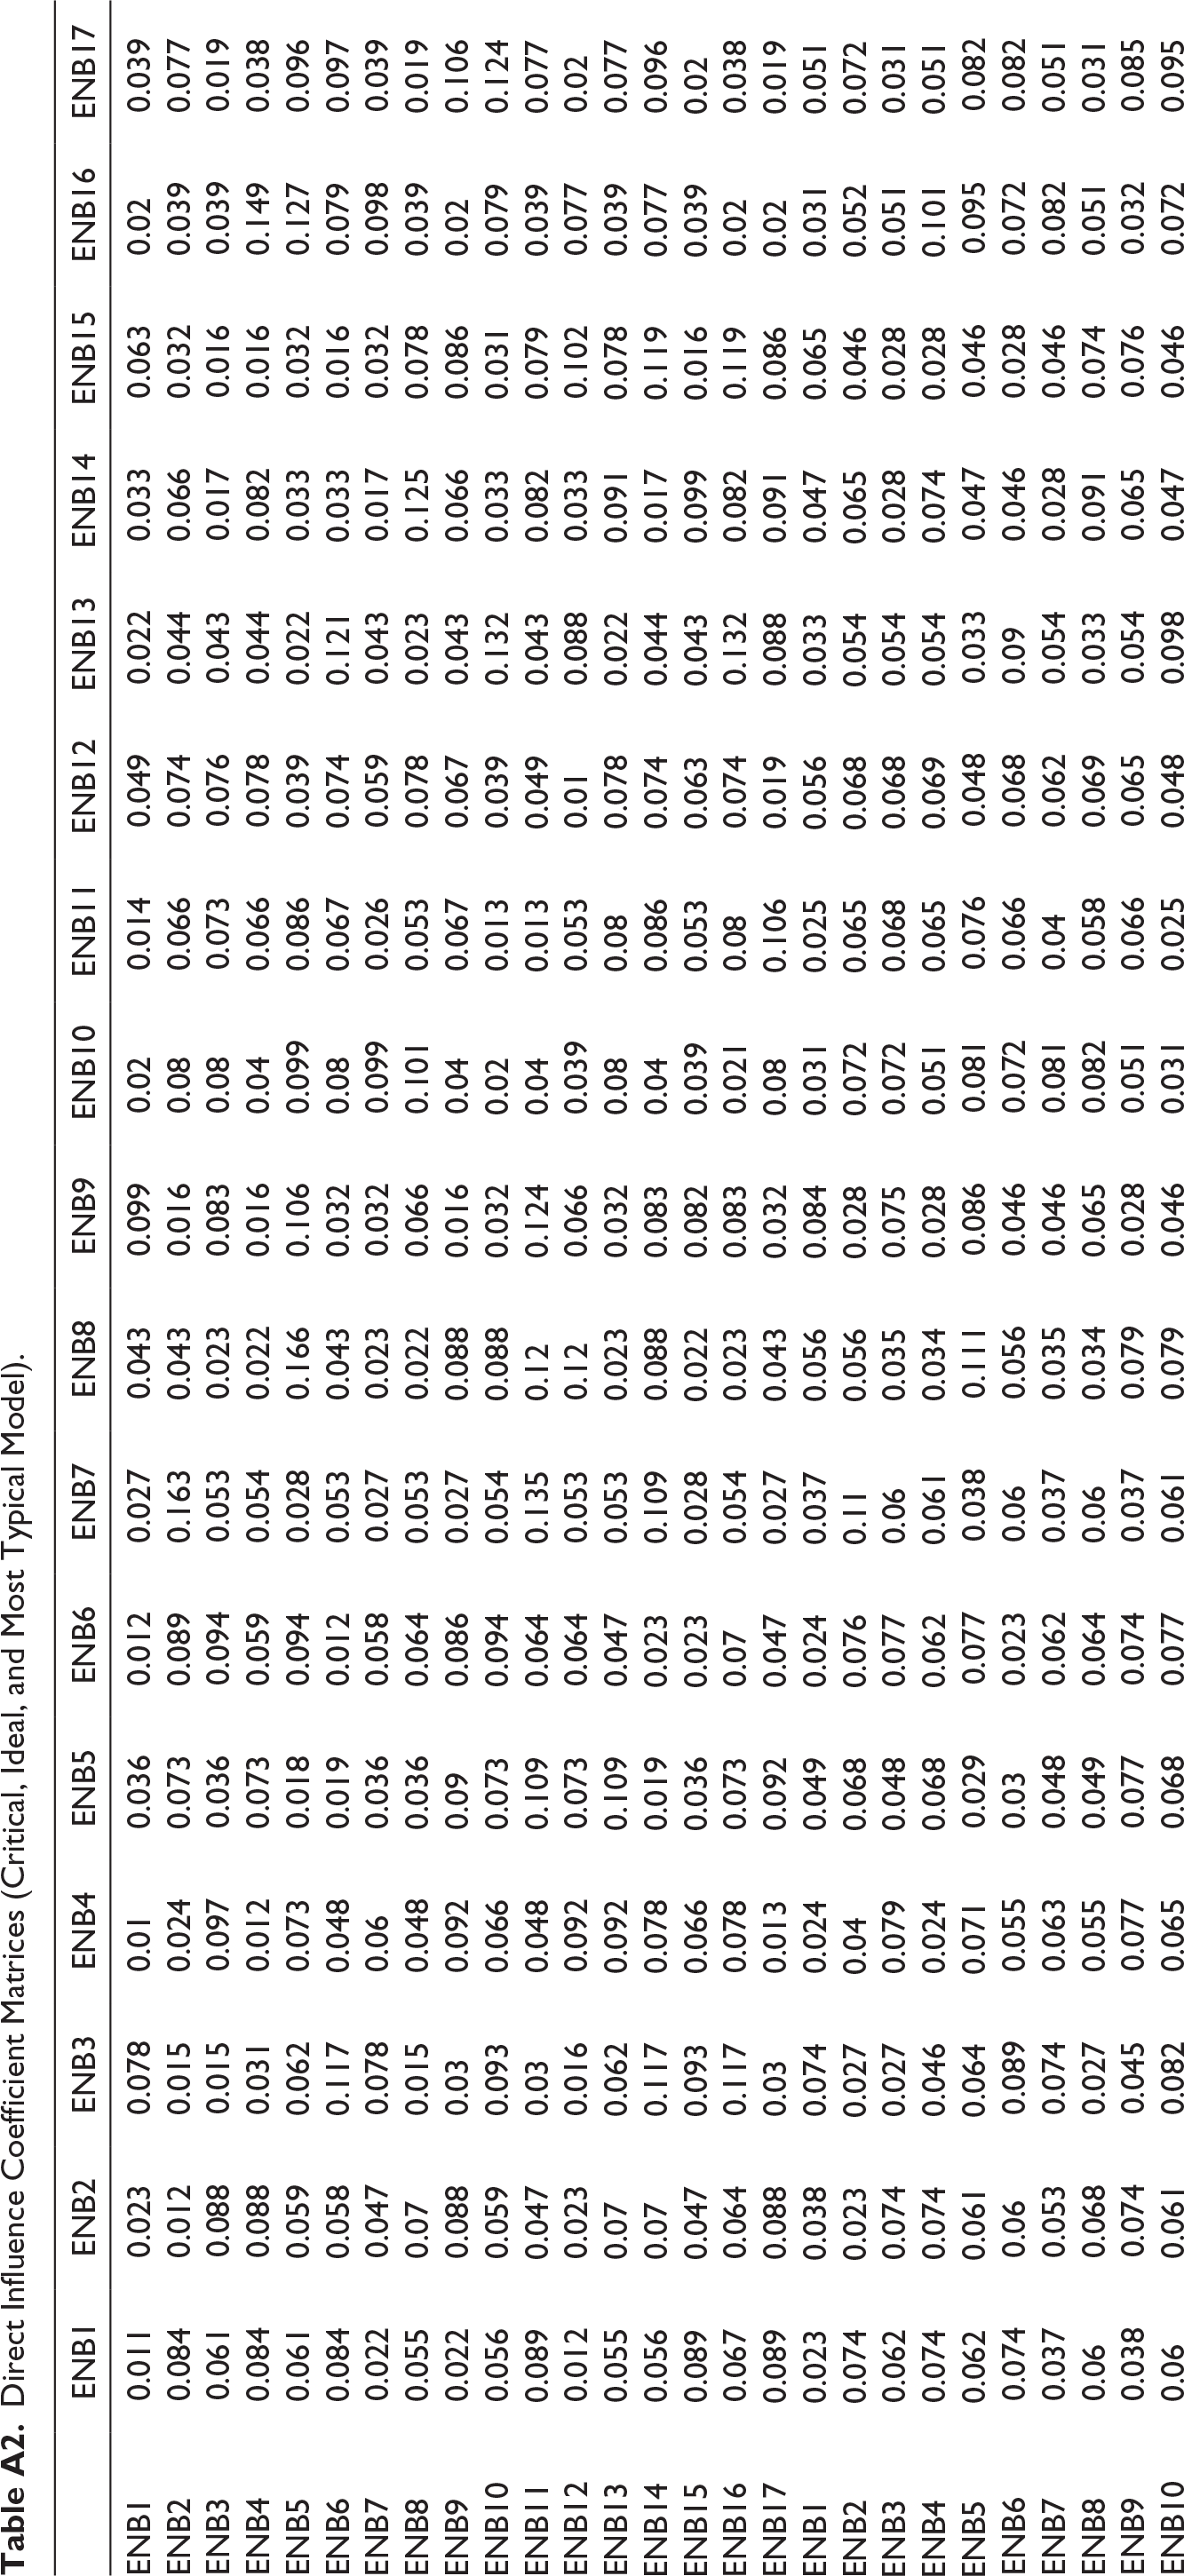
| ENB1 | ENB2 | ENB3 | ENB4 | ENB5 | ENB6 | ENB7 | ENB8 | ENB9 | ENB10 | ENB11 | ENB12 | ENB13 | ENB14 | ENB15 | ENB16 | ENB17 | |
| ENB1 | 0.011 | 0.023 | 0.078 | 0.01 | 0.036 | 0.012 | 0.027 | 0.043 | 0.099 | 0.02 | 0.014 | 0.049 | 0.022 | 0.033 | 0.063 | 0.02 | 0.039 |
| ENB2 | 0.084 | 0.012 | 0.015 | 0.024 | 0.073 | 0.089 | 0.163 | 0.043 | 0.016 | 0.08 | 0.066 | 0.074 | 0.044 | 0.066 | 0.032 | 0.039 | 0.077 |
| ENB3 | 0.061 | 0.088 | 0.015 | 0.097 | 0.036 | 0.094 | 0.053 | 0.023 | 0.083 | 0.08 | 0.073 | 0.076 | 0.043 | 0.017 | 0.016 | 0.039 | 0.019 |
| ENB4 | 0.084 | 0.088 | 0.031 | 0.012 | 0.073 | 0.059 | 0.054 | 0.022 | 0.016 | 0.04 | 0.066 | 0.078 | 0.044 | 0.082 | 0.016 | 0.149 | 0.038 |
| ENB5 | 0.061 | 0.059 | 0.062 | 0.073 | 0.018 | 0.094 | 0.028 | 0.166 | 0.106 | 0.099 | 0.086 | 0.039 | 0.022 | 0.033 | 0.032 | 0.127 | 0.096 |
| ENB6 | 0.084 | 0.058 | 0.117 | 0.048 | 0.019 | 0.012 | 0.053 | 0.043 | 0.032 | 0.08 | 0.067 | 0.074 | 0.121 | 0.033 | 0.016 | 0.079 | 0.097 |
| ENB7 | 0.022 | 0.047 | 0.078 | 0.06 | 0.036 | 0.058 | 0.027 | 0.023 | 0.032 | 0.099 | 0.026 | 0.059 | 0.043 | 0.017 | 0.032 | 0.098 | 0.039 |
| ENB8 | 0.055 | 0.07 | 0.015 | 0.048 | 0.036 | 0.064 | 0.053 | 0.022 | 0.066 | 0.101 | 0.053 | 0.078 | 0.023 | 0.125 | 0.078 | 0.039 | 0.019 |
| ENB9 | 0.022 | 0.088 | 0.03 | 0.092 | 0.09 | 0.086 | 0.027 | 0.088 | 0.016 | 0.04 | 0.067 | 0.067 | 0.043 | 0.066 | 0.086 | 0.02 | 0.106 |
| ENB10 | 0.056 | 0.059 | 0.093 | 0.066 | 0.073 | 0.094 | 0.054 | 0.088 | 0.032 | 0.02 | 0.013 | 0.039 | 0.132 | 0.033 | 0.031 | 0.079 | 0.124 |
| ENB11 | 0.089 | 0.047 | 0.03 | 0.048 | 0.109 | 0.064 | 0.135 | 0.12 | 0.124 | 0.04 | 0.013 | 0.049 | 0.043 | 0.082 | 0.079 | 0.039 | 0.077 |
| ENB12 | 0.012 | 0.023 | 0.016 | 0.092 | 0.073 | 0.064 | 0.053 | 0.12 | 0.066 | 0.039 | 0.053 | 0.01 | 0.088 | 0.033 | 0.102 | 0.077 | 0.02 |
| ENB13 | 0.055 | 0.07 | 0.062 | 0.092 | 0.109 | 0.047 | 0.053 | 0.023 | 0.032 | 0.08 | 0.08 | 0.078 | 0.022 | 0.091 | 0.078 | 0.039 | 0.077 |
| ENB14 | 0.056 | 0.07 | 0.117 | 0.078 | 0.019 | 0.023 | 0.109 | 0.088 | 0.083 | 0.04 | 0.086 | 0.074 | 0.044 | 0.017 | 0.119 | 0.077 | 0.096 |
| ENB15 | 0.089 | 0.047 | 0.093 | 0.066 | 0.036 | 0.023 | 0.028 | 0.022 | 0.082 | 0.039 | 0.053 | 0.063 | 0.043 | 0.099 | 0.016 | 0.039 | 0.02 |
| ENB16 | 0.067 | 0.064 | 0.117 | 0.078 | 0.073 | 0.07 | 0.054 | 0.023 | 0.083 | 0.021 | 0.08 | 0.074 | 0.132 | 0.082 | 0.119 | 0.02 | 0.038 |
| ENB17 | 0.089 | 0.088 | 0.03 | 0.013 | 0.092 | 0.047 | 0.027 | 0.043 | 0.032 | 0.08 | 0.106 | 0.019 | 0.088 | 0.091 | 0.086 | 0.02 | 0.019 |
| ENB1 | 0.023 | 0.038 | 0.074 | 0.024 | 0.049 | 0.024 | 0.037 | 0.056 | 0.084 | 0.031 | 0.025 | 0.056 | 0.033 | 0.047 | 0.065 | 0.031 | 0.051 |
| ENB2 | 0.074 | 0.023 | 0.027 | 0.04 | 0.068 | 0.076 | 0.11 | 0.056 | 0.028 | 0.072 | 0.065 | 0.068 | 0.054 | 0.065 | 0.046 | 0.052 | 0.072 |
| ENB3 | 0.062 | 0.074 | 0.027 | 0.079 | 0.048 | 0.077 | 0.06 | 0.035 | 0.075 | 0.072 | 0.068 | 0.068 | 0.054 | 0.028 | 0.028 | 0.051 | 0.031 |
| ENB4 | 0.074 | 0.074 | 0.046 | 0.024 | 0.068 | 0.062 | 0.061 | 0.034 | 0.028 | 0.051 | 0.065 | 0.069 | 0.054 | 0.074 | 0.028 | 0.101 | 0.051 |
| ENB5 | 0.062 | 0.061 | 0.064 | 0.071 | 0.029 | 0.077 | 0.038 | 0.111 | 0.086 | 0.081 | 0.076 | 0.048 | 0.033 | 0.047 | 0.046 | 0.095 | 0.082 |
| ENB6 | 0.074 | 0.06 | 0.089 | 0.055 | 0.03 | 0.023 | 0.06 | 0.056 | 0.046 | 0.072 | 0.066 | 0.068 | 0.09 | 0.046 | 0.028 | 0.072 | 0.082 |
| ENB7 | 0.037 | 0.053 | 0.074 | 0.063 | 0.048 | 0.062 | 0.037 | 0.035 | 0.046 | 0.081 | 0.04 | 0.062 | 0.054 | 0.028 | 0.046 | 0.082 | 0.051 |
| ENB8 | 0.06 | 0.068 | 0.027 | 0.055 | 0.049 | 0.064 | 0.06 | 0.034 | 0.065 | 0.082 | 0.058 | 0.069 | 0.033 | 0.091 | 0.074 | 0.051 | 0.031 |
| ENB9 | 0.038 | 0.074 | 0.045 | 0.077 | 0.077 | 0.074 | 0.037 | 0.079 | 0.028 | 0.051 | 0.066 | 0.065 | 0.054 | 0.065 | 0.076 | 0.032 | 0.085 |
| ENB10 | 0.06 | 0.061 | 0.082 | 0.065 | 0.068 | 0.077 | 0.061 | 0.079 | 0.046 | 0.031 | 0.025 | 0.048 | 0.098 | 0.047 | 0.046 | 0.072 | 0.095 |
| ENB11 | 0.075 | 0.053 | 0.045 | 0.055 | 0.087 | 0.064 | 0.097 | 0.094 | 0.091 | 0.051 | 0.025 | 0.055 | 0.054 | 0.074 | 0.074 | 0.052 | 0.072 |
| ENB12 | 0.023 | 0.038 | 0.028 | 0.077 | 0.068 | 0.064 | 0.06 | 0.094 | 0.065 | 0.05 | 0.058 | 0.021 | 0.076 | 0.047 | 0.085 | 0.071 | 0.032 |
| ENB13 | 0.06 | 0.068 | 0.064 | 0.077 | 0.087 | 0.054 | 0.06 | 0.035 | 0.046 | 0.072 | 0.074 | 0.069 | 0.033 | 0.077 | 0.074 | 0.052 | 0.072 |
| ENB14 | 0.06 | 0.068 | 0.089 | 0.073 | 0.03 | 0.038 | 0.086 | 0.079 | 0.075 | 0.051 | 0.076 | 0.068 | 0.054 | 0.028 | 0.09 | 0.071 | 0.082 |
| ENB15 | 0.075 | 0.053 | 0.082 | 0.065 | 0.048 | 0.038 | 0.038 | 0.034 | 0.074 | 0.05 | 0.058 | 0.064 | 0.054 | 0.084 | 0.028 | 0.052 | 0.032 |
| ENB16 | 0.068 | 0.062 | 0.089 | 0.073 | 0.068 | 0.07 | 0.061 | 0.035 | 0.075 | 0.031 | 0.074 | 0.068 | 0.098 | 0.074 | 0.09 | 0.031 | 0.051 |
| ENB17 | 0.075 | 0.074 | 0.045 | 0.024 | 0.078 | 0.054 | 0.037 | 0.056 | 0.046 | 0.072 | 0.082 | 0.034 | 0.076 | 0.077 | 0.076 | 0.031 | 0.031 |
| ENB1 | 0.018 | 0.032 | 0.075 | 0.019 | 0.044 | 0.019 | 0.034 | 0.051 | 0.089 | 0.027 | 0.021 | 0.053 | 0.029 | 0.042 | 0.064 | 0.027 | 0.047 |
| ENB2 | 0.078 | 0.018 | 0.023 | 0.034 | 0.07 | 0.081 | 0.126 | 0.051 | 0.024 | 0.074 | 0.066 | 0.07 | 0.051 | 0.066 | 0.041 | 0.048 | 0.074 |
| ENB3 | 0.062 | 0.079 | 0.023 | 0.086 | 0.044 | 0.084 | 0.058 | 0.031 | 0.078 | 0.074 | 0.07 | 0.071 | 0.05 | 0.024 | 0.023 | 0.047 | 0.027 |
| ENB4 | 0.078 | 0.079 | 0.04 | 0.019 | 0.07 | 0.061 | 0.059 | 0.03 | 0.024 | 0.047 | 0.066 | 0.073 | 0.051 | 0.077 | 0.023 | 0.118 | 0.046 |
| ENB5 | 0.062 | 0.06 | 0.063 | 0.072 | 0.025 | 0.084 | 0.035 | 0.13 | 0.093 | 0.087 | 0.079 | 0.045 | 0.029 | 0.042 | 0.041 | 0.106 | 0.087 |
| ENB6 | 0.078 | 0.059 | 0.1 | 0.053 | 0.026 | 0.019 | 0.058 | 0.051 | 0.041 | 0.074 | 0.066 | 0.07 | 0.1 | 0.041 | 0.023 | 0.075 | 0.088 |
| ENB7 | 0.031 | 0.05 | 0.075 | 0.062 | 0.044 | 0.06 | 0.034 | 0.031 | 0.041 | 0.087 | 0.035 | 0.061 | 0.05 | 0.024 | 0.041 | 0.088 | 0.047 |
| ENB8 | 0.058 | 0.069 | 0.023 | 0.053 | 0.044 | 0.064 | 0.058 | 0.03 | 0.065 | 0.088 | 0.056 | 0.073 | 0.03 | 0.103 | 0.075 | 0.047 | 0.027 |
| ENB9 | 0.031 | 0.079 | 0.04 | 0.083 | 0.082 | 0.079 | 0.034 | 0.082 | 0.024 | 0.047 | 0.066 | 0.065 | 0.05 | 0.066 | 0.08 | 0.028 | 0.092 |
| ENB10 | 0.059 | 0.06 | 0.086 | 0.066 | 0.07 | 0.084 | 0.059 | 0.082 | 0.041 | 0.027 | 0.02 | 0.045 | 0.109 | 0.042 | 0.04 | 0.075 | 0.105 |
| ENB11 | 0.081 | 0.05 | 0.04 | 0.053 | 0.095 | 0.064 | 0.109 | 0.103 | 0.103 | 0.047 | 0.02 | 0.052 | 0.05 | 0.077 | 0.076 | 0.048 | 0.074 |
| ENB12 | 0.018 | 0.032 | 0.024 | 0.083 | 0.07 | 0.064 | 0.058 | 0.103 | 0.065 | 0.047 | 0.056 | 0.016 | 0.08 | 0.042 | 0.091 | 0.073 | 0.028 |
| ENB13 | 0.058 | 0.069 | 0.063 | 0.083 | 0.095 | 0.051 | 0.058 | 0.031 | 0.041 | 0.074 | 0.076 | 0.073 | 0.029 | 0.082 | 0.075 | 0.048 | 0.074 |
| ENB14 | 0.059 | 0.069 | 0.1 | 0.075 | 0.026 | 0.032 | 0.093 | 0.082 | 0.078 | 0.047 | 0.079 | 0.07 | 0.051 | 0.024 | 0.101 | 0.073 | 0.087 |
| ENB15 | 0.081 | 0.05 | 0.086 | 0.066 | 0.044 | 0.032 | 0.035 | 0.03 | 0.077 | 0.047 | 0.056 | 0.064 | 0.05 | 0.09 | 0.023 | 0.048 | 0.028 |
| ENB16 | 0.067 | 0.063 | 0.1 | 0.075 | 0.07 | 0.07 | 0.059 | 0.031 | 0.078 | 0.028 | 0.076 | 0.07 | 0.109 | 0.077 | 0.101 | 0.027 | 0.046 |
| ENB17 | 0.081 | 0.079 | 0.04 | 0.02 | 0.083 | 0.051 | 0.034 | 0.051 | 0.041 | 0.074 | 0.091 | 0.028 | 0.08 | 0.082 | 0.08 | 0.027 | 0.027 |