
Abstract
Literature discusses numerous factors relating to financial ratios and balance sheet components influencing firm value, the key indicator for evaluating firms’ performance. Besides, research works examining the determinants of firm value in women-owned firms are rarely seen. Reacting to this, present study aims to analyse the impact of 14 key variables that belong to financial ratios and balance sheet components on firm value, with a specific focus on women-owned firms. Using data of 381 women-owned firms sourced from the Centre for Monitoring Indian Economy spanning 2014–2023, this study employs principal component analysis on 14 variables to obtain three key significant indices to apply panel autoregressive distributed lag error correction model subsequently on the identified indices. The results unequivocally demonstrate the significant positive impact of financial ratios and balance sheet components on the firm value of women-owned firms. This research can enable the stakeholders to plan and execute strategies for improvement and mitigate the risk.
Introduction
The extant literature stands as evidence of the fact that numerous factors contribute to the firm value (Du et al., 2024) which is the total market value of debt and equity of a firm (Keter et al., 2024; Nebie & Cheng, 2023) and potential growth. Vast areas of research have been carried out on the following significant influential factors of firm value: firm size, profitability, leverage (Dian & Erni, 2020), total asset turnover, current ratio (CR), debt–equity ratio (DER) and return on equity (ROE) (Ahmad et al., 2022), digitalization (Chen & Srinivasan, 2023), ability to liquidate the assets, activity ratios (Kurniawan & Merry, 2023), composition of capital, ownership stake (Sudiyatno et al., 2020), transparency regarding corporate social responsibility (CSR) (Jihadi et al., 2021), human capital, dividend policy, financial ratios, assets owned by the firm and cash holdings (Sisodia et al., 2021) influence firm value by a long shot.
Although copious research has been conducted on these factors, studies that focus on the factors that contribute to firm value in women-owned companies are seldom explored. This study intends to fill this huge vacuum. Literature emphasizes the importance of such specific research on the factors contributing to the firm value in women-owned firms (Chen et al., 2024) for the following two reasons: (a) It is important to explore this because, in the current competitive world, women hold a major share in developing the economy and building the nation (Fauzi et al., 2023). (b) Also, women-owned firms in corporates are gaining recognition across the globe for their strategies and performance (Mertzanis et al., 2023). In line with this, 14 variables have been identified that fall under the category of financial ratios and balance sheet components. Hence, the objective of this study is to analyse the influence of financial ratios and balance sheet components on firm value with emphasis on women-owned firms. To attain this objective, the study employs a panel autoregressive distributed lag (ARDL) error correction model (panel ARDL-ECM) on the data of 381 companies sourced from the Centre for Monitoring Indian Economy (CMIE) spanning 2013–2023, as it suits estimating the short-term and long-term relationship of the variables of mixed integration (Gokmenoglu & Amir, 2023). To vanquish the problem of multicollinearity among the 14 variables, the principal component analysis (PCA) technique has been exercised to estimate the key indices from the transformation of the variables. After the transformation and identification of the three indices, namely the ratio index (RI), earnings index (EI) and financial index (FI), the appropriate panel ARDL-ECM model is used.
The results of the study evidently confirm that the estimated indices have a significant positive impact on firm value in women-owned firms, which enables the stakeholders to plan and execute strategies for both improving firm value and mitigating their risk. This study contributes to the existing literature by analysing 14 variables that fall under the category of financial ratios and balance sheet components. Unlike most previous studies, which only have included a few of these variables, this study incorporates 14 key variables in the analysis, focusing specifically on women-owned firms, which is the first of its kind.
This study is organized as follows. The first section consists of the introduction; the literature survey and theoretical framework are constituted in the second section; the third section includes the methodology of the study; the fourth section is composed of the results and discussion, followed by the conclusion in the fifth section.
Literature Review and Theoretical Framework
Firm value, a crucial concept in business and finance, depicts the economic value of a firm. It is an even-handed and credible metric that is deployed to determine the competence and operations of the firm, measuring triumph and affluence (Fedorovich & Fedorovich, 2020). It is the present value of assets that the firm holds and the current value of future growth opportunities (Ong & Chen, 2016). According to Xie et al. (2023), financial measures are not the only factors that contribute to firm value; rather, social performance and environmental responsibilities also determine the value of the firm. The value of a firm can be influenced by the type of market that the firm operates in, risk and corporate management, efficient planning of taxes and financial performance (Nebie & Cheng, 2023).
Research reveals that in developing countries disclosure of the firm’s carbon and CSR activities has a negative influence on firm value (Mahmudah et al., 2023). The study conducted to examine the linear relationship between founding-family control and intergenerational succession shows that the concentration of ownership hinders the growth of firm value, whereas intergenerational succession leads to an increase in the same over the years (Cid et al., 2022). It is identified that factors related to information technology (IT) have a strong and significant impact on the value of the firm (Ong & Cheng, 2016). Related party transactions have also been found to have impacted firm value in India (Abdul Rasheed et al., 2022). In emerging economies, political connections play a vital role in determining the firm value. Though political connections have an impact on the firm value, it cannot be considered completely positive. Firms that acquire political connections exhibit better firm value than firms with ascribed connections (Ha et al., 2020). Earlier studies highlight the fact that maintenance of efficient and standard human capital enhances firm value, as it helps in utilizing and creating growth opportunities (Sisodia et al., 2021).
Existing literature unmasked the influence of water and waste management, along with work safety, energy utilized and gender diversity on firm value. While waste management and firm age had a negative impact, safety, energy consumed and gender diversity exhibited a positive influence (Khunkaew et al., 2023). Firms’ risk management measures mediated by investment decisions have impacted firm value since they ensure a balance between the threats and opportunities that come along and manage potential risks through essential strategies (Faisal et al., 2021). Disclosure of complete information about the firm and its activities reduces the occurrence of information asymmetry, thereby reducing the cost of capital and increasing trust among the public, leading to a hike in firm value (Diantimala et al., 2022). Along with this, sustainability reporting, a factor that holds the interest of the stakeholders in developing countries, has a positive and significant influence on firm value (Van Linh et al., 2022). High firm value is also attributed to the disclosure of the intellectual capital of the firms, which is considered a crucial intangible asset in emerging economies (Keter et al., 2024). Research also holds evidence for the fact that firms that engage in CSR activities have a positive firm value because it leads to increased reputation and performance (Chen et al., 2024). Overconfidence, a pervasive psychological trait in managers, termed managerial overconfidence, has a positive effect on firm value, mediated by CSR activities (Gao & Han, 2022). The increasing sentiments and emotions in social media platforms also have an effect on firm value. Positive social media sentiments lead to an increasing firm, and negative sentiments pave the way for a decrease in the same (Benjamin et al., 2022). Adoption and implementation of International Financial Reporting Standards (IFRS) in firms with financial constraints and in countries with a greater commitment to law tends to positively impact firm value (Agyei-Boapeah et al., 2020). Corporate governance, gender diversity in boards and independence of directors are also some key mechanisms that impact firm value (Cid et al., 2022). Research identifies that optimum levels of cash holdings and internal funds have exerted influence on firm value (Martínez-Sola et al., 2011).
Earlier studies that explored the factors affecting firm value showcased the effect of various financial metrics on it. Return on assets (ROA), firm size (Husna & Satria, 2019), profitability and activity ratios (Kristi & Yanto, 2020) influence firm value in a positive direction. Leverage, liquidity, CSR disclosure (Fajaria & Isnalita, 2018), capital structure and ROE (Thi, 2023), the total asset turnover ratio and DER (Hamzah et al., 2022) are found to have a negative impact on firm value.
This study analyses the impact of DER, quick ratio (QR), CR, cash-to-current liabilities (CCL), profit before interest, tax, depreciation and amortization (PBITDA), net profit margin (NPM), return on net worth (RONW), ROA, return on capital (ROC), total capital (TC), total liabilities (TL), total assets (TA), total expenses (TE) and total income (TI) on firm value proxied by net worth (NW). Previous studies that were executed advocated the importance and significance of these variables on firm value. Pertaining to the earlier studies, these 14 variables categorized under both financial ratios and balance sheet components are opted for this analysis. The following section describes the variables that are used in the analysis, and the summary of the variable definitions is found in Table 1(a).
Summary of the Variables.
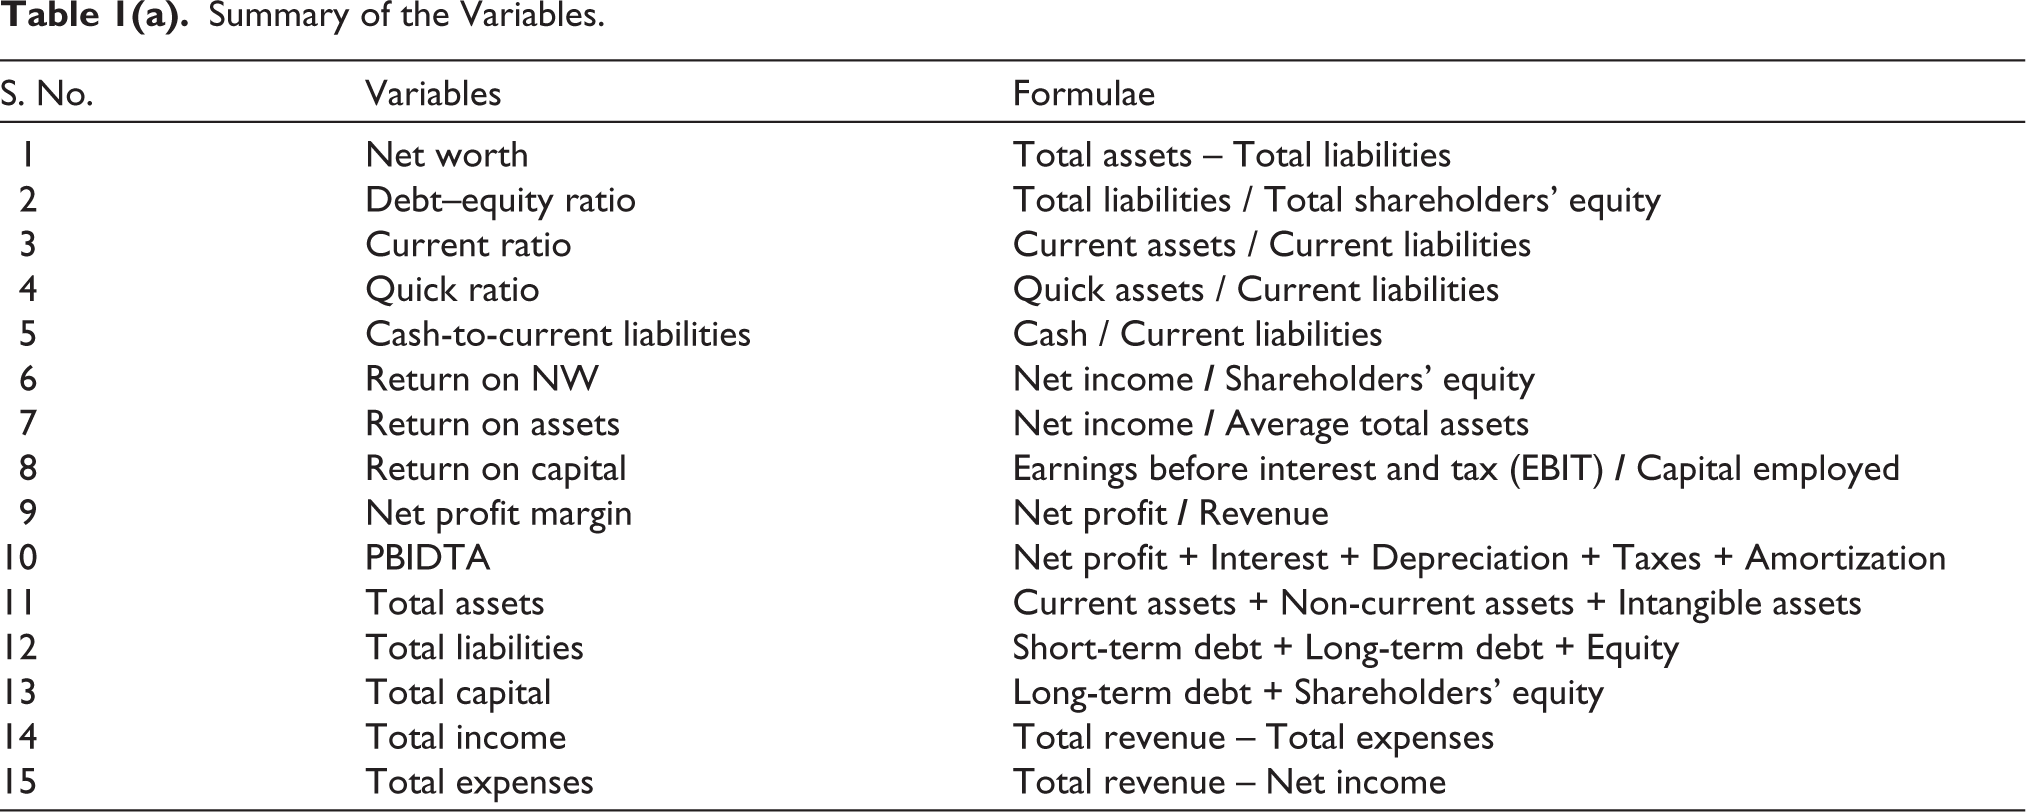
NW, also known as the book value of the firm, is the value of the firm’s assets after deducting its liabilities. It depicts the financial health of the firms and helps understand the firm’s capacity to generate revenue and manage the financial setbacks. A positive NW shows that the firm has more assets and has the capacity to meet its obligations, and vice versa. It also helps to decide on investments and lending (Alam, 2020). DER is a solvency or leverage ratio that measures the total debt and total equity of the firm, indicating the relative proportion of shareholders’ equity and the firm’s total debt (Tarsono, 2021). It is used to determine the ability of the firm to repay the debts at the time of liquidation (Ina & Ihsan, 2022). ROA is a ratio that is employed to estimate the profitability of a firm. It shows the net income earned by the firm measured by asset value. Increased ROA results in increased return, thereby leading to increased performance (Ina & Ihsan, 2022). CR is a measure between the current assets and current liabilities of the firm. CR is used to determine the ability of the firm to pay its short-term liabilities. The higher the CR, the higher the liquidity of the firms (Omar et al., 2016). QR is a liquidity ratio that includes the most liquid assets among the current assets and current liabilities and does not include those assets that are difficult to liquidate (Omar et al., 2016). CCL, also known as cash ratio, is a measure that compares the current liabilities of the firm to its most liquid assets, that is, cash and cash equivalents and marketable securities. Through this ratio, the investors get to know the ability of the firm in generating cash from its operations (Hu et al., 2022).
RONW, also known as ROE, measures a firm’s earnings through shareholders’ equity. It is a measure of the ability of the firm to generate profit using its own capital (Supriyadi, 2021). High RONW proves the efficiency and effectiveness of the firms’ management (Hertina & Saudi, 2019). NPM measures profit after interest and taxes. It measures the percentage of sales after the deduction of costs and expenses, which include tax and interest (Nariswari & Nugraha, 2020). An increase in NPM is an indicator that the firm earns a high profit concerning its sales (Mahdi & Khaddafi, 2020). ROC is a measure of profitability and value creation, and it indicates the overall performance of the firm. It depicts how the profits earned stand up to the capital invested or employed (Yen et al., 2023). Profit before interest, depreciation, taxes and amortization (PBIDTA) is an operating measure used to evaluate the performance of a firm through its earning power. The real profit that is earned by the firm is known through the calculation of PBIDTA (Adiloglu & Vuran, 2017).
TA refers to the total amount of assets owned by the entity or firm. It represents the economic value of the firm and helps in evaluating the financial position of the firm. It depicts the ability of the firm to handle its financial obligation and its capacity to invest and expand. TLs refer to the debts and obligations that the firm owes to external parties. It represents the creditworthiness, leverage and financial health of the business (Al-Kassar & Soileau, 2014; Krulický & Nováková, 2023). TE is the combined value of all the costs and expenditure that the firm incurs over the period of time. These expenses include taxes, interest, operating expenses and other miscellaneous expenses that are incurred during the course of the business. Monitoring TE helps to control costs and optimize it, thereby improving operational efficiency and reallocation of resources (Abdul Rasheed et al., 2022; Islam, 2020). TI is the sum of all money received by the firm. It is a combination of all forms of income and earnings received by the firm during a specific period of time. TI helps to understand the financial position of the firm and its ability to generate revenue (Abdul Rasheed et al., 2022; Islam, 2020). TC is the aggregate of money that is raised by the firm to fund its operations and assets. It is the sum of shareholders’ equity and long-term debt. TC helps to understand the financial structure of the firm, the risk factors and the ability of the firm to raise funds (Murcia et al., 2022).
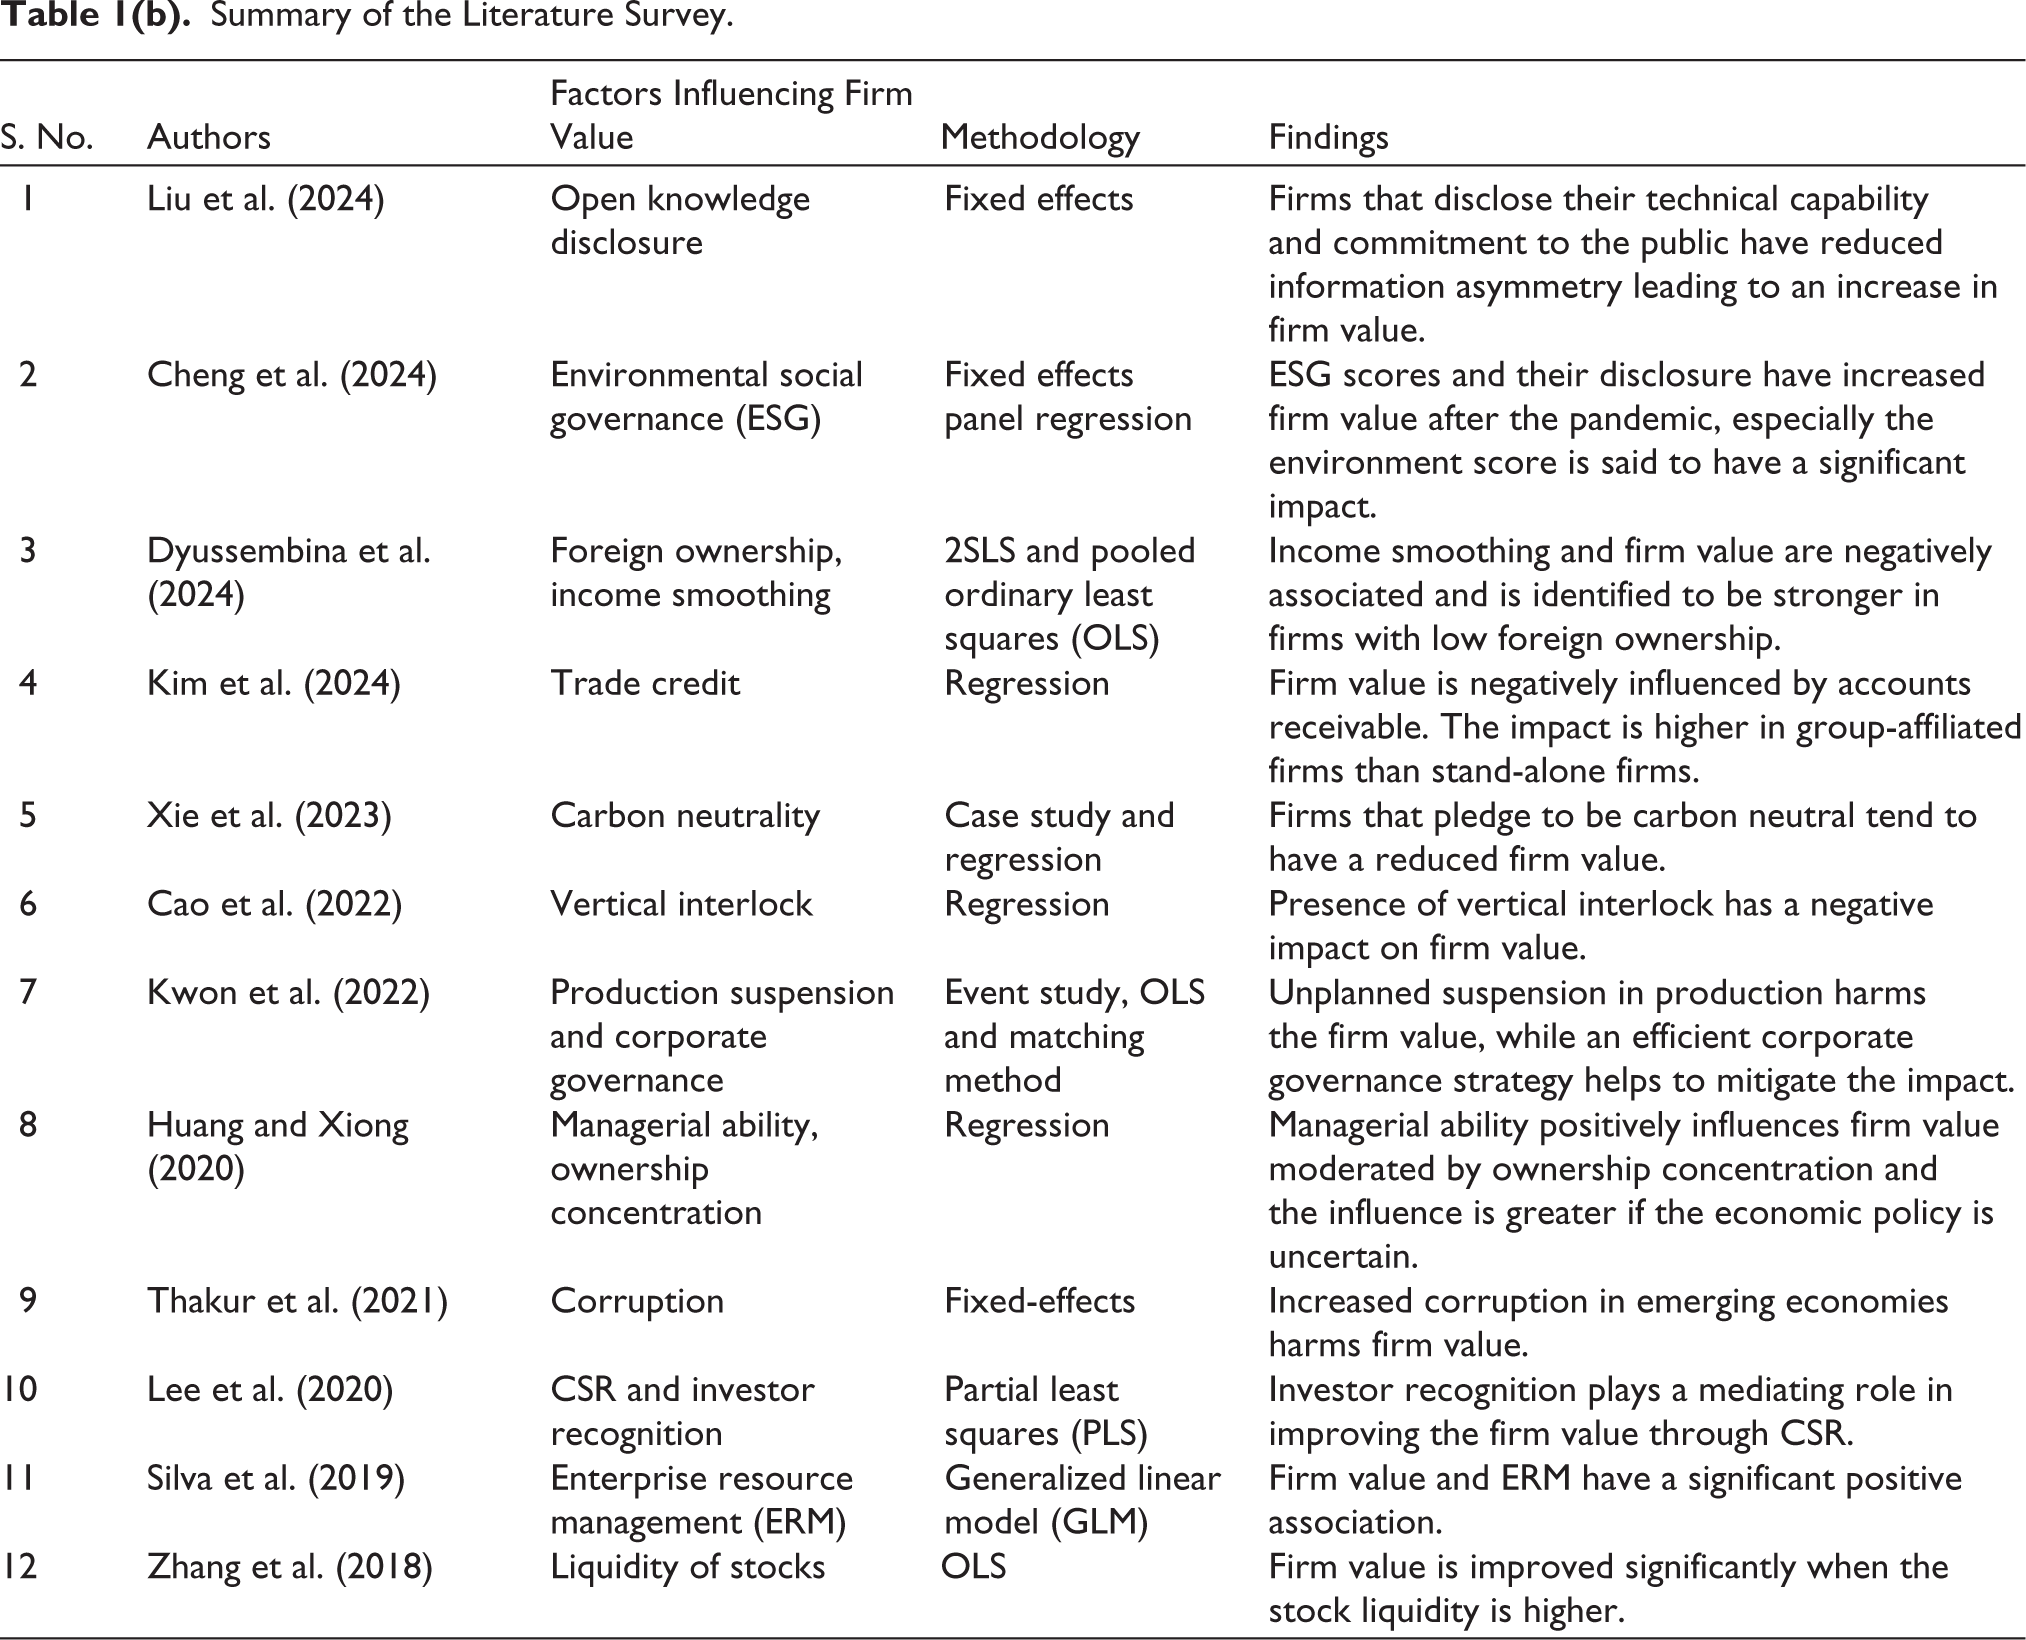
From the extant literature survey executed, it can be inferred that numerous studies have been carried out across the globe to identify the factors that influence firm value. Table 1(b) is a summary of the previous studies that have been carried out in this regard. Though numerous studies have been undertaken to identify the factors that influence firm value, studies focusing on women-owned firms are seldom cited. This study aims to fill this gap by identifying the influencing factors of firm value in women-owned firms across diverse sectors.
Summary of the Literature Survey.
Methodology
Data
A panel data comprising 381 firms with women CEOs and directors has been chosen for this study from a population of 800 firms. The data collected span 2014 to 2023 and are amassed from the CMIE database. The firms were selected using a purposive sampling technique where the samples are selected based on certain criteria. This technique ensures effective selection of samples from a large population by targeting the samples that possess the required criteria and are relevant to the study.
Principal Component Analysis (PCA)
PCA is a well-established unsupervised machine learning technique used for dimensionality reduction in a dataset and is employed to identify linear dependencies among variables and transform them to a set of non-linear variable values called principal components (PCs) (Al-Fawa’reh et al., 2022; Bharadiya, 2023). PCA provides a synoptic approach to ascertain the dynamics of the variables under study without losing information (Fatima et al., 2022). Computation of indices using PCA involves certain steps. Initially, the variables are standardized and the covariance matrix of the variables is constructed to ascertain the correlations among them. After identifying the correlation, the eigenvalues and eigenvectors are estimated to identify the PCs. The feature vector is then created to decide the retention of PCs. The PCs with the highest eigenvalue are retained and are re-cast along the original variables, and the index is created using the following formula:
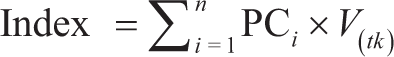
where PCi is the principal component, n refers to the number of PC and V(tk) is the data point of the variables at time t for firm k.
Panel Cointegration (Pedroni)
The term ‘cointegration’ was initially mentioned by Engle and Granger in 1987. Cointegration tests demonstrates the presence of long-run relationship among the variables and is executed to know how the variables navigate together over time periods so that the sudden short-term upheaval can be resolved in the long-run (Azmi et al., 2023). Cointegration test for the panel data model was introduced by Pedroni and is referred as the first-generation panel cointegration tests. Pedroni cointegration is a residual-based panel cointegration test of the residuals of the cointegrating regression (Shahbaz et al., 2021). The Pedroni (1999), cointegration test for panel data uses the following panel cointegration regression equation to estimate the results.


In Equations (2) and (3),
Based on the cointegrating regression equation of Pedroni (1999), the estimated model is specified as:


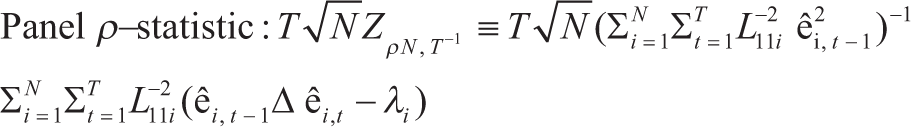
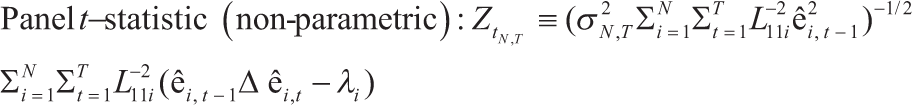
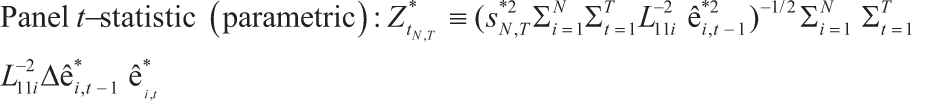
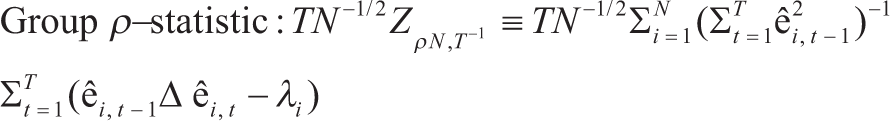
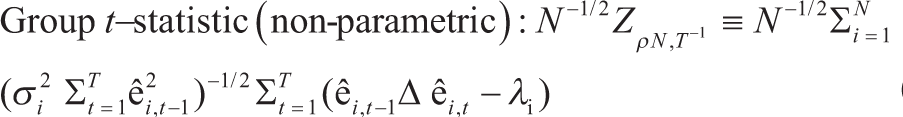
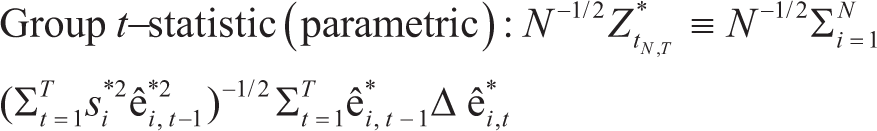
Using the residuals from these cointegrating regression, the four statistics, namely variance ratio statistic (v), rho-statistic (t), Phillips and Perron t-statistic (non-parametric) and augmented Dickey–Fuller (ADF) t-statistic (parametric) are estimated for both panel cointegration (within-dimension) and group mean panel cointegration (between-dimension). The mathematical expression for the calculation of the Pedroni test statistics as estimated by Pedroni (1999) are given in Equations (6)–(12). The results of the cointegration test statistics are displayed in Table 10.

Panel ARDL-ECM model
Panel ARDL-ECM is a standard LS regression model where the outcome or the dependent variable is a function of its own lagged values and the current and past values of the regressors (Dar & Asif, 2023). This method is employed in the analysis as it provides both the long-run and short-run coefficients of regressors with mixed integration, that is I(0) and I(1) (Gokmenoglu & Amir, 2023). After establishing the cointegration between the variables, the panel ARDL-ECM model is executed (Li & Shao, 2022). The mean group (MG) estimator proposed by Pesaran and Smith (1995) and pooled mean group (PMG) estimator proposed by Pesaran et al. (1999) are used to ascertain the long-run and short-run coefficients and the error correction term (ECT). The MG estimator derives long-run parameters for individual entities, while in the PMG estimator the parameters are consistent for all the entities (Chu & Sek, 2014; Humpe & McMillan, 2020). The panel ARDL-ECM model is expressed as:

where C is the intercept, Yt is the dependent variable, Xt is the independent variable or the regressor, b1 is the coefficient of the dependent variable at first difference at time t – i, a is the coefficient of the independent variables at first difference at time t – i, d is the coefficient of the ECT, D represents the first difference of the variables, m represents number of lags of dependent variable, n represents number of lags of the regressors, k represents number of variables and f represents the error term.
Based on the above model, the following equation is constructed:
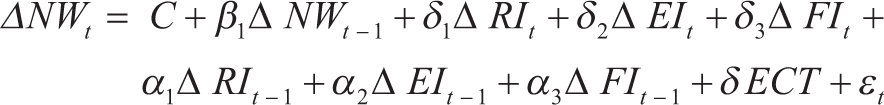
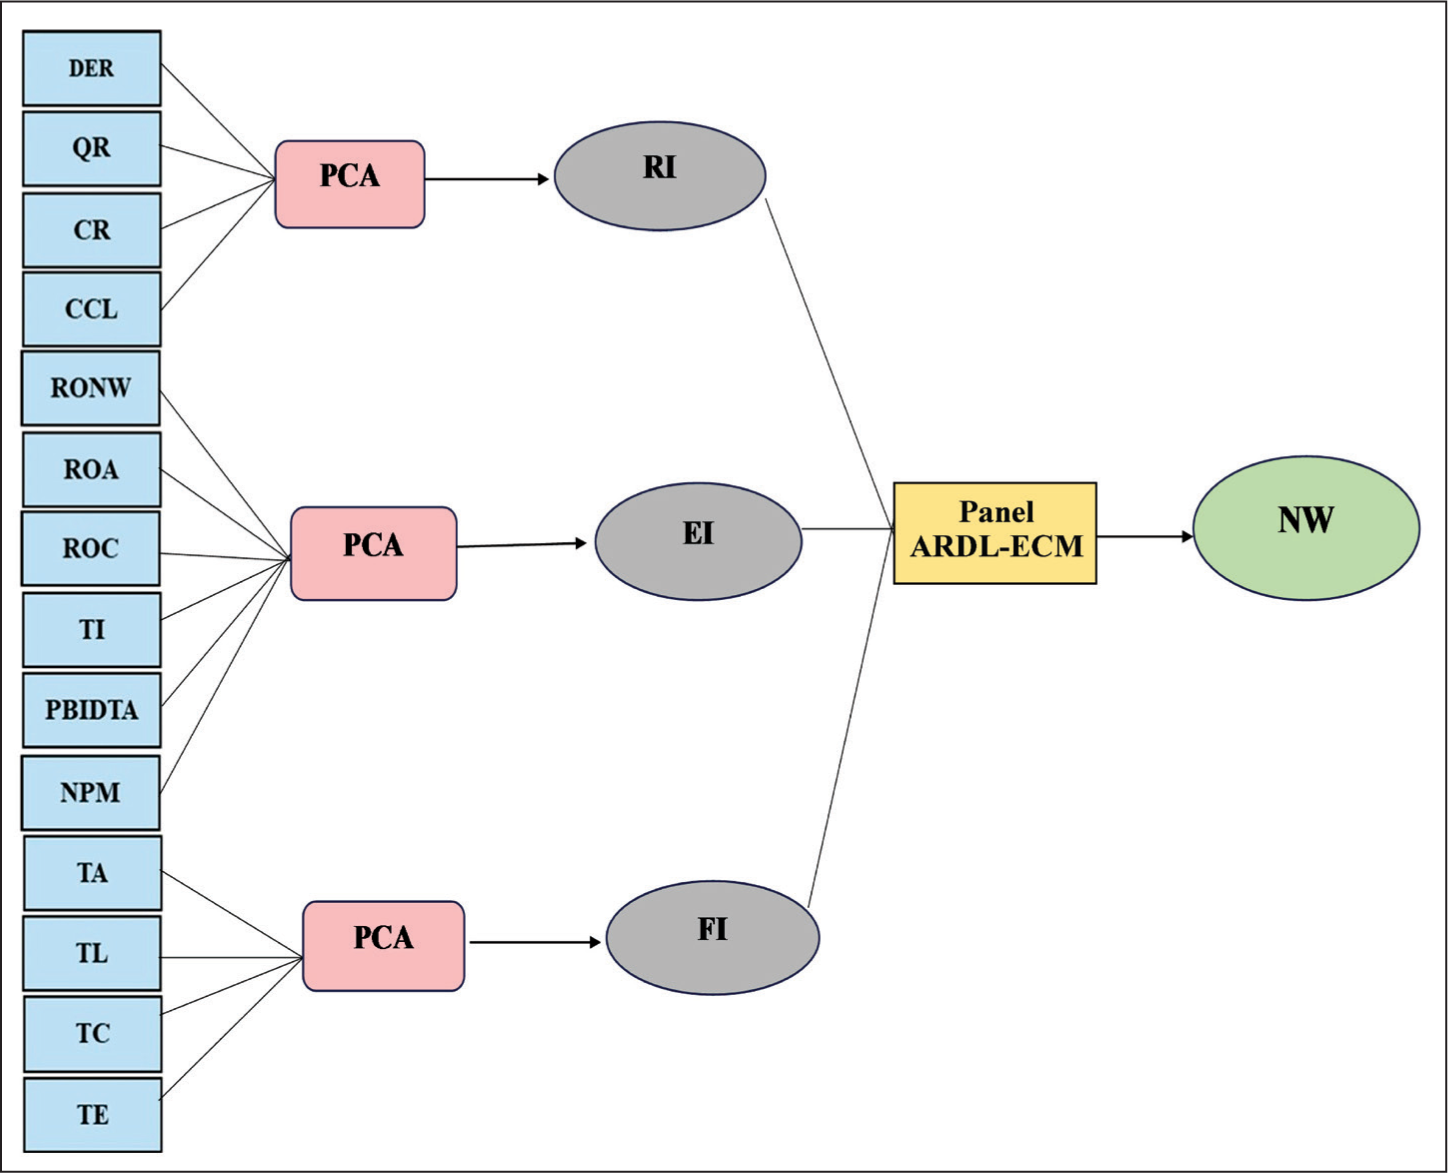
Figure 1 depicts the schematic framework of the analysis exhibiting the PCA and panel ARDL-ECM approach.
Schematic Framework Exhibiting PCA and Panel ARDL-ECM.
Results and Discussion
Principal Component Analysis (PCA)
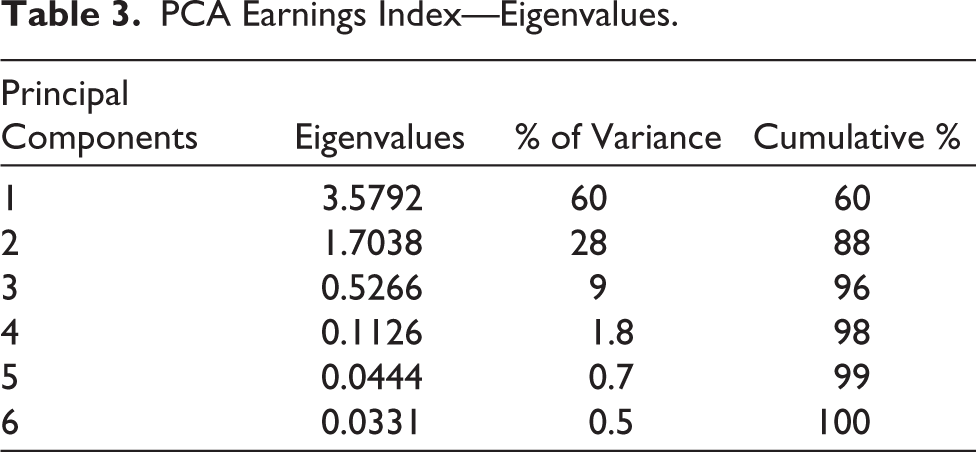
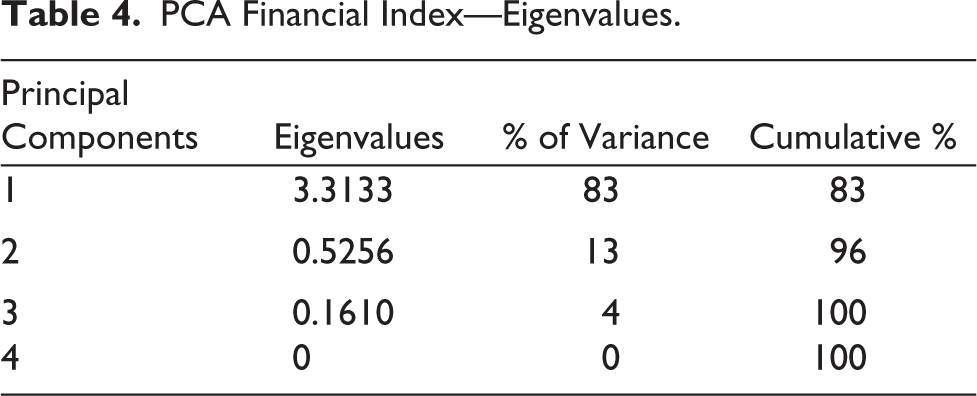
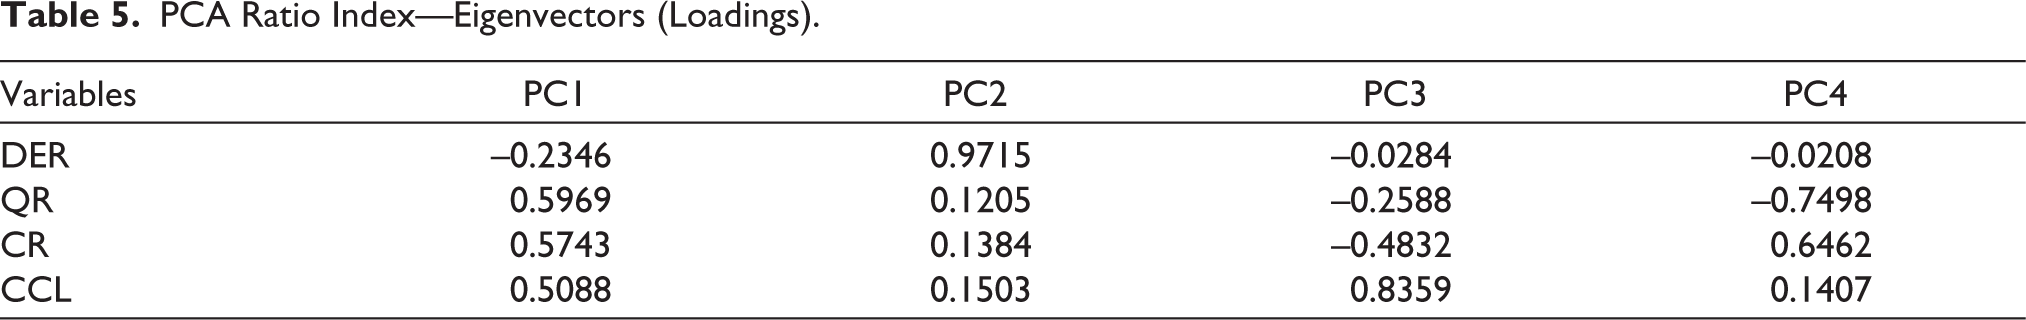
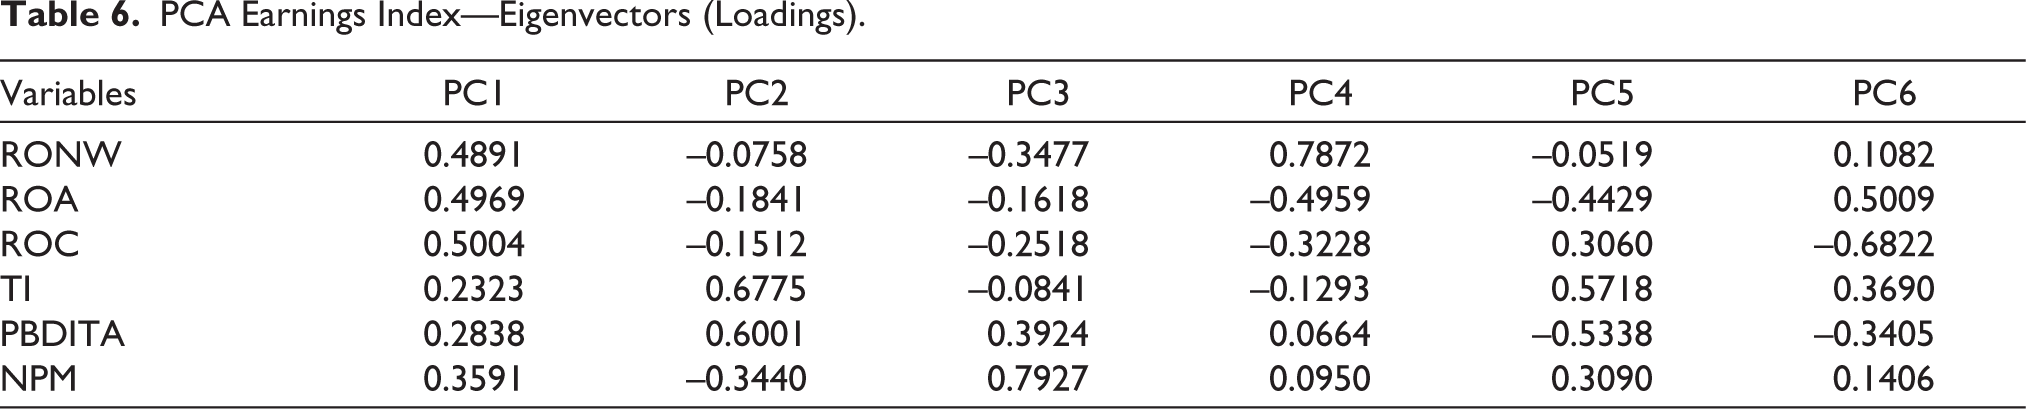
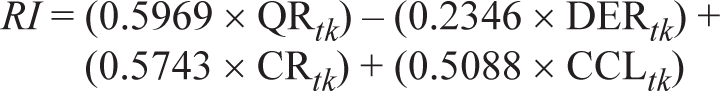
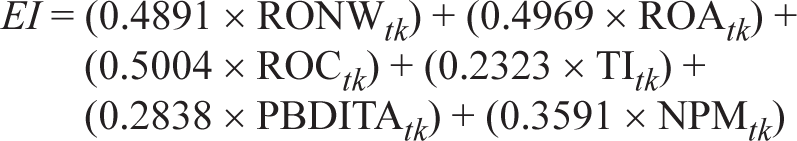
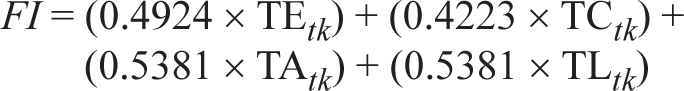
By applying the PCA, the indices RI, EI and FI have been obtained. The index RI is obtained by combining DER, CF, QR and CCL. Similarly, for the computation of EI, RONW, ROA, ROC, TI, PBDITA and NPM are used. The variables used to construct FI include TE, TC, TAL and TA. These indices are estimated by following the procedure mentioned earlier in the methodology in the third section.
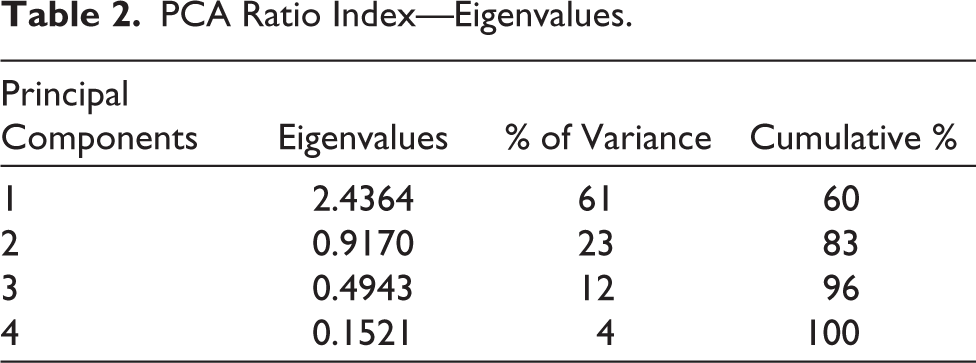
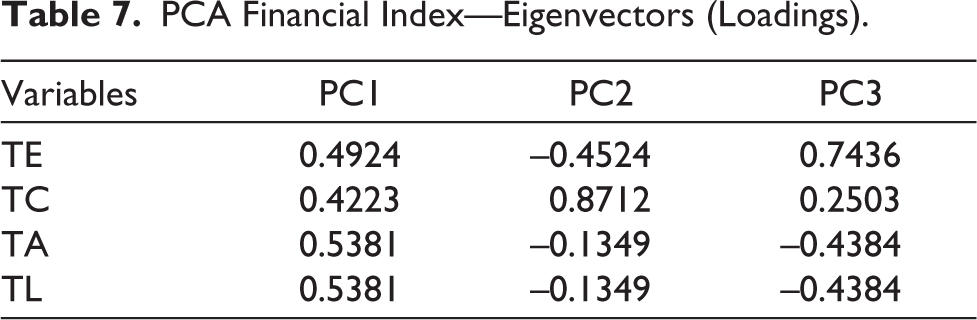
Tables 2–4 present the eigenvalues of RI, EI and FI, respectively. The percentage (%) of variance indicates the variance in the dataset explained by each PC. Cumulative percentage (%) indicates the proportion of variance explained by the PCs up to a certain point. The feature vector is created, and the PCs for the calculation of the indices are displayed in Tables 5–7. The PC with the highest eigenvalue is retained for further analysis. The PCs that are retained are then applied in Equation (1), and the indices for each cross-section are estimated. The calculation of indices is presented in Equations (15) to (17).
PCA Ratio Index—Eigenvalues.
PCA Earnings Index—Eigenvalues.
PCA Financial Index—Eigenvalues.
PCA Ratio Index—Eigenvectors (Loadings).
PCA Earnings Index—Eigenvectors (Loadings).
PCA Financial Index—Eigenvectors (Loadings).
The estimated values of the indices are employed in the panel ARDL-ECM for analysing the impact these indices have on firm value.
Correlation Matrix of Indices
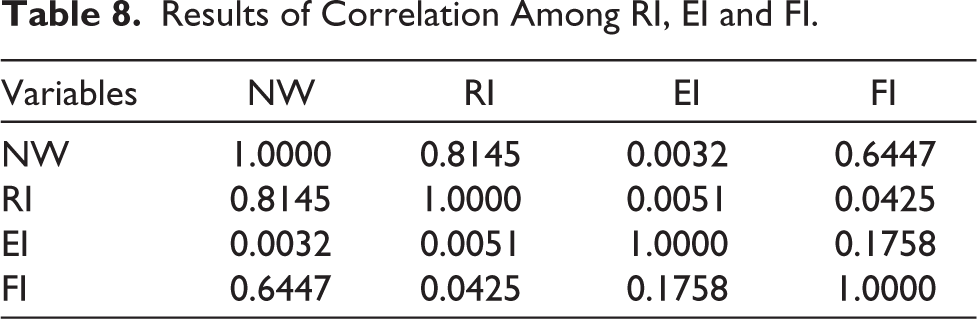
The results of the correlation analysis presented in Table 8 indicate a positive relationship between the variables under study. The correlation between NW and RI is 0.8145, indicating that an increase in RI increases NW. Similarly, the correlation between NW and FI is 0.6447, revealing a positive and significant relationship among the variables. The correlation between NW and EI is positive but is relatively low in comparison to the other variables. In summary, the correlation among the variables exhibits a positive linear relationship.
Results of Correlation Among RI, EI and FI.
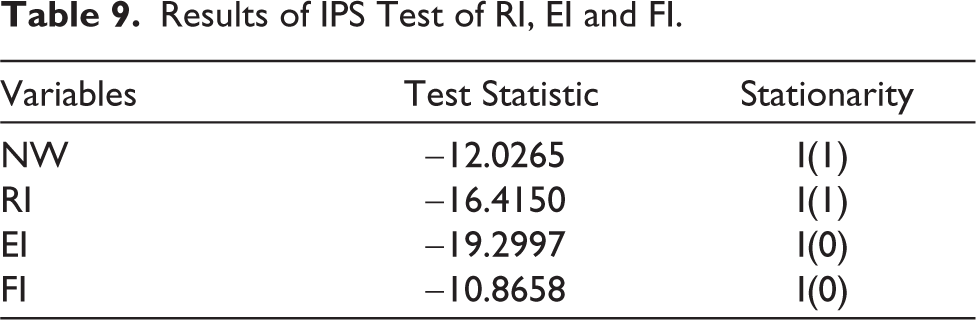
Im–Pesaran–Shin (IPS) Unit root test
In order to determine whether the estimated indices are stationary or otherwise, the IPS unit root test is employed. The result displayed in Table 9 identifies that the dependent variable NW and the regressor RI are stationary at first difference I(1), while EI and FI are stationary at level. Therefore, as the variables are integrated at I(0) and I(1), the panel ARDL-ECM model could be executed.
Results of IPS Test of RI, EI and FI.
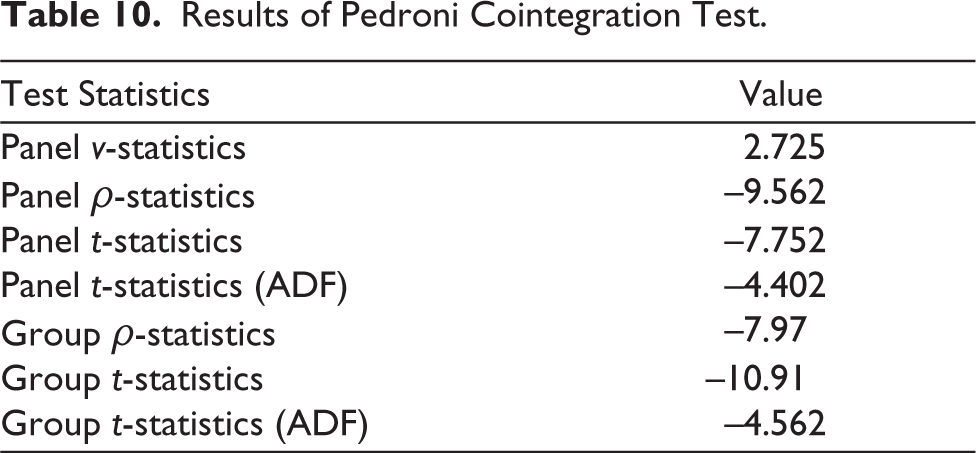
Pedroni Cointegration Test
After investigating the unit root of the variables, the Pedroni cointegration test is executed. The cointegration test studies the presence of long-term relationship among the variables, and the presence of cointegration among the variables is validated by a significant positive panel-v statistic followed by significant negative values for other statistics (Shahbaz et al., 2021). The results of the Pedroni (1999) cointegration analysis are presented in Table 10. From the results, it is established that the variables under study are cointegrated, therefore, exhibiting a long-term relationship between NW, RI, EI and FI.
Results of Pedroni Cointegration Test.
Panel ARDL-ECM (PMG and MG)
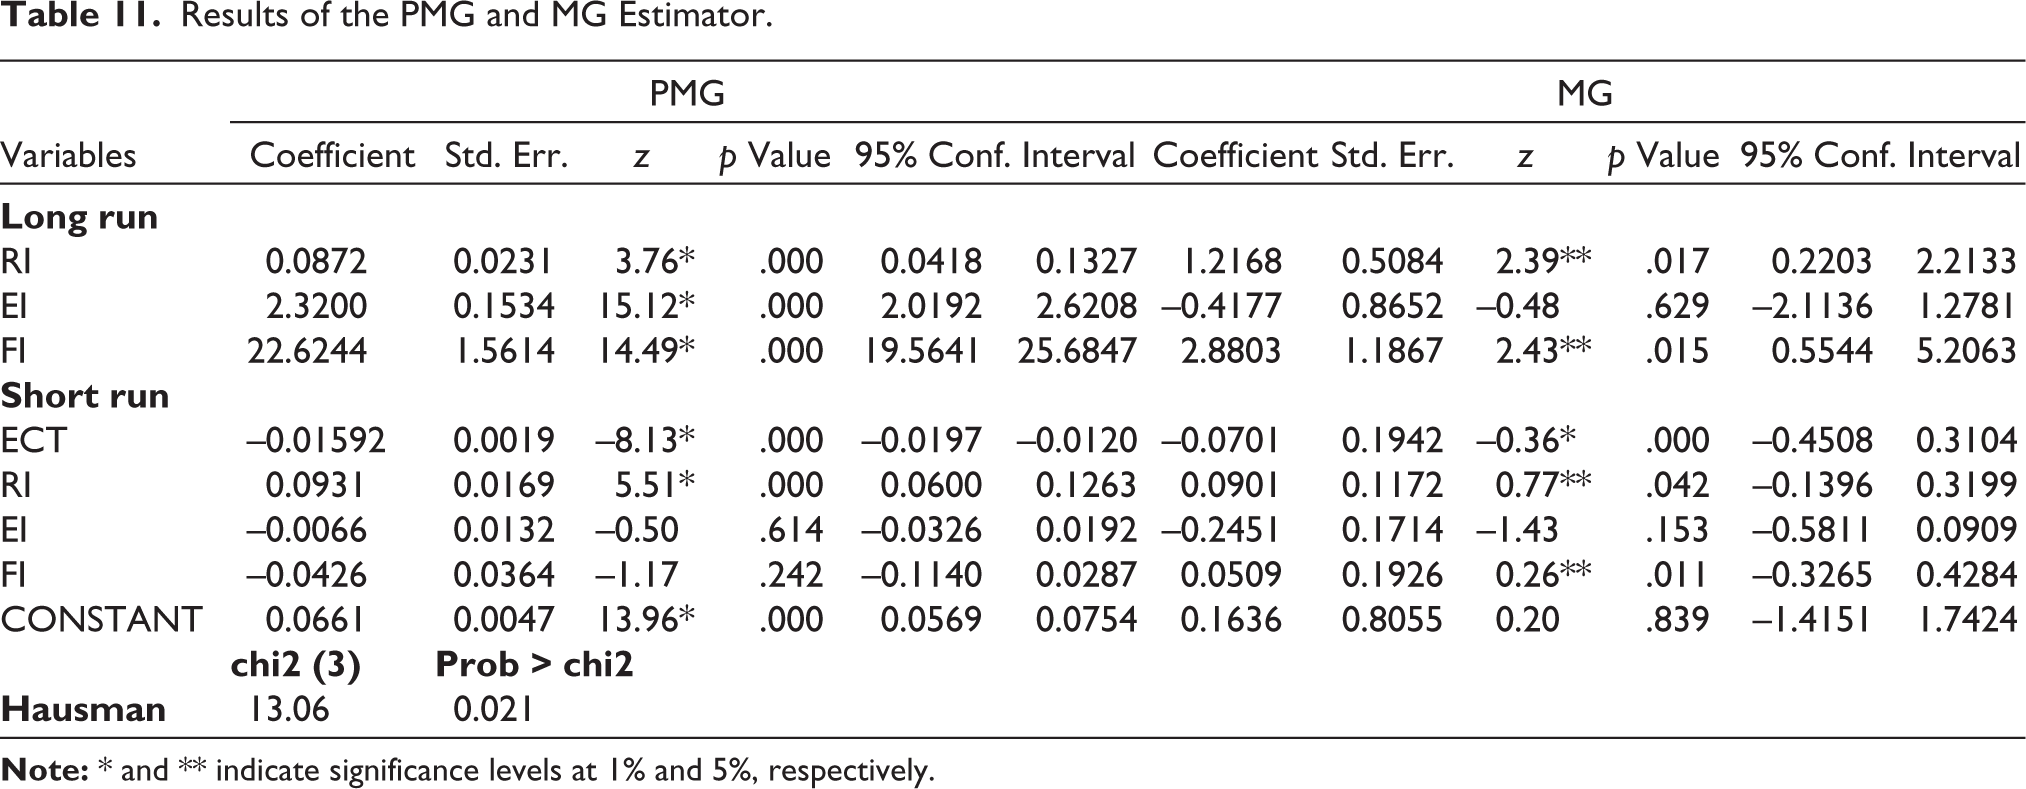
Table 11 presents the results of the PMG and MG estimators. According to Pesaran et al. (1999), the coefficients of the PMG estimator are consistent throughout the long run, while the short-run coefficients and error variance differ for every cross-section. Whereas in MG, proposed by Pesaran and Smith (1995), the coefficients differ for every cross-section both in the long and short run (Humpe & McMillan, 2020). Table 11 shows the long- and short-run coefficients of RI, EI and FI, and the speed of adjustment, that is, ECT, for both the estimators. The long-run coefficients of PMG show that RI, EI and FI have a positive and significant impact on the firm value at a significant level of 1%, while in the short run, the negative coefficients of EI and FI imply a negative influence and insignificance. From the results it is inferred that a 1% increase in RI, EI and FI increases the firm value by 0.08%, 2.32% and 22.62%, respectively, in the long run, whereas a 1% increase in RI increases firm value by 0.09% in the short run. The coefficients of MG indicate a positive and significant influence of RI and FI over firm value at a significance level of 5% in both the long and short run. Therefore, it is inferred that a 1% increase in RI and FI leads to an increase in firm value by 1.21% and 2.88%, respectively, in the long run. While in the short run it is identified that the firm value increases by 0.09% and 0.05% with a 1% increase in RI and FI. The ECT is negative and statistically significant at the 1% level in both the estimators, indicating a higher speed of adjustment of disequilibrium in the long run. To examine the efficiency of MG and PMG estimators, the Hausman test is employed (Behera & Mishra, 2020). The Hausman test results reveal that the PMG estimator is more efficient than the MG estimator at the 5% significance level. Therefore, it is evident from the analysis that RI, EI and FI have a positive and significant impact on the firm value.
Results of the PMG and MG Estimator.
Conclusion
Firm value is a critical concept in business, as it represents the economic value of the firm and its potential for future growth. It is a reliable metric used by investors to identify the firms’ performance and is influenced by various internal and external factors. It is important to analyse the influencing factors of firm value since it is a crucial measure considered by investors. Earlier studies have identified various factors that have both positive and negative impacts on firm value. But studies influencing firm value conducted with special focus on women-owned firms are seldom cited. Thus, this study aims to analyse the factors that influence firm value in women-owned firms by bridging the existing gap. The panel ARDL-ECM model is employed in this study to identify the influence of the selected variables on firm value. The selected variables are transformed into indices, namely, RI, EI and FI, using PCA for further analysis. From the results, it is evident that the three indices exert a positive influence on firm value in women-owned firms. The practical implications of the study are multifaceted, and it could be used for strategic planning and decision-making, leading to an increase in firm performance. Investors can modify their portfolio in such a way that they mitigate the risk of investing in firms with a low firm value. Lack of data sources and unavailability of data were major hindrances in carrying out this study. Further studies in this field can be executed by considering various other factors that impact firm value using other methodologies.
Footnotes
Declaration of Conflicting Interests
The authors declared no potential conflicts of interest with respect to the research, authorship and/or publication of this article.
Funding
The authors received no financial support for the research, authorship and/or publication of this article.
Nomenclature
ARDL—Autoregressive distributed lag
ECM—Error correction model
ECT—Error correction term
PCA—Principal component analysis
PC—Principal components
IT—Information technology
CSR—Corporate social responsibility
PLS—Partial least squares
NW—Net worth
DER—Debt–equity ratio
CR—Current ratio
QR—Quick ratio
CCL—Cash-to-current liabilities
TC—Total capital
NPM—Net profit margin
RNW—Return on net worth
ROA—Return on assets
ROC—Return on capital
PBITDA—Profit before interest, taxes, depreciation and amortization
CMIE—Centre for Monitoring Indian Economy
TL—Total liabilities
TA—Total assets
TE—Total expenses
TI—Total income
RI—Ratio index
EI—Earning index
FI—Financial index
EBIT—Earnings before interest and tax
CEO—Chief Executive Officer
ESG—Environmental social governance
2SLS—2-Step least squares
OLS—Ordinary least squares
ERM—Enterprise resource management
GLM—Generalized linear model
PMG—Pooled mean group
MG—Mean group
ADF—Augmented Dickey–Fuller
IPS—Im–Pesaran–Shin
IFRS—International Financial Reporting Standards