
Abstract
Predicting trends in the financial markets remains a demanding yet crucial responsibility undertaken by market participants and financial professionals. This research quantitatively evaluates how effectively machine learning algorithms anticipate outcomes in stock price forecasting for five major Indian companies: Reliance Power, Hindustan Unilever, State Bank of India, Tata Motors, and Nestle. By integrating traditional statistical techniques, including simple moving average (SMA) and exponential moving average (EMA), with supervised learning algorithms such as logistic regression, k-nearest neighbors (KNN), and linear discriminant analysis (LDA), this study provides a comparative analysis of model effectiveness. The empirical findings reveal that classification-based models exhibit varying degrees of predictive efficacy. LDA correctly classified 65% of original grouped cases, surpassing the minimum required accuracy of 63.37%. KNN achieved a higher accuracy of 75%, outperforming LDA. Logistic regression demonstrated an improvement from the intercept model’s 55.9% accuracy to 57.1% in Block 1 model, indicating that incorporating meaningful variables enhances prediction reliability. Additionally, EMA proved to be more responsive to price volatility, effectively capturing short-term fluctuations compared to SMA. The results provide meaningful understanding into the strengths (Sayan Hazra, 2023, 10 April, Implementation and performance evaluation of standard multi-class classification algorithms using mnist data set, Medium,
Keywords
Introduction
Understanding stock price movements is crucial for investors, financial analysts, and policymakers (Bao et al., 2025), as accurate forecasting enhances decision-making in volatile markets. The increasing integration of machine learning (ML) techniques in financial forecasting has reshaped predictive modeling, allowing for more efficient, data-driven investment strategies (Pham Hoang Vuong et al., 2024). However, despite significant advancements in ML-based stock prediction, gaps remain in evaluating the comparative performance of traditional statistical methods and modern ML algorithms across diverse market conditions (Sonkavde et al., 2023). Most existing studies have focused on developed markets such as the United States and Europe, where financial systems are well established and market behaviors are relatively stable. However, emerging markets like India exhibit unique characteristics, including high volatility, regulatory changes, and evolving investor sentiment, making stock price forecasting particularly challenging.
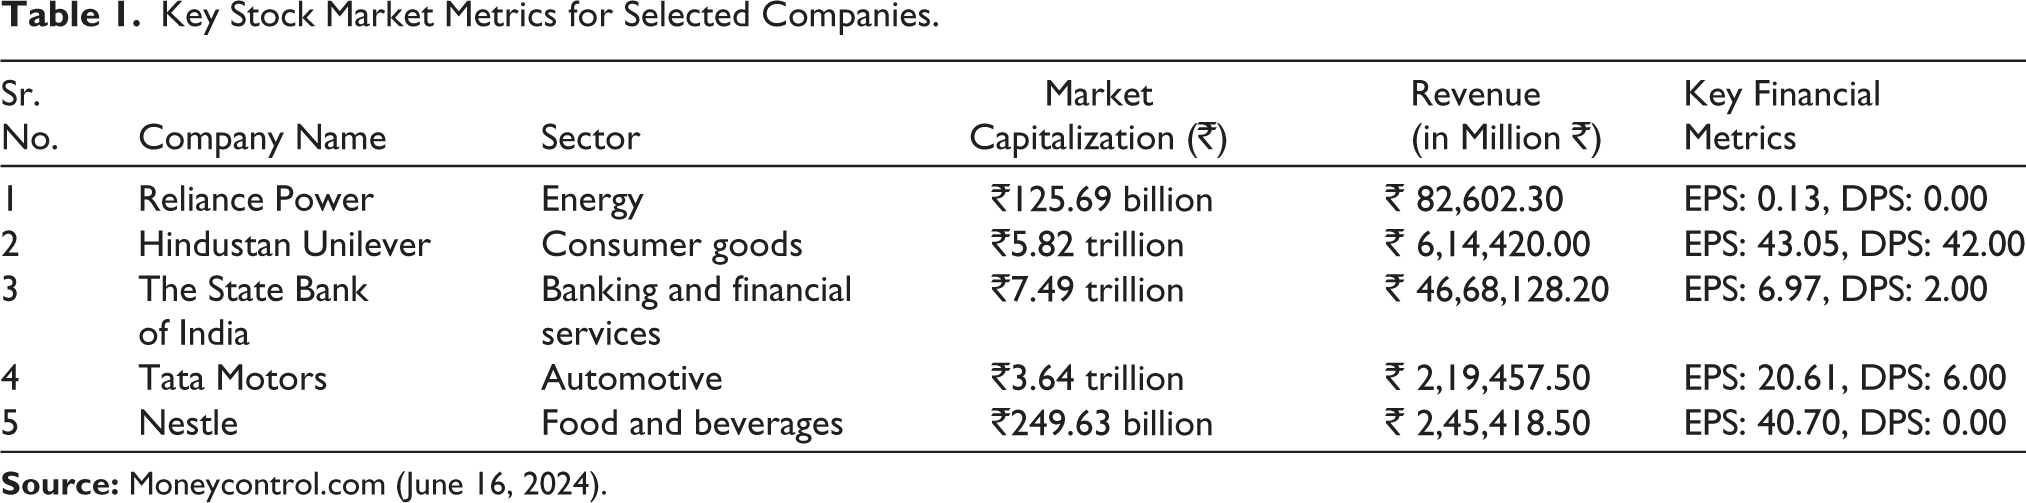
Key Stock Market Metrics for Selected Companies.
Prior research has often overlooked these complexities, leading to a gap in understanding how different ML models perform in such environments (An et al., 2024). This study addresses this gap by systematically evaluating the effectiveness of various forecasting techniques—ranging from moving averages and exponential smoothing to advanced ML models such as logistic regression, k-nearest neighbors (KNN), and linear discriminant analysis (LDA)—in the Indian stock market. Furthermore, the implications of this research extend beyond India. Emerging markets worldwide share similar characteristics, such as fluctuating economic policies, evolving corporate governance, and rapid technological advancements. By analyzing five major Indian companies spanning diverse industries, this study provides insights that can be leveraged in other lower-middle income countries, offering a global perspective on ML-driven stock price forecasting. By incorporating literature and market data, this research aims to bridge the gap between traditional financial models and cutting-edge ML techniques, ultimately enhancing the accuracy and reliability of stock price predictions.
The findings of this study are relevant not only for institutional investors, portfolio managers, and financial analysts but also for policymakers seeking to understand how ML- and AI-driven forecasting tools can improve market efficiency. As financial markets continue to embrace digital transformation, the ability to accurately predict stock price movements using ML models will become increasingly vital (Lumoring et al., 2023). Additionally, this research provides a foundation for future studies that can explore deep learning approaches, hybrid models, and alternative data sources, such as sentiment analysis and social media trends, to further refine stock prediction accuracy for India.
Overview of the Indian Stock Market and Companies
The stock market plays a key role in the economic and social organization of a country (Kumar et al., 2020). Stock market forecasting is a highly demanding and challenging task for investors, professional analysts, and researchers in the financial market due to the highly noisy, nonparametric, volatile, complex, nonlinear, dynamic, and chaotic nature of stock price time series (Sehrawat & Mittal, 2024). Prediction of the stock market is a crucial task and a prominent research area in the financial domain as investing in the stock market involves higher risk (Jothimani & Yadav, 2019). However, with the development of computational intelligence methods, it is possible to reduce most of the risks. The Indian stock market is one of the world’s largest and most varied, including a wide range of sectors and businesses (Sehrawat & Mittal, 2024). It provides a rich environment for investment and stock price analysis due to its unique combination of traditional and modern economic activity. India’s large population and thriving economy make it a growth engine. On January 22, 2024, its stock market capitalization topped that of Hong Kong for the first time (Singh, 2019). According to Bloomberg data, the value of shares listed on Indian markets has hit $4.33 trillion, compared to $4.29 trillion in Hong Kong. The Indian stock market sees the majority of trading activity occurring on its two stock exchanges: the Bombay Stock Exchange (BSE) and the National Stock Exchange (NSE). Established in 1875, the BSE is one of the key exchanges. The NSE, founded in 1992, commenced trading in 1994. Both exchanges adhere to identical trading mechanisms, trading hours, and settlement processes. For the purpose of this research, five prominent Indian companies have been selected as they represent a cross section of critical sectors in the economy (Table 1):
Reliance Power ( Hindustan Unilever ( SBI (onlinesbi.sbi): A wide range of banking and financial services are provided by the State Bank of India, which is the biggest public sector bank in India. Due to its extensive branch network and significant role in the financial system, it serves as an important gauge of the banking sector and overall economic stability. Tata Motors ( Nestle (
Objectives
Assessing the performance of various stock price forecasting models in developing investment strategies for selected Indian companies is the primary objective of this study. By utilizing a mix of traditional methods such as moving averages and exponential smoothening, along with advanced predictive techniques such as logistic regression, KNN, and LDA, the research aims to achieve several objectives. It will evaluate the accuracy and reliability of different forecasting models, compare their performance across various sectors, and create actionable investment strategies. Ultimately, the study intends to provide valuable insights into the practical applications of these models for investors in the Indian stock market, thereby improving their decision-making processes and investment outcomes. The study aims to achieve the following key contributions as compared to existing work:
Comparative analysis to test the accuracy of ML models for Indian companies: While previous studies have examined stock price forecasting using ML, limited research systematically evaluates multiple models on Indian market data. This study provides a direct performance comparison of different forecasting techniques in an emerging market context. Application to the Indian stock market: Most existing research focuses on developed markets such as the United States and Europe, whereas this study fills a gap by analyzing the predictive performance of ML models on Indian stock data, which is characterized by higher volatility and unique economic conditions. Integration of statistical and ML approaches: Unlike traditional forecasting models that rely solely on time-series analysis, this study integrates statistical smoothing techniques with classification-based ML models, offering a more holistic evaluation of predictive performance. Practical insights for investors and analysts: By providing empirical evidence on the effectiveness of different models, this research aids investors, portfolio managers, and financial analysts in selecting the most reliable forecasting techniques for decision-making in volatile market conditions. Data description and sources: The data set used in this study has been sourced from Yahoo Finance, a widely recognized platform for financial market data. The data consist of daily stock price records for a period of 2 years, spanning from January 3, 2022, to December 29, 2023. The data set is historical and numeric in nature and includes key market indicators such as open price, high price, low price, close price, adjusted close price, and trading volume. By utilizing high-frequency daily stock price data, this research ensures a comprehensive analysis of market fluctuations and trends.
Scope
This research article offers a detailed examination of stock price prediction models for five prominent Indian companies, each representing major sectors of the economy. The article evaluates the accuracy and reliability of these models in forecasting stock prices using techniques such as moving averages, logistic regression, KNN, and LDA to create a strong framework for precise stock price prediction.
Literature Review
In this section we have provided the readers with a compelling literature survey that delves into the relevance of stock price forecasting in financial markets. The financial services industry plays a crucial role in fostering the growth and expansion of the economy (Anmol & Singh, 2024). The financial sector is a pivotal part of the economy that consists of different companies, institutions, and organizations that provide financial services not only to domestic but also to international customers. This sector encompasses a wide range of businesses ranging from investment organizations and insurance firms to real estate institutions. Within this dynamic and complex financial market, individuals can trade currencies, stocks, and derivatives (futures, forwards, options, and swaps) over virtual platforms, as highlighted by Patel et al. (2018). A crucial role in the economy is played by the stock market, which offers stockholders the opportunity to own shares of public companies and potentially earn substantial profits and return on investments. According to Patel et al., it is a chance for investors to grow their wealth and achieve financial prosperity, even with small initial investments also known as micro-investments. Traditional forecasting methods, such as ARIMA and GARCH, have been widely applied to financial time-series data, with studies highlighting their ability to model short-term price movements effectively (Mallick et al., 2020).
Khan et al. (2020) demonstrated that ML algorithms can predict stock markets using social media and financial news, as these influence investor behavior. Their study analyzed 10-day forecasts, enhancing accuracy through feature selection and spam tweet reduction. The findings highlight the impact of alternative data sources on improving stock market prediction. Nti et al. (2020) conducted a comparative analysis of ensemble techniques such as boosting, bagging, blending, and stacking for stock market prediction (Pham Hoang Vuong et al., 2024). Using decision trees, support vector machines (SVM), and neural networks, they built 25 ensemble models and evaluated them on stock data from GSE, JSE, BSE-SENSEX, and NYSE (2012–2018). The results showed that stacking (90%–100%) and blending (85.7%–100%) outperformed bagging (53%–97.78%) and boosting (52.7%–96.32%) in prediction accuracy.
With the growth of the Indian economy and various reforms regarding the securities markets, stocks have become an intrinsic part of India’s economic development, and speculation of these has become an area of concern for the people. The art of stock price prediction is a crucial matter that captures the attention of both academics and industry professionals alike (Derakhshan & Beigy, 2019). The ability to forecast stock price movements is a highly impactful area of interest for researchers and industry experts, presenting both a challenging endeavor and the potential for significant financial gains. ML-based approaches, such as SVM and Random Forest, have demonstrated improved predictive accuracy by capturing complex patterns in historical stock data (Patel et al., 2015). Nayak et al. (2016) developed supervised ML models for predicting stock trends in India, with separate daily and monthly forecasts. The daily model combined historical prices with sentiment analysis, achieving up to 70% accuracy and demonstrating the value of integrating market data with sentiment insights.
In the context of the Indian stock market, the study conducted by Maheswari and Jaya (2021) explored deep learning-based models, concluding that LSTMs and hybrid neural networks achieve good accuracy. Additionally, sentiment analysis techniques integrated with ML models have further enhanced forecasting accuracy by incorporating market sentiment indicators (Darapaneni et al., 2022). The Indian stock market is a dynamic arena where stocks are bought, sold, and traded. It serves as a crucial platform for large corporations to secure funding from shareholders.
On the one hand, a significant inflow or influx of capital into the market is brought about by the issuance of stocks, bolstering the organic structure of corporate capital through the promotion of capital concentration, as stated by Jin et al. (2019). However, predicting stock prices is widely acknowledged as a challenging and intricate task due to the inherent noise and volatility of stocks. The process of predicting stock prices is highly complex, as it involves a combination of various factors and the unique behaviors of individual elements. These factors include political, economic, and market dynamics; technological advancements; and investor behavior, all of which contribute to fluctuations in stock prices (Jin et al., 2019).
In today’s dynamic and volatile stock markets, the sentiments of investors always play a crucial role in determining the future value (FV) also of a stock. Conducting a precise and efficient sentiment analysis of stockholder views is critical, as it directly influences the next movements of stocks (Derakhshan & Beigy, 2019). According to Hegazy et al. (2014), when the future price of a stock is predicted with a great deal of precision, it leads to substantial wins for stockholders. The financial sector has seen a surge in applications such as prediction of stock prices from various industries, detection of fraud and malicious activities, risk analysis, and web as well as data analytics. With a vast amount of data being generated such as client data, logs of financial products, and operational data, integrating this with external data sources such as social media and website data can greatly enhance the decision-making process (Pejić Bach et al., 2019). This Big Data can serve as a valuable real-time resource due to its high frequency and low acquisition cost (Sohangir et al., 2018).
The enigma of the future has always presented an exhilarating challenge to unravel. Throughout history, humanity’s insatiable curiosity has been fixated on what lies ahead. Forecasting involves the art of foreseeing what likely will unfold in the near future by analyzing the activities that have occurred in the past and current events. In recent times, the surge of social media and other innovative technologies has sparked a fervent fascination with stock market forecasting among the public and businesses alike. The advancement in the financial sector plays a crucial role in driving the growth and stability of the overall economy (González-Rivera & Lee, 2009). Within the business domain, forecasting is often viewed as a challenging task due to the complexities of the market (Pai & Lin, 2005). However, it holds significant importance as it provides valuable insights for resource allocation and planning for anticipated costs in the future (Wang et al., 2012).
Investors are constantly seeking to monitor real-time risks to maximize their return on investments. Forecasting not only helps in mitigating risks but also ensures a secure trade of securities between buyers and sellers (Wei, 2013). There are numerous advantages to having an effective financial forecast, such as: (a) controlling the financial feasibility of a new business project, allowing for the design of models to predict the economic performance based on different approaches, procedures, and tactics; (b) facilitating comparison between actual financial operations and the forecasted financial plan, enabling necessary modifications; (c) guiding the business in the right direction and managing the cash flow accurately; (d) providing a benchmark against which future performance can be monitored; and (e) identifying potential threats and cash deficits to safeguard the business from financial disaster as well as forecasting future cash needs and determining if additional borrowing is necessary.
Financial Prediction System.
Lately, the art of predicting the trends that exist in the stock market have gained immense significance among business professionals. A critical role in forecasting stock prices is played by sentiment analysis. This is done by delving into historical stock data and online information. This tool not only aids in predicting future stock prices but also serves as a valuable component of recommendation systems, guiding optimal buying and selling times (Pal et al., 2018). By employing sentiment analysis on financial news, the system can effectively anticipate stock movements. This method automatically extracts perspectives, attitudes, and emotions from opinionated content, making it an indispensable asset in the world of stock market prediction. Agrawal et al. (2024) evaluated the predictive accuracy of sentiment analysis in the stock market by integrating sentiment and technical analysis. Unlike prior studies focused solely on social media sentiment, their enhanced model combined both approaches for improved precision. Using tweets from 20 major companies, they developed and tested predictive models for stock prices and trends.
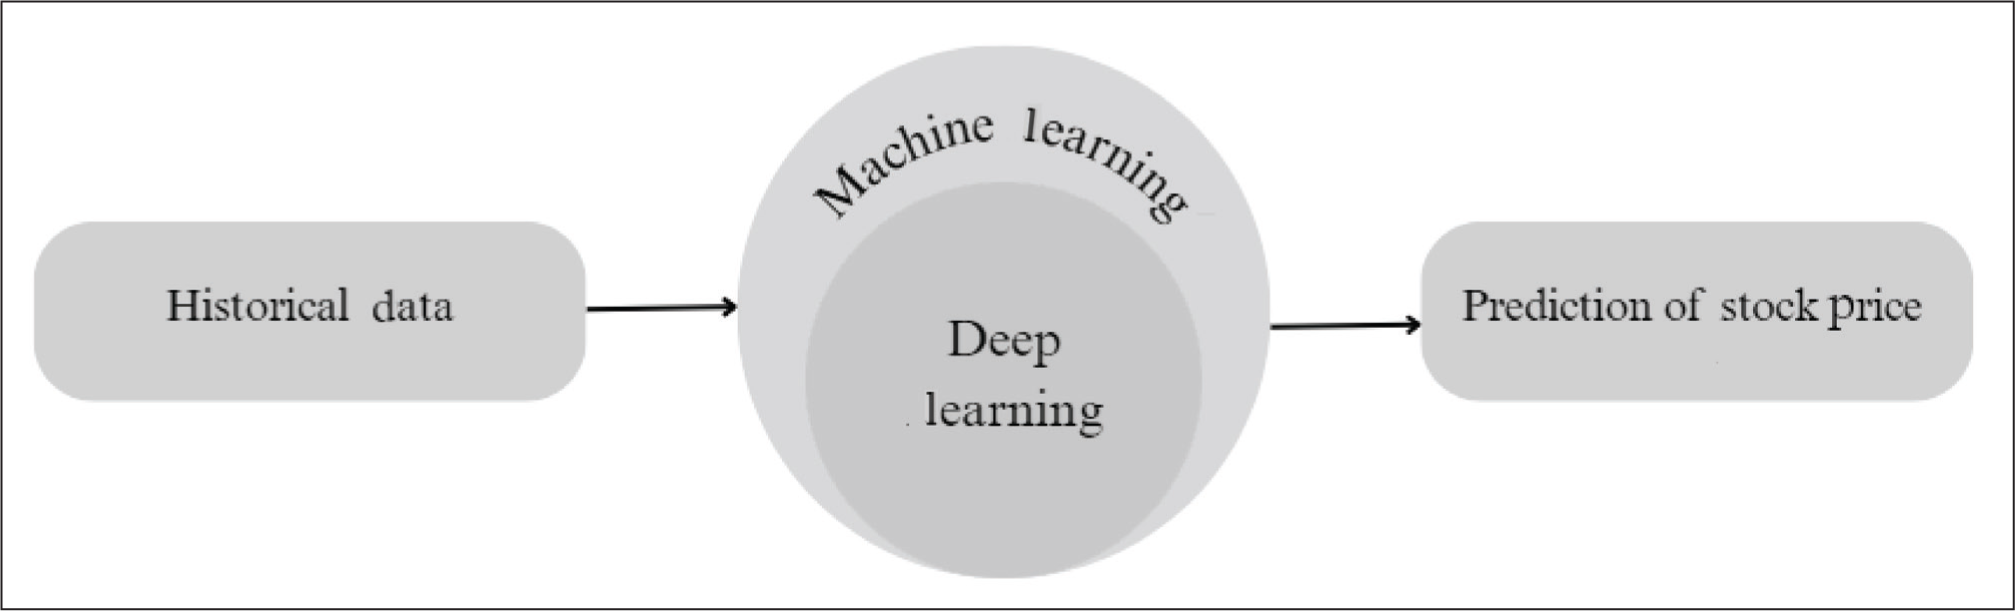
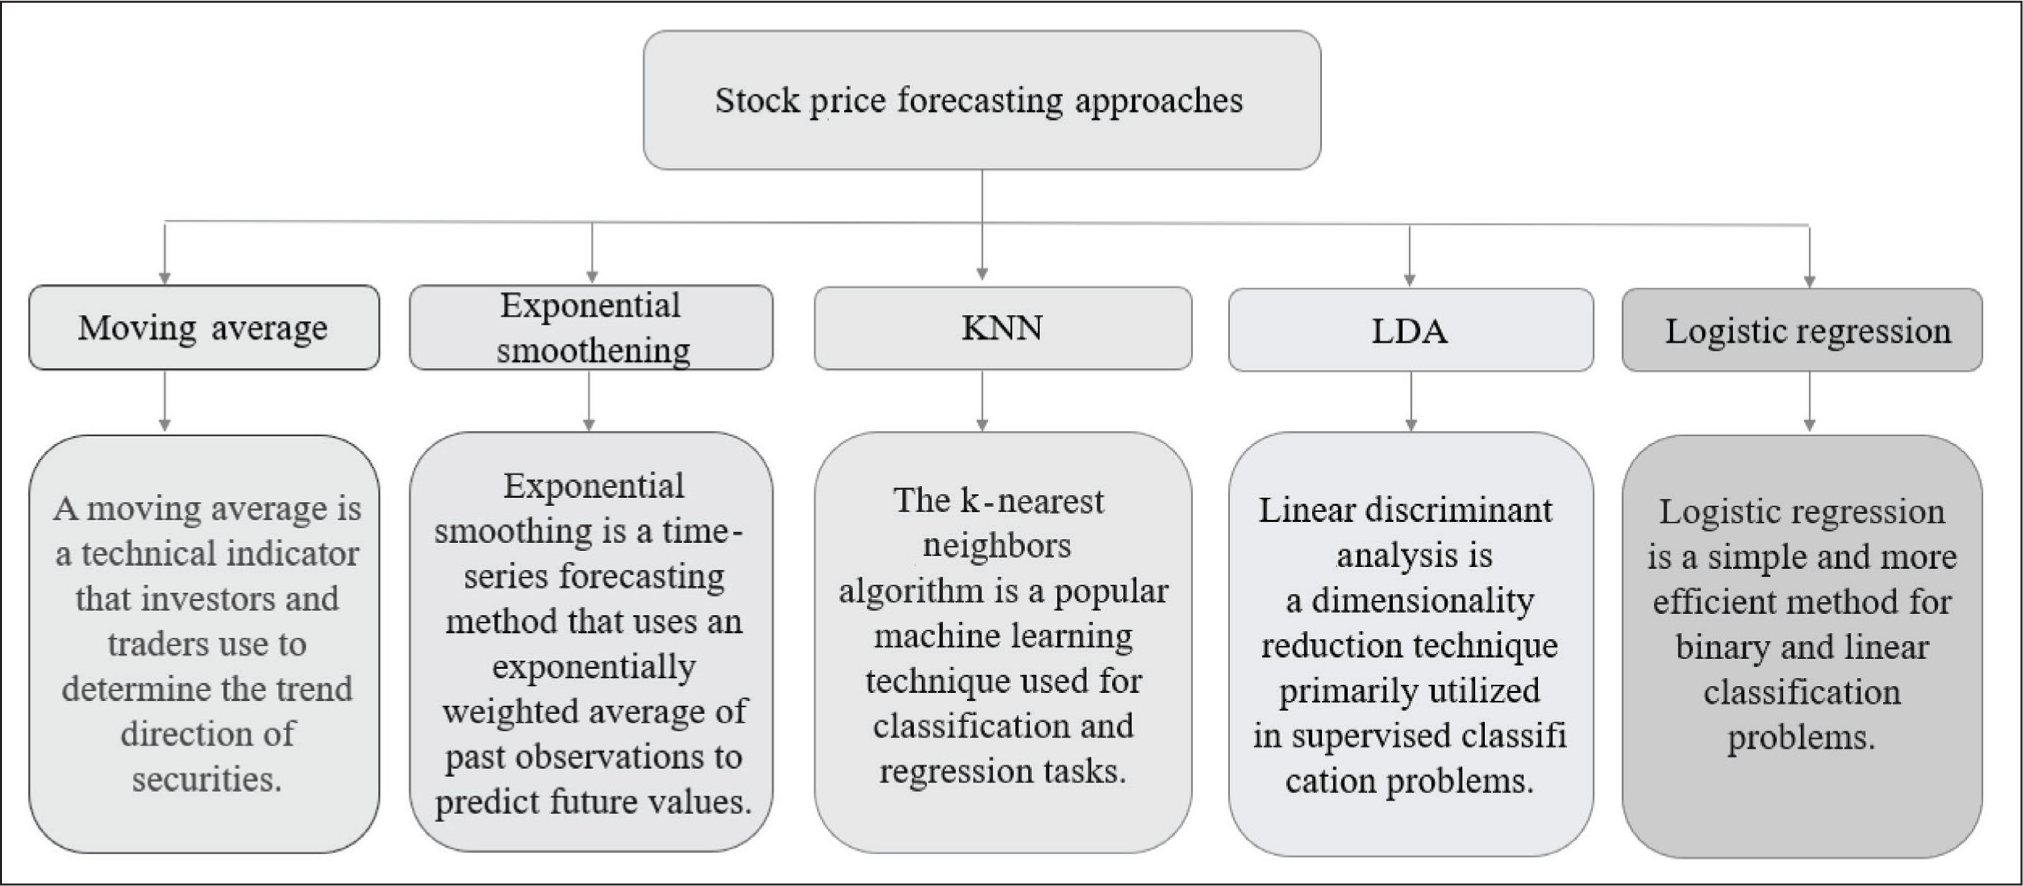
The unpredictable nature of stock time series makes prediction of stock prices a complex task. However, with the recent developments in the field of ML and deep learning (DL) techniques, there are now powerful tools available for the prediction of stock prices (Figure 1). These include various ML algorithms such as logistic regression, random forest, linear regression, support vector regression (SVR), KNN, and decision trees (Randhawa et al., 2018). ML-driven predictive models, when properly integrated and rigorously tested, offer significant advantages in stock price forecasting, particularly for institutional and algorithmic trading applications (Jabr, 2024). These techniques have the potential to revolutionize the way we approach stock price prediction.
Methodology
Forecasting Analysis
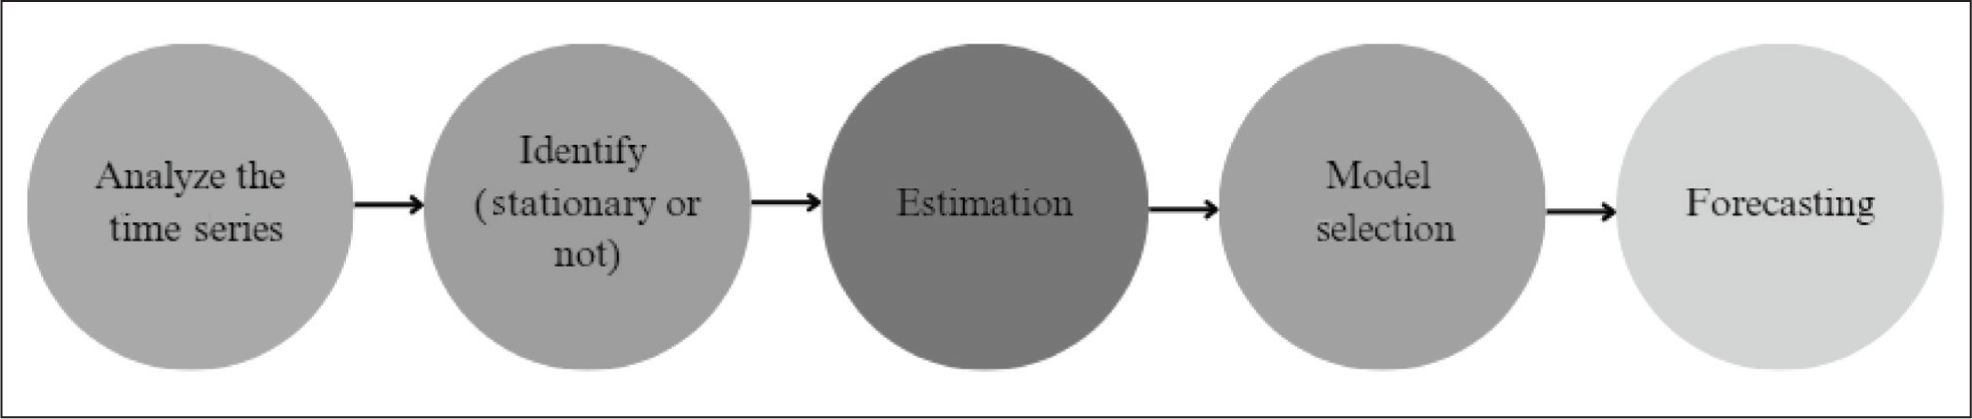
Forecasting analysis is used as a tool for the prediction of future events or trends through historical data and statistical techniques. It is applied in the finance and investment field for projecting future stock prices, behaviors of the market, and economic indicators. The ultimate goal is to gain insights that would lead to forming investment decisions and would be highly placed on risk management and strategic planning (Figure 2). The software used is SPSS, and we have selected Reliance Power, Hindustan Unilever, State Bank of India, Tata Motors, and Nestle as they represent key sectors of the Indian economy—energy, consumer goods, banking, automotive, and FMCG–—ensuring a diverse analysis of stock price forecasting across different industries.
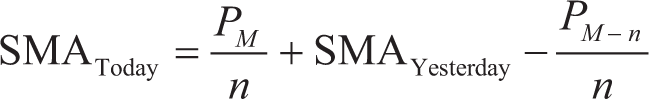
SMA: It is a statistical method that calculates the mean average (Zope, 2023) of the most recent n data points in a time series, as postulated by Hansun (2013). According to Hansun, each data point in the time series is given equal weight, and no weighting factors are applied to any of the data points. An SMA is an arithmetic moving average calculated by adding recent prices and then dividing that figure by the number of time periods in the calculation average (Hayes, 2019).
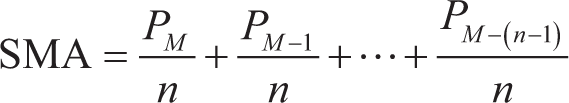
In the above formula for SMA, PM refers to the value of the data point at time M and n is representative of the number of data points used in the computation. When successive values are calculated, a new value is introduced into the formula that will displace the oldest data.
Framework for Forecasting.
EMA: It is a type of moving average that places a greater weight and significance on the most recent data points (Chen, 2019). In EMA, each value in the data series is given a weighting factor based on its age (Zope, 2023). Similar to the WMA method, EMA gives the most recent data the highest weight, with older data points receiving progressively smaller weights. However, unlike the WMA method, the weighting in EMA decreases exponentially for older data points, never reaching zero. EMA is commonly used for smoothing and short-term forecasting, typically for one period into the future. The smoothing coefficient, denoted as “W,” ranges between 0 and 1.
The exponential smoothing model is given by:
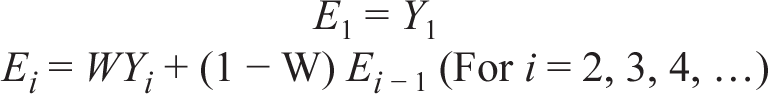
where Ei is the exponentially smoothed value for period I, Ei − 1 is the exponentially smoothed value already computed for the period i – 1, Yi is the observed value in period i, and W is the smoothing coefficient (0 < W < 1).
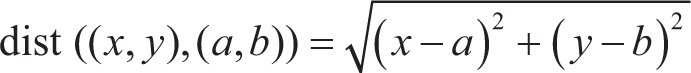
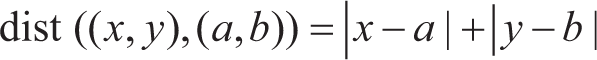
KNN: This algorithm is a simple type of machine learning algorithm in which an object is classified based on majority voting in its nearest neighbors (Rishichavan, 2025). The number of nearest neighbors, also known as k, may be small for simple data and large for big data sets. Various distance measures, including Euclidean, Minkowski, and Manhattan, are also used to seek the nearest points to unknown records.
Logistic regression: It is a supervised ML algorithm used for classification tasks where the goal is to predict the probability that an instance belongs to a given class or not (Hoffman, 2019). The logistic regression model can handle both numerical and categorical types of data (Sandaruwan, 2025). It utilizes one or more features to predict the probability of a binary response variable, as explained by Seng Hansun in 2013. This type of regression is employed when the target variable has categorical values. The working mechanism of logistic regression is described by the following equation:
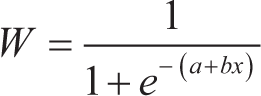
where W is the predicted value for input X, a is the intercept (the value of W when x = 0), b is the regression line slope (it is the rate of change in W with unit change in X), and x is a random variable called a predictor variable.
LDA: It is a classification and dimensionality reduction technique that finds a linear combination of features that best separate two or more classes of objects or events (Xanthopoulos et al., 2012). LDA, also known as normal discriminant analysis, is a supervised classification problem that helps separate two or more classes by converting a higher-dimensional data space into a lower-dimensional space. The dependent variable is divided into more than two categories. Discriminant essentially means a linear combination of discriminators. The general form of discriminant function is:

where D is the discriminant score, bi are discriminant coefficients or weights, and xi are independent variables.
If the dependent variable has more than two categories, then the analysis is termed as multiple discriminant analysis. LDA follows the assumptions of multivariate normality, linearity, and homogeneity of variance. LDA is used for a number of applications such as dimensionality reduction, pattern recognition, etc.
The steps to follow for LDA are as follows:
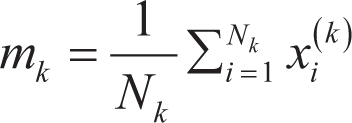
Compute the mean vectors for each class:
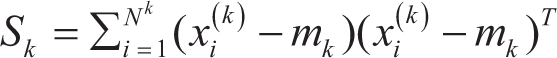
where mk is the mean vector for each class k, Nk is the number of samples in class k, and xi(k) are the samples in class k. Compute the within-class scatter matrix SW (where Sk is the scatter matrix for class k):
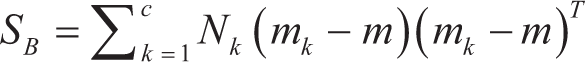
Compute the between-class scatter matrix SB: where m is the overall mean vector of the data set.
Compute the eigenvectors and eigenvalues of the matrix S-1w SB. Select the top eigenvectors to form a new feature space. Transform the original data to the new feature space. Classify the data points using a chosen classifier (often a linear classifier) in the new feature space.

Rationale for Model Selection
The selection of forecasting models in this study is based on their distinct capabilities in capturing stock price movements and patterns. Each model has been chosen to leverage different statistical and ML techniques, ensuring a comprehensive comparative analysis (Figure 3).
SMA and exponential weighted moving average (EWMA): SMA and EWMA are widely used in time-series analysis to smoothen stock price fluctuations and identify trends. SMA provides an equal-weighted average over a fixed period, making it useful for detecting long-term trends. EWMA assigns higher weights to recent prices, making it more responsive to short-term price changes and fluctuations. These methods are applicable for univariate stock price forecasting as they help detect trend persistence and volatility patterns.
The Various Stock Price Forecasting Approaches.
KNN: It is a non-parametric, instance-based learning algorithm that classifies new data points based on their similarity to historical data. In stock price forecasting, KNN is used to find patterns in past stock movements by considering a fixed number of nearest price points, making it effective for short-term predictions. Since stock prices exhibit nonlinear behavior, KNN helps capture complex patterns without assuming a specific functional form.
Logistic regression: While traditionally used for classification problems, logistic regression can be applied in stock price forecasting (Sandaruwan, 2025) by categorizing market trends (e.g., bullish or bearish movements). It helps identify the probability of a stock price increase or decrease, based on historical price trends and indicators.
LDA: It is a dimensionality reduction technique that improves classification tasks, making it useful for forecasting directional movements in stock prices. It is applied to determine whether market trends belong to bullish or bearish categories, assisting in strategic investment decisions.
By combining statistical smoothing techniques (SMA, EWMA), pattern-based ML algorithms (KNN), and classification models (LR, LDA), this study aims to evaluate the predictive power of different methodologies in financial forecasting. Each approach contributes unique insights into market behavior, enabling a holistic analysis of stock price trends.
Results
Technique 1: Linear Discriminant Analysis
There are various tests that are used for measuring the goodness of a discriminant function. Here, in this technique the dependent variable is “Nature of the Market” and has two categories that are bullish and bearish. They are terms that describe the market conditions, trends, and strategies for the investor. A bullish market is a period of rising prices, while a bearish market is a period of falling prices.
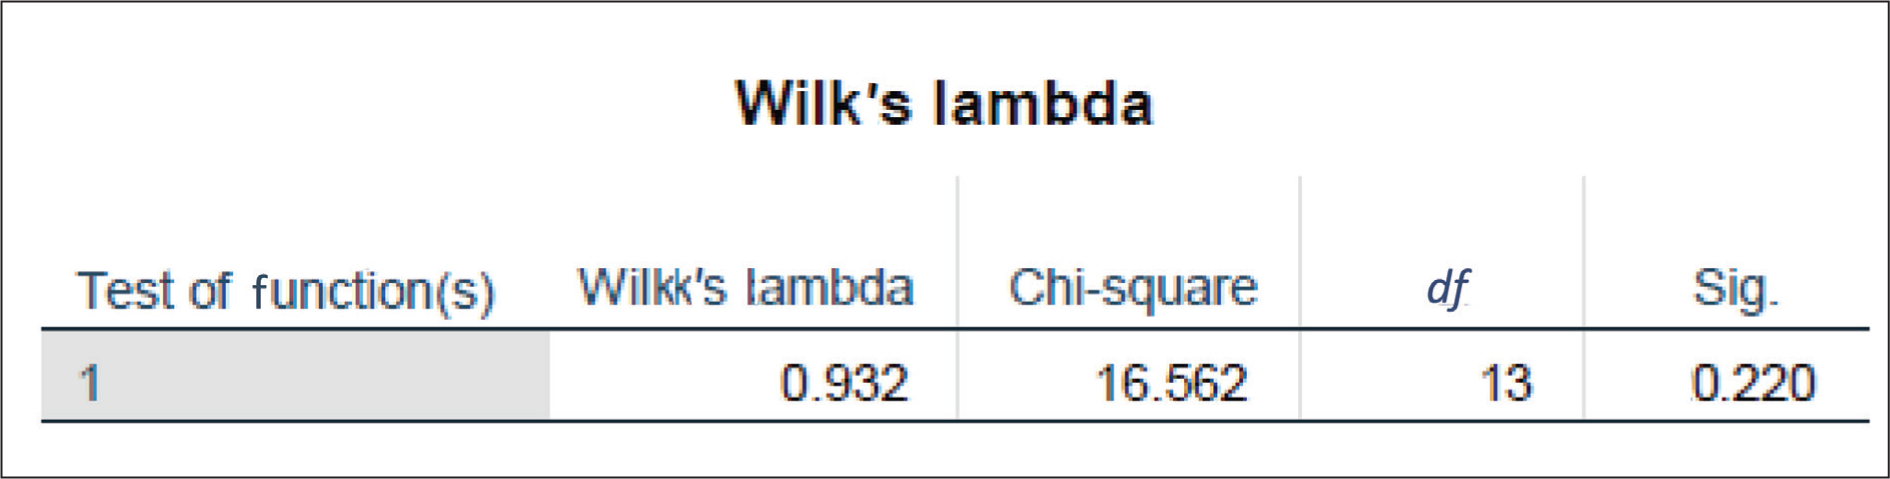
Wilk’s lambda (Δ): A large value of Wilk’s lambda suggests that there is no difference in the group means for the independent variables. The value of Wilk’s lambda lies between 0 and 1.
Interpretation: As it can be seen from Figure 4, the value of Wilk’s lambda is on the higher side, which is 0.932, which states that the overall model has very low discriminating power. Discriminating power is a measure of how well a test can distinguish between two categories of the dependent variable, which in our case is bullish or bearish nature of the market.
Box’s M test: It is a statistical test used in discriminant analysis to assess the equality of covariance matrices across different groups/categories.
H0: The groups/categories are homogeneous for each independent variable.
H1: The groups/categories have at least one group that is not homogeneous.
Here, H0 is null hypothesis and H1 is alternate hypothesis.
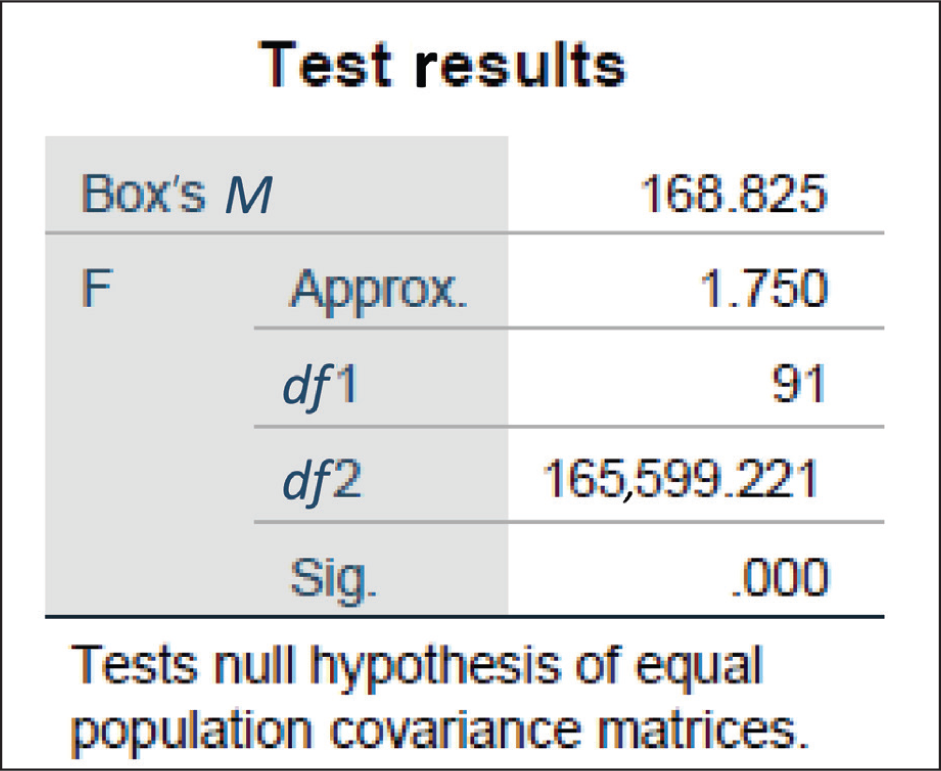
Interpretation: If the p value (sig. value) associated with the test statistic is less than the significance level (standard: .05), then it is expected that one should reject the null hypothesis, indicating evidence against the assumption of homogeneity of covariance matrices (Figure 5). Here, the p value is .00, which indicates that the null hypothesis will be rejected. Therefore, the groups/categories have at least one group/category that is not homogeneous.
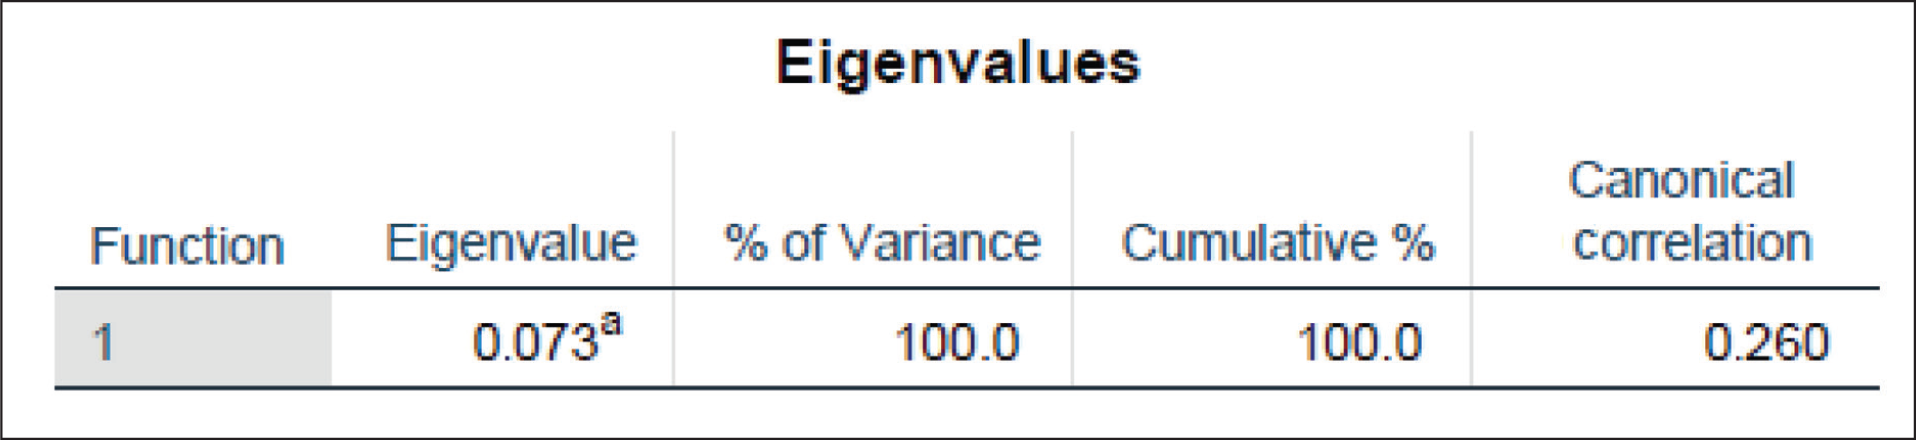
Goodness of fit: To understand the degree to which the variation in the dependent variable can be explained by the model, we use the goodness-of-fit test.
Since the canonical correlation value is 0.260, therefore, 26% of the variation in the dependent variable can be explained by the model (Figure 6).
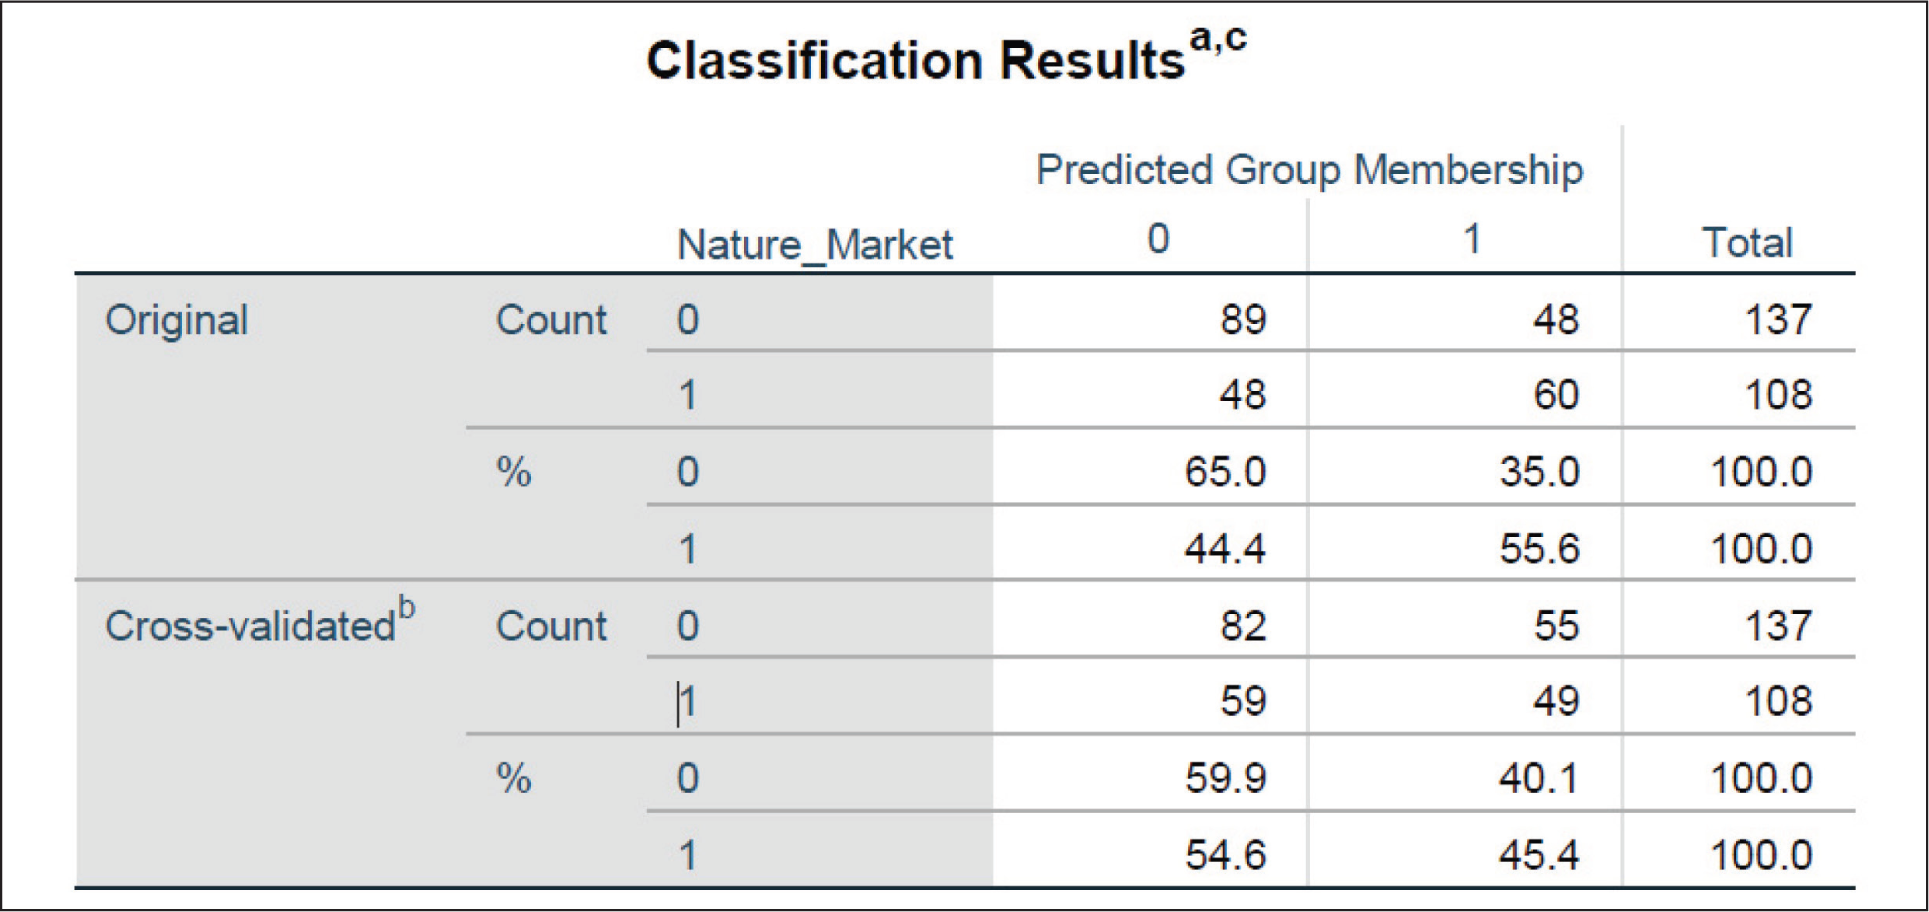
Classification matrix: This matrix can be used for analysis and proves to be a useful tool in identifying whether a model can be used for prediction. The accuracy of the model given by the model is also known as the hit ratio.
Calculation of chance accuracy: p2 + q2
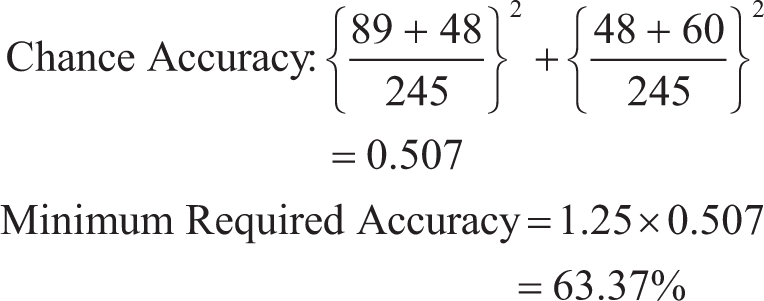
The model correctly classified original grouped cases to 65% and the minimum required accuracy is 63.37%; therefore, the model can be used for prediction (Figure 7).
Technique 2: Logistic Regression
Logistic regression is a supervised ML algorithm used for classification tasks. It is a statistical algorithm that analyzes the relationship between two data factors. It is used when the dependent variable is qualitative or categorical with only two values, which in our case is “Nature of the Market.” The logit function is given by
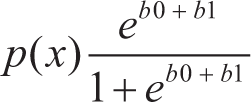
where b0 is the intercept.
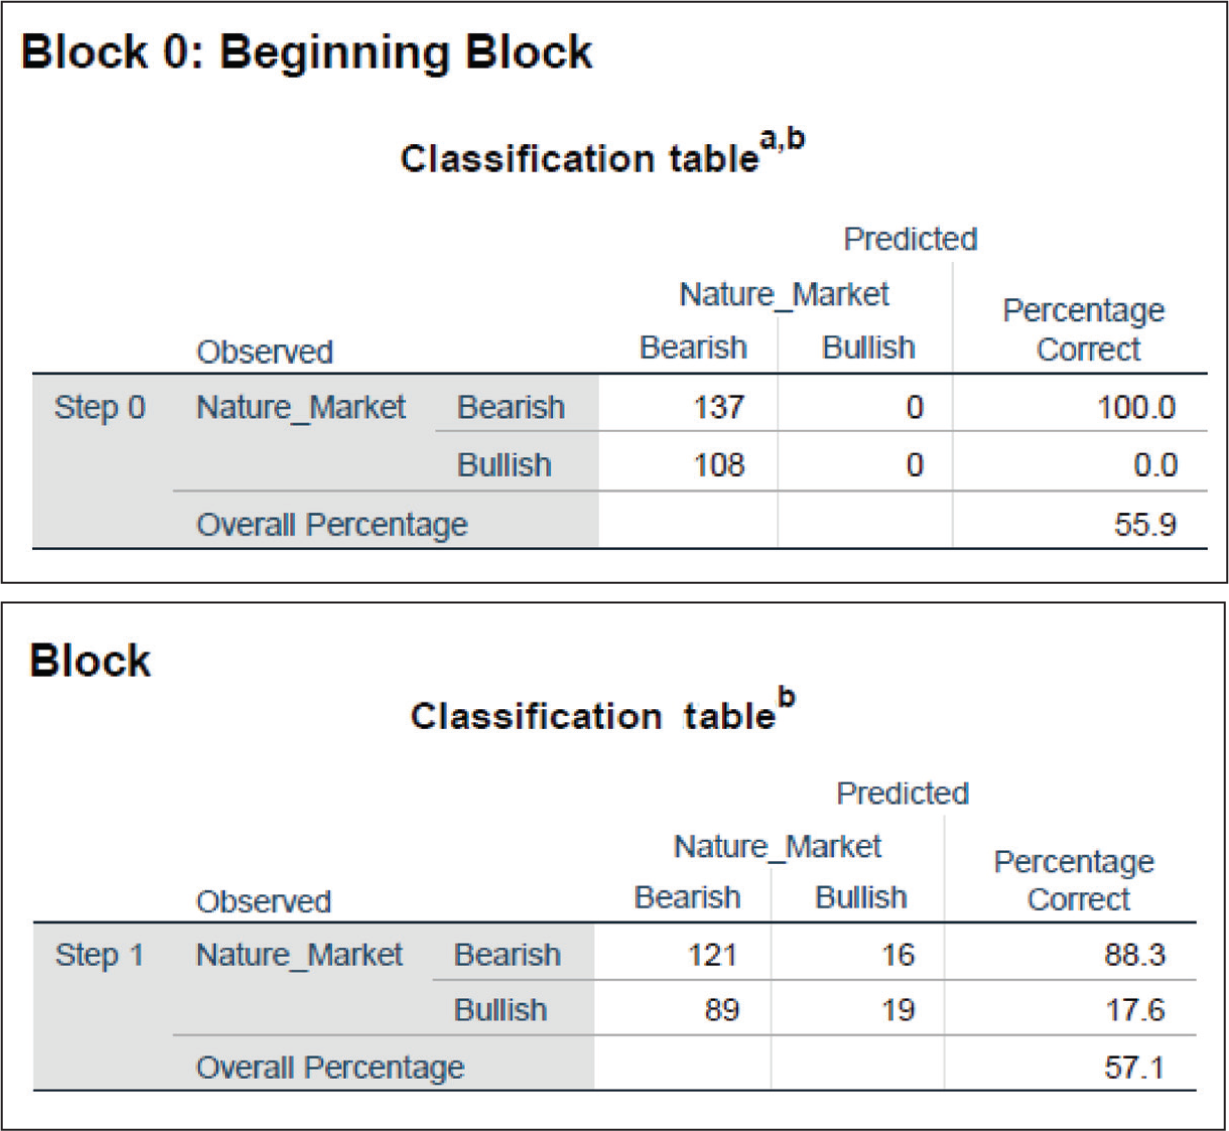
A. Block 0: Beginning block: This is an intercept-only model, which means that only eb0 is considered in p(x).
B. Block 1: Forward stepwise: This model includes all variables along with the intercept.
Interpretation: The accuracy of Block 0 or intercept model is found to be 55.9% as compared to Block 1 model with an accuracy of 57.1%. This means it is a wise choice to use Block 1 model as it contains variables that have a meaningful contribution to the model as the accuracy is high (Figure 8).
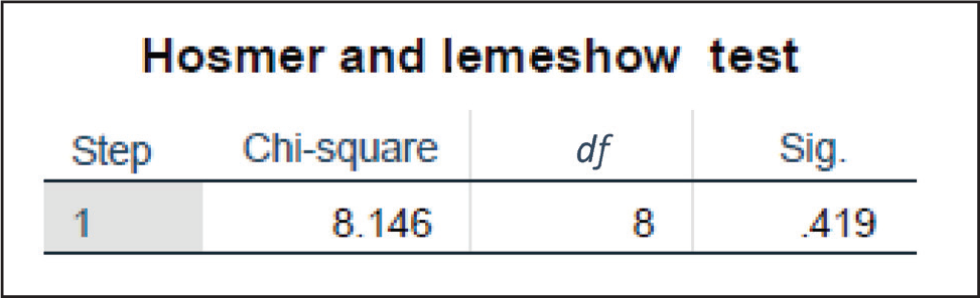
Hosmer–Lemeshow test: This statistic is a test hypothesis. It is used for testing if the observed and predicted frequencies are significantly different.
Following are the test hypotheses:
H0: There is no significant difference between observed and predicted frequencies. H1: There is a significant difference between observed and predicted frequencies.
Interpretation: As it can be seen from Figure 9, the p value or the significance level is .419, which is greater than the alpha value of .05 (standard); therefore, we accept the null hypothesis (H0), which states that there is no significant difference between the observed and predicted frequencies. It is imperative to note that this test proves the fact that the model is able to correctly predict frequencies.
Hosmer–Lemeshow Test Output.
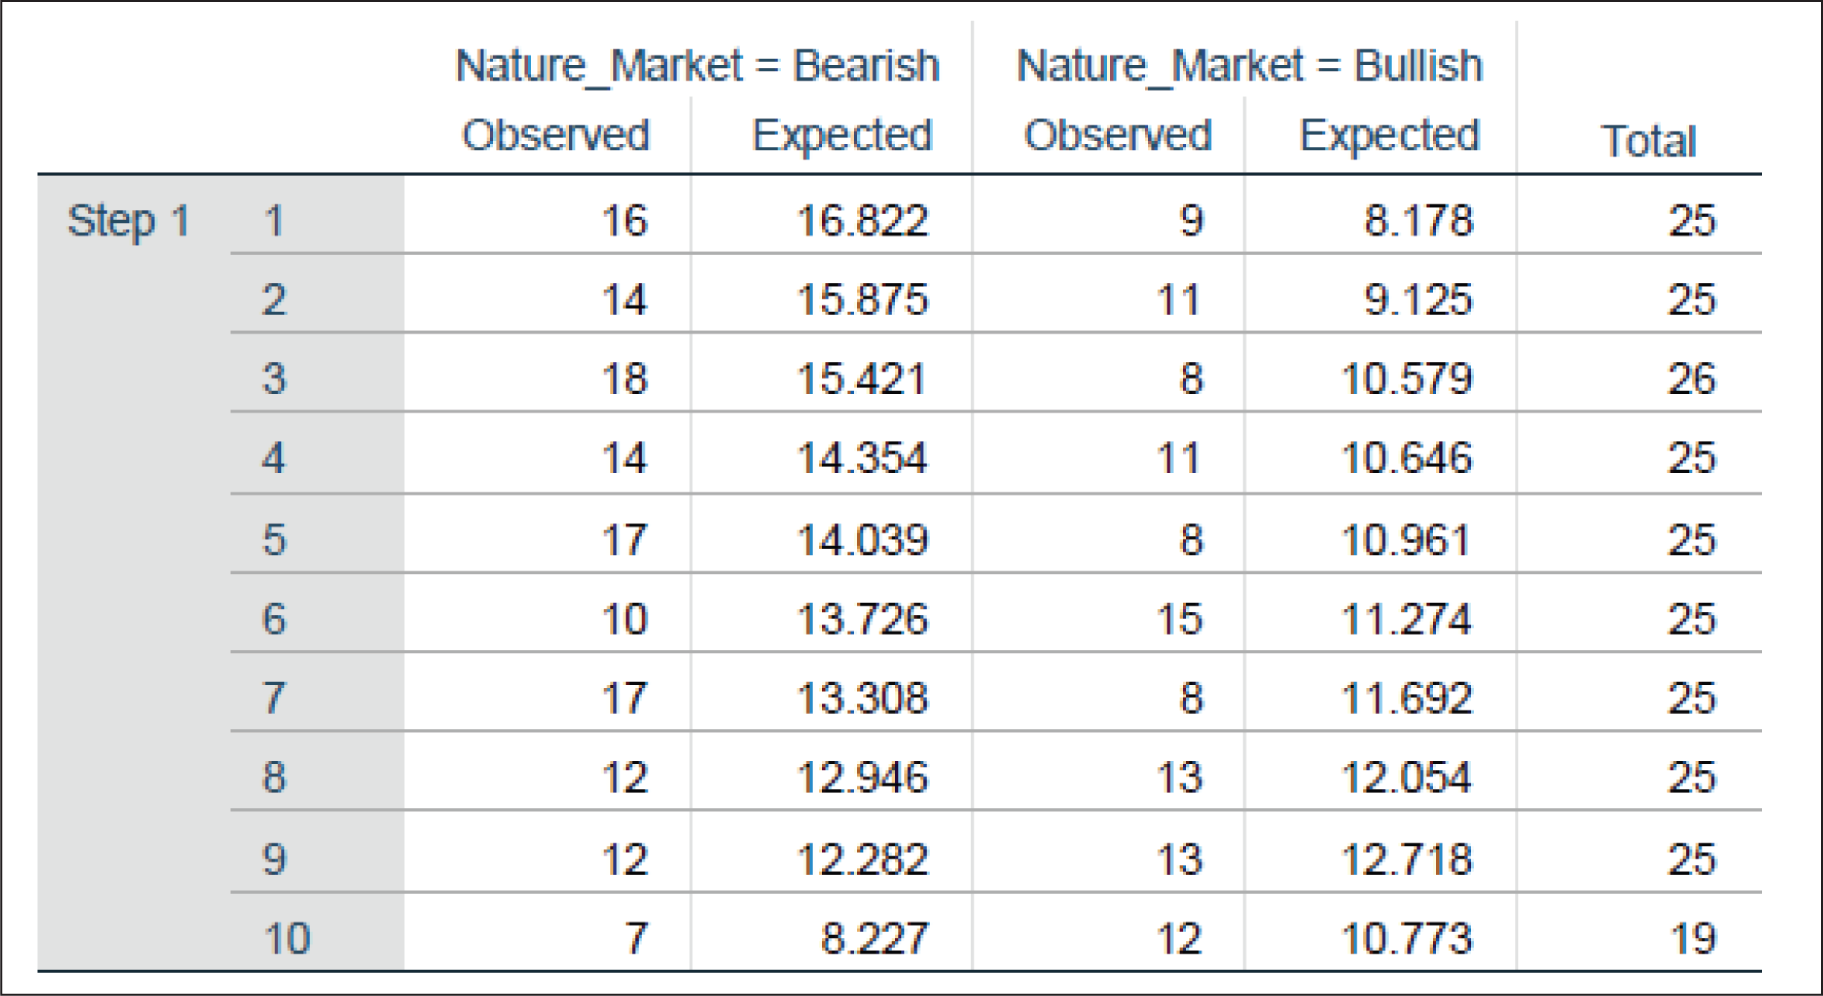
Contingency table for Hosmer–Lemeshow test: This table is a statistical test used to assess the goodness of fit for logistic regression models. The interpretation is provided below:
The data are divided into 10 groups based on predicted probabilities. Nature_Market (bearish or bullish): The two columns under this heading represent the observed and expected counts for each group. Observed: The actual number of observations in the bearish or bullish market condition. Expected: The number of observations expected in the bearish or bullish market condition, based on the model.
Figure 10 helps in comparing the observed and expected frequencies to evaluate the fit of the logistic regression model. The closer the observed and expected values, the better the model fits the data, which can clearly be seen for our model.
Contingency Table for Hosmer–Lemeshow Test.
Technique 3: k-Nearest Neighbors
The KNN algorithm is a supervised ML method that is used for classification and regression problems. There are some key components to the KNN algorithm, which include: distance metrics, value of k, and the voting mechanism. There are various advantages associated with KNN, which include its simple and easy-to-implement nature and that it can handle multi-class classification problems.
Distance metric: Commonly used metrics include Euclidean distance, Manhattan distance, and Minkowski distance.
Value of k: The number of nearest neighbors to consider. A small k can be noisy and lead to overfitting, while a large k can smooth out predictions but may underfit.
Voting mechanism: For classification, it could be a simple majority vote or weighted voting, where closer neighbors have a higher influence on the model.
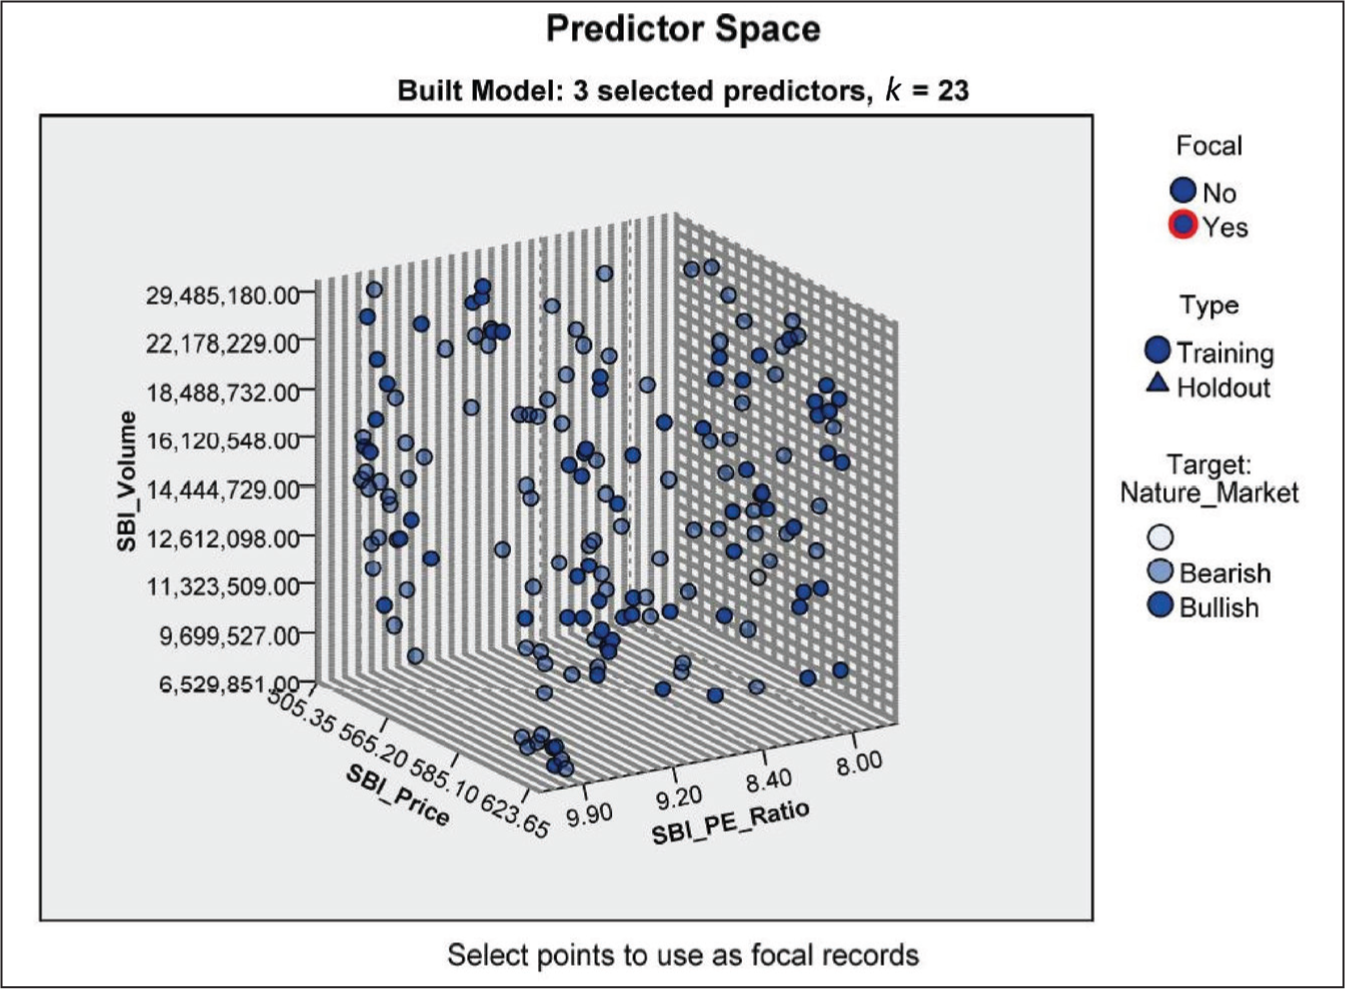
Key elements of the chart shown in Figure 11 include the following:
Axes and predictors: The three axes represent the three selected predictors used in the KNN model. These predictors are used to define the space in which the data points are plotted. Model information: The model uses k = 23, which means that the KNN algorithm considers the 23 nearest neighbors to make predictions. Chart description: The chart is a lower-dimensional projection of the predictor space, which originally contains 13 predictors. This means the 3D plot simplifies the original high-dimensional data into dimensions for visualization purposes here. It also aids in visualizing the separation (or overlap) between the two market conditions (bearish and bullish) based on the chosen predictors. By examining the distribution of training and holdout data points, one can assess the representativeness of the training data and the generalization capability of the model.
The 3D plot is an invaluable tool in KNN modeling for gaining insights into the relationship between predictors and the target variable and for visualizing the distribution of training and holdout data within the predictor space.
We have compiled Table 2 to showcase the actual market conditions and the KNN predicted values to demonstrate the accuracy of the KNN classification model that we have implemented in SPSS. It displays a subset of dates and their corresponding market conditions, with some rows and columns hidden in the middle for clarity, while ensuring the last value (December 29, 2023) is visible.
Comparison of the Nature of the Market and KNN Predicted Value.
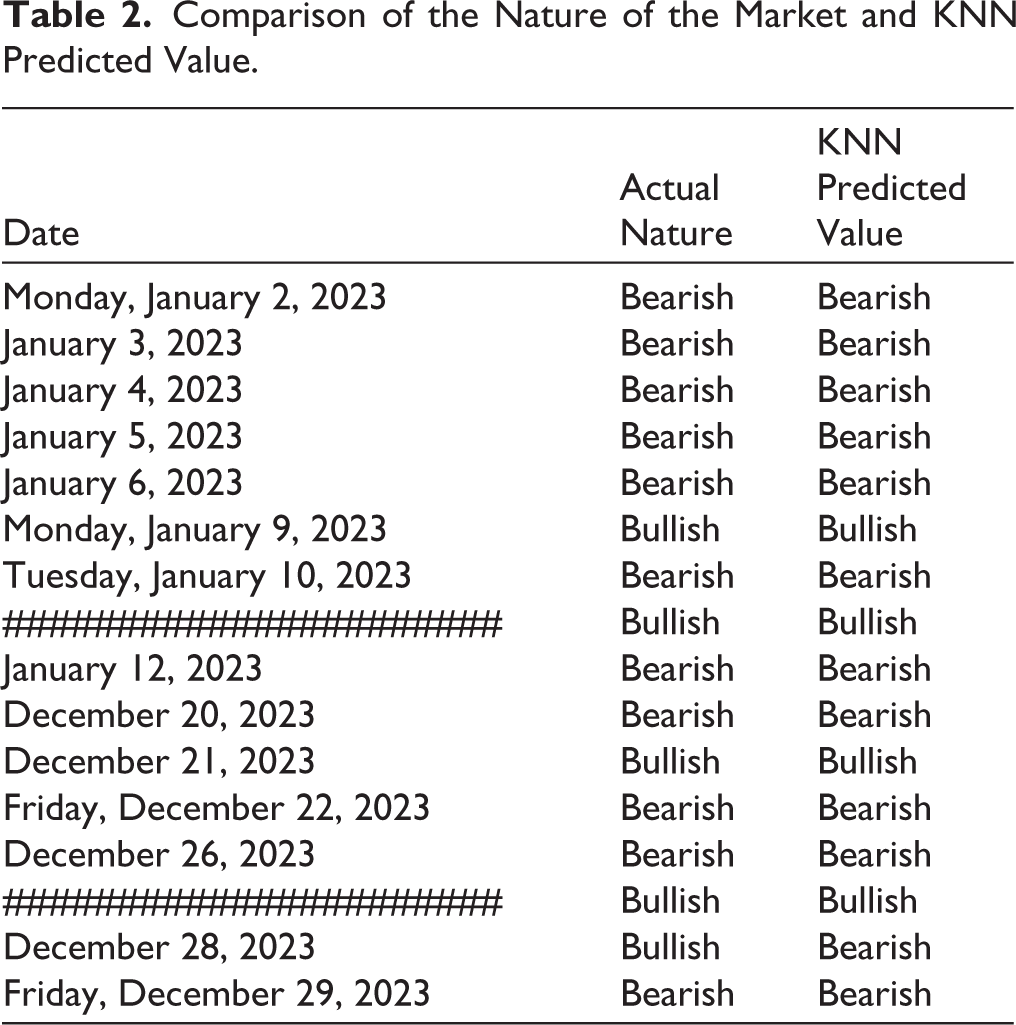
This visibility confirms that the KNN’s predicted “Bearish” classification on this date aligns perfectly with the actual market condition. Table 2 unequivocally illustrates the close alignment of KNN model predictions with the actual predictions for both “Bearish” and “Bullish” labels across the sampled dates. Noteworthy is the model’s accurate prediction of “Bearish” for December 29, 2023, which precisely matches the actual market condition of that date.
Technique 4: Simple Moving Averages
Interpretation: The chart shown in Figure 12 represents the 5-day SMA for the closing prices of the State Bank of India (SBI) throughout 2023. The 5-day moving average corresponds to a typical trading week, as most stock markets operate 5 days a week. The SMA is calculated by taking the average of the closing prices over a specified number of days, which in our case is 5 days.
Comparison of the 5-Day Moving Average with the Actual Close Price of SBI.
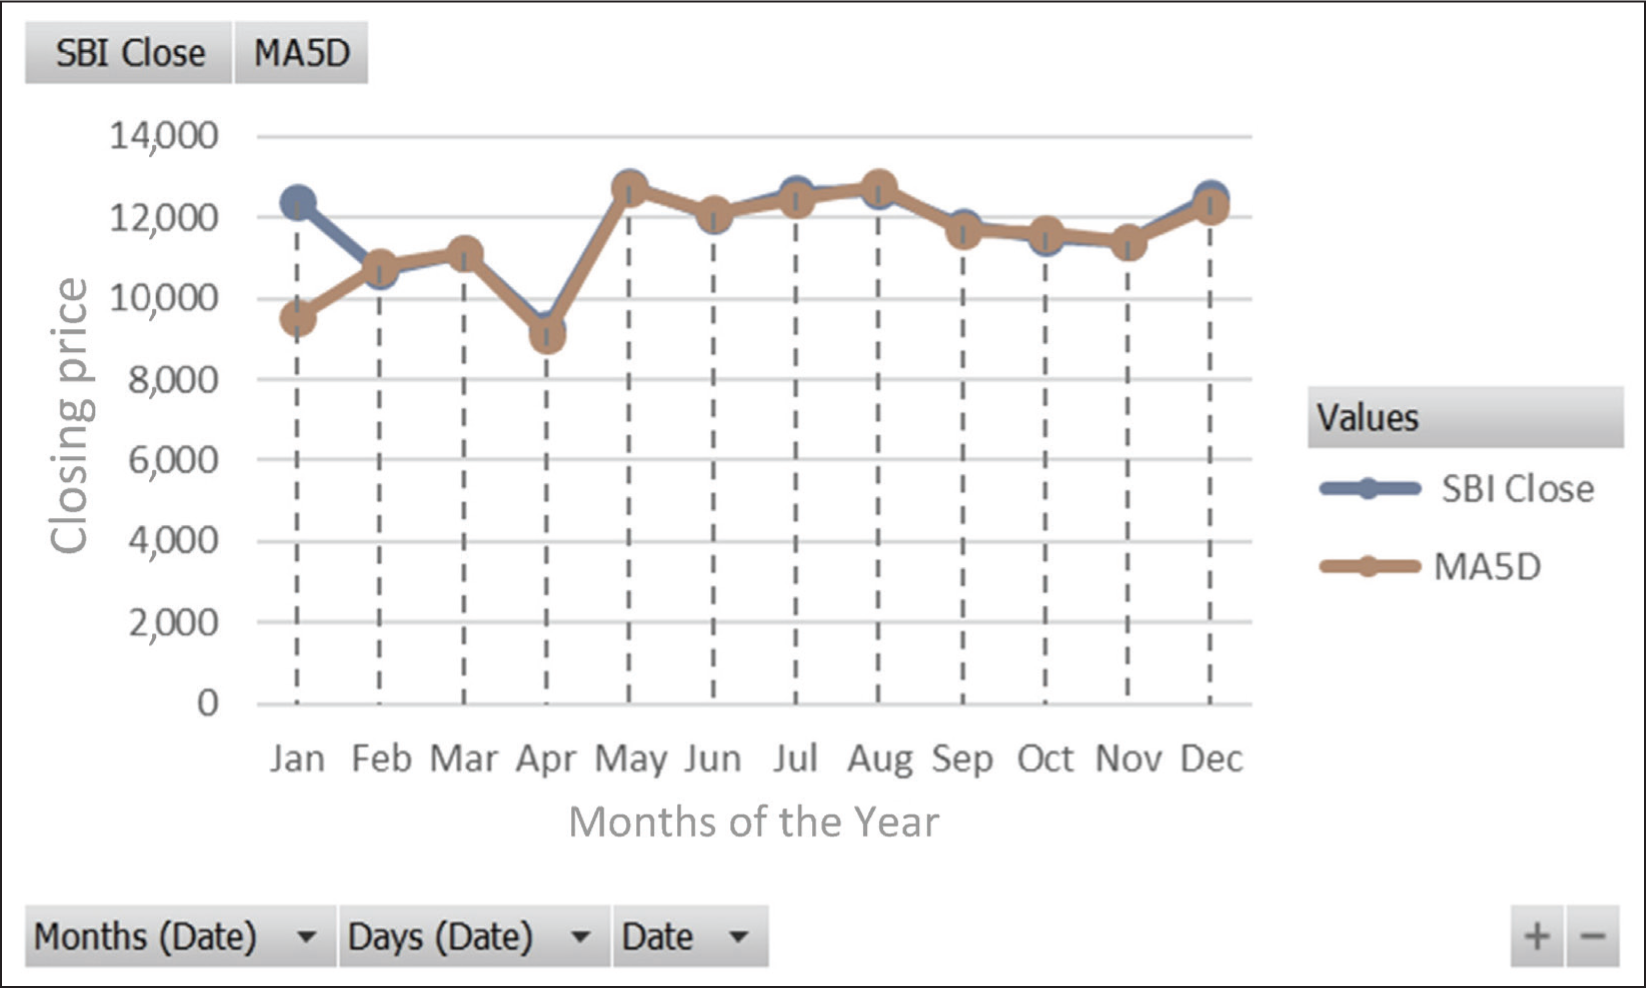
This average is then plotted on the chart for each trading day, creating a line that helps identify trends over a short period. The SMA is a lagging indicator, which is useful for identifying the general direction of the stock price. If the SMA line is trending upward, it indicates a bullish trend, whereas a downward trend suggests bearish sentiment. In Figure 12, the SMA closely follows the actual closing prices of SBI, indicating periods of both stability and volatility.
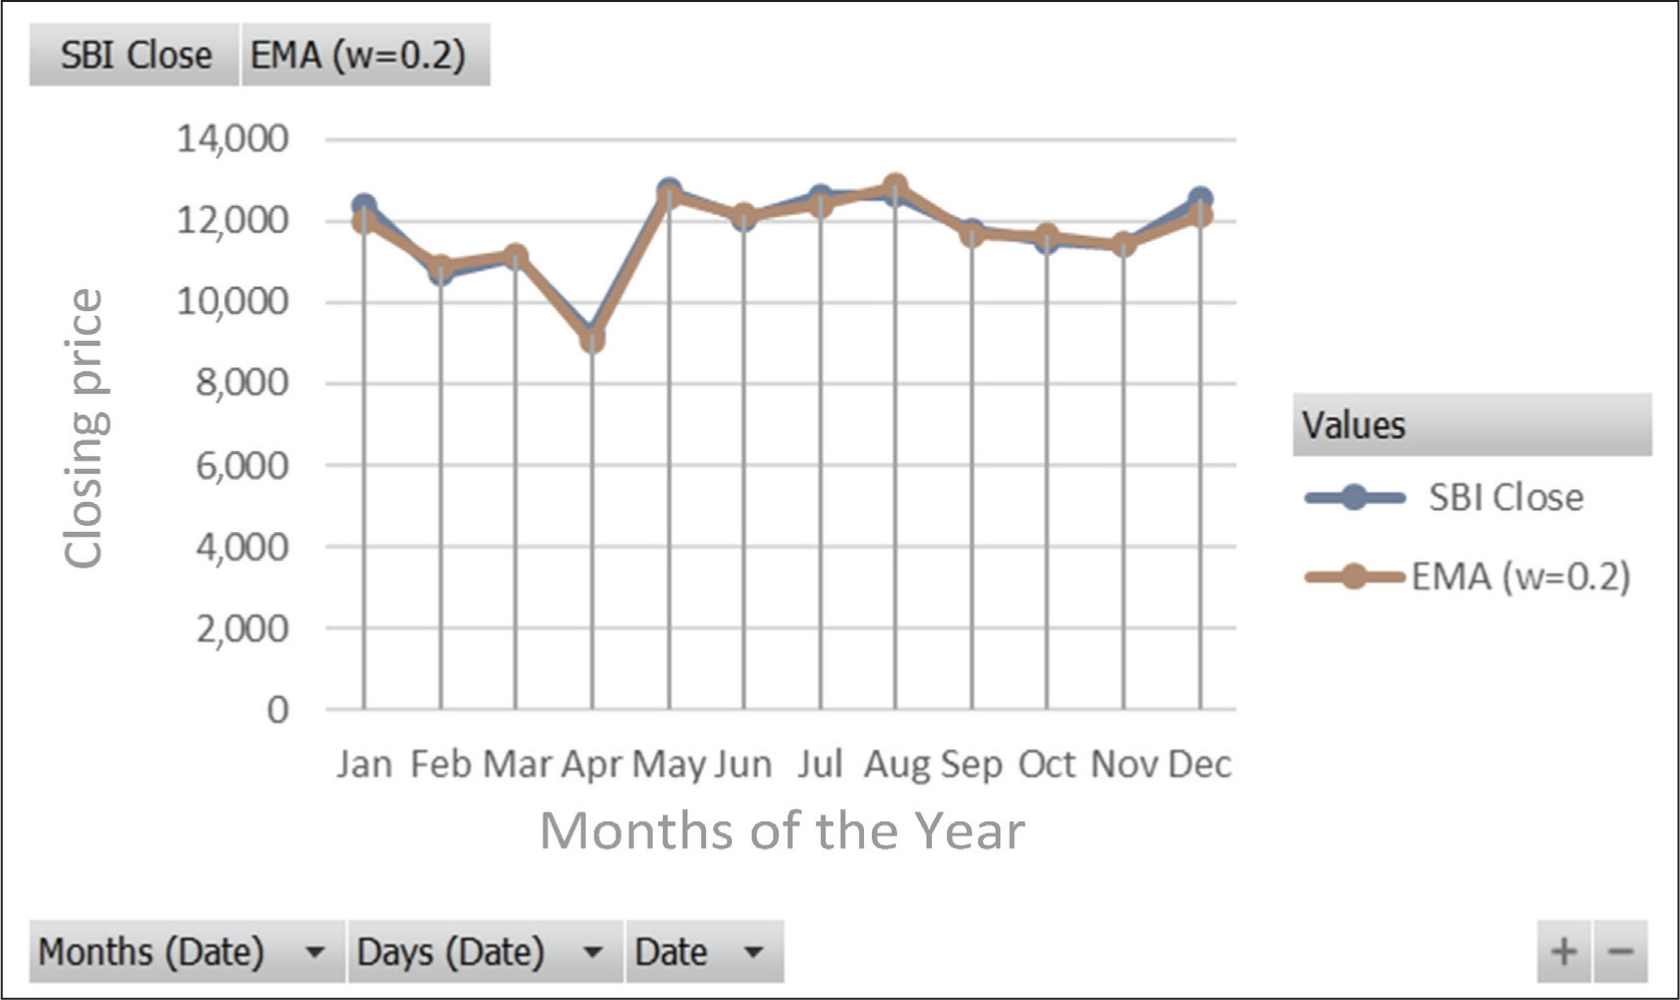
Technique 5: Exponential Moving Averages
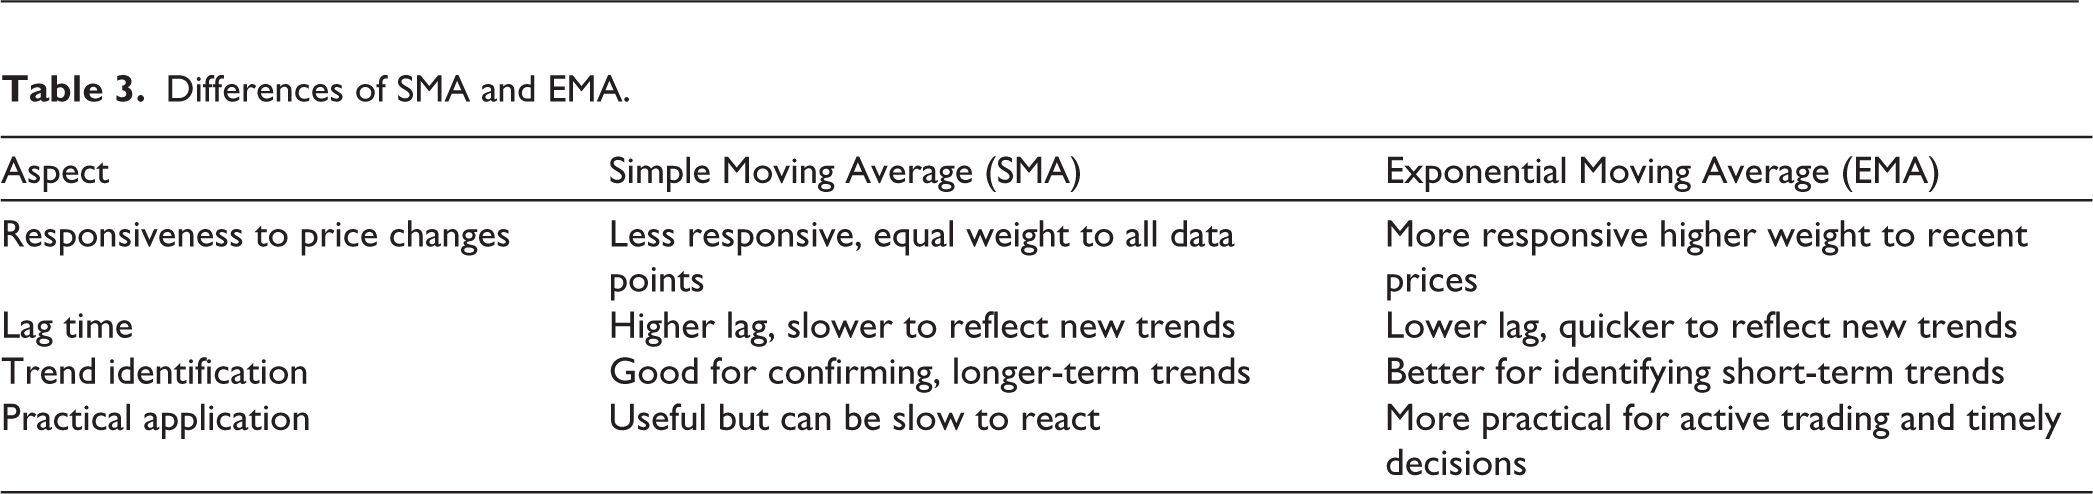
Interpretation: The chart in Figure 13 displays the EMA for the closing prices for SBI for the year 2023, using a smoothing coefficient (W) of 0.2. Unlike the SMA, the EMA is more responsive to sudden changes in price trends. This can be observed in Figure 12, where the EMA line adjusts more rapidly to both price drops and increases, such as a sharp decline in April and subsequent recovery in May. Despite its reactivity, the EMA effectively reduces price fluctuations, giving a clearer view of the overall trend without being excessively affected by short-term volatility. The EMA line aligns with the general direction of SBI’s closing prices, highlighting both upward and downward trends over the year (Table 3).
Comparison of the Exponential Moving Average with the Actual Close Price of SBI.
Differences of SMA and EMA.
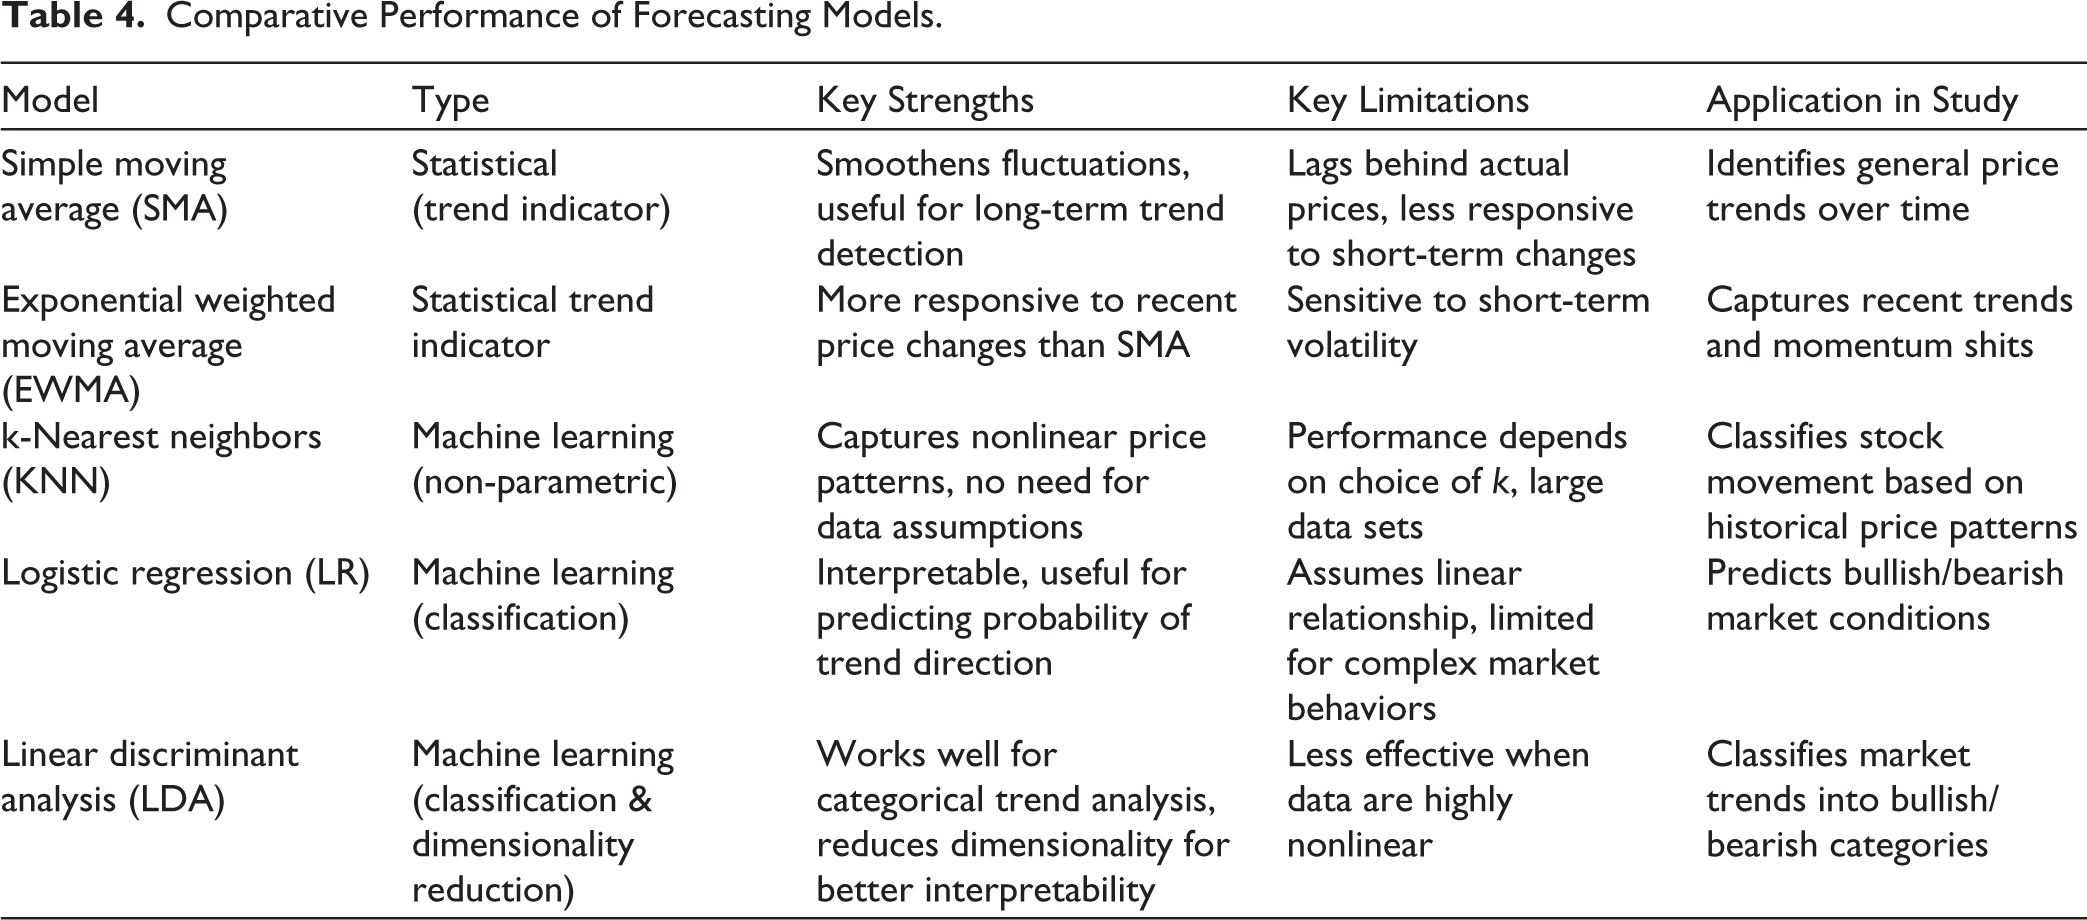
Comparative Performance of Forecasting Models.
Conclusion
Our study provides a comprehensive evaluation of stock price forecasting models, assessing their effectiveness in predicting market trends for five leading companies across diverse sectors. By combining traditional techniques like moving averages with advanced predictive models—including logistic regression, KNN, and LDA—we offer a comparative analysis of their predictive strengths (Table 4). The findings highlight that the EMA demonstrates superior responsiveness to price fluctuations, making it particularly effective in the highly volatile Indian stock market. Among the ML models, KNN exhibited the highest predictive accuracy at 75%, effectively distinguishing bullish and bearish trends, while LDA correctly classified 65% of cases, surpassing the minimum required accuracy threshold. Logistic regression showed a marginal improvement in predictive power when meaningful variables were incorporated, increasing accuracy from 55.9% in the intercept model to 57.1% in Block 1 model. These insights underscore the potential of ML in stock market forecasting, enabling investors to make data-driven decisions. Future research can explore hybrid modeling approaches and deep learning techniques to further refine predictive accuracy and enhance financial decision-making in evolving market conditions.
Practical Implications for Financial Analysts and Investors
Strategic investment decisions: Investors can leverage EWMA for short-term trading strategies and KNN for trend-based decision-making.
Risk management: The findings highlight that LDA is less effective in volatile conditions, cautioning analysts against its use for market trend classification.
Portfolio optimization: By integrating multiple forecasting techniques, analysts can enhance portfolio risk assessment and asset allocation.
Future Scope
While this study provides valuable insights into stock price forecasting in the Indian stock market, several areas remain open for further exploration. Future research could incorporate advanced deep learning models such as long short-term memory (LSTM) networks and transformer-based architectures to better capture complex temporal dependencies in stock movements, particularly in India’s volatile market conditions. Additionally, hybrid models combining traditional time-series techniques such as ARIMA and GARCH with ML approaches could enhance predictive accuracy by leveraging the strengths of both methodologies.
Another promising avenue is the integration of alternative data sources, including social media sentiment analysis, macroeconomic indicators, and global financial news, to assess their impact on Indian stock prices. With the growing influence of technology in financial markets, research on real-time forecasting applications and algorithmic trading strategies tailored for the Indian market can offer practical insights for institutional investors. Furthermore, extending this study to a sector-specific analysis could help identify which forecasting models perform best in different industries, such as banking, IT, and consumer goods, considering the unique economic drivers influencing each sector. By addressing these areas, future research can contribute to developing more robust and adaptive forecasting models, ultimately supporting better investment decision-making and market efficiency in India.
Footnotes
Declaration of Conflicting Interests
The authors declared no potential conflicts of interest with respect to the research, authorship, and/or publication of this article.
Funding
The authors received no financial support for the research, authorship, and/or publication of this article.