
Abstract
Purpose:
To examine whether, and the extent to which, executive pay and executive power impact earnings management (EM) behaviour in India.
Design/Methodology/Approach:
The study applies the modified version of Jones’s (1991, Journal of Accounting Research, 29(2), 193–228) model propounded by Dechow et al. (1995, The Accounting Review, 70(2), 193–225) to measure the proxy for accruals-based EM and the Roychowdhury’s (2006, Journal of Accounting and Economics, 42(3), 335–370) model to measure real EM in 980 listed companies in India during the period 2008–2022.
Findings:
The study reveals a statistically significant positive relationship between executive pay and EM and between executive power and EM. Further, a statistically significant negative relationship between EM and the interaction effect of executive pay and executive power suggests that well-paid, powerful executives on the board of directors are less likely to pursue EM activity in India.
Originality/Value:
There are limited studies that utilise a large balanced panel data set of listed companies covering majority of the non-finance industries in the Indian economy over a span of 15 years. The study highlights the significant explanatory power for real EM in comparison to accruals-based EM in India.
Implications:
The positive link between executive pay and EM suggests that the designing of compensation packages is linked to long-term value creation rather than short-term earnings. The influence of executive power highlights the importance of board independence and balanced CEO power. The negative interaction effect suggests alignment of executive pay and power with long-term company goals to mitigate earnings manipulation.
Introduction
Corporate laws require companies to prepare and present financial statements in a manner that reflects a ‘true and fair’ assessment of the financial state of affairs of the corporate entity (S. 129(1), The Companies Act, 2013). However, the absence of a clear and concise explanation as to what constitutes a true and fair view leaves room for manoeuvrability (Etim et al., 2020) within the ambit of the accounting standards, and by extension, auditing standards. In a sense, earnings management (EM) is a manifestation of this manoeuvrability. It cannot be denied that most EM activities are found to be inextricably linked to corporate frauds (e.g., Satyam Scam, Ricoh India), resulting in loss of investor confidence (Burlacu et al., 2024), regulatory sanctions and irreparable damage to the credibility and reputation of firm’s auditors (Du et al., 2015) and Chief Executive Officers (CEOs) (Kontesa et al., 2021). At the same time, such activities undertaken with the thoughtful intention to improve financial stability and enhance shareholders’ wealth in the long run do find a certain degree of acceptability and justification amongst researchers (Brennan, 2021; Jallad & Najar, 2024).
The board of directors refers to the collective of the individuals entrusted with managing corporate affairs (Fama & Jensen, 1998) to maximise shareholder value. Historic changes in corporate law have aimed at ensuring reasonable compensation to the board members of the corporate entity. Numerous safeguards, such as the increased role of independent, non-executive directors (S. 149(4), The Companies Act, 2013), the constitution of a Nomination and Remuneration Committee (S. 178(1), The Companies Act, 2013) and the specification of managerial remuneration limits (S. 197, The Companies Act, 2013) have been put in place to bring about fairness and transparency in the remuneration setting process. Nevertheless, given the importance of their role in the company’s hierarchical structure, executive directors are powerful individuals on the board who are in a position to influence key business decisions, including their own remuneration (Bebchuk et al., 2002).
The extant literature shares insights into the individual relationship of EM with board pay (Assenso-Okofo et al., 2020; Wang et al., 2021) and board power (Alareeni, 2018; Kalantonis et al., 2021). However, limited studies have explored the combined influence of executive pay and executive power on both accruals-based EM and real EM; for example, Dikolli et al. (2021) and Bao and Xue (2023) explicitly utilise interaction terms to explore the combined influence of executive pay and executive power on EM. Moreover, EM studies in the Indian context have focused on a small sample of companies (Mishra & Kaur Malhotra, 2016; Munjal & Singh, 2024) within limited industries (Thoppan et al., 2021), typically examining only one type of EM (Singh et al., 2016) over short time periods (Kaur et al., 2015), thereby creating a significant research gap. The objective of this study is to address the gap in the literature by examining the individual as well as the joint effect of executive pay and executive power on both accruals-based and real EM, using a comprehensive panel dataset of Indian listed companies across diverse industries.
The rest of the article has been organised as follows. The second section explains the theoretical framework of the study. The third section deals with the review of literature and development of hypotheses of the study. The fourth section explains the research methodology. The fifth section describes the empirical findings and outcomes of the regression models. The sixth section concludes the article, followed by a summary of the references used for this research study.
Theoretical Framework
Earnings Management
Agency theory explains EM as the management’s response to the conflicts of interests between the principal (shareholders) and agents (company management) on account of the split between control and ownership. Managers can be incentivised to distort income figures when such a manipulation results in higher bonuses (Jensen & Meckling, 1976). The sea of literature published on the definition and mechanisms of EM concedes that companies pursue EM for various reasons. Firms may engage in EM to deceive users of financial statements and reports, influence contractual outcomes (Healy & Wahlen, 1999), obtain private gains (Schipper, 1989) through strategic disclosure of information (Aboody & Kasznik, 2000), meet or beat performance expectations (Black et al., 2021; Edmans et al., 2017; Zhou et al., 2018;) through understatement or overstatement of reported incomes (Brennan, 2021; Hensel & Schöndube, 2022), maximise stock price and report inflated earnings (Harris et al., 2019), achieve tax avoidance without alerting regulatory authorities (Wang et al., 2021), mislead the board (Cella et al., 2013) and stakeholders (Needles Jr. et al., 2018) about underlying business conditions, amongst others.
EM entails costly implications for a company. The cost of manipulating earnings may vary according to effectiveness of governance policies, or the degree of strictness exercised over financial reporting by the internal control system (Sun, 2014). Evidence indicates that investors react negatively to firms that are required to restate their financial statements (Huang et al., 2020). On the one hand, CEOs in receipt of stocks and options as compensation are incentivised to engage in EM activities in response to uncertainty of future wealth, but, on the other hand, they are also likely to refrain from engaging in EM for fear of impairing the value of their holdings, thereby affecting their personal future wealth (Li et al., 2021).
Managers engage in EM through a variety of ways, depending upon their goals. One of the major motives is to pursue self-interest through enhancement of compensation (Strakova, 2021; Zhou et al., 2018). The level of EM becomes excessive in times of financial difficulties (Assenso-Okofo et al., 2020; Masruki & Azizan, 2012).
Executive Pay
The board of directors is envisioned as agents of the owners and is expected to discharge their duties in a manner that maximises the interests of the owners of the company. As a reward for their services, directors are compensated by way of salary, bonus, stock options and retirement benefits. In keeping with agency theory, most companies link managerial remuneration to company performance to affirm the alignment of directors’ personal interests to the shareholders’ interests. However, remuneration is merely one of the motivating factors that determine the course of action adopted by a director. Other motivating factors include the directors’ narcissism (Kontesa et al., 2021), reputation (Graham et al., 2005) and peer competition (Park, 2019).
The absence of a uniform theory on the computation of managerial compensation raises the question of the appropriate level of compensation awarded to the directors, keeping in view the nature of the functions performed by them. The two dominant approaches to the study of executive compensation are the optimal contracting theory and the managerial power approach.
The absence of a uniform theory on the computation of managerial compensation raises the question of the appropriate level of compensation awarded to the directors, keeping in view the nature of the functions performed by them. Nevertheless, theories on optimal contracts and managerial power emerge as the two most dominant approaches to the study of executive compensation. Optimal contracting theory offers distinctive advantages, such as attracting top talent, minimising agency costs and aligning executive interests with shareholders. It is, however, not devoid of limitations, such as potential CEO influence over independent directors, pressure to conform to board dynamics, limited economic incentives for thorough scrutiny, reputational concerns for directors, the difficulty of successful shareholder lawsuits against excessive compensation and the high costs associated with opposing compensation packages (Bebchuk et al., 2002). The theory finds support in the agency theory that considers the design of management compensation contracts to align management interest with the interest of shareholders (Jensen & Meckling, 1976). The managerial power theory, on the other hand, argues that powerful executives can leverage their influence to extract excessive compensation (rents) beyond what is justified by their performance. This ‘rent extraction’ is influenced by factors such as the executive’s ownership stake in the company. While social and reputational concerns can limit this power, inefficient compensation arrangements ultimately harm shareholders, exceeding the gains made by the executives (Bebchuk et al., 2002; Goergen & Renneboog, 2011).
In other words, while the optimal contracting approach is seen as a mechanism to resolve the agency problems between executives and shareholders, the managerial power approach is seen to be exacerbating the agency problem by providing a mechanism for executives to extract excessive compensation or ‘economic rents’.
Legal Framework and Limits on Managerial Compensation in India
In India, the key components of a director’s compensation package include salary, bonus/commission, sitting fee for attending board meetings, perquisites, stock options, contribution to provident fund and other remuneration benefits. Executive remuneration in India is not strictly linked to performance. The Companies Act, 2013, specifies the limit on the overall managerial compensation payable by public companies to the directors during a financial year, as well as the compensation payable to a single director, a group of directors and other directors. The Act requires shareholders’ authorisation for payment of managerial remuneration exceeding the specified limits, along with prior approval from corporate creditors in the likelihood of a default on obligations. Even in the absence or inadequacy of profits, the managerial remuneration shall be payable as per the provisions set out in the legislation (S. 197, The Companies Act, 2013).
Role of Nomination and Remuneration Committee
In India, publicly listed companies are mandatorily required to constitute a Nomination and Remuneration Committee. Amongst its many key functions, the committee is entrusted with the formulation and disclosure of the compensation structure for the board executives, key managerial personnel and other members of staff of the corporate entity (S.178, The Companies Act, 2013).
Executive Power
The board of directors is collectively vested with decision-making powers within a company. However, not all individual directors are vested with equal power; certain directors are seen as occupying a more powerful position relative to other board members. In India, a director is an individual who is appointed to a company’s board (S. 2(34), The Companies Act, 2013); the board denotes the collective body comprising all directors of the corporate entity (S. 2(10), The Companies Act, 2013), and a managing director is a director entrusted with managing corporate affairs, either in accordance with the agreement/board resolution setting out the terms of appointment or by virtue of the powers set out in the entity’s articles (S. 2(54), The Companies Act, 2013). Suffice to say, a managing director occupies a position of great import on the company’s board. Prior research has underscored the role of executive power in increasing EM activities. Powerful CEOs are observed to be increasingly associated with earnings variability and poor earnings quality (Oussii & Klibi, 2023); firms with the dual role of CEO and chairperson are more likely to restate accounting statements (Bao & Xue, 2023). Concentration of power in the hands of a single individual tends to exacerbate agency problems (Davidson et al., 2004). The choice of EM activity preferred by powerful CEOs may be influenced by the presence of powerful Chief Financial Officers (CFOs) and vice versa (Baker et al., 2019). Powerful CEOs are more likely to engage in real EM with the aim of enhancing their own compensation (Zhou et al., 2018).
Review of Literature and Hypothesis Development
EM strategies may be classified into accruals-based EM (hereinafter abbreviated as AEM) and real EM (hereinafter abbreviated as REM). AEM involves exercising unobservable discretionary choices (Dechow et al., 2010; Healy, 1985) in accounting practices within the framework of Generally Accepted Accounting Principles (GAAPs) (Dechow & Skinner, 2000), accounting standards (Badertscher, 2011) and other legal enactments and regulations (Baker et al., 2019) to distort reported earnings (Chen et al., 2015; Dechow & Skinner, 2000), thereby compromising the integrity and reliability of the financial reporting process and requiring restatement (Huang et al., 2020). REM involves manipulation of operational activities by exercising discretion over real business activities such as research and development expenditures, sales manipulation and overproduction (Cohen & Zarowin, 2010; Roychowdhury, 2006), the timing of sales of assets (Bartov, 1993; Herrmann et al., 2003), employee training and maintenance budgets (Elage & Dardour, 2021), to name a few.
Although both strategies adopt different mechanisms to achieve the same outcome, research finds REM to be more value-destructive in comparison to AEM (Braam et al., 2015; Cohen & Zarowin, 2010; Roychowdhury, 2006). This is because changes in operational activities in one accounting period may adversely impact the company’s operational capabilities in the subsequent accounting period(s); for example, reduction in research and development expenditure to boost earnings in one accounting period would limit the company’s ability to develop and tap growth opportunities, thereby impairing its revenue-generating capabilities in the long run. Negative influence of REM on a company’s financial position entails reduced cashflows, poor firm performance and decreased value (Roychowdhury, 2006). REM mechanisms, such as price reduction to boost sales and increase turnover, entail a direct, negative influence on cash flows (Braam et al., 2015; Graham et al., 2005). Conversely, AEM mechanisms do not impact cash flows in a direct manner (Cohen & Zarowin, 2010) since they operate within the confines of an otherwise flexible accounting environment.
Research suggests a positive relationship between total compensation and AEM (Assenso-Okofo et al., 2020), with well-paid managers in profitable firms more likely to engage in AEM, while those in less profitable firms favour REM (Wang et al., 2021). However, the literature presents inconsistencies and gaps. While some studies support this positive link between compensation and EM, others suggest a more complex relationship, potentially moderated by factors such as political risk (Jiang et al., 2024), firm growth (Kwon et al., 2022) and corporate governance mechanisms (Collin et al., 2022; Masmoudi Mardessi & Makni Fourati, 2020). Accordingly, the following hypotheses are developed for further examination:
H1a: Well-paid board executives are more likely to pursue AEM. H1b: Well-paid board executives are more likely to pursue REM.
The influence of CEO power on EM is also a subject of ongoing debate. While some studies indicate that powerful CEOs, particularly those holding both CEO and Chairman roles (CEO–Chairman duality), are more likely to engage in EM due to reduced board independence (Bao & Xue, 2023; Oussii & Klibi, 2023), others have found a negative or insignificant relationship (Alareeni, 2018; Kalantonis et al., 2021). These mixed findings highlight the need for further research to understand the complex interplay between CEO power, compensation and EM strategies. Accordingly, the following hypotheses are developed for further examination:
H2a: Powerful board executives are more likely to pursue AEM. H2b: Powerful board executives are more likely to pursue REM.
Several research studies acknowledge the trade-off between AEM and REM (Braam et al., 2015; Cohen et al., 2008; Mnif & Ben Hamouda, 2020; Zang, 2012). Some studies suggest a preference for AEM due to the reputational risks associated with REM (Habib et al., 2022), while others argue that REM is more difficult to detect, leading to its increased use, particularly after the implementation of regulatory changes in the Sarbanes-Oxley Act (Dharwadkar et al., 2024). However, the specific conditions under which executives choose one EM strategy over the other, especially considering the combined influence of pay and power, are not fully understood. Accordingly, the following hypotheses are developed for further examination:
H3a: Well-paid powerful board executives are more likely to pursue AEM. H3b: Well-paid powerful board executives are more likely to pursue REM.
Research Methodology and Data Analysis
Design of the Study and Selection of Statistical Data
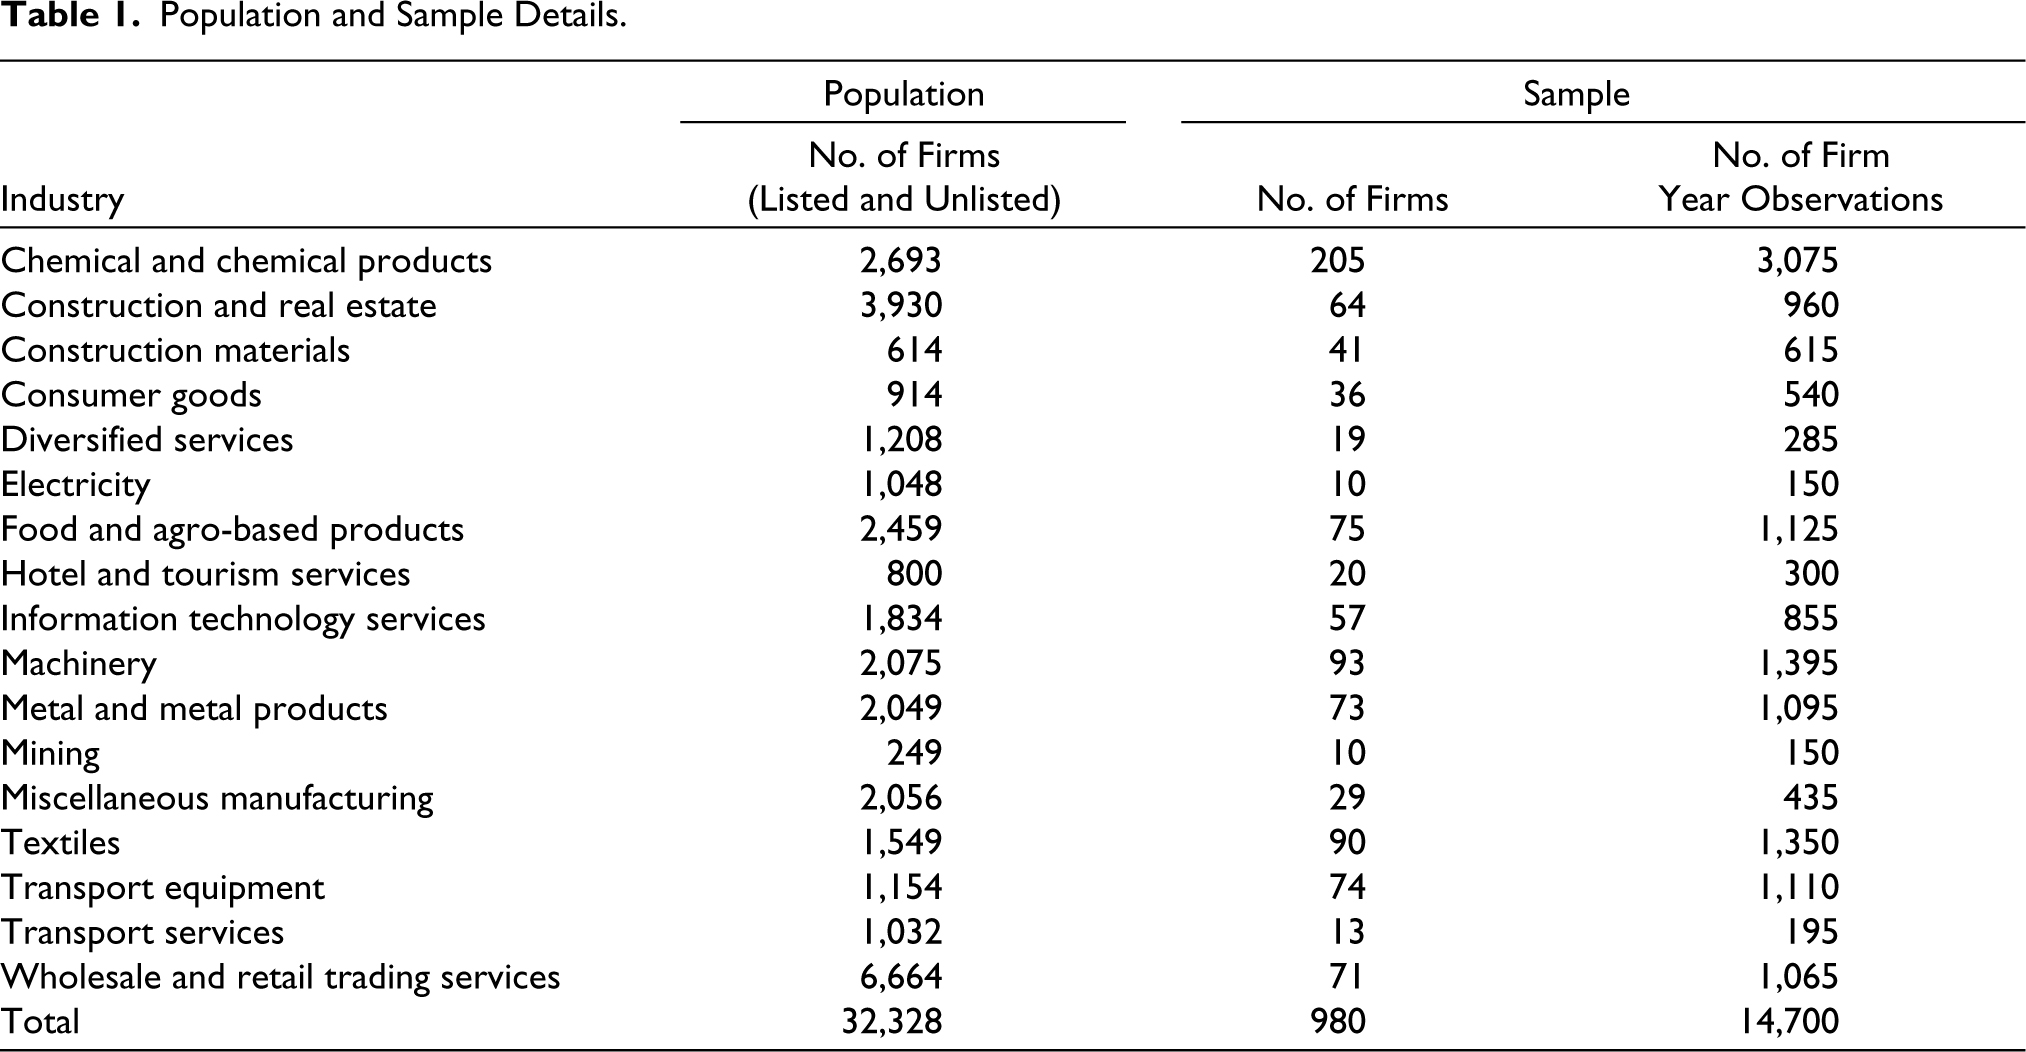
The study examines the relationship between EM (both AEM and REM), executive pay and executive power in 980 listed companies in India during 2008–2022. The data have been compiled from the Prowess Database of the Centre for Monitoring Indian Economy (CMIE). Consistent with previous studies, companies from the banking, finance and insurance sectors have been excluded since they are governed by specific regulatory legislations, resulting in differing definitions of revenues and accruals. Companies with missing and/or incomplete data have also been excluded; this step eliminated data of firms belonging to the miscellaneous services industry. Companies from the communication services industry and the diversified manufacturing industry have been excluded on account of their small sample size (less than 10 firms in both industries). The final sample consists of 14,700 firm-year observations, covering 17 (out of a possible 20) non-finance industries. The industry-wise details of sample firms and firm-year observations have been presented in Table 1.
Population and Sample Details.
Variables Measurement
Dependent Variables
Measuring Accruals-based Earnings Management (AEM)
Consistent with prior studies, accruals-based EM has been measured by discretionary accruals computed using the Dechow et al. (1995) modification to Jones model (Jones, 1991). This modification improves the measurement of discretionary accruals by recognising the discretion exercised by management on the recognition of revenue from credit sales, thereby inflating or deflating reported earnings of the period. The computation of discretionary accruals involves the following steps:
In the first step, total accruals of year t (TAt) (Healy, 1985; Jones, 1991) have been computed as:
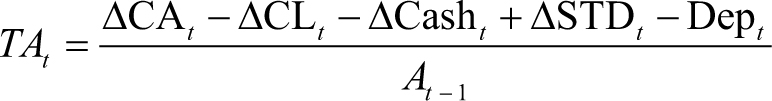
where ΔCAt and ΔCLt denote variations in the current assets and current liabilities, respectively, of the firm in year t; ΔCasht denotes variation in firm’s cash and cash equivalents in year t; ΔSTDt denotes variation in debt component included in firm’s current liabilities in year t; Dept denotes depreciation and amortisation expense in year t; and At–1 denotes total assets of the firm in year t – 1.
In the second step, the following regression model is run to generate the firm-specific parameters α1, α2 and α3 as presented in Table 2:
Industry-wise Regression Estimates.
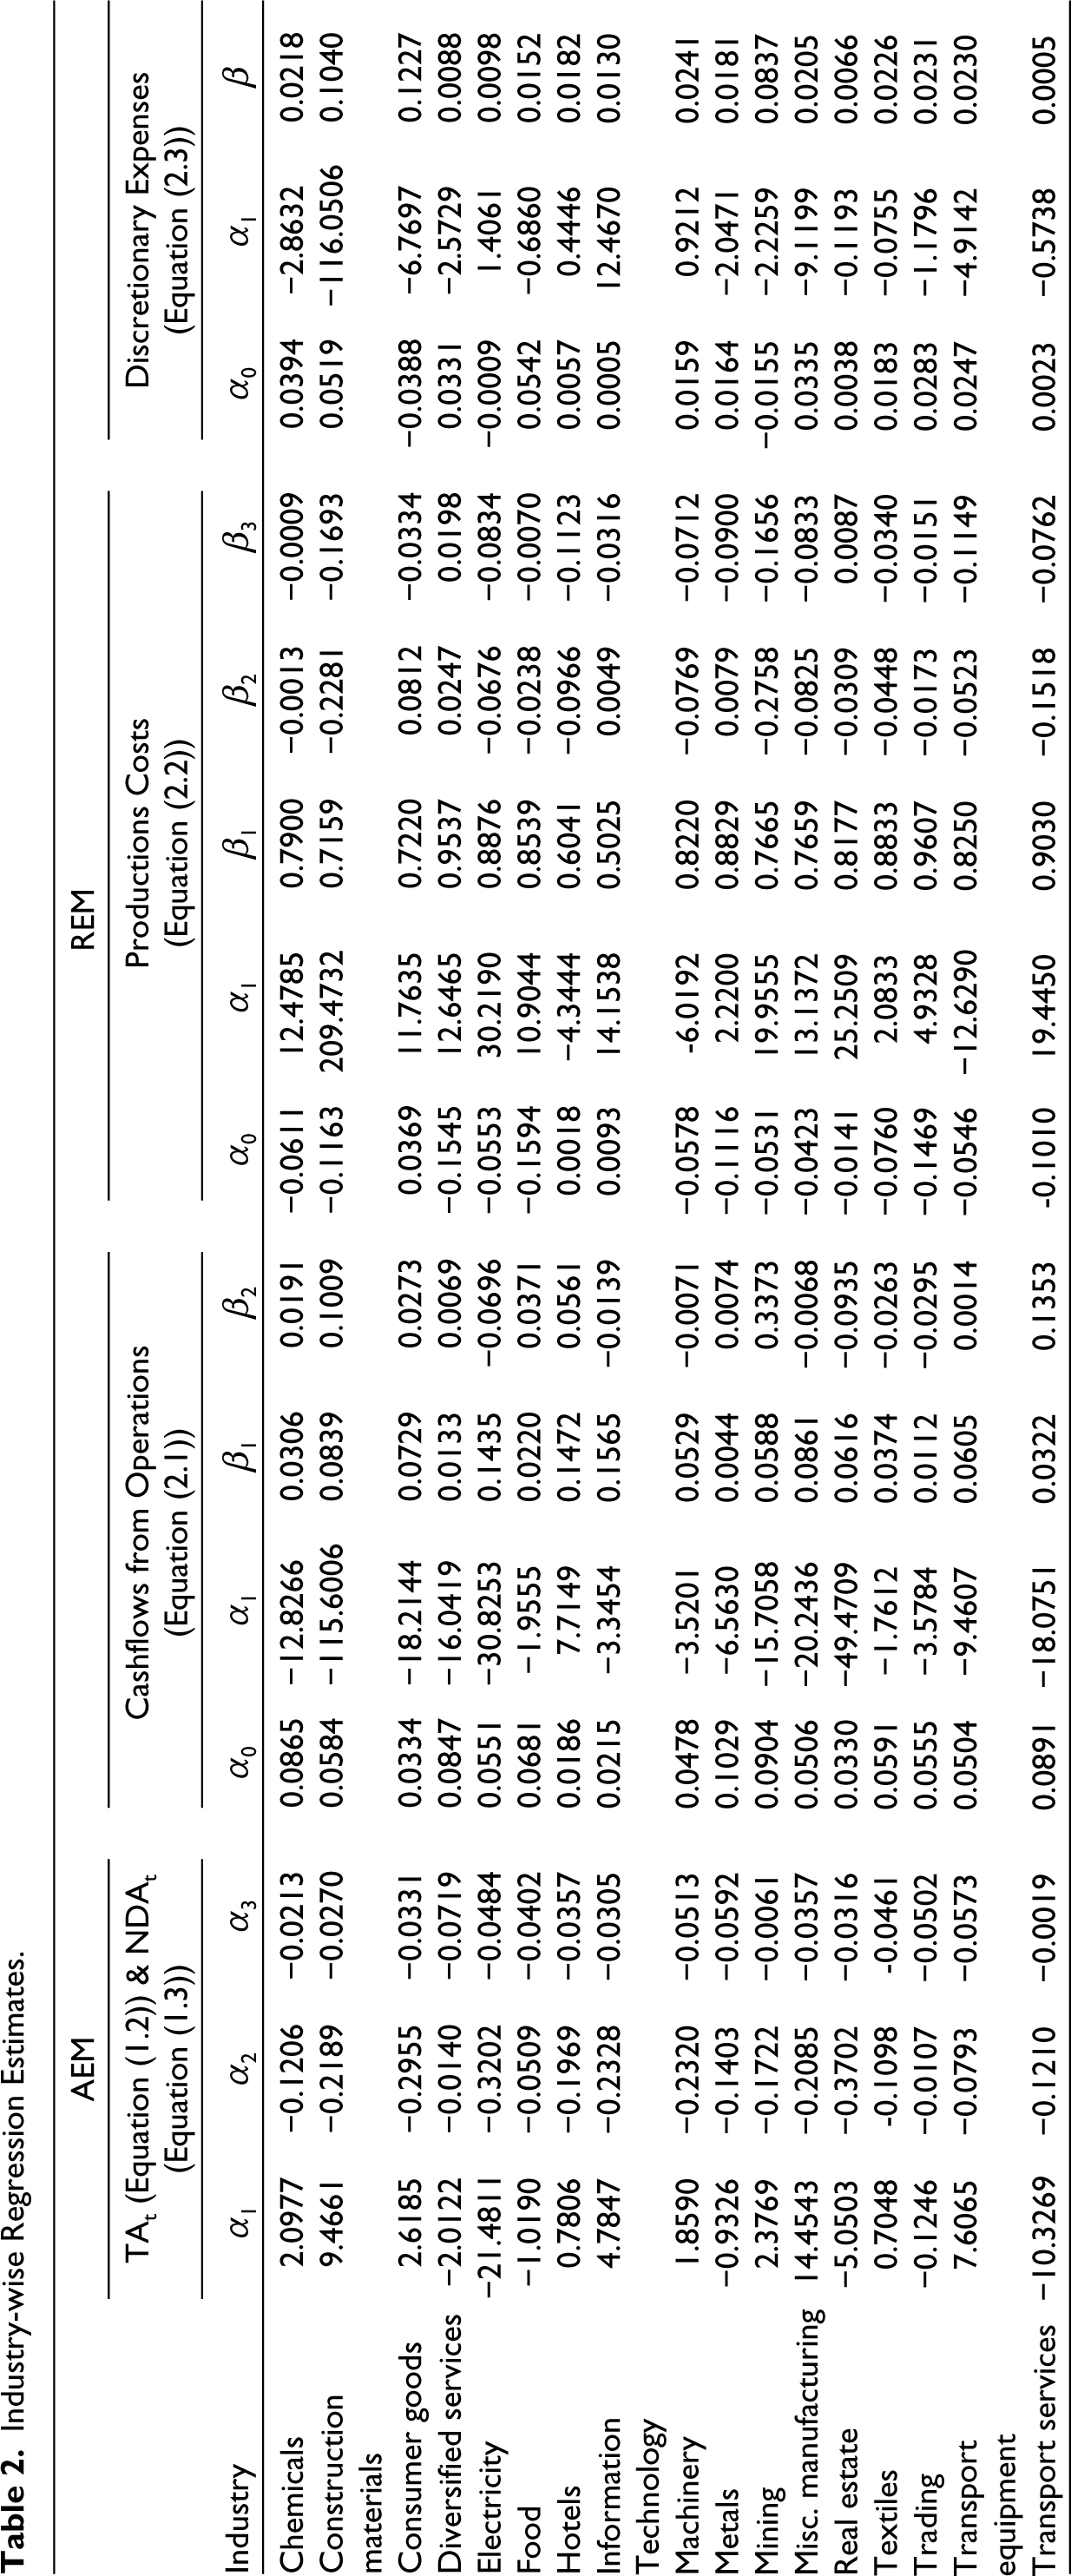
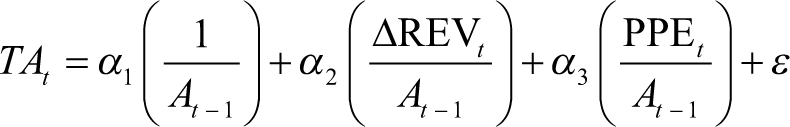
where ΔREVt denotes variation in a firm’s revenues in year t and PPEt denotes gross property, plant and equipment of the firm in year t.
In the third step, using the firm-specific parameters derived from the regression model in Equation (1.2) as presented in Table 2, non-discretionary accruals (NDAt) have been computed as follows:
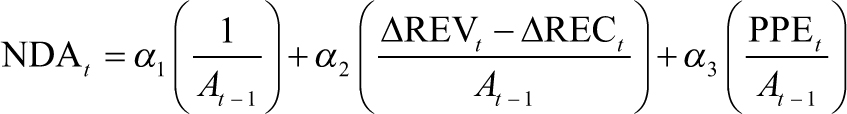
where, ΔRECt refers to the variations in net receivables of the firm in year t.
In the fourth and final step, discretionary accruals have been computed as the difference between the firm’s total accruals (computed in Equation (1.1)) and non-discretionary accruals (computed in Equation (1.3)). Accordingly,
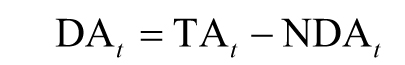
Since DAt is the proxy measure of AEM, the variable term AEMt has been used in the rest of the article.
Measuring Real Earnings Management (REM)
As proposed by Dechow et al. (1998) and Roychowdhury (2006), real EM occurs on account of abnormal deviations in business operations deliberately orchestrated by executives to achieve financial reporting goals. The computation of REM involves the following steps:
In the first step, the expected cashflows from operations have been computed using the following regression model:
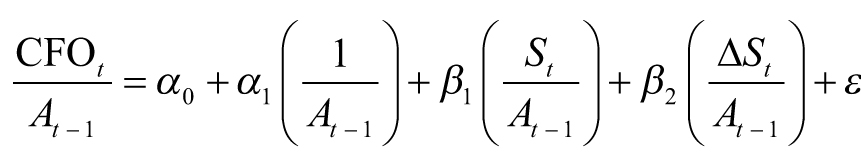
where CFOt denotes operating cash flows in year t; St denotes sales in year t; and ΔSt refers to variations in a firm’s sales in year t, computed as St − St−1.
Thereafter, for every firm-year observation, abnormal cash flows from operations have been computed as the difference between actual CFO and expected CFO computed using the firm-specific parameters α0, α1, β1 and β2 from Equation (2.1) as presented in Table 2.
In the second step, the expected production costs have been computed using the following regression model:
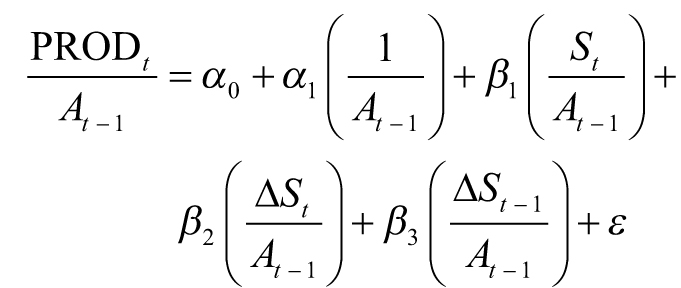
where PRODt refers to production costs of year t measured by aggregating cost of goods sold (COGS) of year t and change in stock (ΔINV) of year t; and ΔSt−1 refers to change in firm’s sales in year t−1.
Thereafter, for every firm-year observation, abnormal production costs have been computed by taking the difference between actual PROD and expected PROD computed using the firm-specific parameters α0, β1, β2 and β3 from Equation (2.2) as presented in Table 2.
In the third step, the expected discretionary expenses have been computed using the following regression model:
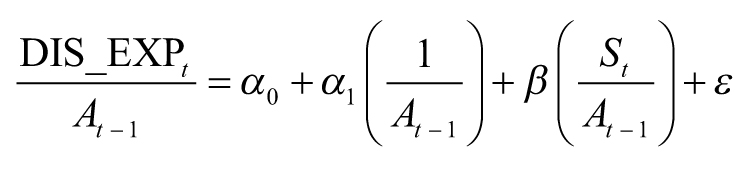
where DIS_EXPt denotes discretionary expenses in year t, measured as the aggregate of R&D expenses and selling and distribution expenses (computed by aggregating advertising, marketing and distribution expenses) in year t.
Thereafter, for every firm-year observation, abnormal discretionary expenses have been computed by taking the difference between actual DIS_EXP and expected DIS_EXP computed using the firm-specific parameters α0, α1, and β from Equation (2.3) as presented in Table 2.
In the fourth and final step, real EM has been computed as the aggregate of abnormal cash flows from operations, abnormal production costs and abnormal discretionary expenses. Accordingly,

Independent Variables
Measuring Executive Pay
The executives on the sample companies’ board of directors have been categorised using mutually exclusive designations assigned in the CMIE Prowess database, namely Chairperson & Managing Director (CMD), Chief Executive Officer (CEO), Chairperson, Chairperson Emeritus, Managing Director (MD), Nominee Director and Other Director. The components of directors’ remuneration in the database include salary, bonus/commission, sitting fee, perquisites, retirement benefits (including contribution to provident fund) and stock options. To compute the variable PAY, the remuneration awarded to the executives designated as CMD, CEO, Chairperson and MD has been aggregated and then divided by the total compensation awarded to the board of directors during the year; the implicit assumption behind this aggregation is the fact that these executives generally lead the board, wield significant influence and are accountable to other board members as well as the company’s shareholders.
Measuring Executive Power
Concentration of executive power provides considerable opportunity to manipulate earnings. Vesting of responsibilities of both Managing Director and Chairperson with the same individual indicates an absence of checks and balances and increases the need for monitoring. Executive power is measured using the dummy variable POWER; a value of 1 has been assigned to the executive designated as ‘CMD–Chairperson & Managing Director’ and a value of 0 has been assigned to the remaining executives.
Interaction Term
To study the interaction effects of executive remuneration and executive power on EM, the interaction variable PAY × POWER has been computed by crossing the independent variables PAY and POWER.
Control Variables
To minimise the influence of external, confounding variables, nine control variables have been included in the study, namely company size (SIZE), sales growth (GROWTH), future growth prospects (MTB), profitability (ROE), financial leverage (LEV), audit quality (BIG4), company age (AGE), capital intensity (CAP) and operating cash flows (CFO).
SIZE has been computed as the natural log of the company’s total assets at the financial year-end and is expected to have a negative association with EM activity. Large firms are less likely to engage in earnings manipulation on account of increased scrutiny from regulatory authorities (Baker et al., 2019; Chen et al., 2015; Sun, 2021). GROWTH, measured as variation in sales between year t and t−1 divided by the company’s total assets at year t, is expected to have a positive association with EM behaviour (Sun, 2021). MTB is the ratio of the adjusted closing price of a share to the book value per share; it is indicative of a higher worth placed on the company’s net assets by investors, and therefore, a positive relationship with EM activity is expected (Almadi & Lazic, 2016; Baker et al., 2019). ROE is measured using return on net worth to control for business profitability; a highly profitable firm is expected to exhibit disinclination towards earnings distortion, and therefore, a negative association with EM activity (Sun, 2021). LEV is measured using the debt–equity ratio; highly leveraged firms have a greater incentive to pursue EM; therefore, a positive relationship is expected between EM and leverage (Baker et al., 2019; Chen et al., 2015; Sun, 2021). BIG4 is a dummy variable to control for audit quality; the variable has been assigned a value of 1 if the company has been audited by a Big 4 audit firm 1 (including the affiliate firms 2 through which they operate in India) during the financial year; otherwise, the value assigned is 0. High-quality audit is likely to lower the incidence of EM behaviour (Elage & Dardour, 2021; Husni et al., 2021; Wang et al., 2021). AGE, computed as the natural logarithm of a company’s age in years, is believed to have a negative relationship with EM behaviour (Baker et al., 2019). CAP refers to capital intensity; it has been calculated as the ratio of gross property, plant and equipment to the company’s total assets and is expected to have a positive relationship with EM activity (Sun, 2021). CFO denotes cash flows generated from operations, scaled by the company’s total assets. A higher CFO reflects a strong and operationally viable business entity and is expected to be positively related to EM activity (Kalantonis et al., 2021).
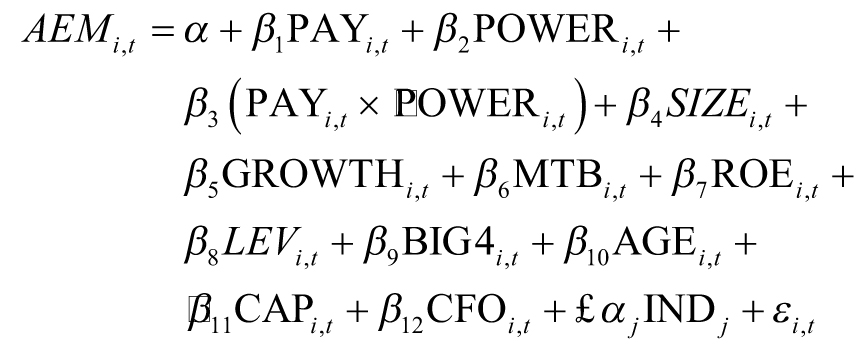
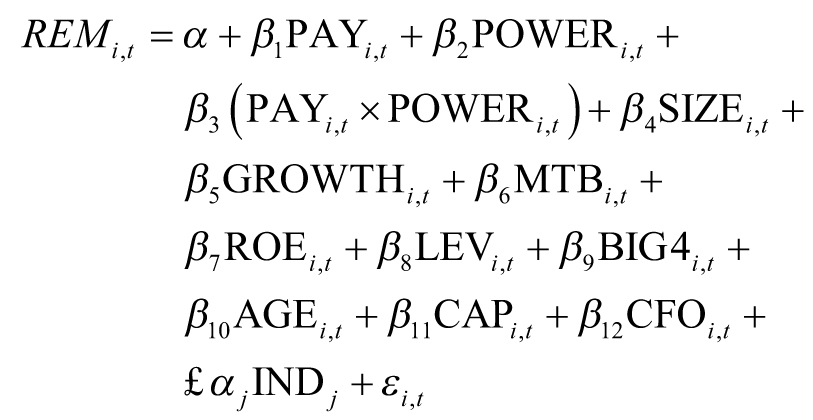
Regression Models
To test the relationship between the variables under study, the following base regression models were applied:
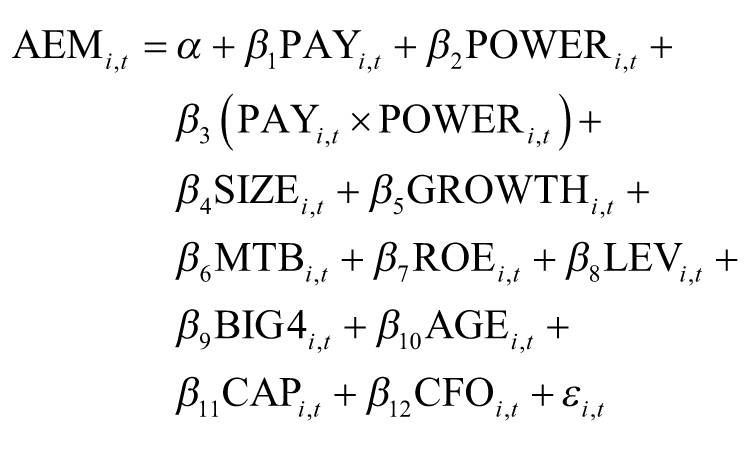
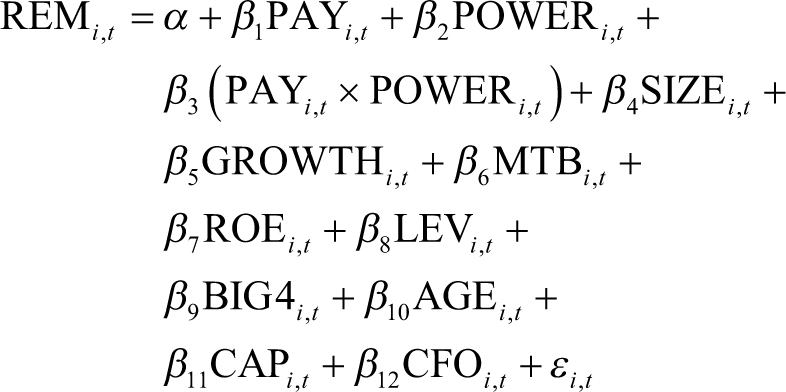
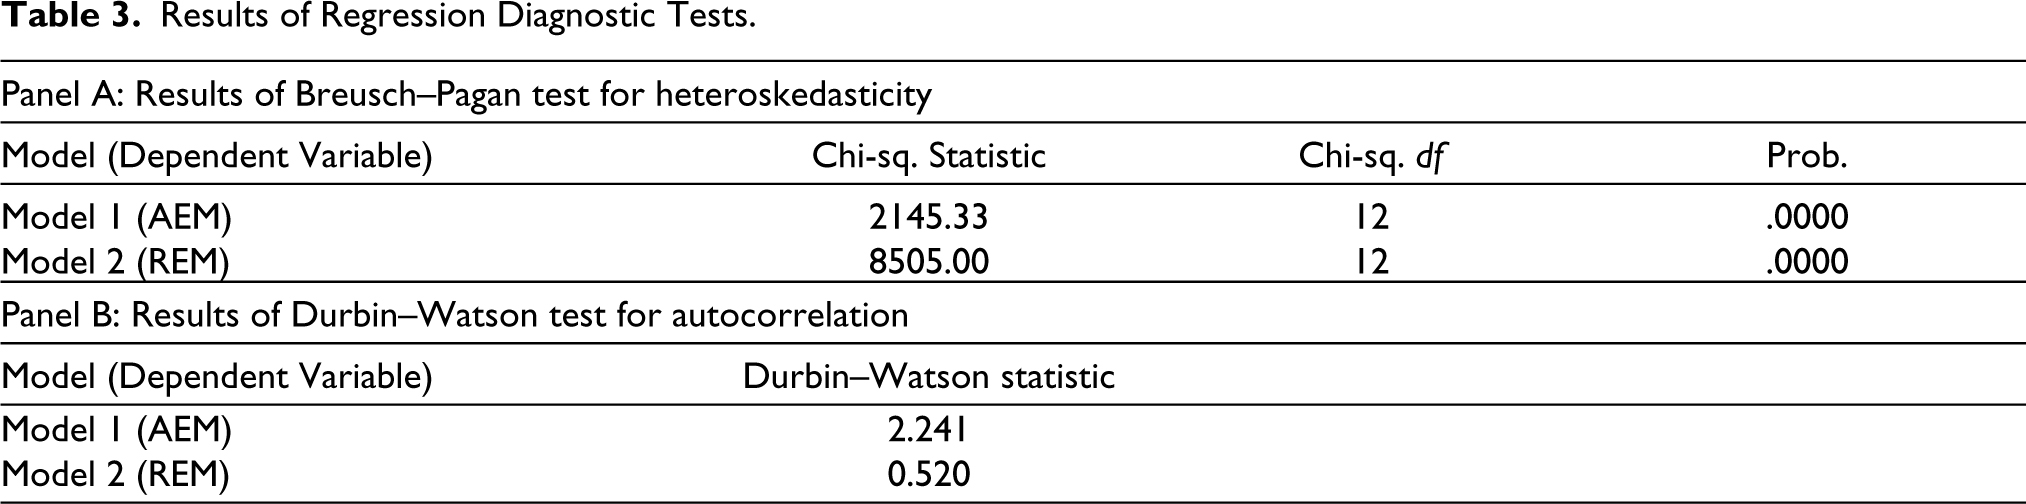
Regression diagnostics have been performed to check the validity of OLS assumptions. The outcomes of the Breusch–Pagan test for heteroskedasticity and the Durbin–Watson test for autocorrelation for both models have been presented in Table 3.
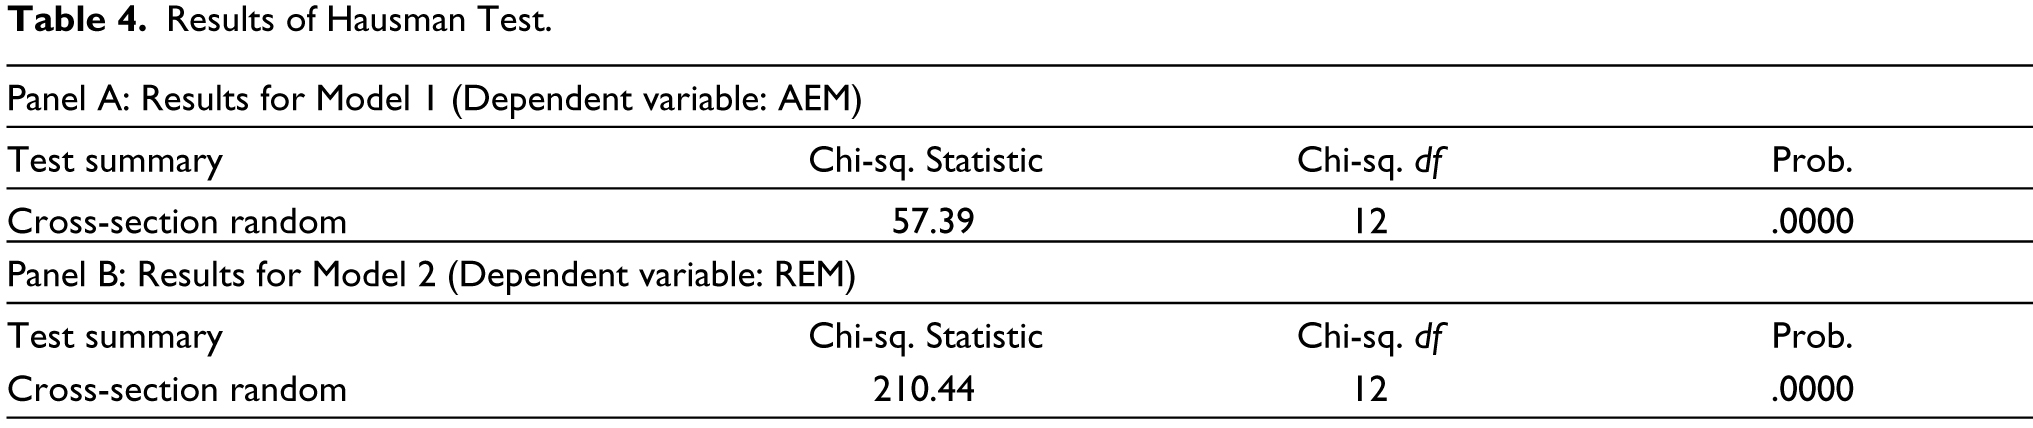
Due to violation of OLS assumptions, the Hausman test has been performed to determine whether a fixed effects or random effects regression model would be more appropriate for the analysis (Gujarati & Porter, 2009). Since the p value of the chi-square statistic for each of the two regression models under study is less than 0.05, the results presented in Table 4 suggest that the fixed effects model would be more suitable for analysis. The fixed effects model is also expected to address issues concerning endogeneity due to omitted variables.
Results of Regression Diagnostic Tests.
Results of Hausman Test.
Taking into consideration the issue of heteroskedasticity in the data, weighted least-squares (WLS) regression has been applied to the panel data, wherein each observation has been assigned a weight equal to the square of the reciprocal of the respective variance term. The variable ΣINDj has been incorporated in both models to control for the influence of industry-level fixed effects through the creation of dummy variables for 16 out of 17 industries under study.
Empirical Analysis and Interpretation
Descriptive Statistics
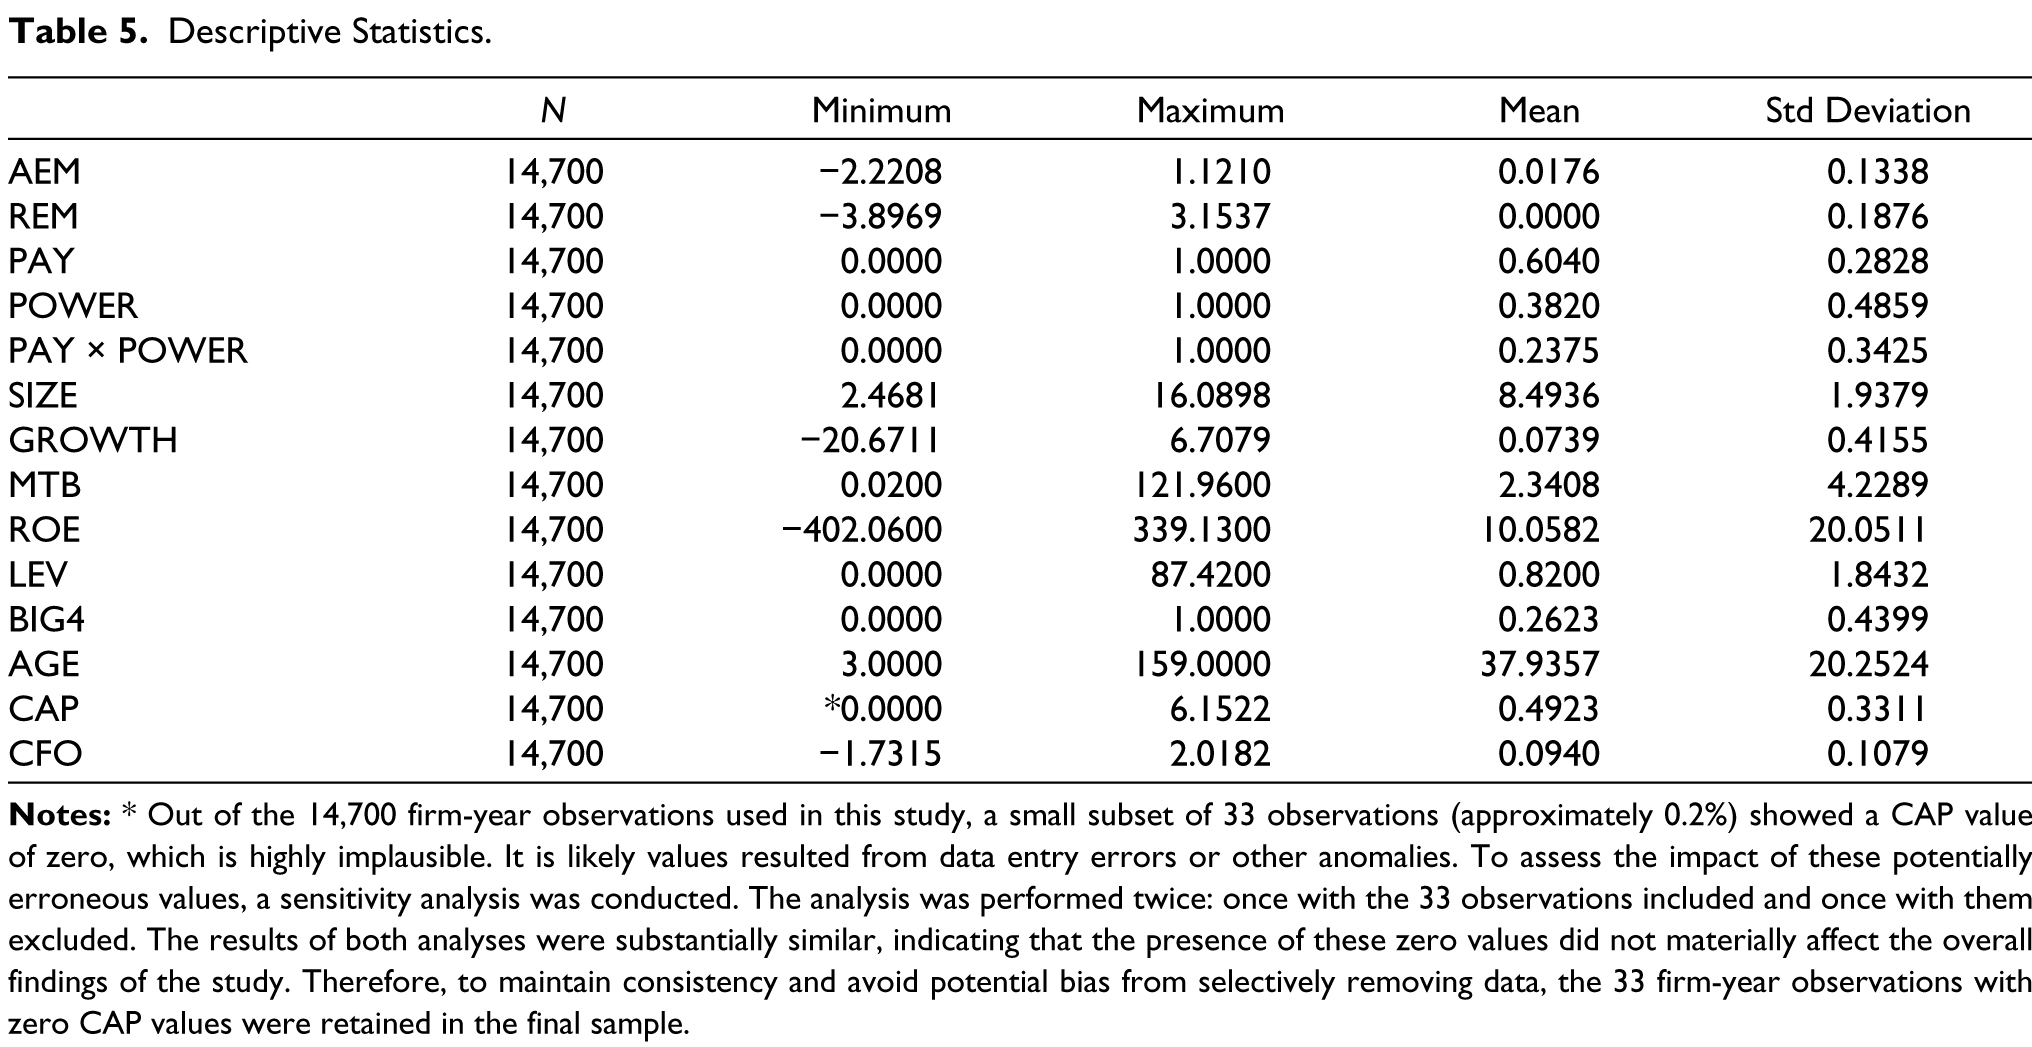
Table 5 shows the statistical descriptions of the variables examined in this panel study. It is observed that AEM ranges from −2.2208 to 1.1210, whereas REM ranges from −3.8969 to 3.1537. It is evident that REM varies over a larger range in contrast to AEM. The mean (standard deviation) values of AEM and REM are 0.0176 (0.1338) and 0.0000 (0.1876), respectively. A higher degree of variation is observed in REM in contrast to AEM. The remuneration received by the top executives ranges from as low as 0% to as high as 100% of the total remuneration paid to the board of directors. The average PAY of top executives is 60%. An average of 38% of the firm-year observations indicates the presence of a powerful director (POWER) in the dual role of Chairperson and Managing Director. With respect to the control variables, a substantial variation is observed for SIZE, MTB, ROE, LEV and AGE. The mean (standard deviation) of ROE and AGE are 10.0582 (20.0511) and 37.9357 (20.2524), respectively, indicating a very high degree of variation amongst firms in terms of profitability and age. The mean (standard deviation) of SIZE, LEV and MTB are 8.4936 (1.9379), 0.8200 (1.8432) and 2.3408 (4.2289) respectively, indicating a high degree of variation amongst firms with respect to asset size, financial leverage and investors’ assessment of firm’s worth. The mean (standard deviation) of GROWTH, CAP and CFO are 0.0739 (0.4155), 0.4923 (0.3311) and 0.0940 (0.1079), respectively, indicating a low degree of variation amongst firms with respect to sales growth, capital intensity and operating cash flows.
Descriptive Statistics.
The pairwise Pearson correlation matrix presented in Table 6 reveals a significant, positive, yet exceptionally weak correlation between PAY and POWER, indicating that both variables move in the same direction. Put differently, a powerful board executive is likely to draw a relatively higher remuneration. An exceptionally high degree of significant positive correlation is observed between the interaction term PAY × POWER and one of its constituent variables, POWER, which is expected. However, the correlation between PAY and POWER is significantly low. Multicollinearity is a serious problem when the coefficient of correlation between regressors is high, say more than 0.8 (Gujarati & Porter, 2009). Consequently, the possibility of multicollinearity is ruled out. None of the other correlations are significantly high to merit any further consideration.
Pair-wise Pearson Correlation Matrix.
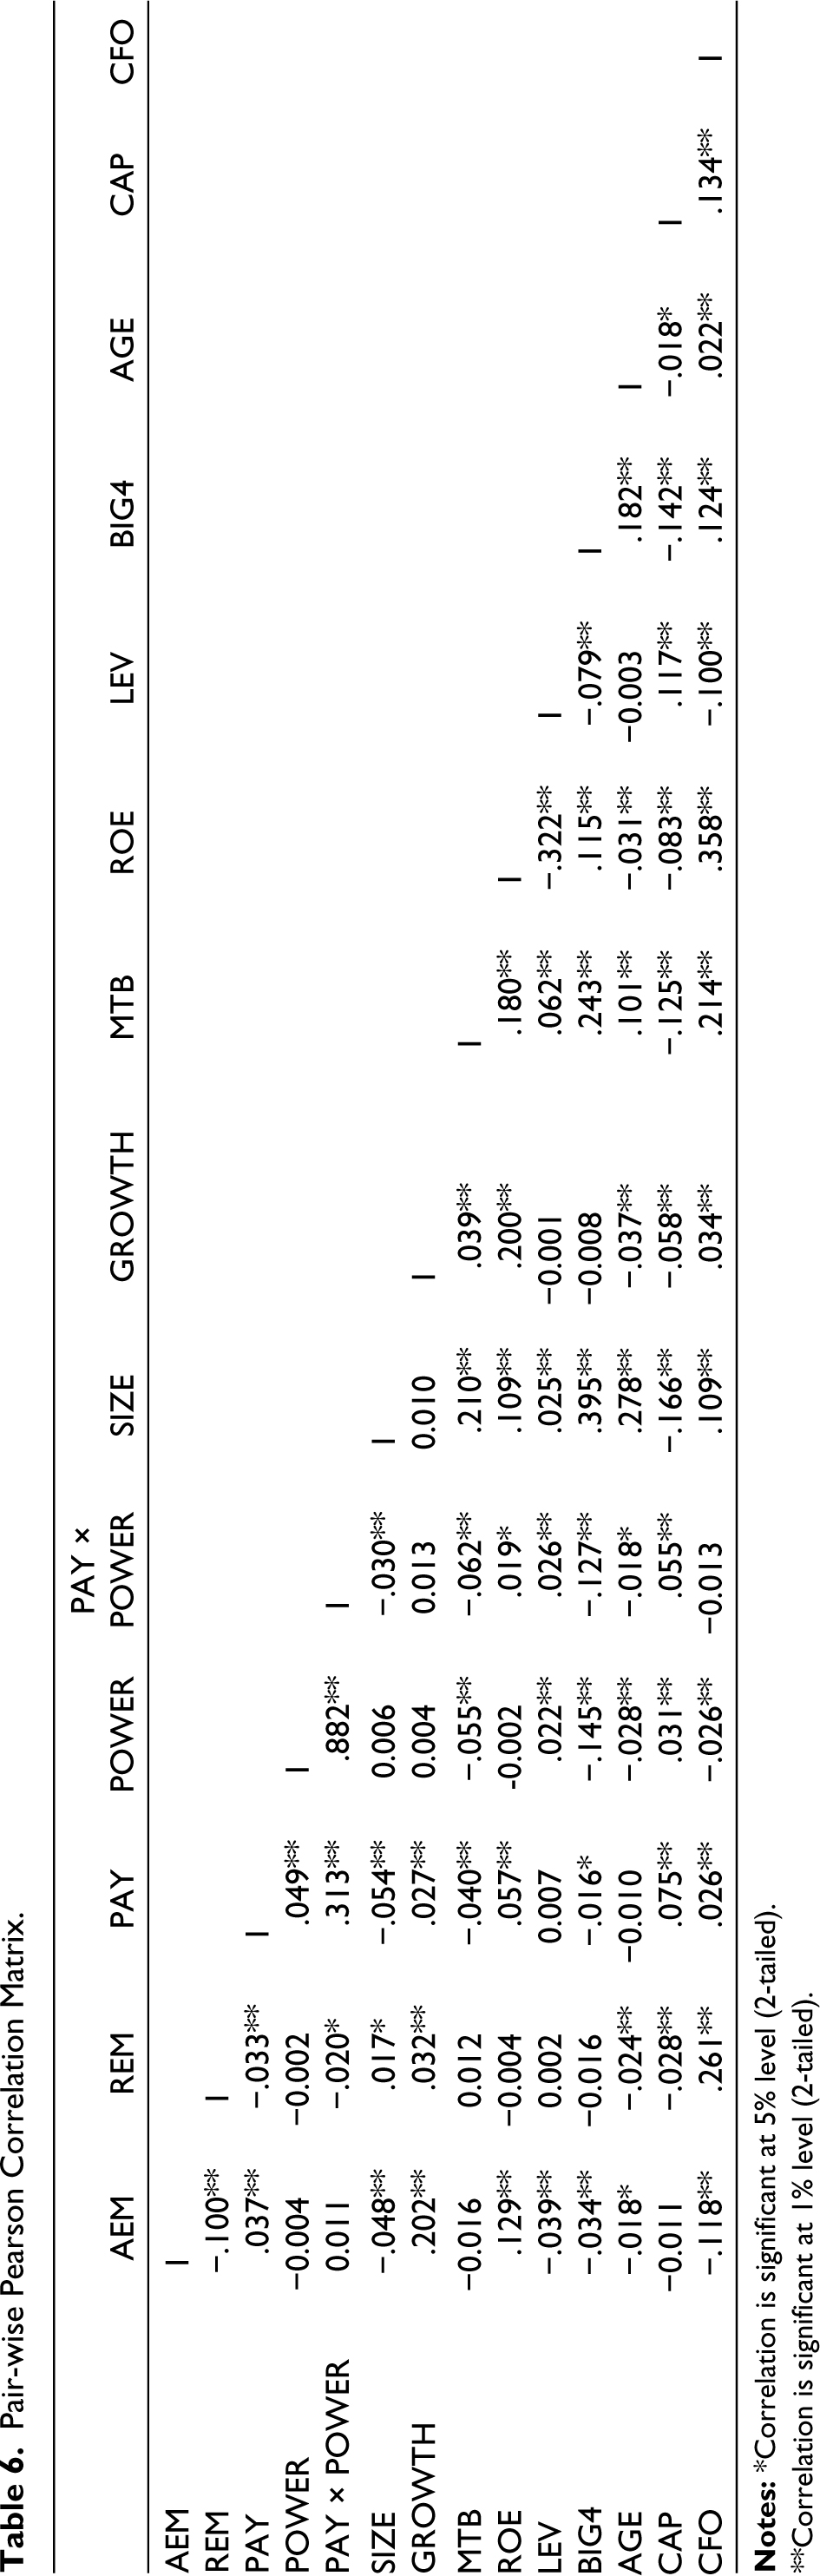
**Correlation is significant at 1% level (2-tailed).
Analysis of Regression Results
The results of the WLS regression of the models specified in Equations (4.1) and (4.2) have been shown in Table 7. The regression outcome for Model 1 reveals R2 value of 66.77%, indicating that the specified model explains 66.77% of the variations in AEM. The regression outcome for Model 2 reveals R2 value of 90.91%, indicating that the specified model explains 90.91% of the variations in REM. With respect to explanatory power, Model 2 is observed to be superior to Model 1.
Results of WLS Regression of the Fixed Effects Models.
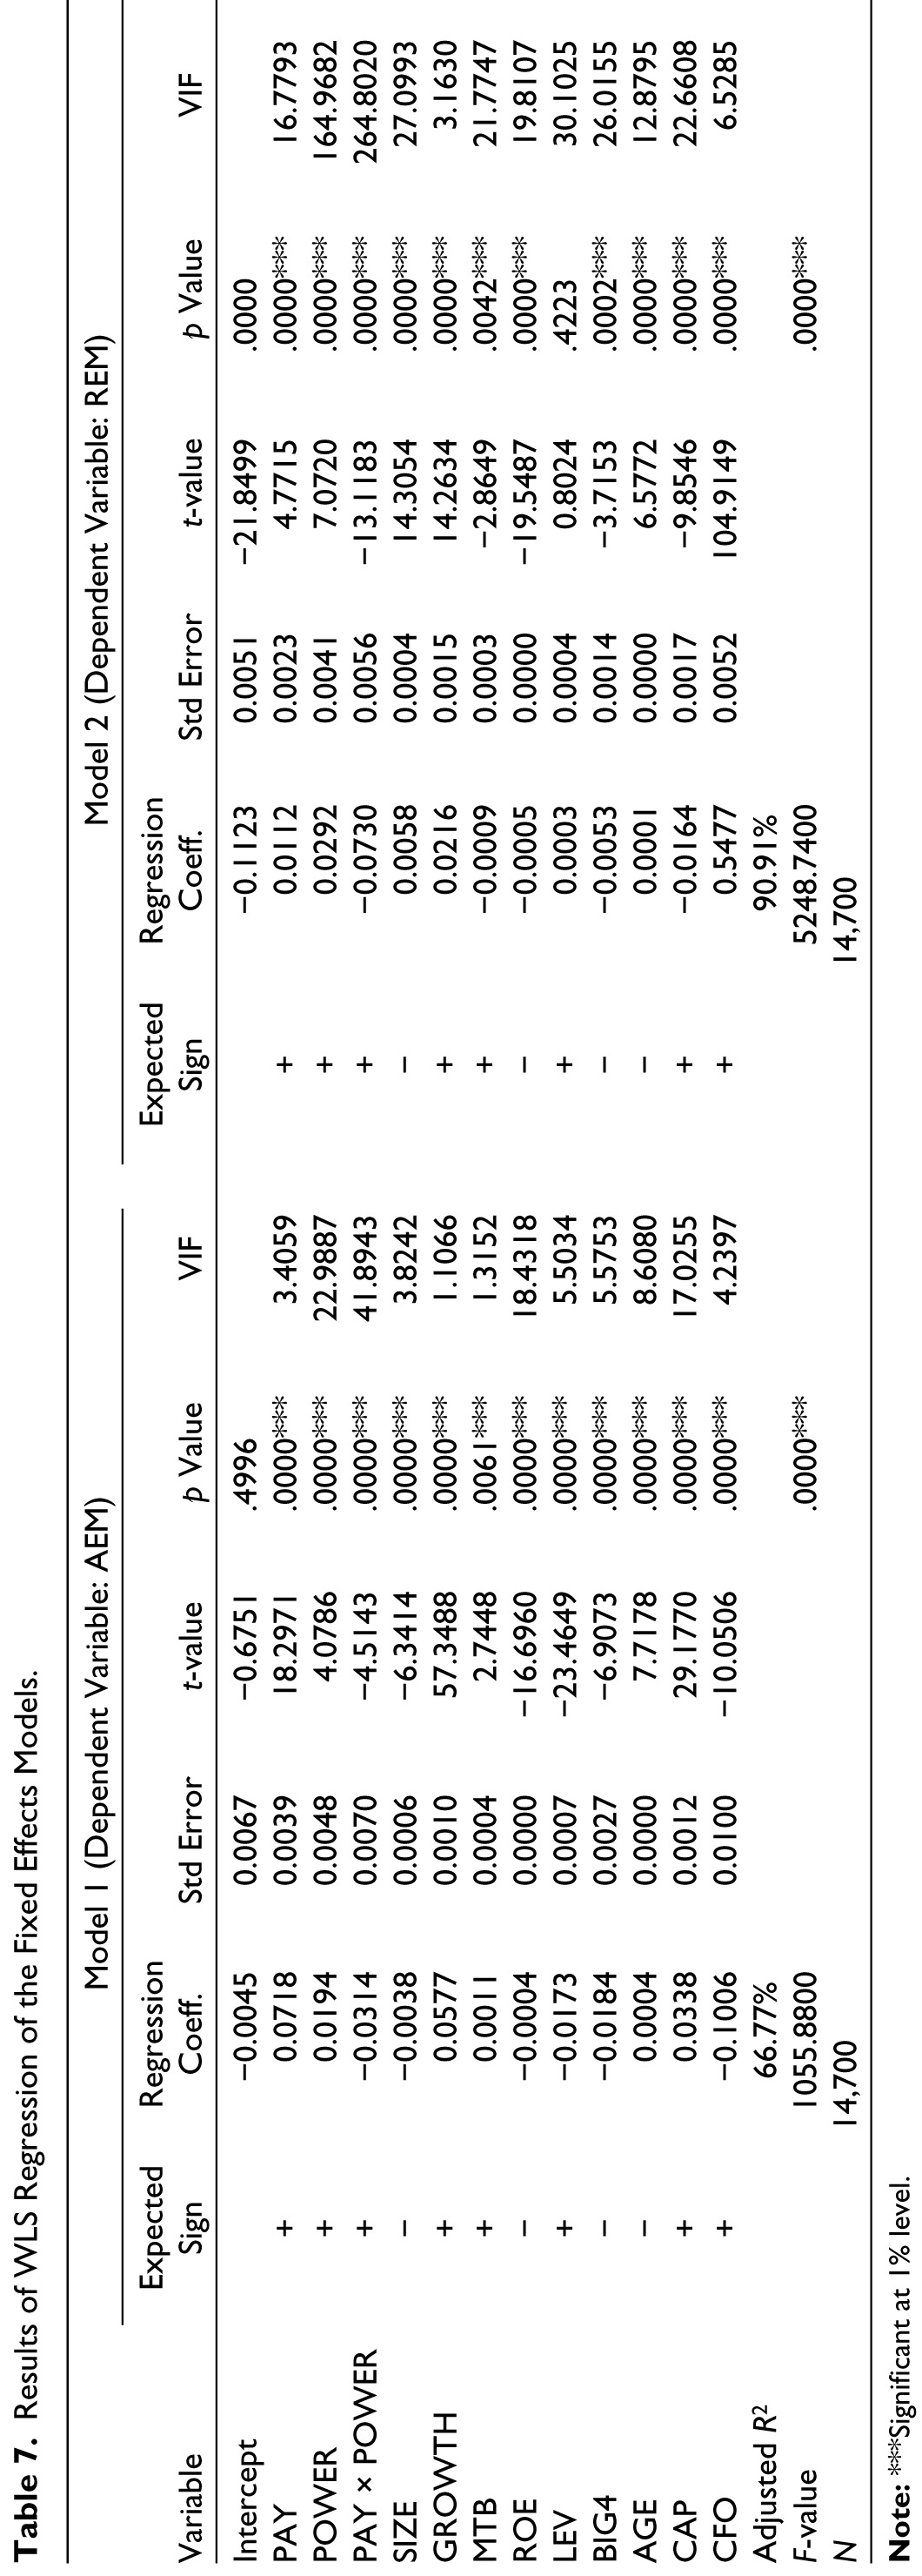
The analysis reveals a statistically significant impact of PAY on both AEM and REM (p < .01). POWER also exhibits a statistically significant effect on both AEM and REM (p < .01). Critically, the interaction term between PAY and POWER is also significant at the 1% level for both AEM and REM, indicating a combined influence.
The results reveal a positive and significant association between AEM and PAY. This outcome corresponds to the results reported by Chen et al. (2015), Assenso-Okofo et al. (2020) and Sun (2021) but is in contradiction to the results reported by Wang et al. (2021). Consistent with the observations of Elage and Dardour (2021) and Wang et al. (2021) but contrary to the observations of Chen et al. (2015), the findings reveal a positive relationship between REM and PAY at 1% level of significance. Accordingly, both H1a and H1b stand accepted.
The association between AEM and POWER is observed to be positive and significant at 1%. This outcome is in agreement with the outcomes reported by Oussii and Klibi (2023) but in contradiction to the findings of Kalantonis et al. (2021). The results show POWER to have a positive and significant association with REM at 1%. This finding is in agreement with the observations of (Zhou et al., 2018) but in contrast to the observations of Elage and Dardour (2021). Accordingly, both H2a and H2b are accepted.
The interaction effect of PAY and POWER on AEM is negative with a significance level of 1%, indicating a significant negative relationship between AEM and the presence of well-paid powerful board executives, and thus H3a is rejected. The interaction effect of PAY and POWER on REM is negative and significant at 1% and accordingly, H3b stands rejected.
Amongst the control variables, the association of GROWTH and AGE with both AEM and REM is significant and positive, whereas the association of ROE and BIG4 with both AEM and REM is significant and negative. Both MTB and CAP have a positive, significant association with AEM, but a negative, significant association with REM. SIZE and CFO have a negative, significant association with AEM, but a positive, significant association with REM. LEV has a significant, negative relation with AEM, but an insignificant positive association with REM.
Multicollinearity Concerns
Multicollinearity occurs on account of high correlations among independent variables. As a rule of thumb, variance inflation factor (VIF) in excess of 10 signifies severe multicollinearity, especially if the R2 value exceeds 0.90 (Gujarati & Porter, 2009). However, the magnitude of VIF is of limited use when the standard errors are within bounds (Wooldridge, 2013). A high VIF is expected in the case of categorical variables (especially those with a small proportion of the reference category) and interaction terms. High correlation between independent variables and other variables in the model, such as control variables and fixed effects dummy variables, may lead to high VIF values (Allison, 2012). Consequently, the possibility of multicollinearity is ruled out.
Test of Robustness
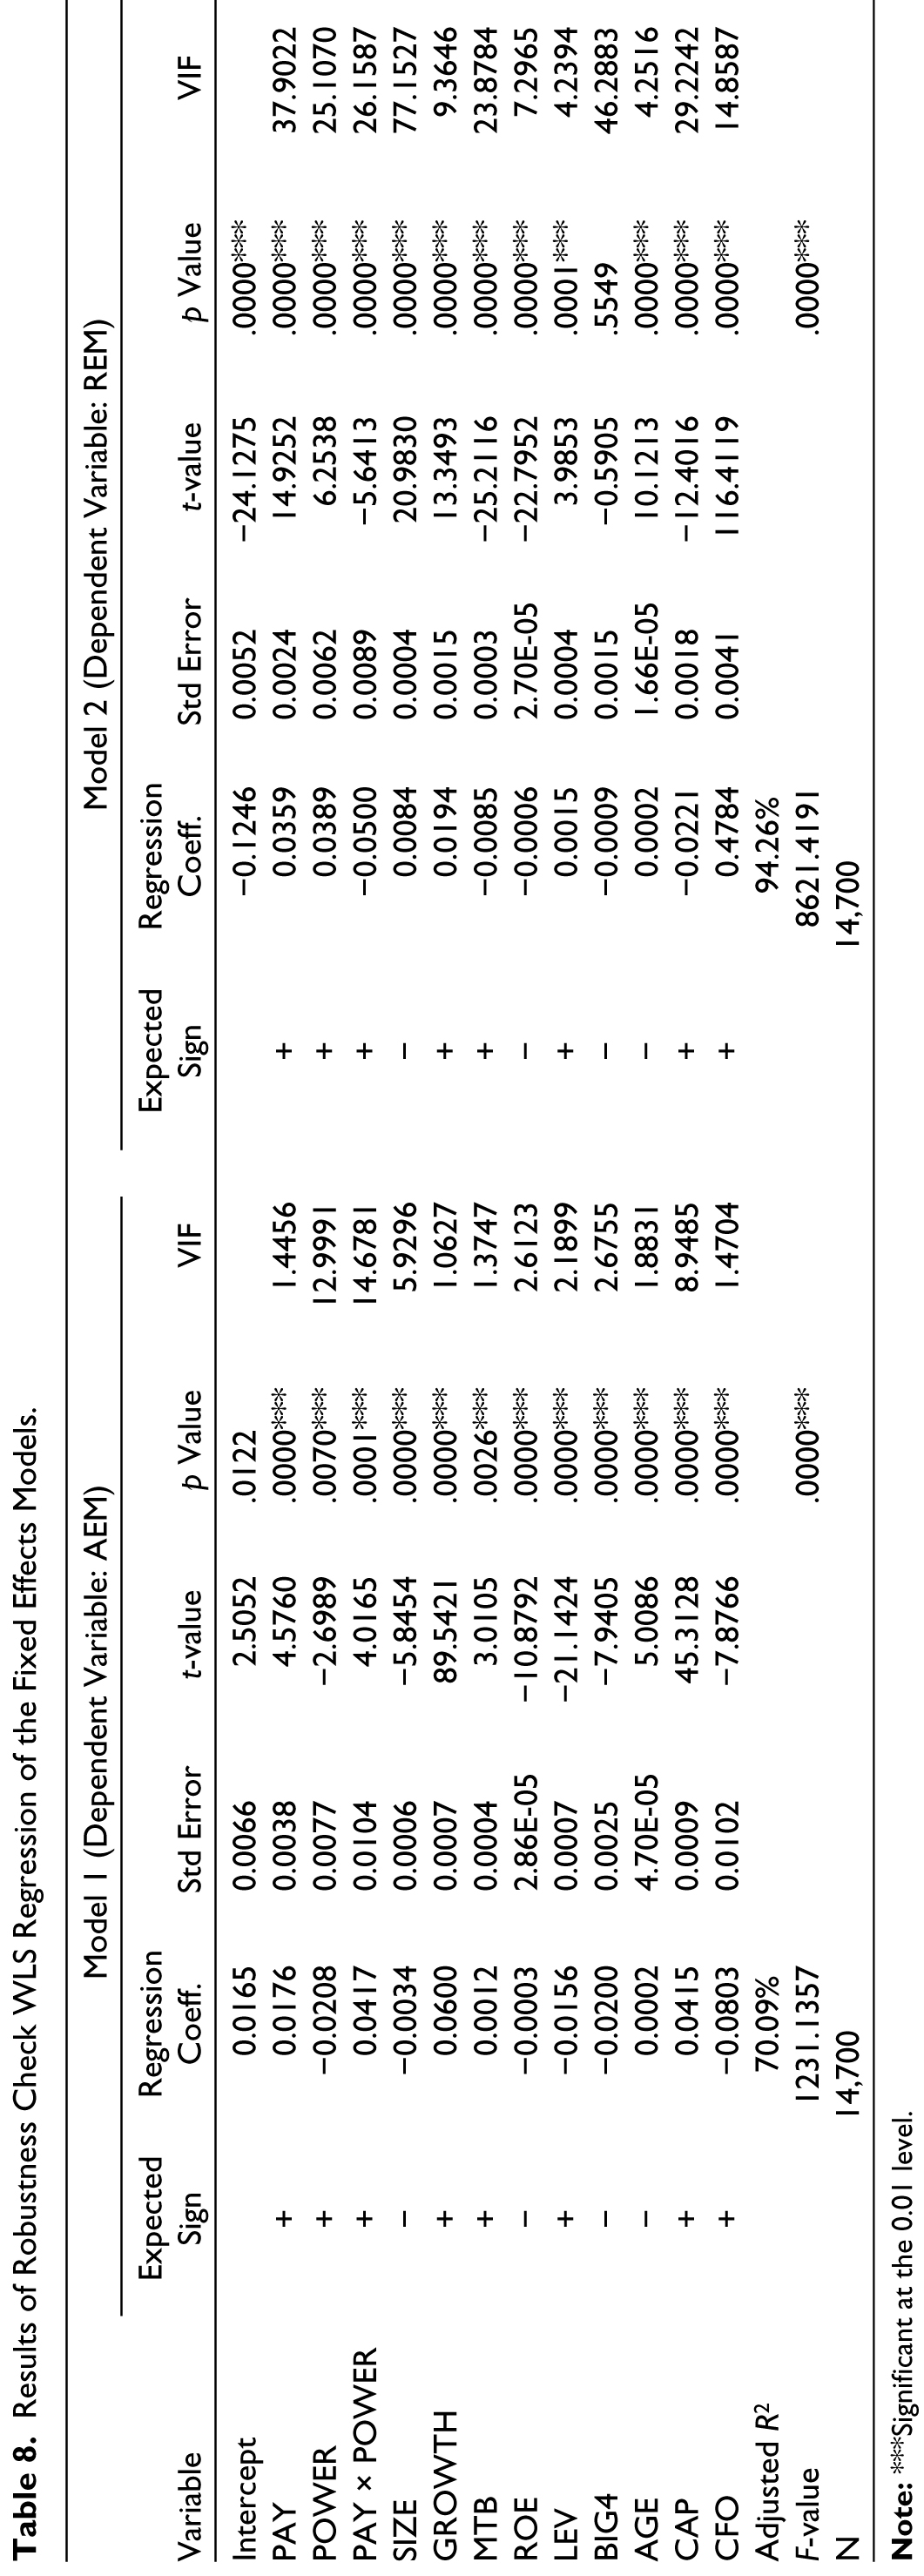
As a robustness check, executive power has been alternatively measured in terms of the likelihood of collusion between the CMD and another powerful executive on the board of directors. In addition to the CMD, a director designated as CEO, Chairperson and MD has been considered as a powerful board executive. Accordingly, the dummy variable POWER has been assigned a value of 1 if there is at least one more powerful executive on the board in addition to the CMD, and a value of 0 has been assigned in the remaining cases (including cases where CMD is the sole powerful executive on the board).
The outcomes of the robustness check have been presented in Table 8. These findings are in agreement with the results of the main regression models applied in this article as regards the significant relationship of PAY, POWER and the interaction term with both AEM and REM and the explanatory power of both models. REM is observed to have a significant positive association with PAY and POWER, and a significant negative association with the interaction term. With respect to AEM, the results are similar as regards the significant positive association between AEM and PAY. With respect to control variables, the results are similar as regards the signs of the coefficients and their significance.
Results of Robustness Check WLS Regression of the Fixed Effects Models.
Conclusion and Recommendations
This research explores the complex interplay between executive pay, power and EM within Indian firms. The study reveals a nuanced relationship: while both executive pay and power individually incentivise EM, their combined presence appears to mitigate it. Although positively associated with both AEM and REM, higher executive compensation alone is insufficient to align managerial and firm interests. This finding has implications for executive compensation design, suggesting the need to link executive compensation to long-term value creation rather than short-term earnings. Consistent with agency theory, greater executive power is positively associated with both forms of EM, indicating that powerful board executives resort to EM to achieve their personal interests at the expense of the firm’s interest. This necessitates stronger governance mechanisms, such as independent boards and active shareholder participation, to counterbalance executive power. The interaction effect between executive pay and executive power is revealed to have a significant negative association with both AEM and REM. This result is noteworthy, since the individual effects of executive pay and executive power on EM behaviour are observed to be significant and positive. This finding suggests powerful, well-compensated executives may feel less pressure to manipulate earnings due to job security or access to legitimate goal achievement, thereby highlighting the managerial implication of balancing executive power and compensation to reduce EM propensity.
The research also finds that large firms with strong operational cash flow mitigate the negative consequences of REM but derive little benefit from AEM. Firm age and sales growth are positively associated with both forms of EM, while profitability and high-quality audits deter both. Capital-intensive firms favoured by investors tend towards AEM and away from REM, likely due to the value-destructive nature of the latter. Debt covenants associated with high leverage appear to restrain AEM but show an insignificant impact on REM.
While insightful, the findings of this study are not devoid of limitations. First, the focus on Indian companies limits the generalisability of the outcomes to economies characterised by different corporate governance systems and regulatory environments. Second, while the study examines the interaction of executive pay and power, the specific measures used to quantify these constructs may influence the results. Alternative models may be used to estimate EM, and alternative measures of executive power, such as textual analysis of SEBI filings and executives’ tenure, may be explored. Future research may also incorporate qualitative insights and investigate other governance mechanisms.
Footnotes
Declaration of Conflicting Interests
The authors declared no potential conflicts of interest with respect to the research, authorship and/or publication of this article.
Funding
The authors received no financial support for the research, authorship and/or publication of this article.