
Abstract
This article investigates the symmetrical and asymmetrical linkage between gold prices and the Indian stock market in the presence of structural breaks. The study covers a time frame from April 1993 to December 2019. The study employs both linear autoregressive distributed lag (ARDL) and non-linear ARDL (NLARDL) models. The major findings of the study are as follows: first, both the ARDL and NLARDL models indicate the co-movement of gold prices and the Indian stock market. Second, based on the long-run parameters of both the models, the long-run relationship between the variables could not be established. Third, short-run parameters show that positive shocks in gold prices depress the Indian stock market; however, negative shocks in gold prices have a positive but insignificant relationship with the Indian stock market. The asymmetric reaction of the Indian stock market will yield new insights for investors, fund managers, and policymakers.
Keywords
Introduction
The Indian economy’s globalization and liberalization have led to a series of remarkable transformations in the Indian stock market, thereby promoting its progress (Bhattacharjee & Das, 2021; Mishra, 2010; Patel, 2019). Nevertheless, the Indian stock market is exposed to a wider range of circumstances compared to developed stock markets in Western nations (Bhattacharjee & Das, 2020). Research conducted to ascertain the factors that influence stock prices has revealed that a set of factors governs the intrinsic value of a stock. A corporation’s risk exposure, profitability, and growth rate, each exert a significant impact on its stock price. The determination of the aforementioned factors is contingent upon the macroeconomic milieu, the industry, and the underlying company fundamentals. The literature in the field of finance underscores the influence of precious metal prices on stock prices. Precious metals, including but not limited to gold, silver, and platinum, possess a rarity and a considerable economic value. Gold, in particular, serves as both a medium of exchange and a commodity (Bhunia & Das, 2012), functioning as a store of wealth, a monetary unit, and a means of exchange (Bildirici & Turkmen, 2015).
Gold has historically functioned as an indicator of inflation, a safeguard against inflation, a critical component of portfolio allocation, and a factor in crises since it acts as a hedge to diversify the market’s escalated risk during crises. Diversification and economic protection are the reasons why central banks and international financial institutions tend to maintain significant quantities of gold. An asset is considered as a hedge if it is uncorrelated or negatively correlated with another asset on average (Chkili, 2016). Gold exhibits a low correlation with financial assets, signifying that incorporating it into an investment portfolio would effectively curtail the overall risk associated with the portfolio (Areal et al., 2013). Chkili (2016) demonstrated that the inclusion of gold in an investor’s portfolio reduces portfolio risk without affecting the anticipated return.
India is counted among the 10 countries that possess gold. In addition to serving as a hedging tool, gold is regarded as a symbol of prestige in India. Furthermore, gold is procured in substantial amounts during festival and wedding seasons, as it is thought to bring good luck and happiness to married couples. In India, there exist a range of gold investment alternatives, notably, gold ETFs that invest in physical gold, bullion, and E-gold schemes; gold sovereign bonds regulated by the Reserve Bank of India; and gold mutual funds, among others.
Given the aforementioned background, the objective of this article is to analyse the long-term and short-term linkage between the prices of gold and the Indian stock market, in both symmetrical and asymmetrical settings. Earlier studies in the Indian context have shown inconclusive results, and most of the studies have investigated using a linear approach. However, Sheikh et al. (2020) and Asad et al. (2020) showed that the relationship between gold price and stock market can be non-linear, and hence, advance non-linear time series methods should be employed to effectively study the linkage. This research initiative will bridge this gap and investigate the linkage employing both linear autoregressive distributed lag (ARDL) and non-linear ARDL (NLARDL) models. This model will answer three key questions: (a) whether a long-run equilibrium relationship exists between the variables; (b) what is the relationship between the variables in the long run; and (c) what is the relationship between the variables in the long run? The outcomes of this study are poised to be highly beneficial to investors, fund managers, and policymakers in their decision-making process.
The latter part of this research entails a comprehensive review of the existing literature and the identification of any potential research gaps. The data and econometric methodologies employed in this study are thoroughly discussed in the third section. The empirical conclusions are presented in the fourth section, while the fifth section provides the concluding remarks.
Literature Review and Research Gap
Wanat et al. (2015) investigated the causation in distribution between European stock markets and commodity prices using an independent test based on the empirical copula (gold and oil prices). The researchers discovered that there is an asymmetrical and inconsistent relationship between European stock markets and gold prices over time. They arrived at the conclusion that European stock market investors perceive gold as a ‘safe haven.’ Linear ARDL was used by Gokmenoglu and Fazlollahi (2015) to investigate the relationships between gold, oil, and the US stock market. The findings revealed that gold has the greatest impact on the US stock market and that investors react to changes in gold price over time. The authors came to the conclusion that short-term volatility had little impact on investor mood.
Chen and Lin (2014) investigated the relation between gold and stocks prices in severe bear market and found gold to be a good investment instrument for hedging stock market risk in bear markets for small-cap stocks. Tursoy and Faisal (2018) found a negative link between gold prices and the Turkish stock market using multivariate linear modeling. They went on to say that information on gold prices can be utilized to anticipate the Turkish stock market in the short term. Shabbir et al. (2020) used annual data using linear ARDL to investigate the impact of gold and oil prices on Pakistan’s stock market. In the long run, their data revealed that the stock market and gold prices are positively associated. Their empirical study, however, was unable to establish a short-run link.
In the Indian context, Mishra et al. (2010) applied a linear approach to study the linkage between gold price volatility and the Indian stock market returns during January 1991 to December 2009. Their findings supported the fact that gold prices and the Indian stock market were cointegrated and a bi-directional causality exists between the variables. However, Srinivasan (2014) found no long-run co-movement between the Indian stock market and gold prices. The findings of Bhuvaneshwari and Ramya (2017), who used sample data from January 2011 to December 2015, support the results of Srinivasan (2014). They concluded that the past values of gold prices cannot be used to predict the movement of the Indian stock market. Bhunia and Das (2012) employed the Johansen cointegration test, vector error correction model (ECM), and granger causality test and observed the presence of cointegration and feedback mechanism between domestic gold prices and the Indian stock market. The authors concluded that Indians consider gold both as jewelry and as an important investment mode. Ansari and Sensarma (2019) examined the influence of gold prices, US monetary policy, and oil prices on the stock markets of BRICS nations and found that the Indian stock market index does not respond to changes in oil or gold prices; however, a positive linkage was observed between federal fund rates and the Indian stock market index.
The literature on the relationship between gold and the Indian stock market is mixed. Furthermore, the current literature primarily examined the link between gold prices and the Indian stock market using symmetrical models. According to a recent study, gold prices have a non-linear relationship with the stock market. Investors react differently to positive and negative shocks connected with gold prices, according to Sheikh et al. (2020) and Asad et al. (2020). Furthermore, a vast majority of articles do not take structural breaks into account when modeling. When structural breaks are ignored in modeling, the risk of parameter instability rises (Johansen et al., 2000). Thus, the current study contributes to the finance literature in the following ways: (a) it identifies structural breaks in the dependent variable and considers them in econometric modeling and (b) it uses NLARDL to investigate the asymmetrical linkage between gold prices and the Indian stock market index. Kumar et al. (2021) and Nusair and Olson (2021) support the use of the NLARDL model to study the asymmetrical linkage between variables.
Data and Methodology
Data and Its Source
The present research work used monthly data for SENSEX (proxy for the Indian stock market) and international gold price (unit: USD per troy ounce) from April 1993 to December 2019. The Reserve Bank of India website provided sample data on the Indian stock market, while Indiastat.com provided data on gold prices. Due to the lack of a reliable dataset, we did not use daily data.
Methodology
The current study investigates the symmetric and asymmetric link between the Indian stock market and gold price using the ARDL and NLARDL models.
We applied the augmented Dickey-Fuller (ADF) test, Phillips-Perron (PP) test, and Andrew-Zivot (AZ) test to determine the stationarity status of the variables (which allows for one structural change in the dataset). Furthermore, we used the Brock-Dechert-Scheinkman (BDS) test to see if gold price (independent variable) is linearly dependent. The BDS non-linearity test in its most general form is as follows:
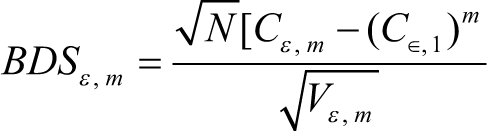
Where
We set the null hypothesis: Dataset is linearly dependent against the alternative hypothesis: Dataset is not linearly dependent.
There are two stages in the ARDL method. In the first stage, an F-test is used to assess the long-run linkage using an ECM. If the computed F-statistic is less than the lower bound value, no cointegration between the variables is inferred. It is concluded that the cointegration between the included variables is inconclusive if the computed F-statistic is between the lower and upper bound values. If the F-statistic value is larger than the upper bound value, cointegration is said to exist. It is to be noted that the variables involved in ARDL modeling should be integrated of order 1 or less.
The general form of the ECM in the linear ARDL model is as follows:
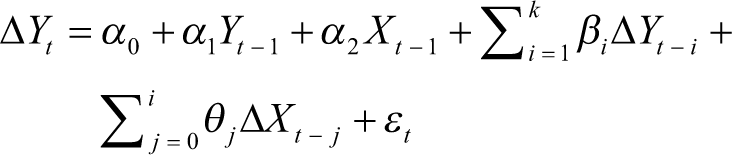
Where
For the NLARDL model [proposed by Shin et al. (2014)], a gold price series is decomposed into positive shocks and negative shocks. The cointegrating regression equation of the NLARDL model can be represented as follows:
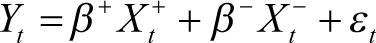
Where
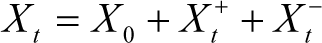
Thus, fluctuation in gold prices can be decomposed in the following way:
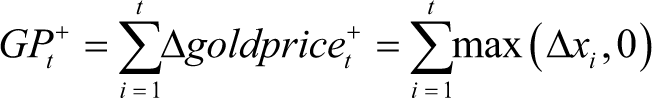
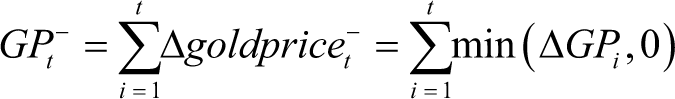
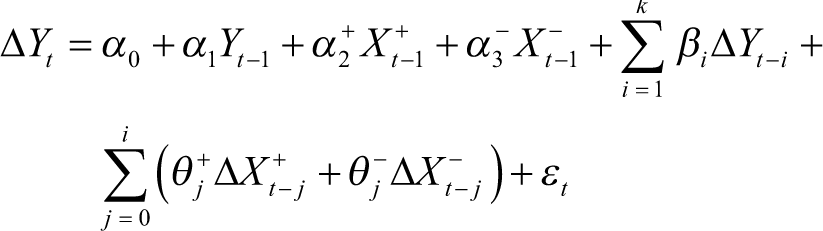
Combining Equation (1) and Equation (2), the ECM in the NLARDL model can be written in the following way:
Further, in order to capture the adjustment asymmetry, we have computed the dynamic multipliers.
Empirical Analysis
Results of Unit Root Test, BDS Test, and Bai-Perron Multiple Break Point Test
At first, we employed the ADF test and PP test to examine the order of integration of the SENSEX series and GP series. The lag length for the unit root tests was determined using the AIC. The results of the ADF test, PP test, and AZ test are similar, that is, all the time series are integrated of order 1 (refer to Table 1). Order 1 integration means that variables attain stationarity when differenced one-time. For the details of the descriptive statistics, refer to Table A1 in the appendix.
Unit Root Test.
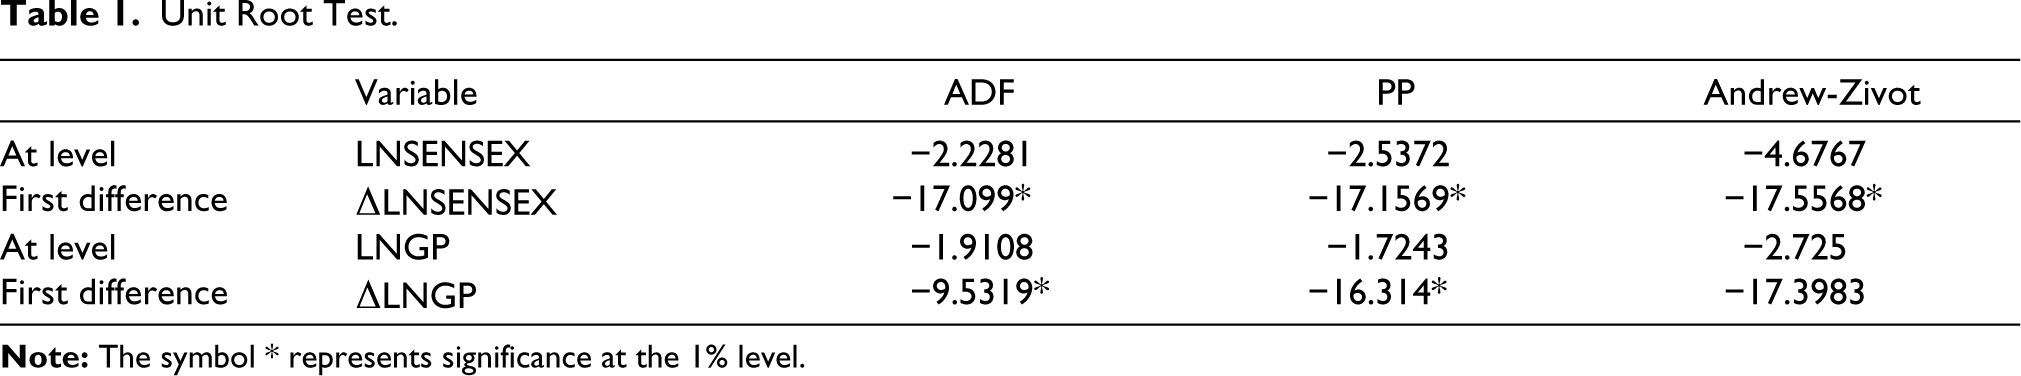
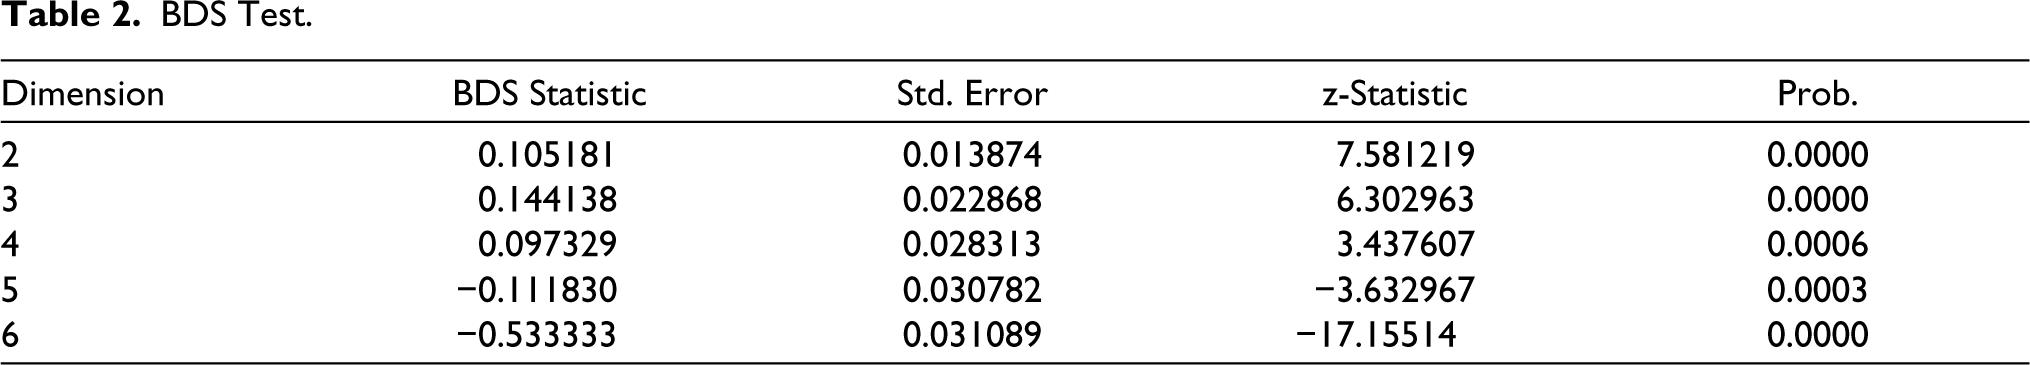
Table 2 reports the results of the BDS test for the LNGP series. The test indicates the non-linear dependencies of the datasets. If the BDS statistic is less than the critical values, then the null hypothesis of linear dependency cannot be rejected. To put it another way, the linear ARDL model is better for modeling. The null hypothesis of linear dependency can be rejected if the BDS statistic is greater than the critical values. The null hypothesis was rejected, indicating that the NLARDL model is more suitable for the modeling. From Table 2 it is clear that the BDS statistic is statistically significant, implying that the null hypothesis can be rejected. As a result, the NLARDL model is more suited to the current research. However, in order to give a comparison analysis, we used both the ARDL and NLARDL models in the current work.
BDS Test.
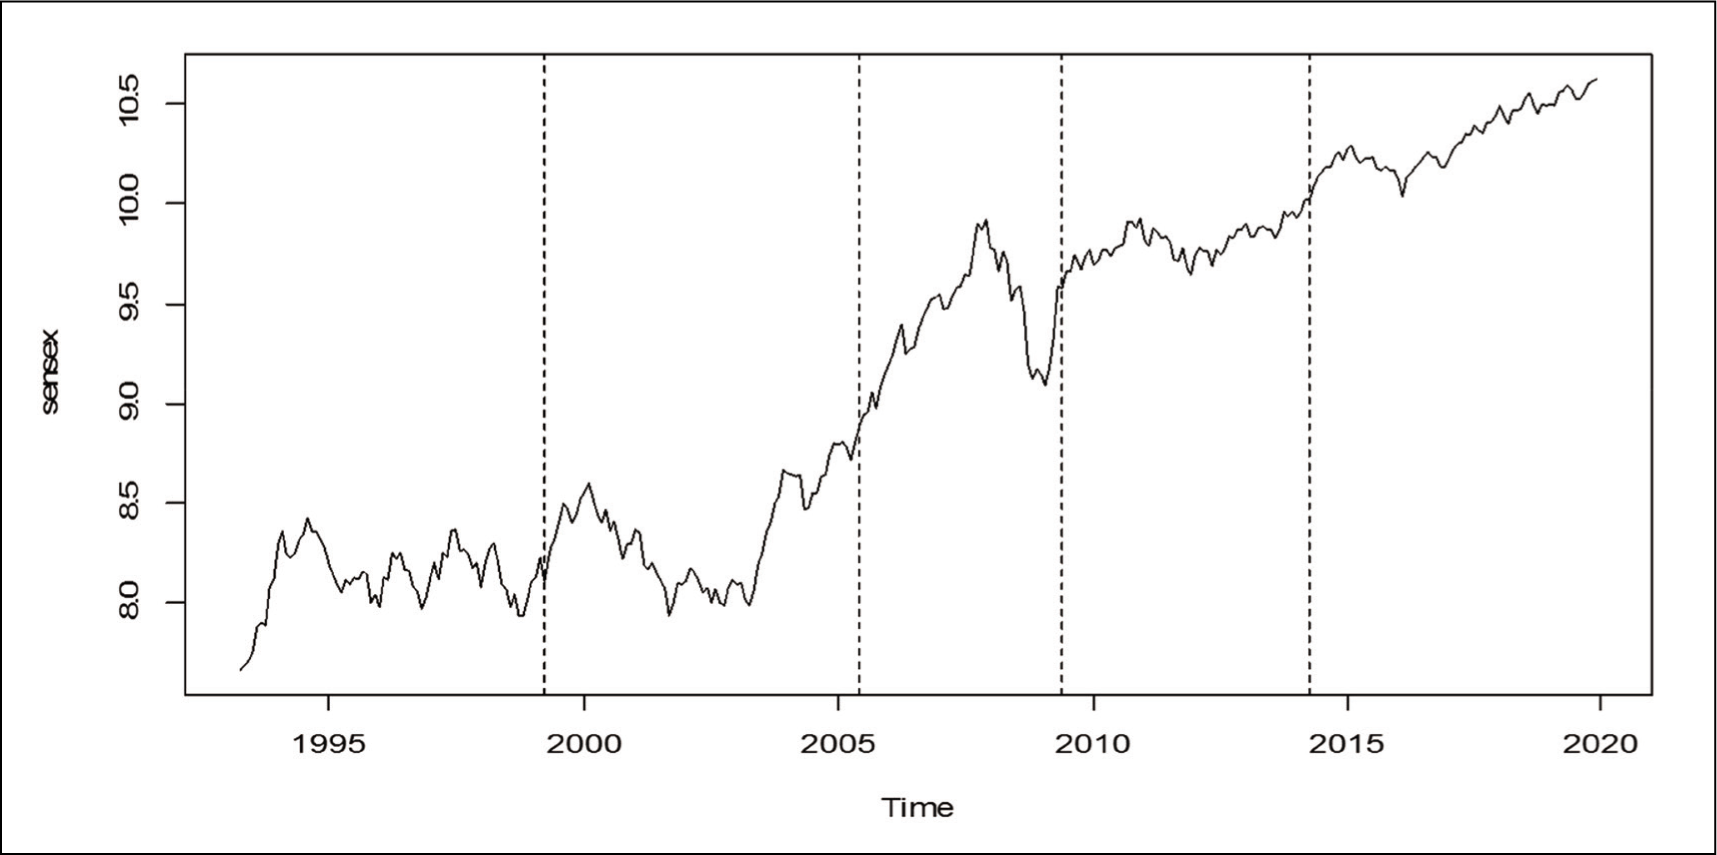
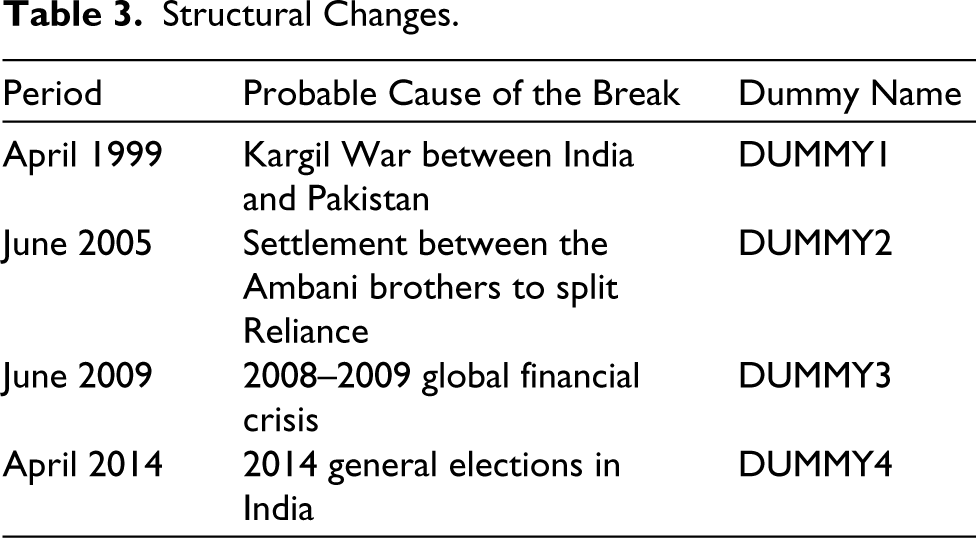
We used both symmetrical and asymmetrical models in our research, as did Okere et al (2021). Based on the findings of the AZ unit root test, we identified that the LNSENSEX dataset has at least one structural change. The BP multiple break point test was carried out to find several structural changes in the LNSENSEX dataset. Multiple structural changes in the ECM can culminate into parameter instability as well as an alteration in the long-run coefficients (due to the dependency of the long-run coefficients on the ECM). Thus, inclusion of the structural changes in the model can avoid such problems. The output of the BP multiple break point test identified four structural breaks in the LNSENSEX dataset (see Figure 1). The structural changes are at April 1999, June 2005, June 2009, and April 2014 (see Table 3 for details). We have created four different types of binary dummy variables and included them in both ARDL and NLARDL models.
Plot Based on Bai-Perron Multiple Break Point Test.
Structural Changes.
F-bound Test, Long-run Parameters, and Short-run Dynamics
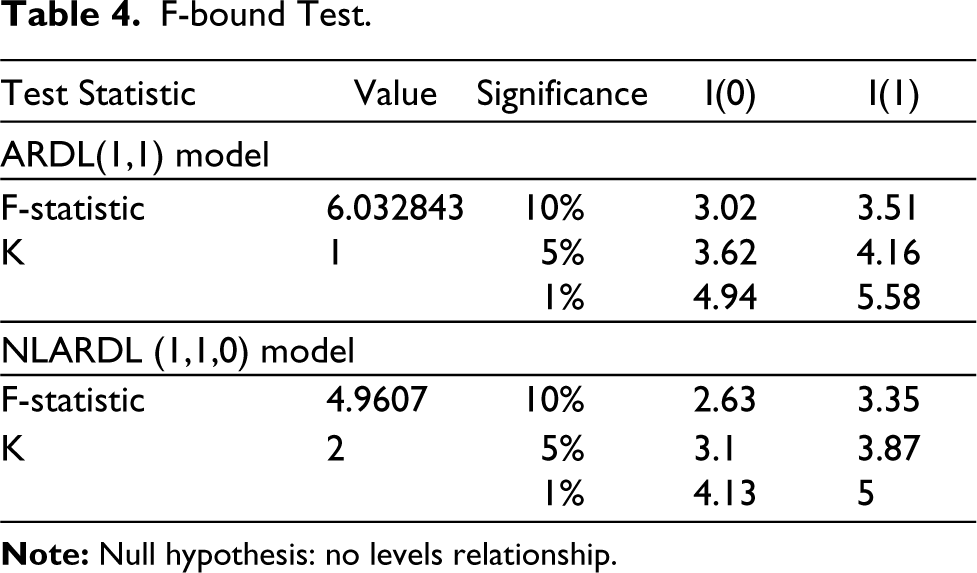
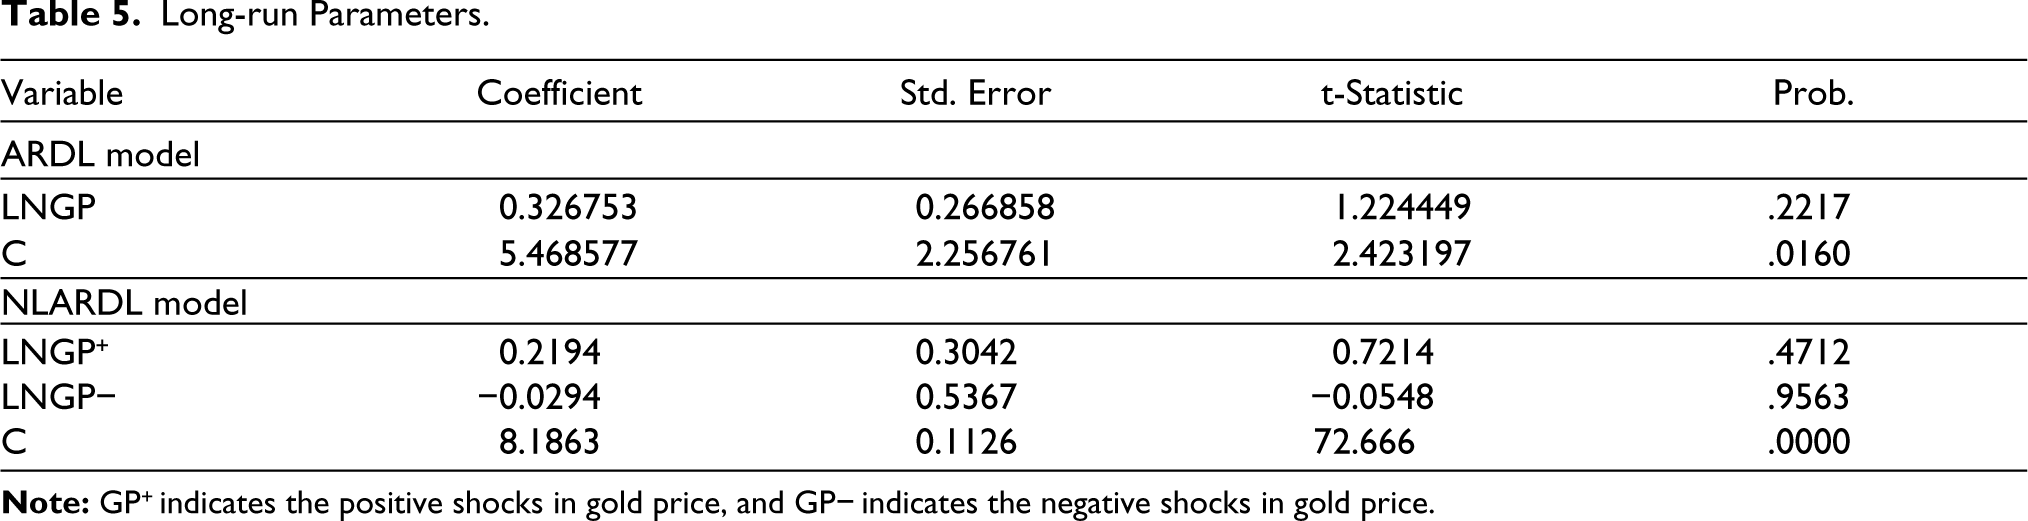
Table 4 reports the results of F-bound test of both ARDL and NLARDL models. The computed F-statistic in the ARDL model is 6.0328, which is greater than the upper bound I(1) critical values of 3.51, 4.16, and 5.58 at the 10%, 5%, and 1% levels of significance. Similarly, the computed F-statistic in the NLARDL model is 4.96, which is greater than the upper bound I(1) critical values of 3.35 and 3.87 at the 10% and 5% levels of significance. Thus, from the inspection of the output of F-bound test, it can be concluded that both the symmetrical model and the asymmetrical model suggest the presence of cointegration between the studied variables. However, mere presence of cointegration or long-run co-movement between the variables does not necessarily indicate the presence of a long-run causal relationship. For the long-run causal relationship, the long-run parameters are required to be observed. The long-run parameters of the ARDL model and the NLARDL model are presented in Table 5. Scanning through the table it can be ascertained that gold price (in case of the ARDL model) and positive changes/negative changes in gold price (in the case of the NLARDL model) do not affect the Indian stock market in the long run.
F-bound Test.
Long-run Parameters.
After getting an insignificant long-run linkage between gold price and the Indian stock market, we proceed toward estimating the short-run dynamics for both ARDL and NLARDL model.
The short-run parameters of the ARDL model suggest the following: (a) Current period gold price (denoted by Δ(LNGP)t) has a significant negative influence on the Indian stock market in the short run; (b) news of the settlement between the Ambani brothers (denoted by DUMMY2) seems to have had a significant positive effect on the Indian stock market and (c) 2014 general elections (denoted by DUMMY4) had a significant negative effect on the Indian stock market.
From the inspection of the short-run parameters of the NLARDL model, the following observations can be made: (a) Only the positive changes in gold price have a significant (negative) effect on the Indian stock market in the short run; the negative changes in gold price do not seem to have a short-run effect on the Indian stock market; (b) like the symmetrical model, the short-run parameters of the asymmetrical model also show that the news of the settlement between the Ambani brothers had a positive effect on the Indian stock market in the short run; and (c) DUMMY3 (binary dummy for the 2014 general elections in India) had a positive effect on the Indian stock market in the short run (refer to Table 6).
Short-run Parameters.
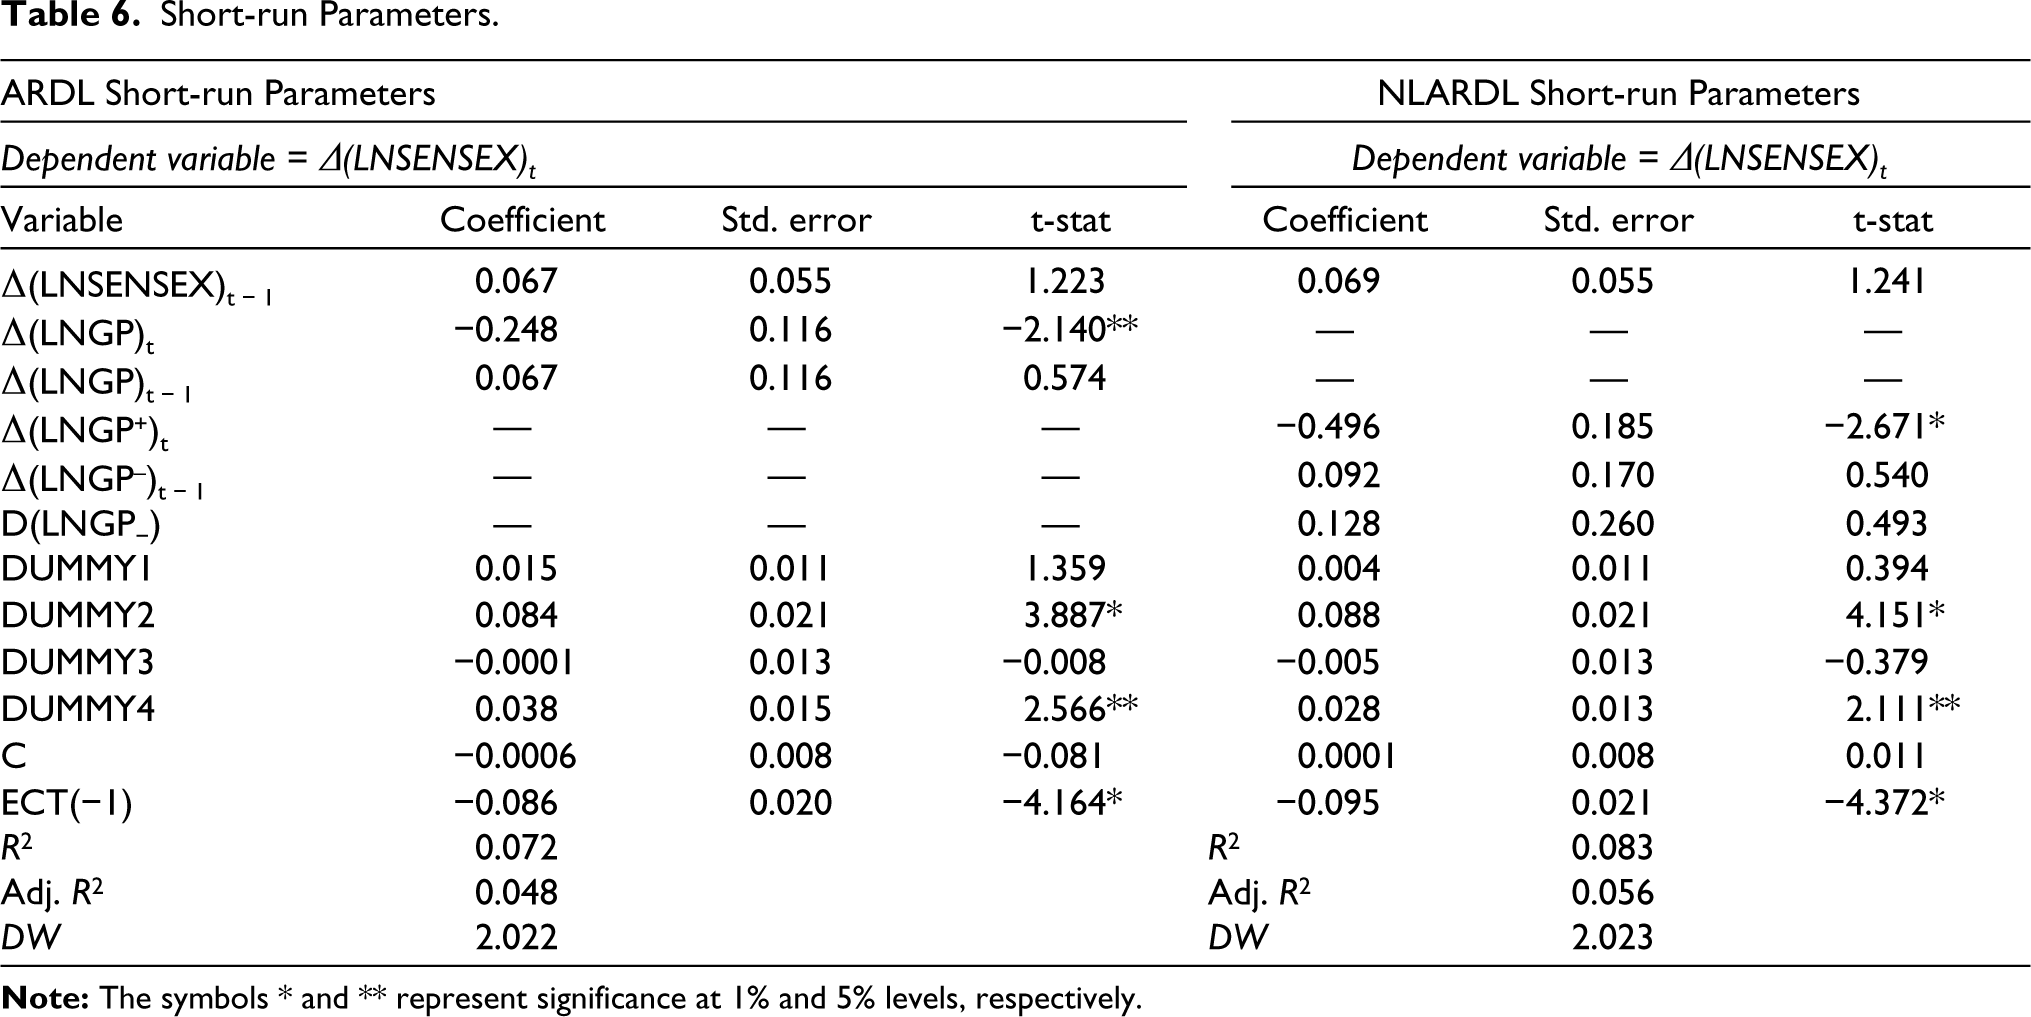
Furthermore, the error correction term of the ARDL model and the NLARDL model is found to be negative and statistically significant, which suggests that both models converge to the long-run equilibrium after a short-run shock. In the ARDL model, the speed of correction is 6.6% every month, while in the NLARDL model it is found to be 8% every month. It can also be observed that the explanatory power (R2) of the NLARDL model is higher than the explanatory power of the ARDL model.
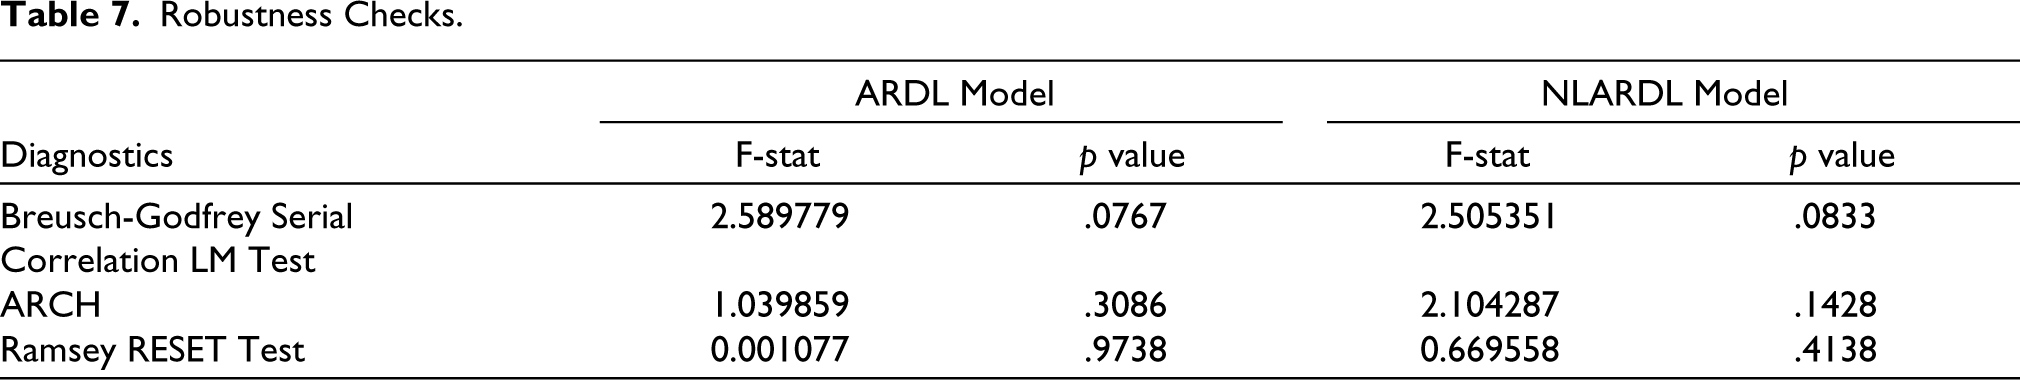
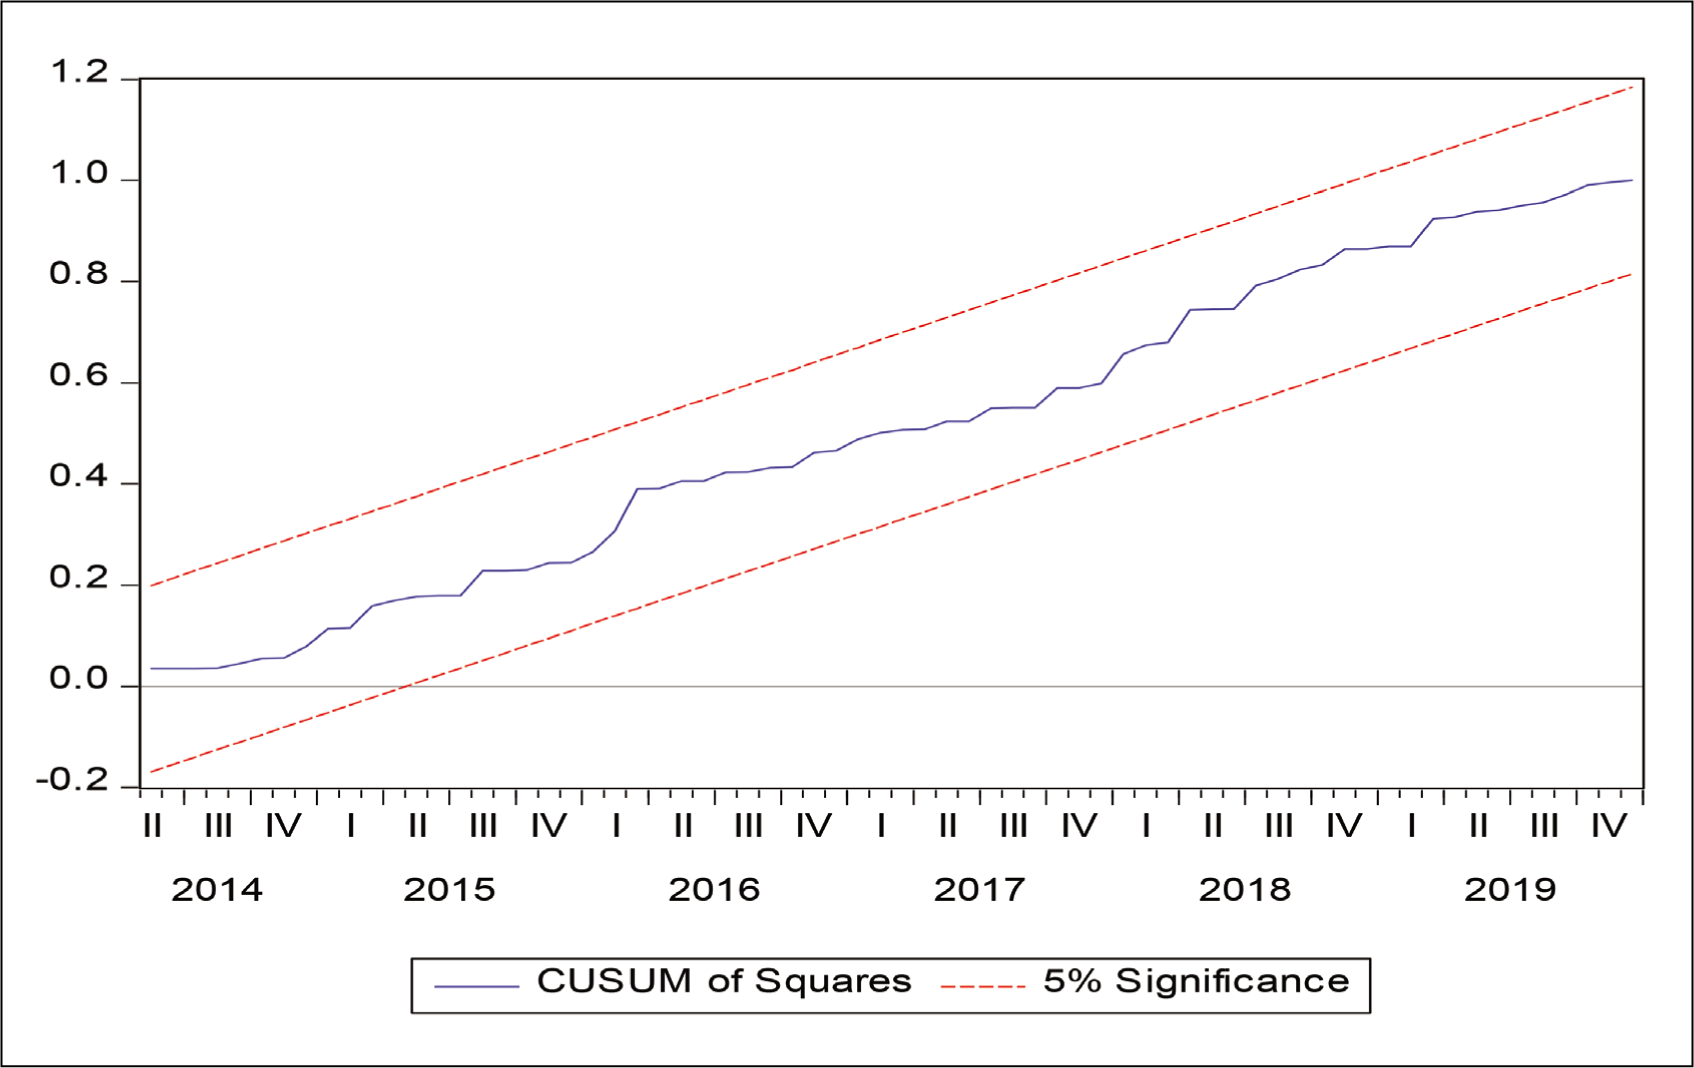
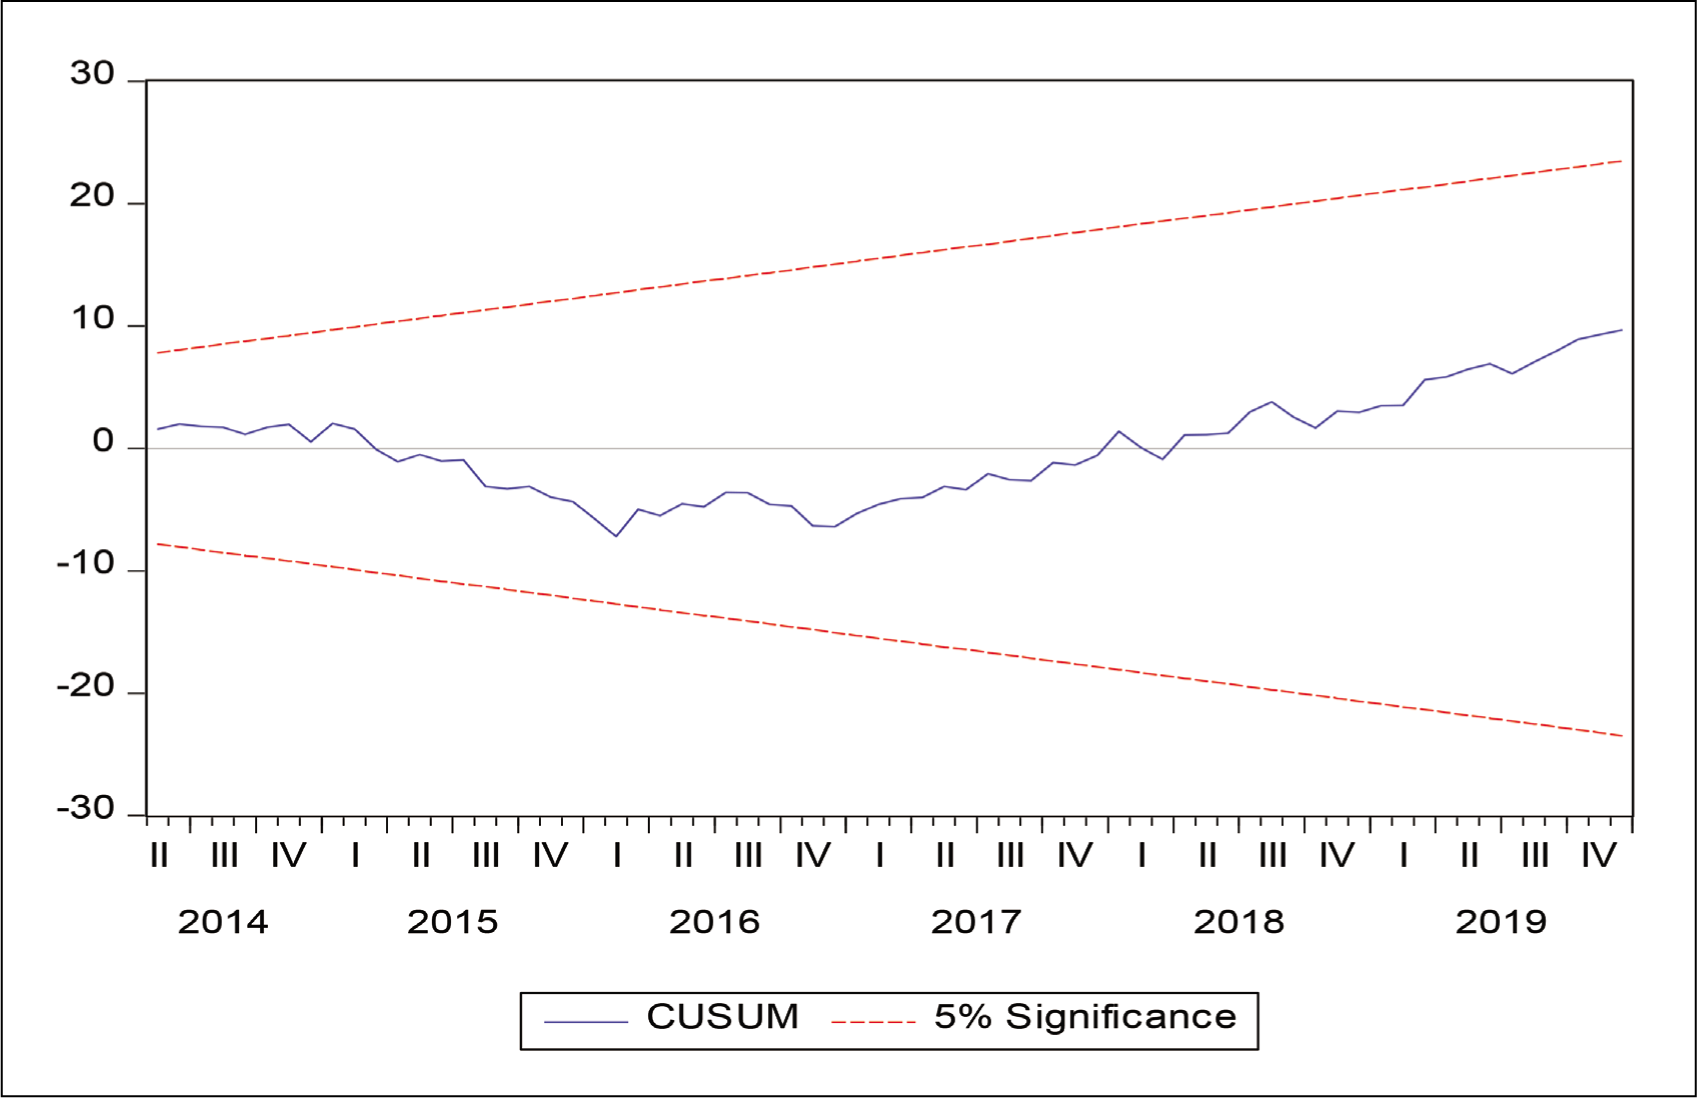
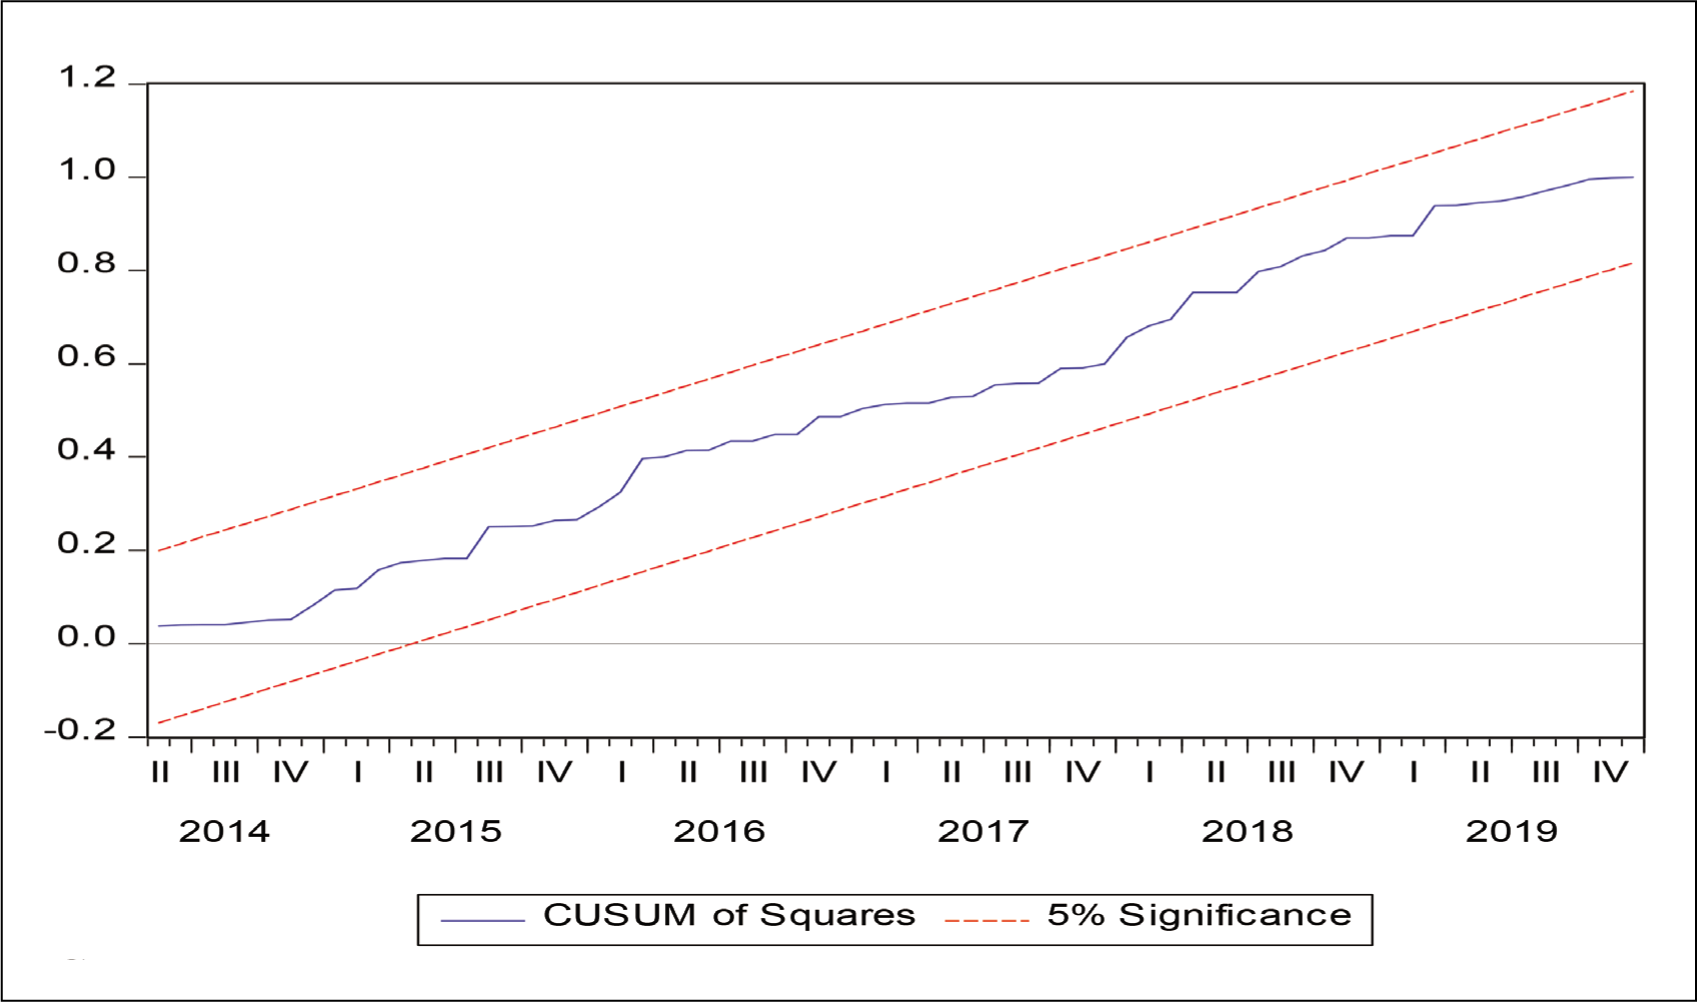
We have employed five types of diagnostic tests to determine the robustness of the symmetrical model and the asymmetrical model. The Breusch-Godfrey Serial Correlation LM Test is employed to detect autocorrelation in the residuals of the model, while the ARCH test is applied to ascertain whether the residuals are homoscedastic. The Ramsey RESET test helps in the detection of a correctly specified model, and the CUSUM test and CUSUM of Squares test indicate the stability of the models.
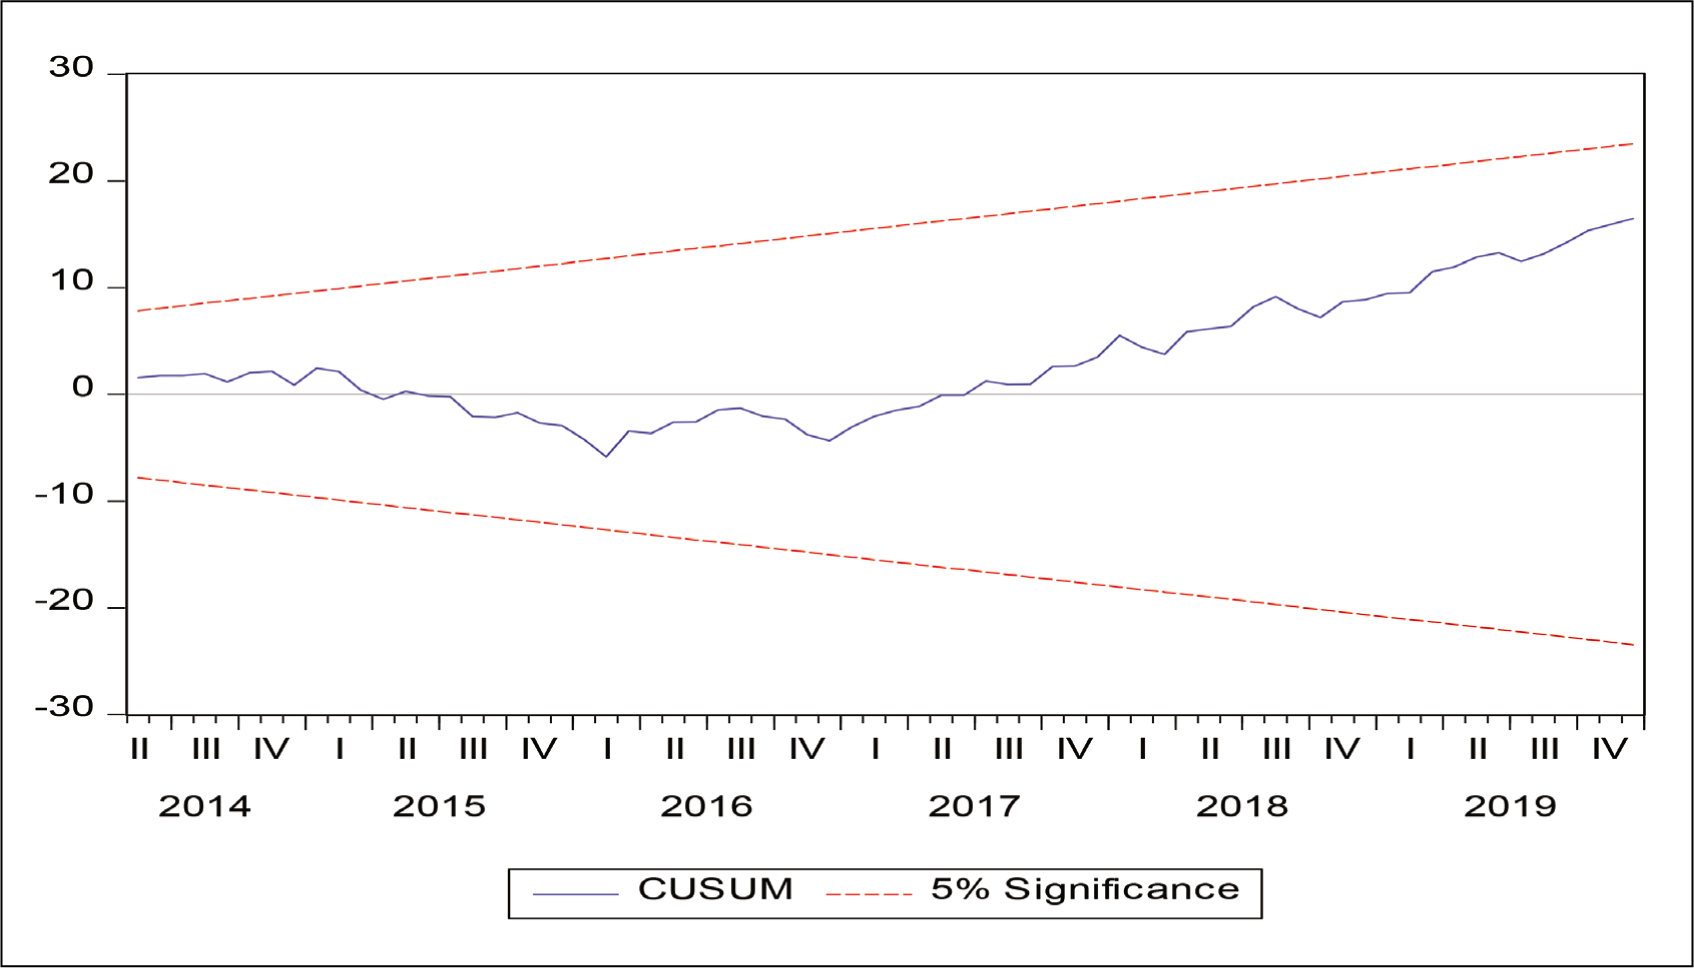
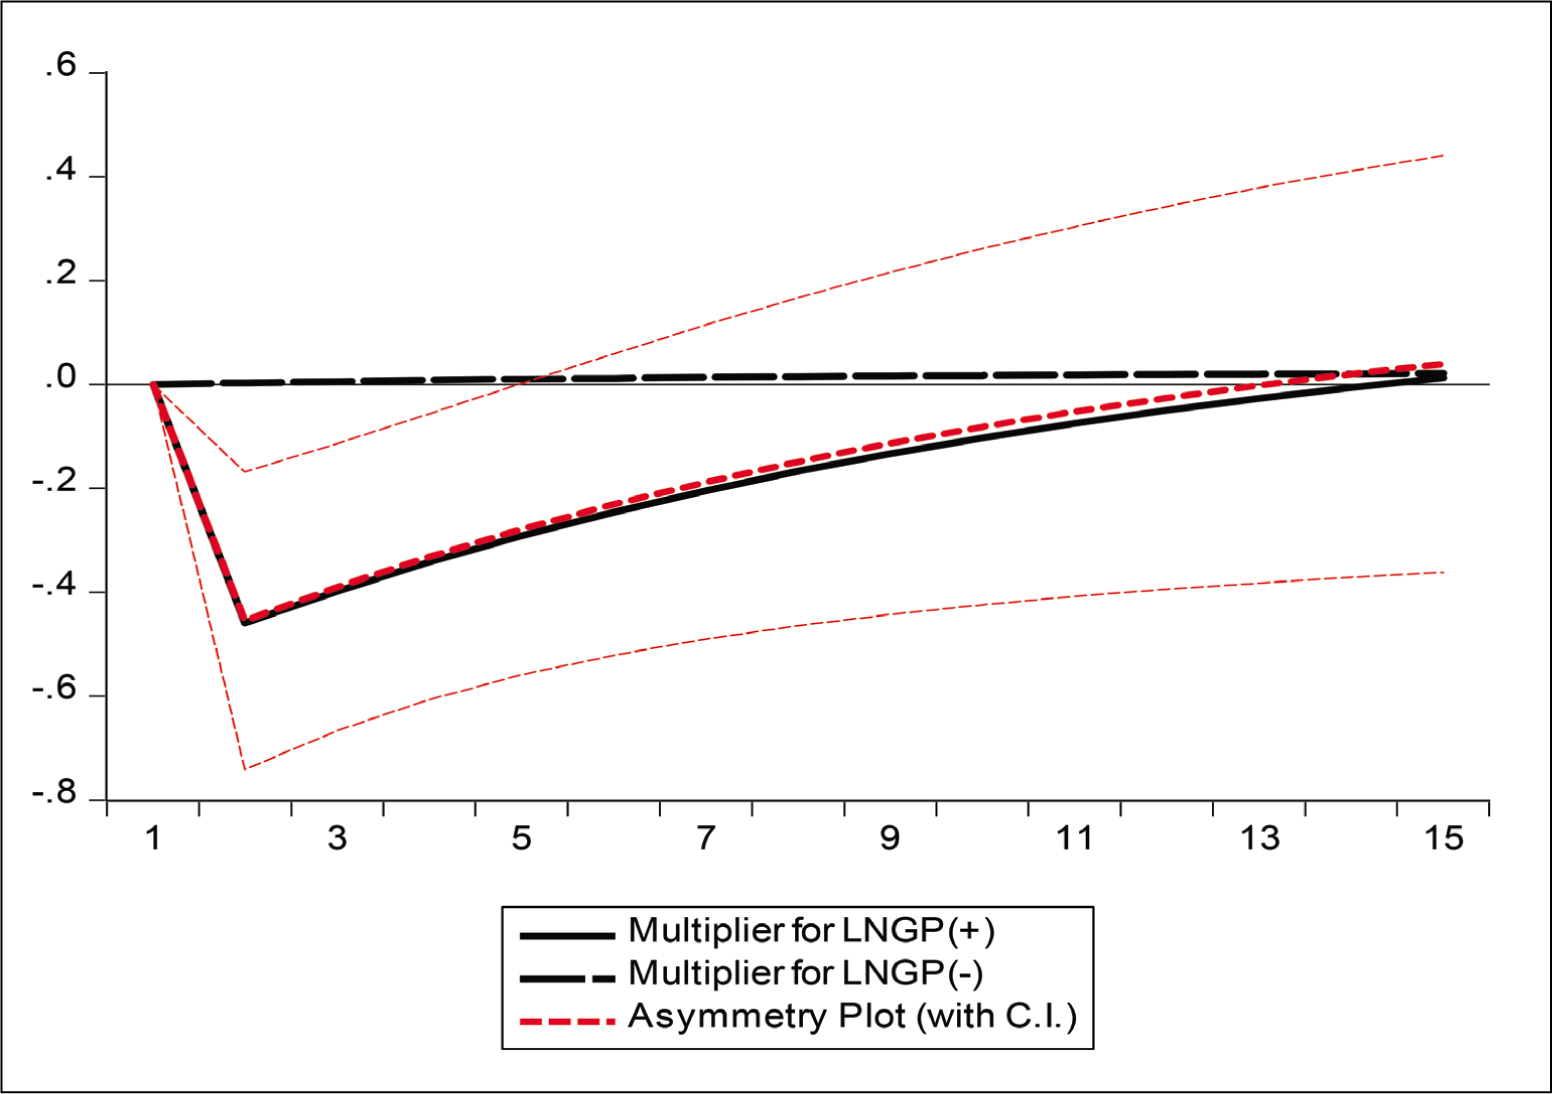
From Table 7, it can be observed that both the ARDL model and the NLARDL model are free from autocorrelation at the 5% level of significance. Both the models have homoscedastic residuals and are correctly specified. The CUSUM test and CUSUM of Squares test also confirm the stability of the ARDL and NLARDL models as the test statistic is within the 5% critical bounds (refer to Figures 2–5). Figure 6 shows the dynamic multipliers of disintegrated variables (i.e., GP+ and GP−). The figure depicts the influence of positive changes in gold prices, while the black dotted line depicts the effect of negative changes in gold prices. The asymmetry line is the red dotted line. Analysing the figure, it can be said that the NLARDL model is stable and positive changes in gold prices have a significant influence on the Indian stock market.
Robustness Checks.
CUSUM (ARDL Model).
CUSUM of Squares (ARDL).
CUSUM (NARDL Model).
CUSUM of Squares (NARDL).
Dynamic Multipliers.
Discussion and Conclusion
In this article, we examine the symmetrical and asymmetrical linkage between gold prices and the Indian stock market (proxied by BSE SENSEX) during the time frame from January 1993 to December 2019. We applied a range of unit root tests to determine the stationarity status of the variables. BDS test is employed to check whether gold price is linearly dependent. The BP multiple break point test is applied to identify structural change in the LNSENSEX series. Finally, linear ARDL and NLARDL models are applied to establish the long-run and short-run linkage between gold price volatilities and the Indian stock market. The results of unit root test show that both the Indian stock market index and gold prices are integrated of order 1. The BP multiple break point test shows the presence of structural breaks (April 1999, June 2005, June 2009, and April 2014) in the Indian stock market index.
The F-bounds test, which is applied to investigate the cointegration, shows that the Indian stock market and gold prices are cointegrated. The results support the findings of Mishra et al. (2010) and Bhunia and Das (2012), while they contradict with the results of Srinivasan (2014). The long-run parameters of both the linear ARDL and NLARDL models reports that in the long run, gold prices and the Indian stock market are not linked. In the short run, only the positive shocks associated with gold prices tend to be value relevant for investors in the Indian stock market. The fact that both gold prices and the Indian stock market index have risen greatly in the past three decades may explain why they are cointegrated, despite the fact that no long-run link can be proven. In the previous three decades, the price of yellow metals has risen due to rising demand in the Indian economy. Due to the evolution of the Indian stock market, the overall BSE capitalization has increased dramatically over the past three decades.
Our estimation of the long-run and short-run parameters indicates that the Indian stock market and gold prices move in their own path but sometimes these two are inversely related. The long-run and short-run findings of the study are in line with the result of Ming et al. (2023). It is seen that when the global stock market falls, gold prices move upward. The reason behind such inverse linkage in the short run can be attributed to the fact that gold is perceived as a safe haven asset during economic uncertainties. Thus, our results support the belief that in risk-off, investors shun equity and invest in gold. The study also highlights the influence of structural breaks in the performance of the Indian stock market. The study finds that structural break in June 2005 and April 2014 significantly boosted the Indian stock market and that the intensity of June 2005 structural break surpasses the intensity of structural break at April 2014.
The asymmetric reaction of the Indian stock market will yield new insights for investors, fund managers, and policymakers. The present investigation is constrained by several factors, which include the following: Although the investigation sheds light on the asymmetrical relationship between the Indian stock market and the price of gold, it fails to capture the dynamic interplay that exists between the two variables. Analyses of this dynamic interaction can be conducted utilizing techniques such as time-varying correlation and frequency domain approaches. Furthermore, the hedging capability of other commodities for equity portfolio risk is not accounted for in the study.
Footnotes
Declaration of Conflicting Interests
The authors declared no potential conflicts of interest with respect to the research, authorship, and/or publication of this article.
Funding
The authors received no financial support for the research, authorship, and/or publication of this article.