
Abstract
Small and medium enterprise (SME) development is essential for India’s economic expansion. SME is an important participant in the development of accessories that supports major industries. The current study is focused on the variables impacting performance measurement in SMEs, despite the fact that many small and medium businesses are experiencing significant losses and closures as a result of poor performance. The next goal is to determine the connection between small and medium business performance management and financial management practices. This study uses SME performance measurement as a dependent variable. Risk management, working capital management and credit management are three independent factors that can be used to assess SME financial management practices. The questionnaire that was used for each item was based on the earlier research. A five-point Likert scale was used to score each item scale used in this investigation. Working people in a few districts in South Tamil Nadu, India and used online structured questionnaires to gather data. The present sample size of the study is 157. The statistical data analysis has been carried out employing jamovi 1.8. For factor loading, reliability, sample size, model fit, regression analysis for hypothesis testing and structural education modelling were used. Policymakers and SME entrepreneurs who are familiar with performance measurement of many elements can benefit from the study’s findings. The study found a relationship between SMEs’ performance measurement and financial management practices.
Introduction
The small and medium enterprises (SMEs) sector reported the largest share in the mass of industrial units, yield in manufacturing, service sector and exports in the state. Besides being a major employment provider next only to agriculture, the need for stimulating this sector assumes greater importance.
Over the past 50 years, the micro, small and medium-sized enterprises (MSMEs) sector has grown to be a very active and dynamic area of the Indian economy. MSMEs not only play an integral part in creating many job opportunities at capital costs that are substantially less than those of large industries, but they also aid in the industrialisation of areas that are underdeveloped or rural, thereby reducing regional imbalances and ensuring a more equitable distribution of income and wealth throughout the country.
Armstrong (2001) states financial management predicts the overall financial performance of SME and gives alerts on how to manage funds, when it will be required and how much will be needed. Service quality and customer satisfaction positively influence customer loyalty in the financial sector (Venkatesan, 2018). The association between enterprise risk management strategies and competitive advantage is strongly moderated by financial literacy (Yang et al., 2018).
Problem Identification
The current researcher has adopted financial management practices, such as working capital management, risk management, credit management and performance measurement, to improve the growth for the survival and sustainability of SMEs in the context of globalisation. Small businesses find it difficult to compete with big businesses due to limited and timely finance. The lack of economical raw materials appears to be the key barrier. According to numerous studies, fund management is a substantial challenge for SMEs in India and other nations. For creating a model for a study proposal along with a research design that will ascertain the financial management practices of SMEs, the previously mentioned study gaps can be used as a guide.
Need of the Study
MSMEs frequently face major financial challenges due to a lack of financial management comprehension and business unpredictability. The present examination of financial management practices and performance measurement in SMEs is critical to the growth and success of any small or medium-sized organisation.
Research Gap
The majority of the research focuses solely on assessing financial performance. There is a gap in the literature that researchers can fill by assessing performance with financial management methods in small and medium-sized businesses. The current study’s intent is to identify and address concerns concerning SME financial management practices that affect either general or non-financial performance measurement.
Research Question
For this study, two research questions were formulated in light of the research analysis.
What elements affect managers’ and owners’ financial management practices in SMEs? How does financial performance affect SMEs?
Objectives of Study
The primary objective of the study was to find out the relationship between financial management practices and the performance management of SMEs. The next objective is to analyse the factors influencing financial management practices. The third aim is to evaluate the factors influencing performance measurement in SMEs. The final objective is to make the necessary recommendations to improve the overall performance of SMEs.
Literature Review
Financial Management Practices of SME
Gawali and Gadekar (2017) revealed that the success or failure of MSMEs was strongly determined by the owner-managers’ attitudes, level of involvement in financial aspects of the business, and understanding of accounting and finance. Working capital was the final factor, contributing barely 10 per cent to the corporate sector (Hunjra et al., 2011). SMEs were, to some extent, prevented from utilising the proper performance measures due to a lack of knowledge, skilled staff, top management backing and necessary resources like computers (Maduekwe & Kamala, 2016). According to Venkatesan (2021), a number of conflict factors are cumulative every day, both in the family and at work, which poorly affects the performance of businesses.
Nkundabanyanga et al. (2017) results indicate that competitive advantage fully mediates the relationship between financial management practices and loan performance, indicating that the relationship between financial management practices and loan performance at microfinance institutions (MFIs) is solely a result of their competitive advantage. There is a need for a recommendation for financial risk management system for SMEs due to the dangers that exist in SMEs along with how they differ from those in larger businesses as well as the lack of suitable risk-management proposals in theory (Napp, 2011).
Pham et al. (2012) suggest that highly materialistic people with poor financial management practices are particularly prone to compulsive buying issues, and they encourage the inclusion of financial management components in existing psychosocial therapies. The environmental, social and governance (ESG) scores might not accurately represent a company’s genuine non-financial practices (Siew et al., 2013). Due to their lower default risk, financially sound SMEs may borrow more money from banks at cheaper interest rates, but SMEs in poor financial health would be compelled to pay higher interest rates and have a lower borrowing ceiling (Yoshino & Taghizadeh-Hesary, 2015).
Performance measurement of SME
Performance of SME measures through the satisfaction of customer, employee, organisation and society. Organisations must prioritise providing excellent customer service, measuring the level of client satisfaction, and gaining long-term loyalty (Venkatesan, 2018). As a result, SME managers must use effective cash management techniques as a tactic to boost their financial performance and thrive in unstable business environment (Hamza et al., 2015).
Siew et al. (2013) observed that, despite the weak association between financial performance and ESG scores, construction companies that provide non-financial reports do significantly better than those that do not in a number of chosen financial parameters. Potential perks, including a reduction in the over-management of risks and organisational alignment with the SME’s task, may be realised by implementing a structured approach to enterprise risk management within SMEs (Smit & Watkins, 2012). Ahinful et al. (2023) results demonstrate that the influence of industry and firm-specific factors varies across the financial performance sub-components in the manufacturing and service sectors. The financial performance of SMEs is positively and significantly impacted by management accounting services (Gyamera et al., 2023).
Methods and Procedures
Hypotheses Development
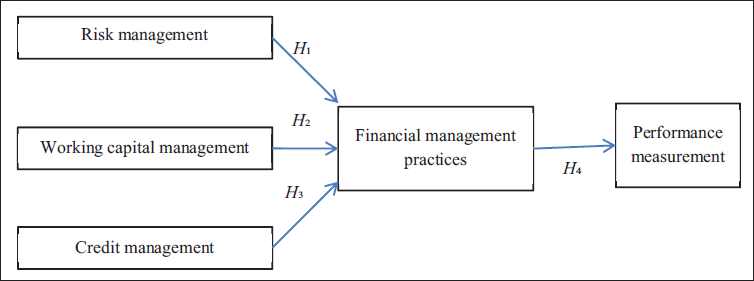
Based on the literature review and conceptual framework, the author put forth the following hypotheses:
H1: Risk management positively influences financial management practices in SMEs.
H2: Working capital management positively influences financial management practices in SMEs.
H3: Credit management positively influences financial management practices in SMEs.
H4: Financial management practices positively influence performance management in SMEs.
Survey Design
A self-administered printed and online survey was used to test the conceptual model depicted in Figure 1. This study’s item scales were all scored using a five-point Likert scale (Likert, 1932).
Conceptual Model of Performance Measurements.
Questionnaire and Variables’ Measurement
SME performance measurement is a dependent variable used in this study. The remaining variables are independent. The independent variables are financial management practices. The questionnaire of each item was employed based on the studies previously used. Measure the SME financial management practices using independent variables risk management, working capital management and credit management. The questionnaire of each item was employed based on the studies previously used. Five items measure risk management and three items working capital management (Hunjra et al., 2011; Nkundabanyanga et al., 2017); five items credit management were adopted from Parrotta and Johnson (1998) to measure the SME financial management practices. To measure the performance of SMEs, 11 items were adopted from Maduekwe and Kamala (2016).
Procedures
Data were collected by the working people through structured questionnaires online at selected districts in South Tamil Nadu, India.
Participants
All participants were requested to fill out an anonymous online questionnaire that measured financial management practices and performance measurement of SMEs. The present research covers five districts. These districts have many SMEs like organic farming, leather industry, food processing, etc.
Sample Size
Respondents were given surveys via paper copies (200) and online via Google Forms (175). The total response received was 225 (including 130 online and 95 offline). Due to ambiguity, more missing responses, double entries, and other reasons, etc., 68 questionnaires were not able to be used. The present sample size is 157. The total response is 42 per cent.
Data Analysis
Statistical data analysis was conducted using jamovi version 1.8 (Project, 2021). Exploratory factor and confirmatory factor analysis were done for factor loading, reliability, sampling adequacy and model fit.
Ethical Consideration
While answering the offline and online questionnaire served as confirmation of participants’ informed consent to participate in the study, participants were free to withdraw their consent at any point if they felt the online and offline filling processes were not satisfactory. The respondents’ self-interest led to their completely voluntary participation in the study. Respondents were fully reassured by researchers that the data they had collected would only be used for the current study and would not be shared with anyone else.
Convergent Validity
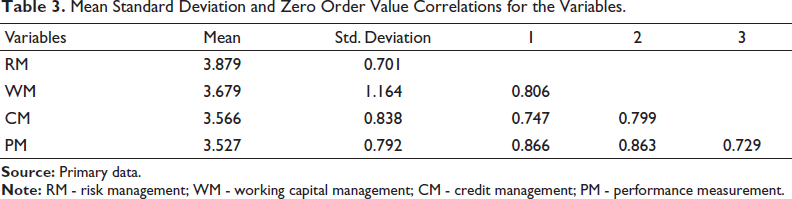
Convergent validity is the correlation of items within the construct. Convergent validity is sometimes claimed if the correlation coefficient is above 0.50, although it is usually recommended at above 0.70. The present research correlation values are above 0.70 and are significant at the 0.01 level (two-tailed).
Reliability
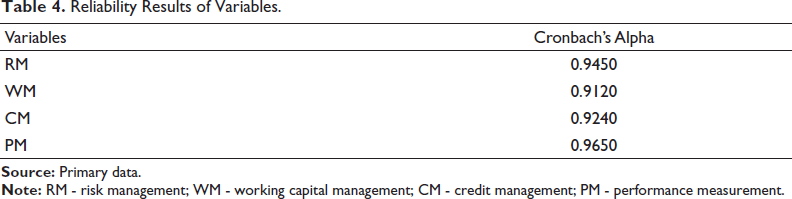
The assessment of survey instruments reliability-internal consistency was performed using values of Cronbach’s alpha (Cronbach, 1951). It is the most important reliability index and it is based on the number of variables/items of the questionnaire. In the present research, all variables of Cronbach’s alpha reliability values are more than 0.9 and accepted level.
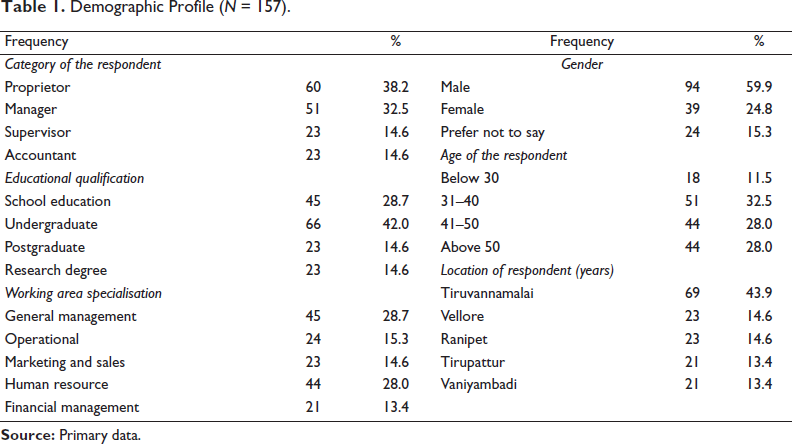
Around 60 per cent respondents are male and remaining are others, Most of the respondents locations are Tiruvannamalai (43.9%), the detailed demographic analysis are presented in the Table 1.
Demographic Profile (N = 157).
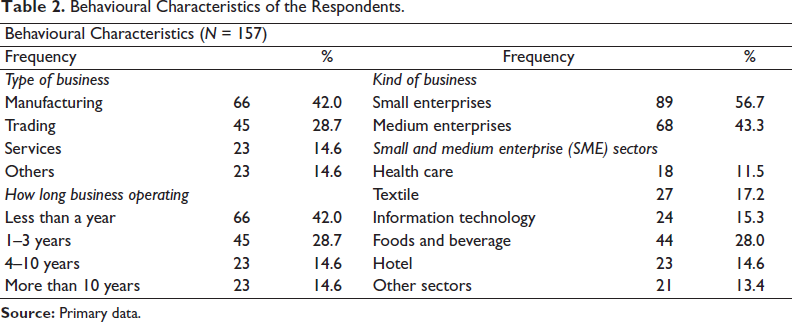
The behavioural characteristics of the respondents included types of business, duration of business operating, and kind of business. The detailed responses of behavioural characteristics are depicting in Table 2.
Behavioural Characteristics of the Respondents.
Results and Discussion
Demographic Profile and Behavioural Characteristics
Most of the respondents are male (around 60 per cent), 60 per cent respondents are proprietor and educational qualification is undergraduate (42 per cent). Geographical areas of respondents are Tiruvannamalai (44 per cent), followed by Vellore and Ranipet (15 per cent).
Most of the respondents are manufacturing industries (42 per cent) followed by trading (29 per cent) and foods and beverage (28 per cent) business.
Descriptive Statistics
Table 3 shows that all variable mean values are more than 0.5. Correlation values of all variables are more than 0.5 and positively correlated.
Mean Standard Deviation and Zero Order Value Correlations for the Variables.
Reliability Test
Table 4 shows that all variables’ reliability values are more than 0.9 and accepted.
Reliability Results of Variables.
Sampling Adequacy Method
Table 5 shows that Kaiser–Meyer–Olkin (KMO) value is more than 0.5 and research sampling size is adequate.
Kaiser–Meyer–Olkin (KMO) and Bartlett’s Test.
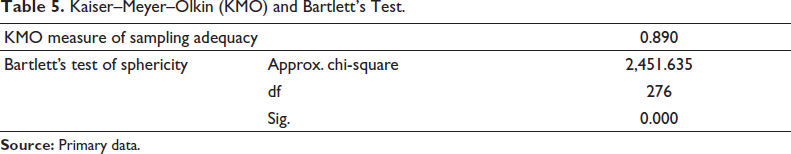
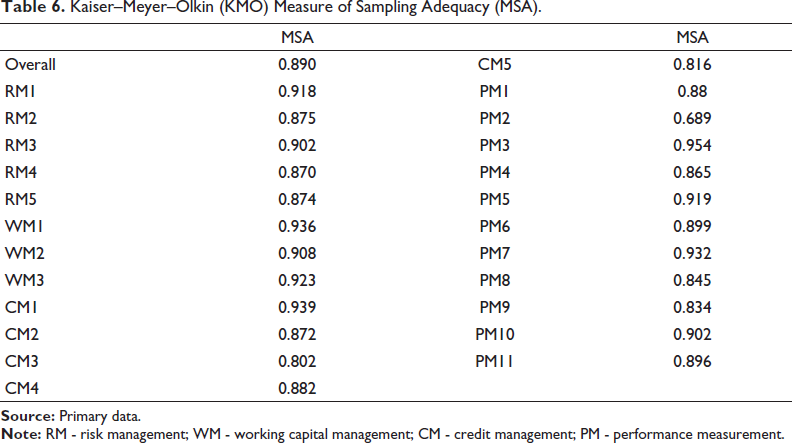
The KMO measure of sampling adequacy (MSA) is used to assess the sampling adequacy. The exploratory factor analysis (EFA) is effective if the KMO index is high (1), while the EFA is irrelevant if the KMO index is low (0). Amounts between 0.5 and 0.7 are deemed adequate, 0.7–0.9 are deemed good, and 0.9–1.0 are deemed exceptional. The KMO score for the current study indicates that all values are wonderful and greater than 0.8 (Kaiser, 1974). Table 6 shows that the KMO sampling adequacy of each item indicates more than the accepted threshold value.
Kaiser–Meyer–Olkin (KMO) Measure of Sampling Adequacy (MSA).
Exploratory Factor Analysis
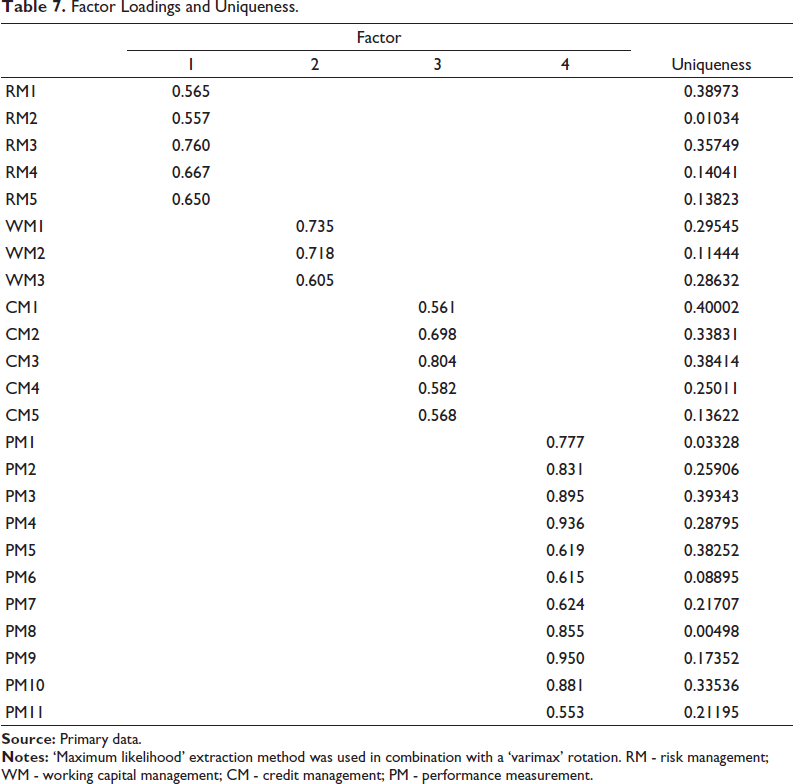
Table 7 shows the items and their standardised loads. According to Hair et al. (2010), loadings must have values greater than 0.50. In Table 7, it is seen that most of the loads of the indicators exceeded this value, thereby ensuring reliability and validity of the measurement instruments. Uniqueness is the percentage of variance that is unique to the variable and unanswered by factors. Greater uniqueness indicates lower contribution or relevance of the variable in the factor model. Present research uniqueness values are less than 0.4.
Factor Loadings and Uniqueness.
Confirmatory Factor Analysis
In Table 8, the Z test results (i.e., they are not zero) and p value of significance for each of these constraints indicate building a logical contribution to the model, so it is not necessary to remove any variable-factor paths or correlations from the model.
Variables and Items Estimates, Standard Error (SE) and Z Score.
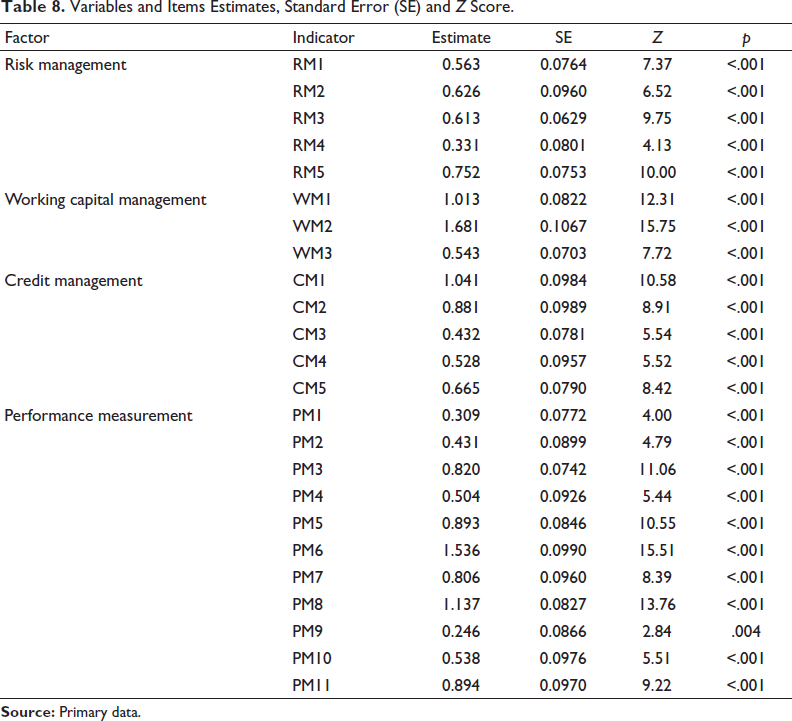
The factor that estimates the covariance of risk management, working capital management and credit management with performance measurement is significant because p values of all items are less than .001.
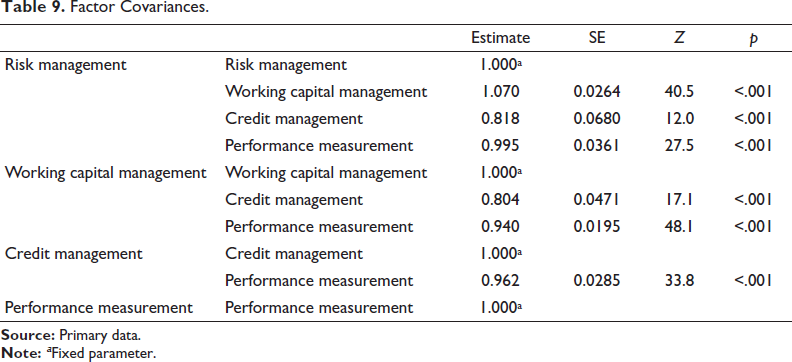
The factor covariances of each variable with others are displayed in Table 9, along with the estimates, standard errors, Z c the p-values are less than 0.001 and are significant.
Factor Covariances.
Structural Equation Model
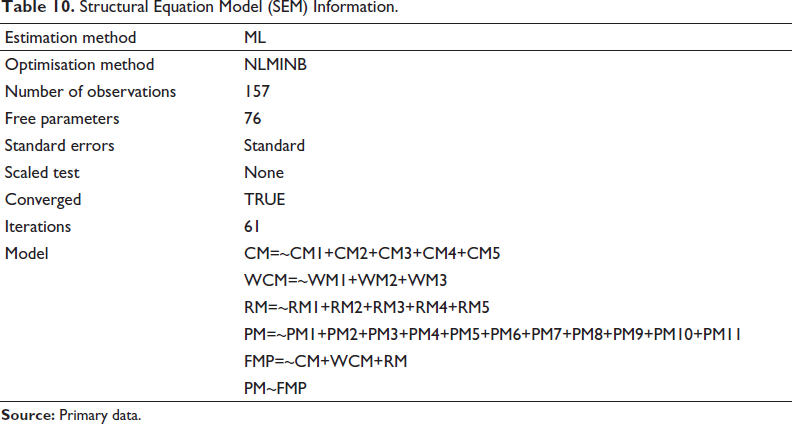
Table 10 shows the structural equation model (SEM) information; estimation method is maximum likelihood, number of observation, error standard, number of free parameters (76), number of iterations (61) and list of variables with item details.
Structural Equation Model (SEM) Information.
Overall Tests
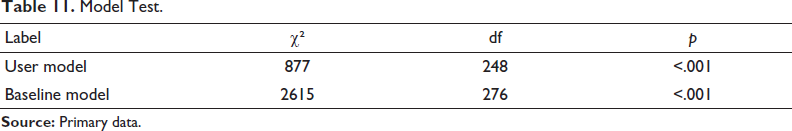
Table 11 shows the chi-square value, degree of freedom and significance of p value of user and baseline model. To test model fit, use the χ2 statistic, which, if small, shows that the model has a good match to the data. The model fit of χ2 statistic assessment is based on sample size, with a large number of observations supporting a good model fit and a significant (p < .05) χ² value of 877.
Model Test.
Fit Indices
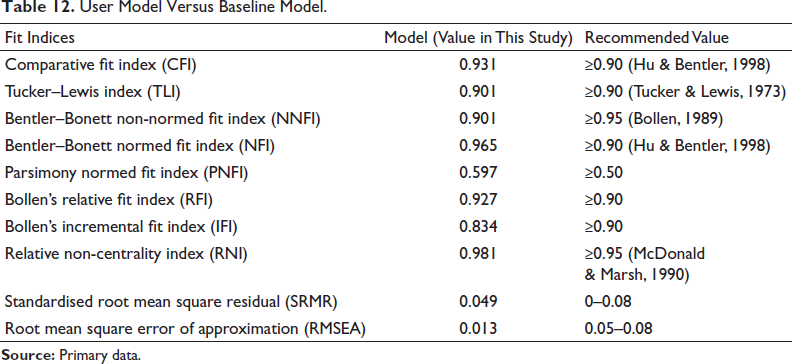
Table 12 shows the user model versus baseline model fit index values of the present study and recommended values. Bollen’s incremental fit index (IFI) value is closer to the accepted value, and remaining all index values are above the recommended values. Model fit is evaluated using the comparative fit index (CFI), Tucker–Lewis index (TLI), the root mean square error of approximation (RMSEA), and the 90 per cent confidence interval (CI) for the RMSEA. CFI > 0.9, TLI > 0.9 and RMSEA of roughly 0.05–0.08 imply an acceptable match. CFI > 0.95, TLI > 0.95 and RMSEA and upper CI for RMSEA 0.05 indicate an excellent match. Table 10 displays the results of the current model fit; the CFI is 0.957, the TLI is 0.918, and the RMSEA is 0.013 with a 90 per cent CI and an upper CI of 0.046 for the RMSEA. Good fit is indicated by the model. The current study’s standardised root mean square residual (SRMR) result is 0.0490, which is within the acceptable range for the SRMR index of 0–0.08 (Hu & Bentler, 1998).
User Model Versus Baseline Model.
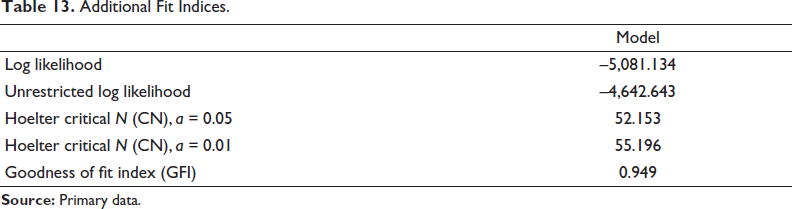
Hoelter (1983) noted that if the outcome exceeded the critical sample size (CN), the derived χ² would become significant at the predetermined threshold a, rejecting the model’s fit. For the evaluation of SEM sample size, Hoelter (1983) established the critical N (CN) statistic, where CN 200 was regarded as sufficient. Given that the current sample produces a CN of 52.153, it is improper to use the minimum fit function χ² to determine the model’s fitness. Therefore, while calculating the approximation error, it is necessary to compensate for both the sample size and the number of parameters. Goodness of fit index (GFI) values greater than 0.95 scaled between 0 and 1, with higher values indicating better model fit. In the present study, GFI indicates 0.949 and is accepted.
Table 13 shows the values of additional fit indices, including the log likelihood and unrestricted log likelihood. The GFI value is greater than the accepted threshold of 0.9, indicating a better model fit.
Additional Fit Indices.
R-square
The R2 values of 0.25, 0.50 and 0.75 represent the explanatory power of the latent variables as low, medium and significant, respectively. Table 14 indicates each item’s R-square values. CM5 and RM3 indicate low, CM1, CM2, CM5, WM1, RM2, RM5 and PM10 R-square values are medium, and the remaining items are statistically significant.
R-square Value.
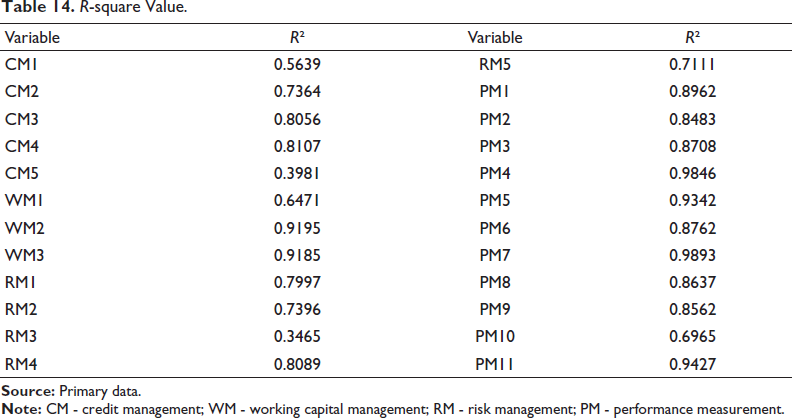
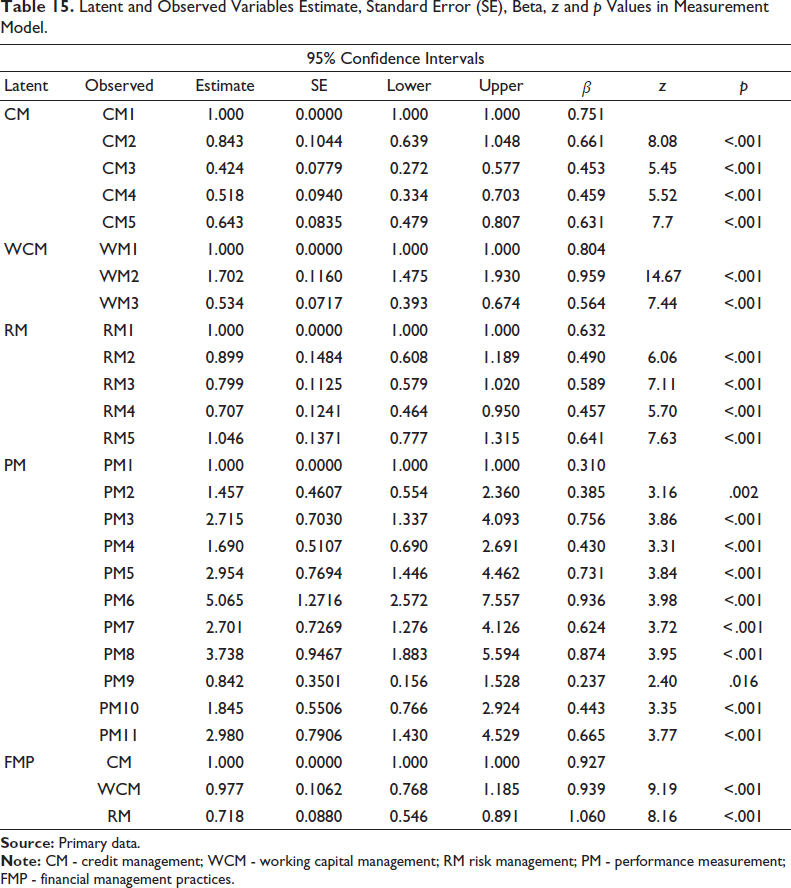
Table 15 shows the latent variables like CM, WCM, RM, FMP and PM, with observed items of each latent variable to corresponding estimates, standard error, beta, Z score and p value. The standard error calculates how closely each particular sample’s mean corresponds to the population’s actual mean. A positive coefficient means that the dependent variable’s (performance measurement) mean tends to rise when the independent variable’s (credit, risk and working capital management) value rises. A negative coefficient indicates that the dependent variable tends to drop as the independent variable rises. The closer Z test result is to 0, the closer value is to the mean. The further away Z test result is from zero, and the further away value is from mean.
Latent and Observed Variables Estimate, Standard Error (SE), Beta, z and p Values in Measurement Model.
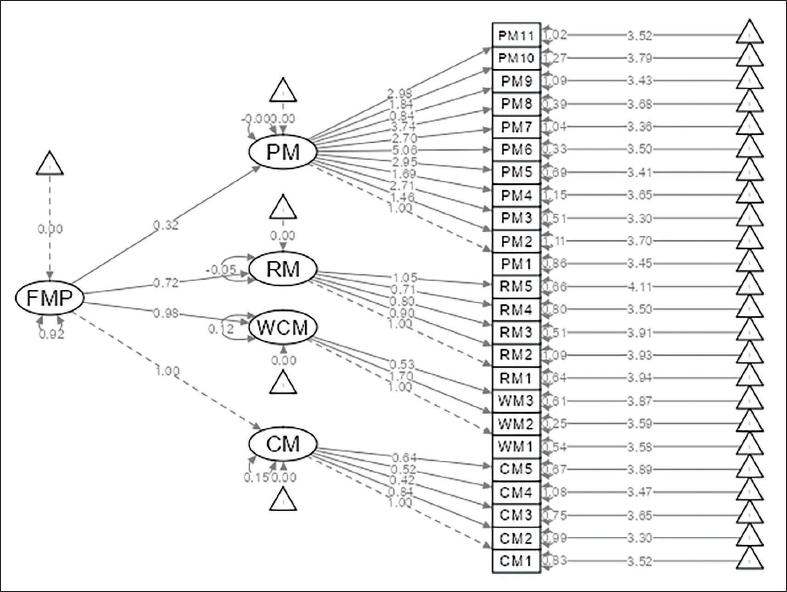
Path Diagram
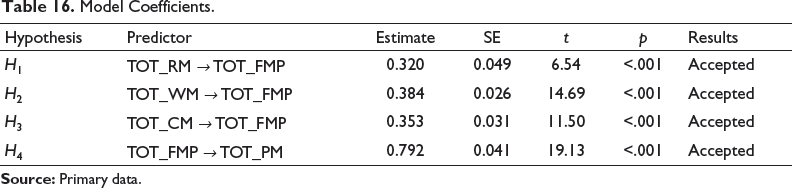
Table t-Statistics of Path Coefficients
The critical values of t for a two-tailed test, according to Henseler et al. (2009), are 1.65 (significance level = 0.10 or 10 per cent), 1.96 (significance level = 0.05 or 5 per cent) and 2.58 (significance level = 0.01 or 1 per cent). The acknowledged values and model are significant, as seen in Table 16 values of t for the structural model.
Model Coefficients.
Managerial Implications
This study provides a number of useful recommendations for senior management, accounts officers and small company organisation owners on how to pay special attention to financial management procedures and performance evaluation in order to get a competitive advantage and make a profitable business. The findings indicate that the variables of risk management, credit management, working capital management and performance measurement are crucial for capturing the essential traits of small to medium-sized businesses. Risk and credit management should be maintained in a proper manner; otherwise, SME performance will be badly affected. Financial management practices are positively significant for performance measurement in SME. Financial and non-financial performances are essential to measuring the performance of SMEs.
Path Diagrams of Financial Management Practices and Performance Measurement.
Concluding Remarks
Small and medium-sized businesses are essential for the emerging economy of India. SME are in favour of supplying major industries with accessories. The variables in the current study (risk, credit and working capital management) have significance in determining the efficiency of financial management strategies. The author suggests using cutting-edge technology (such as artificial intelligence, big data analysis and blockchain technology) to boost SME performance. Collaborations and research across borders would help to broaden the concept of SMEs and the digital transformation process beyond nations and industries (Melo et al., 2023).
Appendix
Questionnaire
Five-point Likert scale 1—highly disagree to 5—highly agree
We’re always in touch with our customers about their businesses We always assess our customers before giving them a credit We constantly update our customer’s record Proper loan assessment is done before approval We usually acquire enough knowledge before assessing loan applicants
We usually have alternative cash sources if we forecast a deficit There is enough liquidity to meet our obligation to disburse loans to our borrowers The credit manager establishes all credit limits
Five-point Likert scale (‘1’ = not typical, ‘5’ = very typical)
We often spend more money than I have We obtain cash advances in order to pay other credit balances We rarely pay finance charges We pay bills as due We make payments on large debts as scheduled
Scale: 1 = never; 2 = rarely; 3 = sometimes; 4 = always; 5 = very frequently
For monitoring the business For measuring performance For future planning For control purposes For improving decision-making For business process improvement For problem identification For optimising the use of resources For developing tactical strategies For improving communication For motivating employees
Potential Limitation and Future Scope of the Study
Like many other studies, this one has some limitations on data collecting, sampling and generalisation of the results. The study’s sample size might not be sufficient to simplify the findings. The results of a comparable study could be different since other major cities might have different demographic characteristics. Selected districts from Tamil Nadu state served as the respondents in this study. The investigation should be expanded to include rural areas as well. Future research, however, might be able to get around these restrictions by using data from other cities or nations, representative samples and further variables.
Footnotes
Acknowledgement
The author has no support to report.
Author Contributions
The author contributed to the frame conceptual model, credit management, risk management, working capital management to financial management practices, financial management practices to performance measurement; methodology, software, analysis and interpretation, implication and recommendation of future studies.
Availability of Data and Materials
All data analysed in this study are included in the published article
Declaration of Conflicting Interests
The author declared no potential conflicts of interest with respect to the research, authorship and/or publication of this article.
Funding
The author received no financial support for the research, authorship and/or publication of this article.
Informed Consent
Informed consent was obtained from all individual participants included in the study.