
Abstract
Although the process of integrating immigrants into the labor market unfolds over many years, it is often modeled as outcomes (e.g. employment) at specific points in time. We contribute to the literature by providing empirical evidence of the sequence of events leading to active labor market participation of East African and EU15 immigrants to Sweden, whom we follow for up to 28 years. By combining the method of sequence analysis with binomial logit estimation, we can explain why individuals are sorted into different representative labor market sequences. A further contribution is that along the usual initial conditions (individual and geographic), we employ longitudinal micro data to find (1) representative sequences of movements between various types of neighborhoods and (2) an empirical estimate of individual ability, which turns out to be a strong predictor for immigrants entering an active labor market trajectory. Our results show that East Africans tend to reside in neighborhoods with a high degree of socioeconomic and ethnic segregation. Despite this, their labor market activity seems to be less influenced by neighborhood trajectories than EU15 immigrants. The labor market activity of EU15 immigrants and female East African immigrants is positively related to residing in less ethnically segregated and socioeconomically stronger neighborhoods. Our results are relevant to policy development since they point to the importance of the initial location of immigrants and their subsequent residential mobility.
Introduction
Integrating immigrants into the labor market and overall society is on the political agenda in Sweden and other countries, especially since the mid-2010s when Sweden saw an historical peak in immigration numbers. 1 Due to (lack of) housing availability and the fact that many immigrants choose to stay with friends and family, 2 newly arrived immigrants often locate in socioeconomically weaker areas and/or more rural settings. Such places are typically characterized by limited access to job opportunities due to a lack of employment-enhancing networks and social norms encouraging labor market activity (cf. Granovetter, 1995; Mortimer and Shanahan, 2007; Portes, 1995). The characteristics of different locations, in conjunction with individual skills, may thus affect immigrants’ prospects of finding a job (Platts-Fowler and Robinson, 2015). The importance of place, especially in terms of residential segregation, for labor market integration was acknowledged already by Kain (1968). Since then, there is a vast body of quantitative empirical research on the labor market integration of minority groups and the relation to place-specific factors (see Kain (1968) for an early example, and Vogiazides and Mondani (2020) and Klaesson and Öner (2021) for recent studies on Sweden).
The consensus is that integration, starting from a state of inactivity and ending up in employment or self-employment, does not happen overnight but is the result of a chain of events that takes place over time. 3 Most previous studies, however, model integration outcomes at specific points in time, disregarding the consecutive order of events. There are a few notable exceptions, namely, Kogan (2007), Kogan and Weißmann (2013), and Backman et al. (2020), who apply the method of sequence analysis (Abbott, 1995) to disentangle labor market integration processes of immigrants. In this article, we continue this track of research using sequence analysis to cluster immigrants into representative labor market trajectories. We contribute to the small number of existent papers, while also adding empirical novelties.
The primary aim of the article is to identify place-specific factors at neighborhood and regional levels that relate to how individuals sort themselves into labor market paths, controlling for individual characteristics. In previous studies, labor trajectories are instead solely explained by initial conditions, mainly individual characteristics at the year of immigration. The novelty of this article is not only that we add a geographic perspective to labor integration studies using sequence analysis, but that we also capture the dynamics of locating in different places by applying sequence analysis to track immigrants’ moves between neighborhoods with varying degrees of poverty and ethnic segregation. In addition, we observe the individuals’ labor market region throughout the whole period rather than just at the year of immigration. This is in line with Coulter et al. (2016), who point to the importance of rethinking residential mobility from a life-course perspective. For example, residential moves have implications for the loss and gain of social networks (Mortimer and Shanahan, 2007). Sequence analysis has been used before to capture the space–time trajectories of immigrants (Vogiazides and Chihaya, 2019), but to our knowledge, the types of geographic trajectories used in our study have not previously been connected to labor market integration processes.
Since the method of sequence analysis is not well suited for large numbers of observations, 4 we focus on immigrants originating from East Africa and EU15. These two groups are chosen since their labor market integration varies greatly. While EU15 immigrants tend to perform well in the Swedish labor market, East Africans constitute a group that is poorly integrated. Using these groups, we expect to find a richer set of labor market paths that can enlighten policy making.
Previous literature
Place, segregation, and labor market outcomes
The spatial concentration of ethnic groups is not a new phenomenon. For example, Swedes who emigrated to the United States around 1900 located in few places, resulting in geographic concentrations of Americans with Swedish ancestry still visible today (Rooth and Scott, 2012). Another well-known example are the Chinatowns found in large cities around the world. There is thus a strong tendency of immigrants to concentrate geographically and end up segregated from the native population in Sweden (Edin et al., 2003) and elsewhere (Bartel, 1989; Borjas, 1998; Cutler et al., 2008). In addition, Vogiazides and Chihaya (2019) show that a majority of immigrants (especially from Africa and Middle East) in Sweden tend to concentrate in deprived neighborhoods. The sorting into neighborhoods may be deliberate since individuals look for peers with like background, experience, language, or culture. Individuals face budget constraints affecting what type of neighborhoods they can choose to locate in. Unemployment, low-income jobs, and/or lack of capital make more affluent neighborhoods unaffordable for many immigrants. Ethnic concentration may also be an outcome of the initial placement of immigrants by authorities. Whatever the underlying mechanisms, the spatial mismatch hypothesis states that residential segregation results in a geographic separation of minority groups from job opportunities (Kain, 1968, 2004).
Starting with Kain (1968), there is a large number of studies on the relationship between residential segregation and labor market outcomes. In a European setting, studies show both positive and negative effects of segregation on employment, leaning positive when looking at ethnic enclaves (Battisti et al., 2022; Damm, 2009; Edin et al., 2003; Martén et al., 2019) and negative when studying segregation more generally (Dujardin et al., 2008; Klaesson and Öner, 2021; Korsu and Wenglenski, 2010; Wixe and Pettersson, 2020). Some studies show that it is the quality (e.g. employment rate) rather than the size of the ethnic enclave that matters (Damm, 2014; Edin et al., 2003; Klaesson et al., 2021). Meanwhile, the results of segregation on self-employment are mixed (see Wixe (2020), Klaesson and Öner (2021), and Andersson (2021) for examples on Sweden). Few studies look explicitly at gender, but the tendency seems to be that males are more affected than females by residential segregation, in regard to both employment (Dickerson VonLockette, 2010; Wixe and Pettersson, 2020) and self-employment (Andersson et al., 2021).
Social networks and peer effects
Residential segregation implies not only spatial separation between immigrants and natives, but also the social separation of ethnic groups (Demireva and Zwysen, 2022; Logan, 1978; Massey et al., 1987). The place of residence influences individuals’ access to (social) networks (Aldén and Hammarstedt, 2014; Bayer et al., 2008), which play a key role in knowledge and information sharing, including job opportunities (Portes, 1995). In segregated areas, social networks are often spatially, socially, and ethnically bounded (cf. Damm, 2014; Patacchini and Zenou, 2012). Zenou (2007) presents a model showing that minority groups in segregated neighborhoods rely on family and friends, that is, strong ties (Granovetter, 1973, 1995) for information. Moreover, if immigrants are surrounded by peers who go to work, chances increase that they will also find jobs, an effect that may occur through a general knowledge about the institutions in the labor market, more prevalent job referrals through ethnic networks, or local social norms that make it less acceptable to be unemployed (Becker, 1974; Debreu, 1952; Schelling, 1973).
If the norm is that few people go to work, peer effects may be negative when it comes to labor outcomes (Klaesson et al., 2021), and social networks may disseminate little useful information on labor market opportunities (Schüller, 2022), for example, information that leads to poorer quality jobs or no jobs at all. Indeed, Granovetter (1973) argues that weak ties, that is, networks involving individuals from various groups, are indeed superior to strong ties in providing employment opportunities. A similar reference can be made to Putnam (2000), who distinguishes between bonding (within-group) and bridging (between-groups) social capital.
In Sweden, and other countries alike, ethnic segregation goes hand in hand with socioeconomic segregation (Vogiazides and Chihaya, 2019; Wixe, 2020). Neighborhoods with a large immigrant population typically face challenges with unemployment, low incomes and education levels, sometimes social exclusion, and criminality (Edling, 2015). Spatially, socially, and ethnically bounded networks in such neighborhoods can be expected to give rise to lock-in effects preventing participation in networks with stronger links to the labor market (cf. Boschma, 2005; Jayet et al., 2010). Lock-in effects may be exacerbated by language barriers since the majority (native) language is not needed to the same degree in ethnic enclaves (cf. Rocha and Espino, 2009). In addition, native social networks may be less hospitable toward ethnic minorities, especially affecting immigrants residing in segregated neighborhoods (Kawalerowicz, 2021).
Burt (1998) discusses gender differences in the building of social networks, which has implications for the labor market outcomes of males and females. While women tend to rely on smaller circles of close friends, men are more active in participating in wider entrepreneurial networks. Burt (1998) also shows that although women have less access to networks providing job opportunities, such networks are equally important for their careers as for men. Dickerson (2002) connects gender differences to residential segregation, arguing that social networks are not only bounded by ethnicity and geography but also by gender. In this view, women are thus seen as outsiders in male-dominated ethnic networks, in the same way as immigrants are regarded as outsiders in native-dominated networks (cf. Burt, 1998). Interestingly, in ethnic minorities in the Netherlands, females have stronger links to natives than males (Laan Bouma-Doff, 2007).
Based on the literature review above, we expect that an immigrant’s probability of entering an active labor market path is enhanced the higher the socioeconomic status and the lower the ethnic segregation of the neighborhood of residence. Both ethnicity and socioeconomic status will impact the amount and quality of information about the workings of the labor market in general and the specific job openings available. However, it is not only the availability of labor market information that is of importance, but also its transferability to immigrants is key. Therefore, more affluent neighborhoods are not always suitable since the networks and social capital in these places may be harder to access for immigrants. Regarding gender, we expect less influence of the neighborhood for female labor market integration due to less embeddedness in ethnic networks. At the same time, weaker links to often male-dominated ethnic networks may make it easier for immigrant women to connect to native networks providing job opportunities.
Methodology and data
We use a micro register database provided by Statistics Sweden, covering all individuals aged 16 years and above and the years 1991 to 2018. 5 The population of interest are foreign-born individuals who immigrated to Sweden between 1991 and 2010 from East African or EU15 (non-Nordic) countries, whom we follow until 2018. Since we are interested in labor market processes, we include only individuals of working age, defined as 20–64 years in the Swedish setting. In addition, since we study integration processes, we set a limit that the individuals must appear in the data set for at least 5 years. Hence, the individuals are 20–60 years of age at the year of immigration and the maximum number of years a person can be followed is 28 (those who immigrated in 1991 at 20–36 years of age).
Using sequence analysis to identify representative career paths
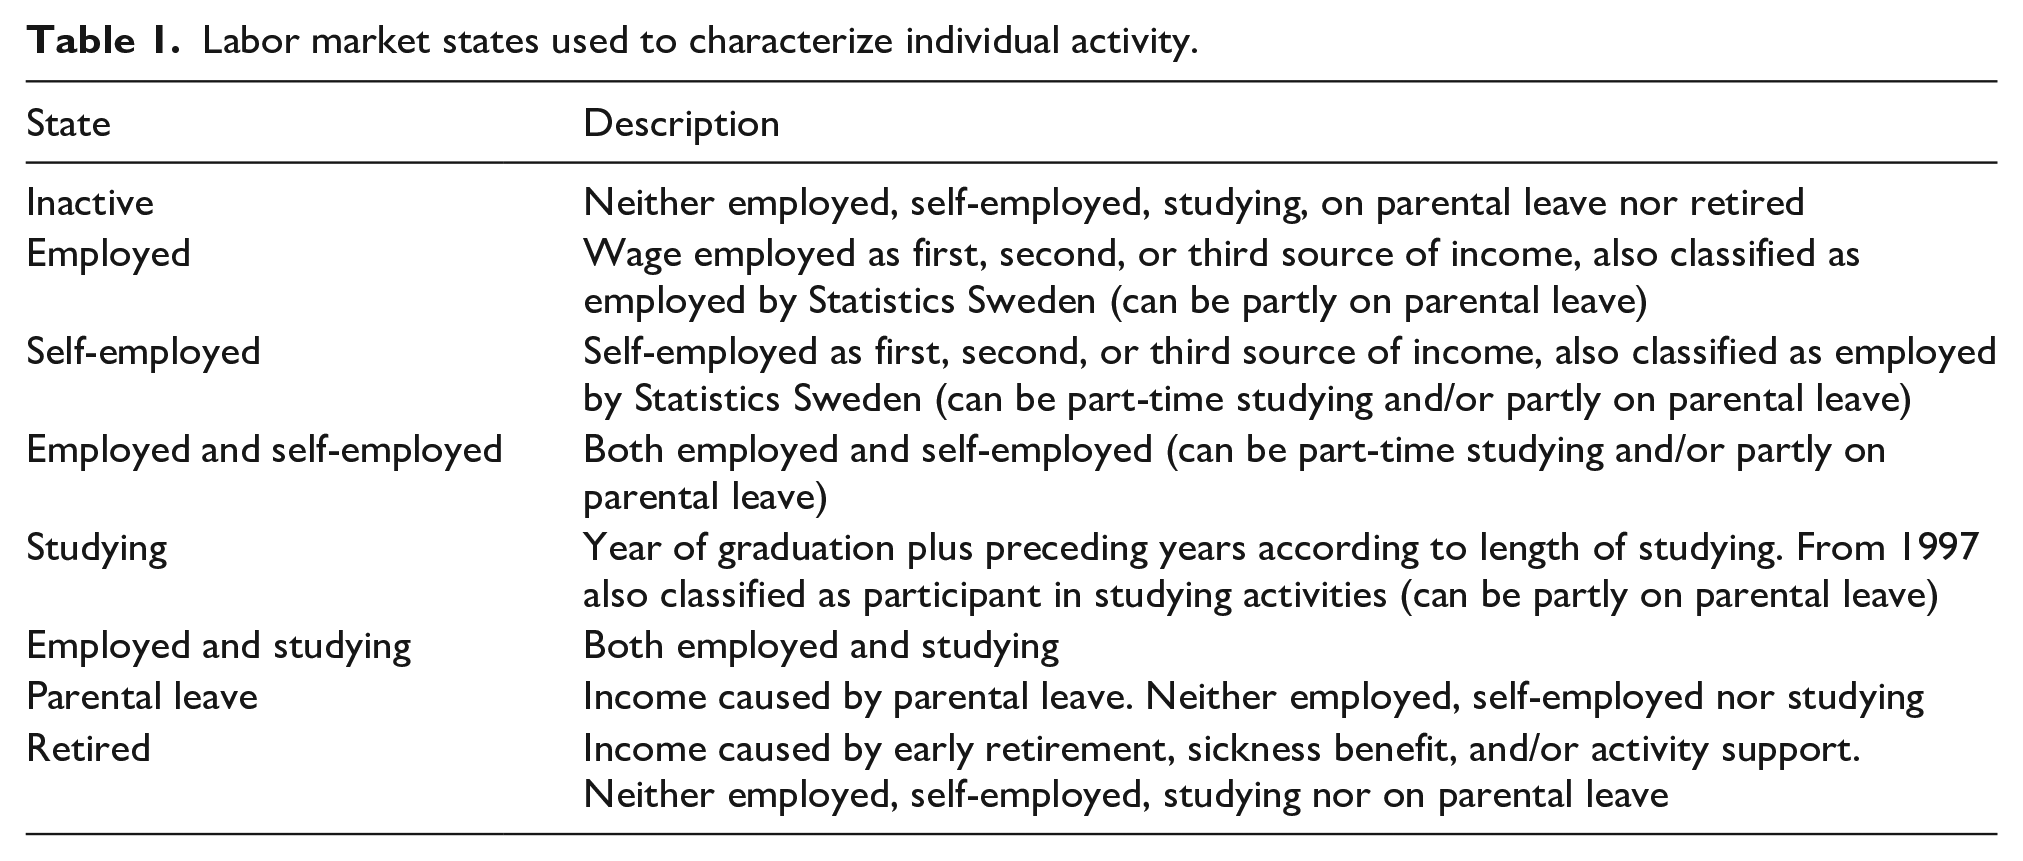
We employ a type of analysis that Abbott (1995) calls whole sequence methods, which investigate associations between sequences. To perform the sequence analysis in Stata, we follow Brzinsky-Fay et al. (2006). The first step is to assign a specific state for each individual and each year, where the state represents the individual’s labor market status (Table 1) or geographic status (Table 2). The consecutive order of these states represents the individual’s pathway (or sequence) over time. A specific sequence can be shared among several individuals. In our case, the pathways start at different years (1991–2010) and differ in length (5–28 years). Since we want to identify representative sequences no matter the year of immigration, the immigration year is treated as t = 1.
Labor market states used to characterize individual activity.
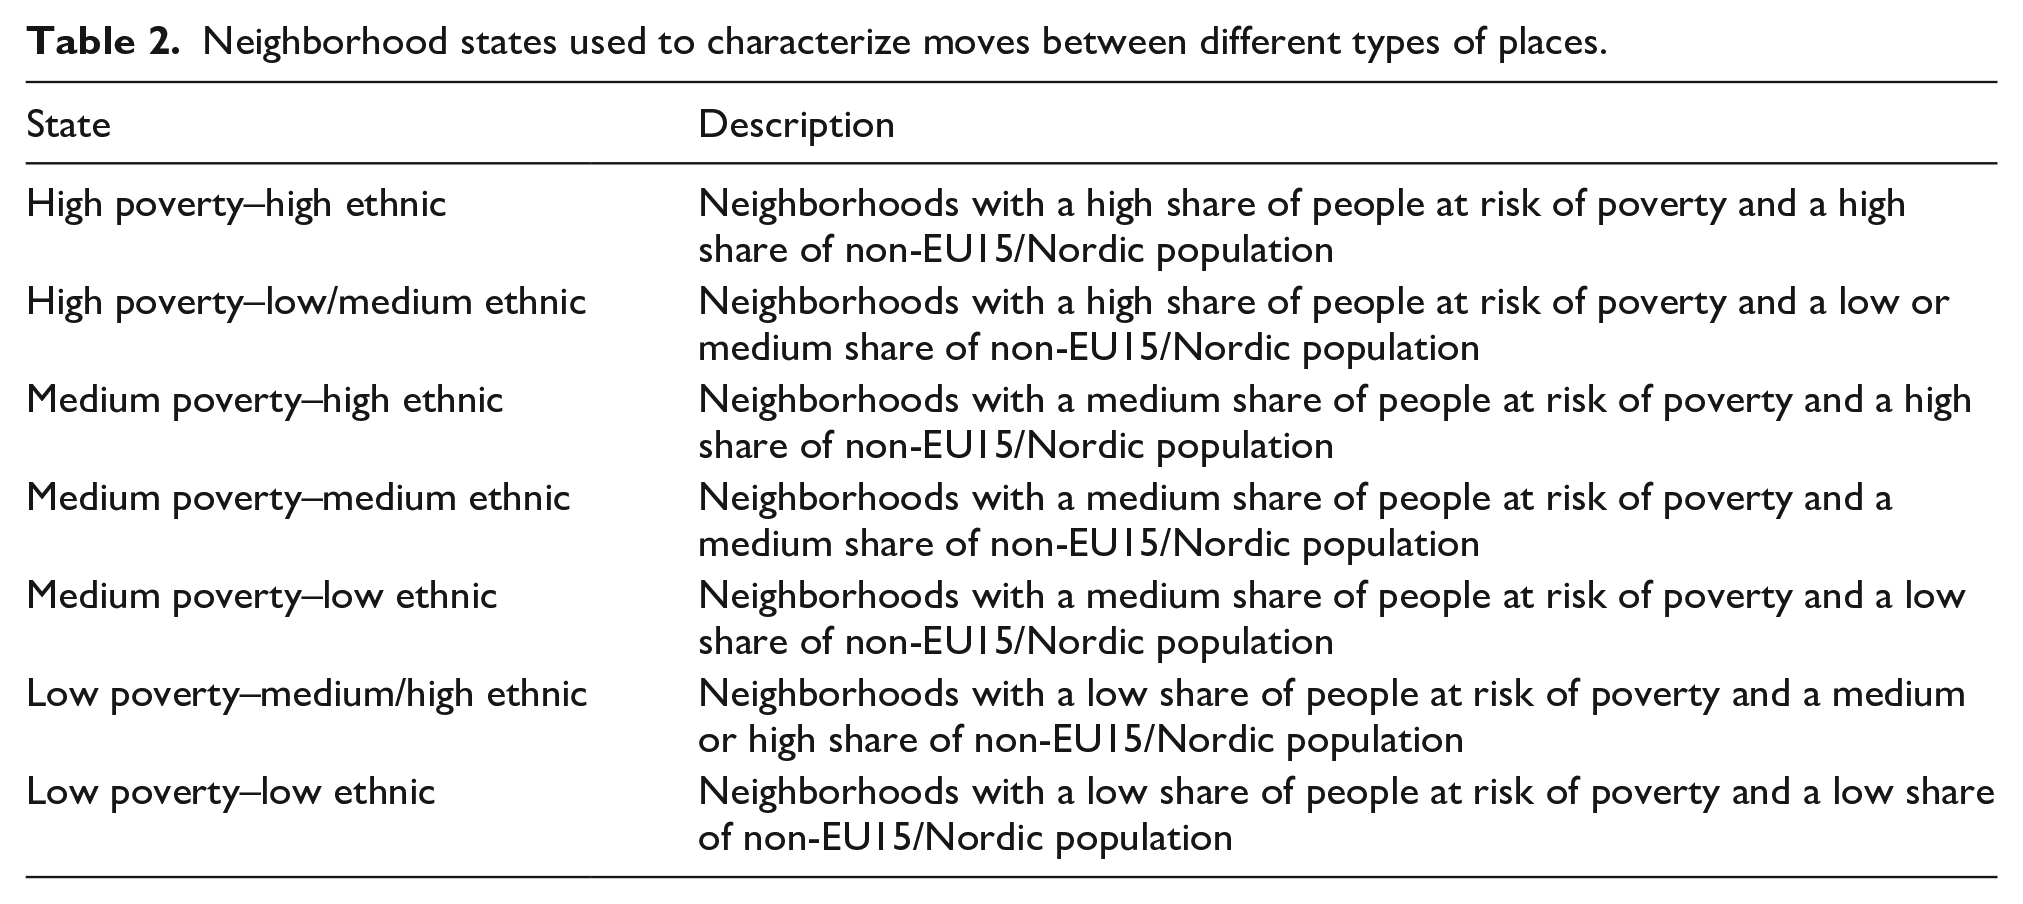
Neighborhood states used to characterize moves between different types of places.
The next step is to create a symmetrical distance matrix covering all unique sequences found in the data. We create a Levenshtein distance matrix by Optimal Matching, which uses the Needleman–Wunsch algorithm (Needleman and Wunsch, 1970), with an SADI plugin (Halpin, 2014, 2017). The results of the cluster analysis on the distance matrix are used to create a limited number of representative clusters, where each cluster consists of individuals who share similar pathways. To determine the optimal number of clusters, we use the Calinski–Harabasz pseudo-F index and the Duda–Hart Je(2)/Je(1) index (cluster stopping rules).
Sequence analysis can effectively find typical patterns and has strong descriptive powers. On the other hand, basing empirical estimations on sequence analysis is less effective for identifying causal effects (Eerola and Helske, 2016; Vogiazides and Chihaya, 2019). In our case, one issue is reverse causality since the self-selection of individuals into various types of locations is influenced by their labor market outcomes (cf. Schelling, 1971). Moreover, there may be unobserved individual characteristics that explain both geographic and labor market trajectories of immigrants. As a remedy, we include an empirically estimated individual fixed effect in the regressions to capture unobserved time-invariant individual characteristics. Because of the potential remaining issues of endogeneity, due to reverse causality and unobserved time-variant individual characteristics, we refrain from making causal interpretations of the regression results.
Labor market states for representative career sequences
The dependent variable is constructed using sequence analysis on individuals’ labor market states. Table 1 describes the different states, set up for the purpose of this article, that the individual can move between. There is no intrinsic hierarchy between states, and individuals can move between any states in any order.
Since integration processes are likely to differ between individuals from different parts of the world as well as between females and males, the sequence analysis is conducted separately for each immigrant group and gender.
Neighborhood states for representative moving sequences
The independent variables are introduced to explain why individuals are sorted into different career pathways, or clusters. The variables of main interest concern characteristics of location, where representative pathways across neighborhood types are identified by sequence analysis. To capture segregation at the neighborhood level, we consider both socioeconomic status and ethnic composition. Following Vogiazides and Chihaya (2019) and Eurostat, 6 the socioeconomic status is measured by the share of people at risk of poverty, defined as having an equivalized disposable income below 60 percent of the corresponding national median. Segregation in terms of ethnicity is measured by the share of population in the neighborhood born outside the EU15/Nordic countries.
Both neighborhood shares—poverty and ethnic— are calculated on a yearly basis, 1991–2018. Neighborhoods where each share is more than 1.5 times higher than the corresponding share for the whole country are classified as high poverty and high ethnic, respectively. Remaining neighborhoods where the share is at least 0.75 times the national one are classified as medium. Neighborhoods where the share is lower than 0.75 times the national share are classified as low. The two dimensions are combined to create the various neighborhood states, 7 shown in Table 2.
To calculate the neighborhood variables, we use Statistics Sweden’s geographic division of the country into almost 6000 so-called demographic statistical areas (DeSO). 8
Region types
To capture what type of region individuals reside in, we consider the whole period and extract the most frequently observed region type. 9 We use the classification from the Swedish Agency for Economic and Regional Growth, 10 which distinguishes between five types of municipalities based on the density of the municipality and the accessibility to larger places, described by Table 3. These regional types can be seen as proxies for labor market opportunities, where metropolitan areas have the largest and most diverse labor markets while the chances of finding a job are generally smaller in rural and/or remote places. The benefits of being located in a larger place are often denoted agglomeration economies, and from the perspective of an individual it is mainly the matching and learning mechanisms that are important for labor market activity (Duranton and Puga, 2004).
Characterization of five region types.
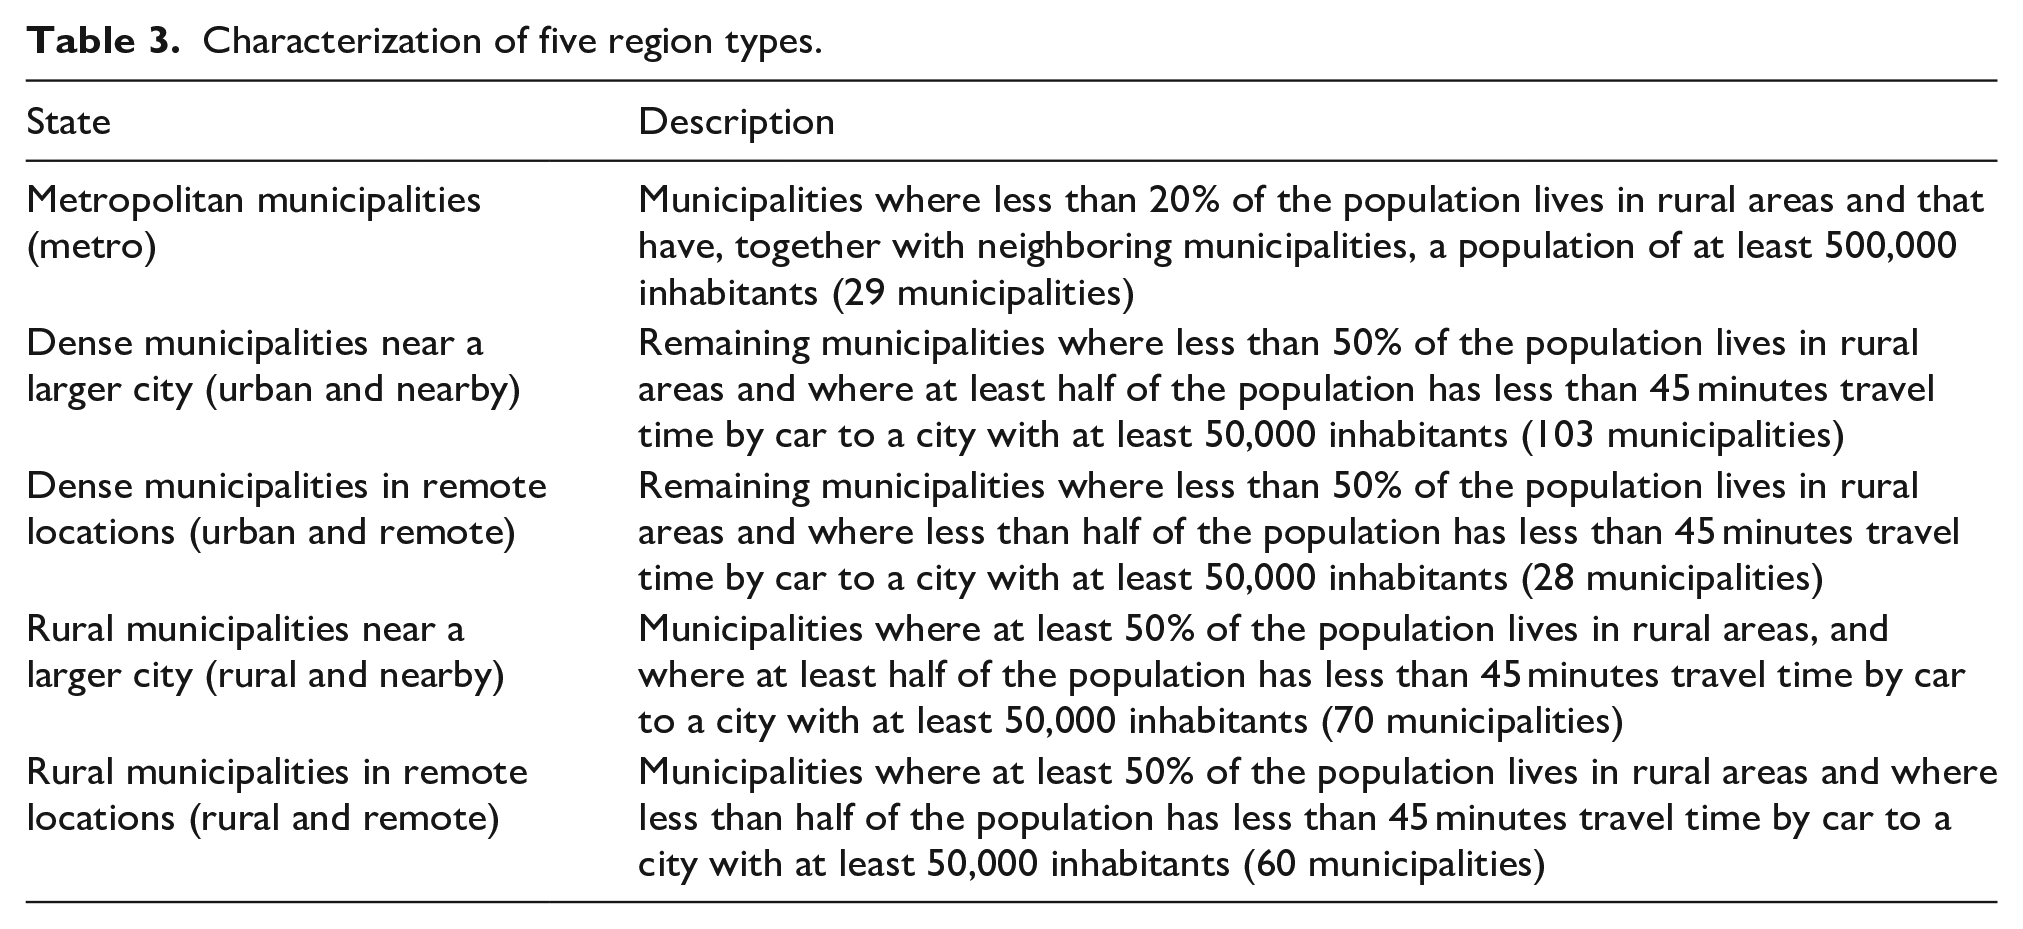
We use the geographic division of Sweden into 290 municipalities and the classification of these municipalities into region types.
Initial conditions and unobserved ability
Finding a job is to a large extent determined by human capital, for example, education, experience, and skills. For immigrants there may exist a sizable depreciation of human capital related to non-transferability between countries (Luik et al., 2016). This may come from difficulties of validating education or work histories, making it difficult to accurately and credibly signal ability or skill levels. Kesler (2006) emphasizes that unobservable factors are also important for integration processes. With sequence analysis, the collapsing of the data into a time-invariant dependent variable prevents us from fully exploiting the panel structure of the data in the empirical estimations. The approach taken by previous studies to control only for initial conditions implies that there may be an endogeneity issue due to omitted variables. To address this, we include an empirically estimated individual fixed effect, which we refer to as ability. Ability is usually thought of as an innate quality that transcends education, experience, and other observable factors.
We use the following wage equation with individual, industry, regional, and time fixed effects

where
Table 6 in Appendix 1 summarizes the independent variables used to predict career sequence.
Clusters of representative career and moving sequences
To illustrate the representative labor market and neighborhood clusters found by sequence analysis, we use so-called percentage plots. Each cluster is thus represented by a separate graph (see Figures 1–4). At each period, that is, the number of years since immigration, the percentage plot (graph) for each cluster shows the share of individuals that belong to each of the specific states. These states are presented in the legends of Figures 1–4 and correspond to the states described in Tables 1 and 2. The labels found above each graph are our own interpretations of the patterns.
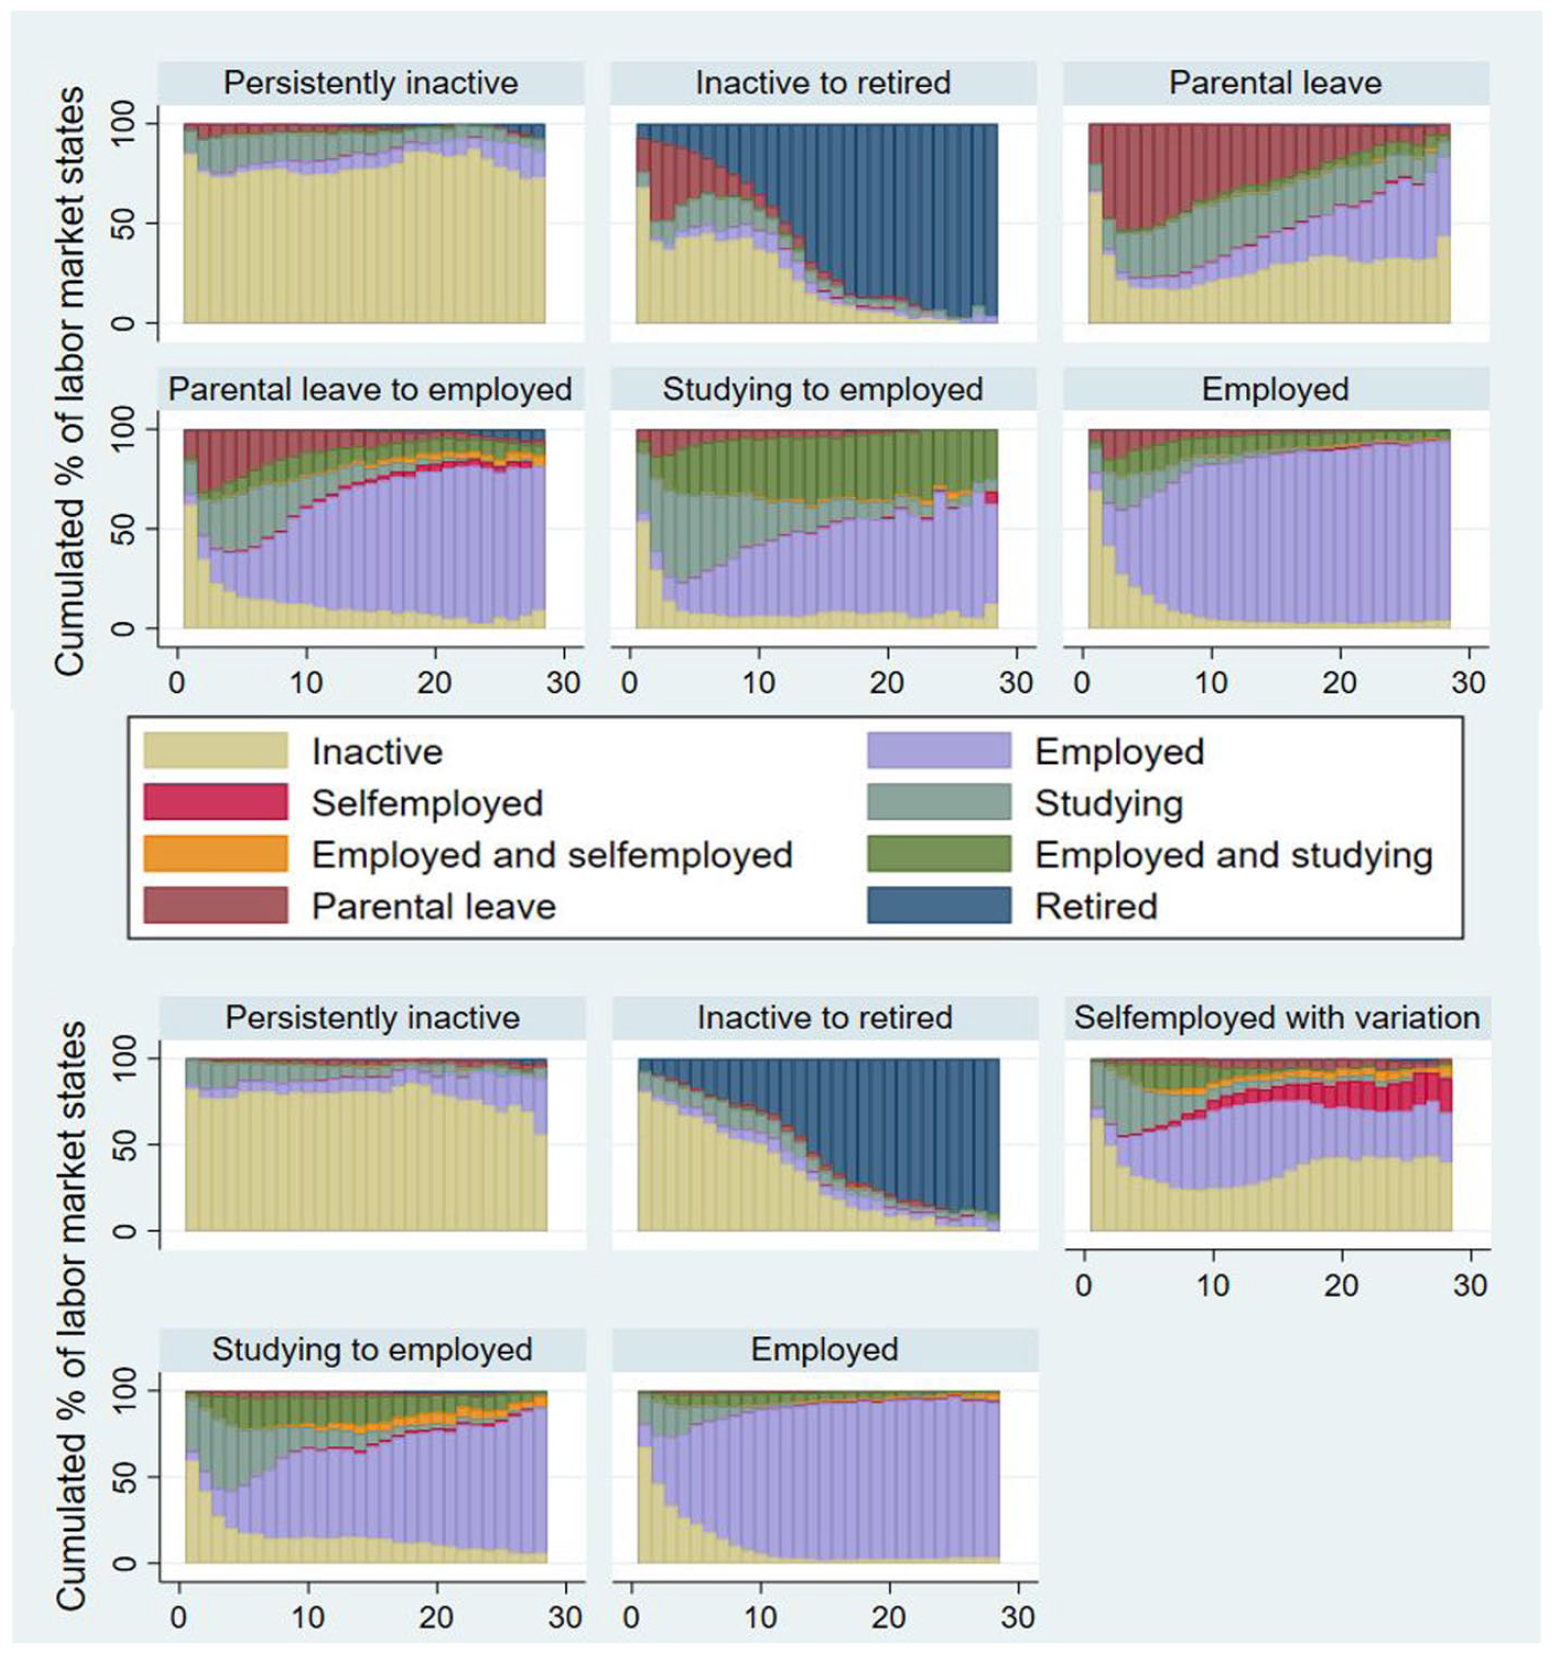
Representative labor market clusters of East African females (above) and East African males (below).
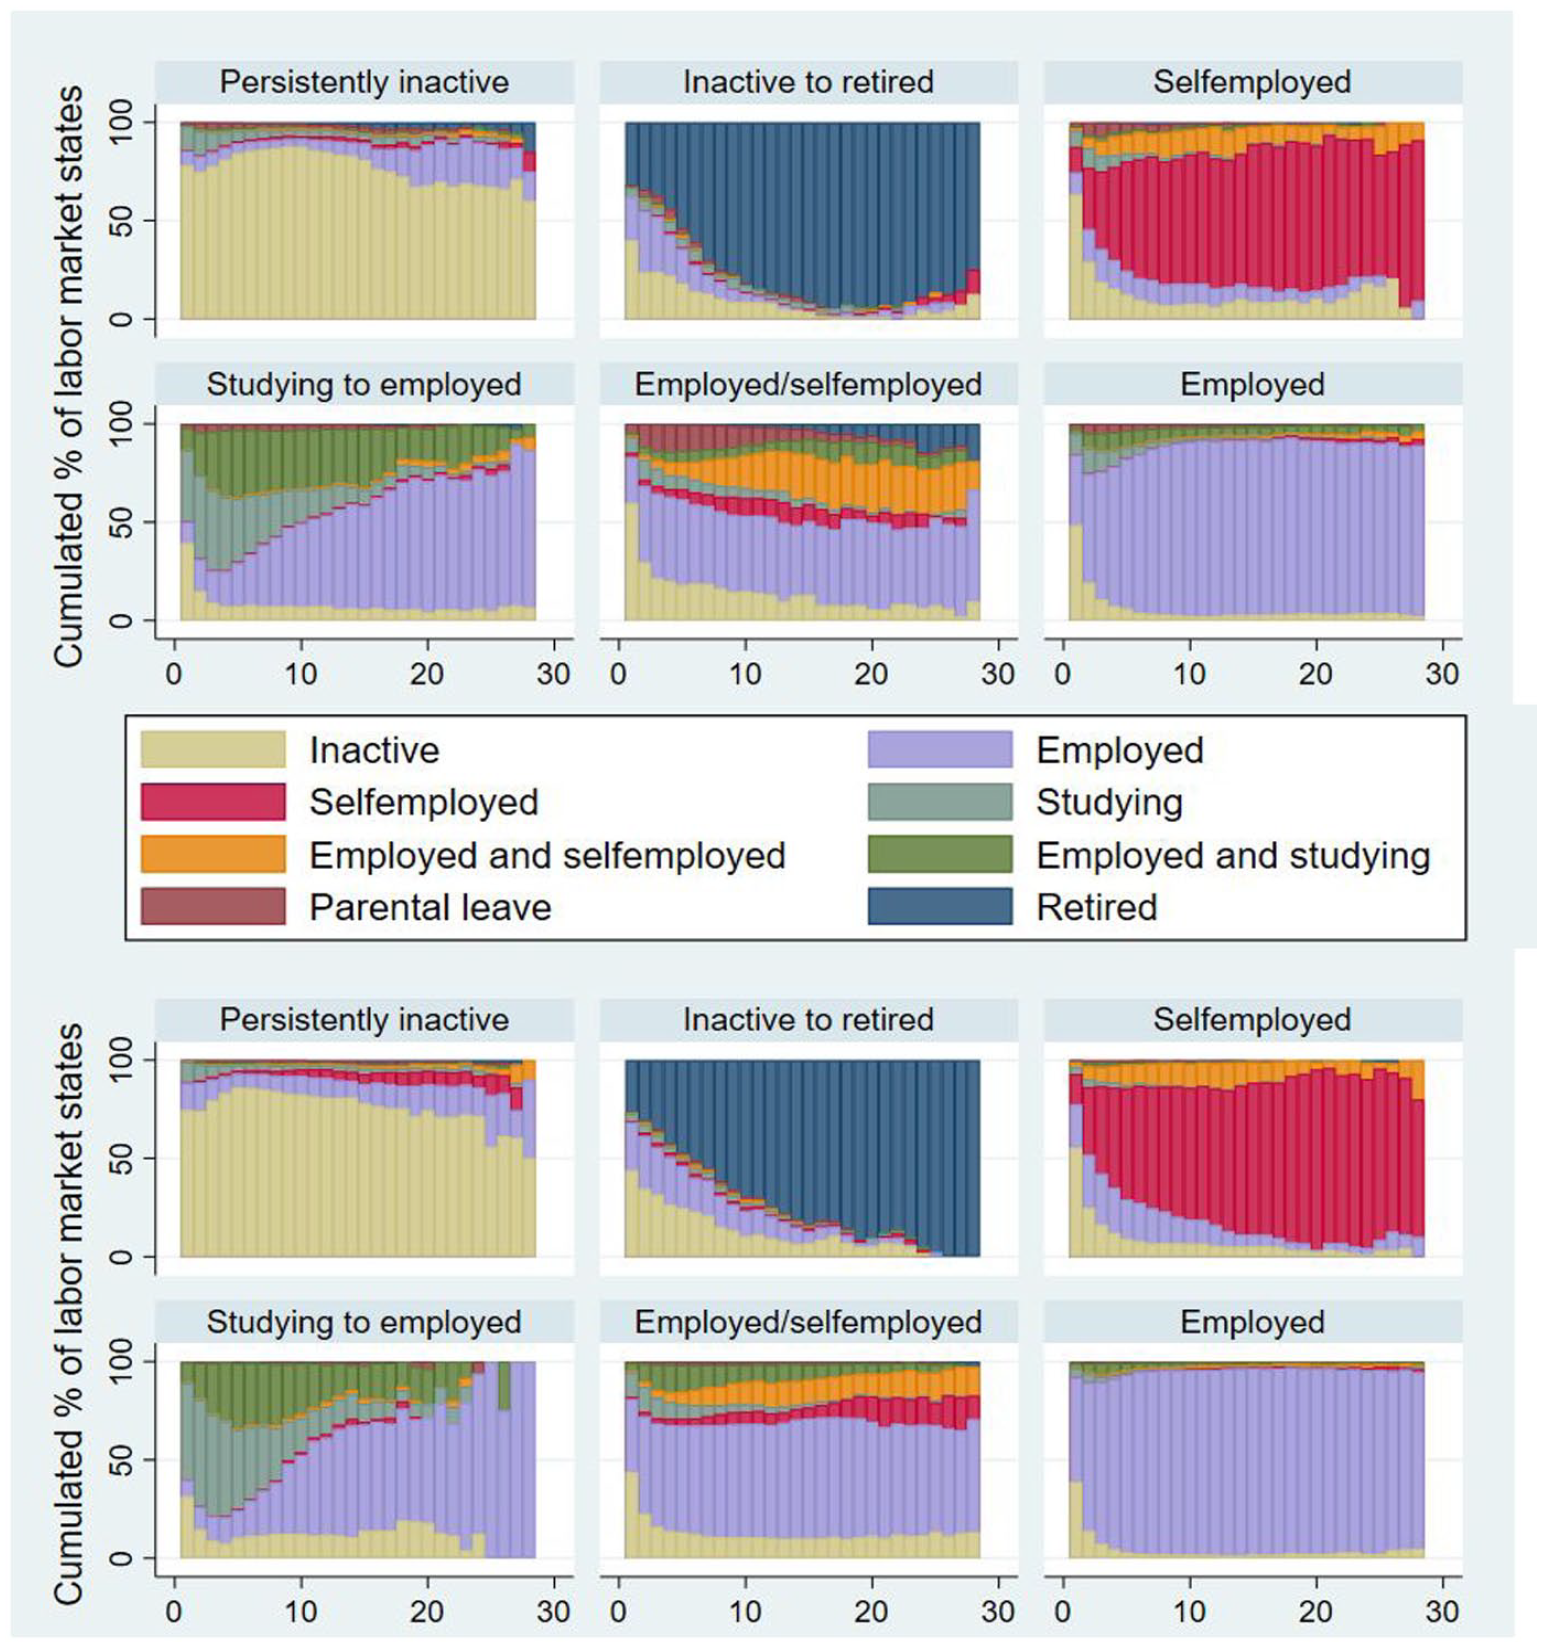
Representative labor market clusters of EU15 females (above) and EU15 males (below).
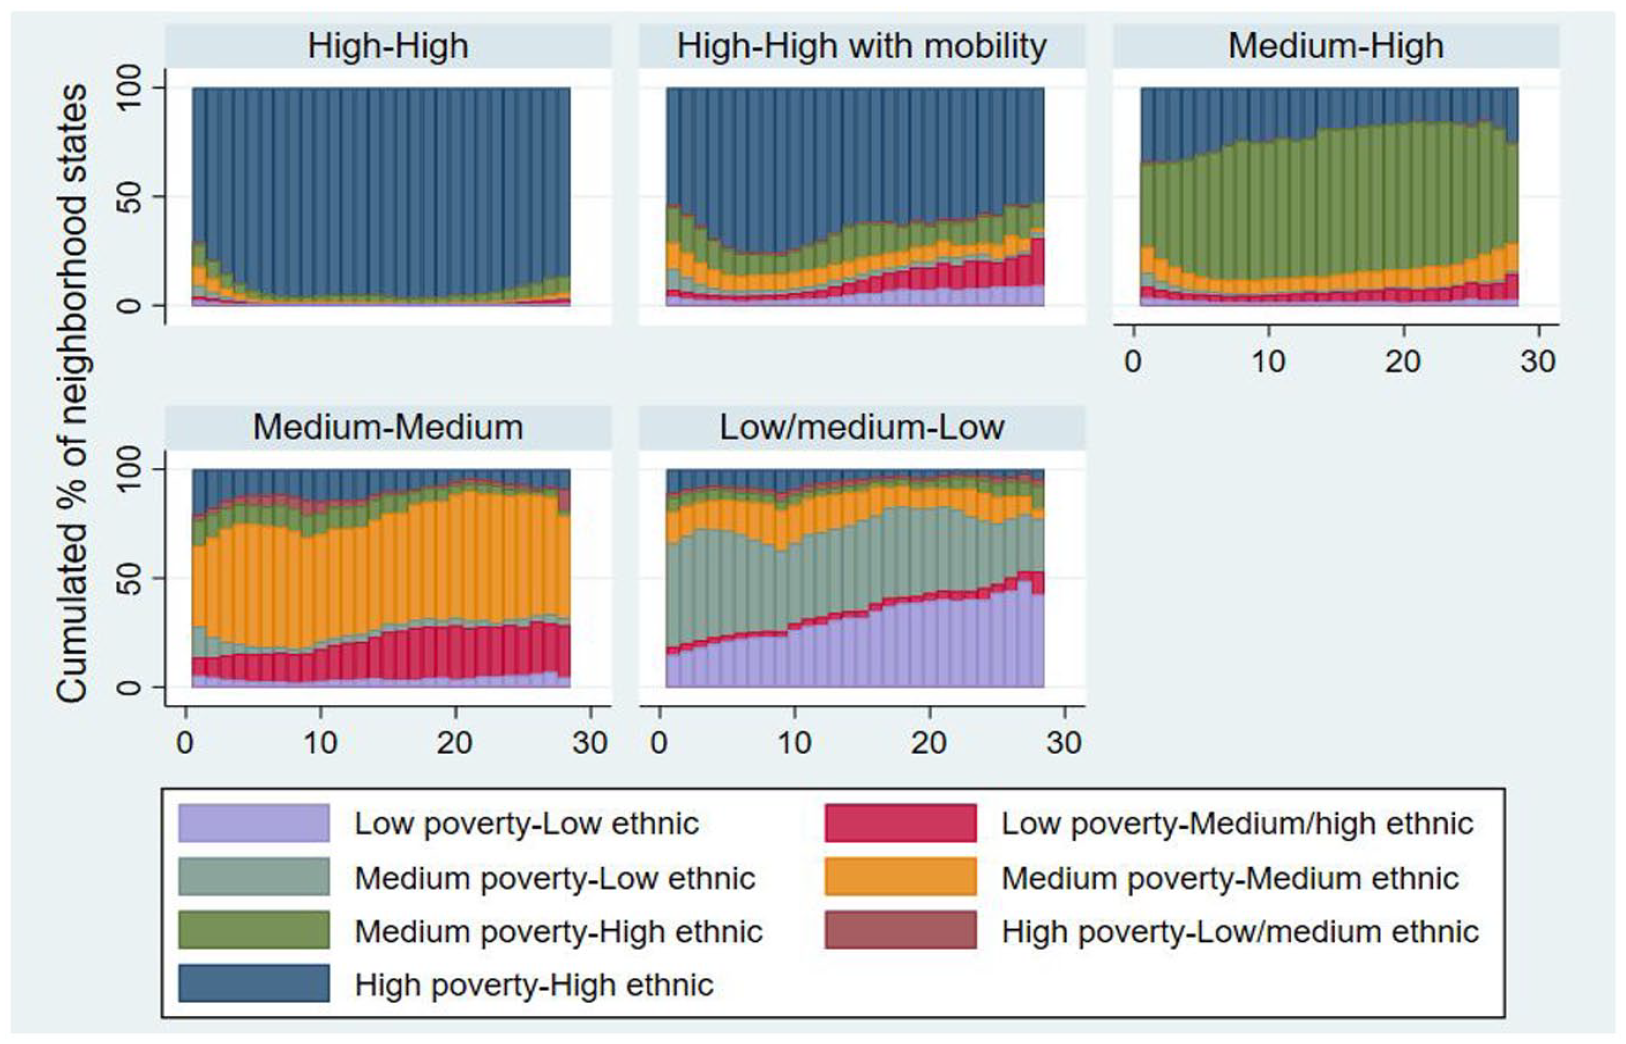
Representative neighborhood clusters of East African immigrants.
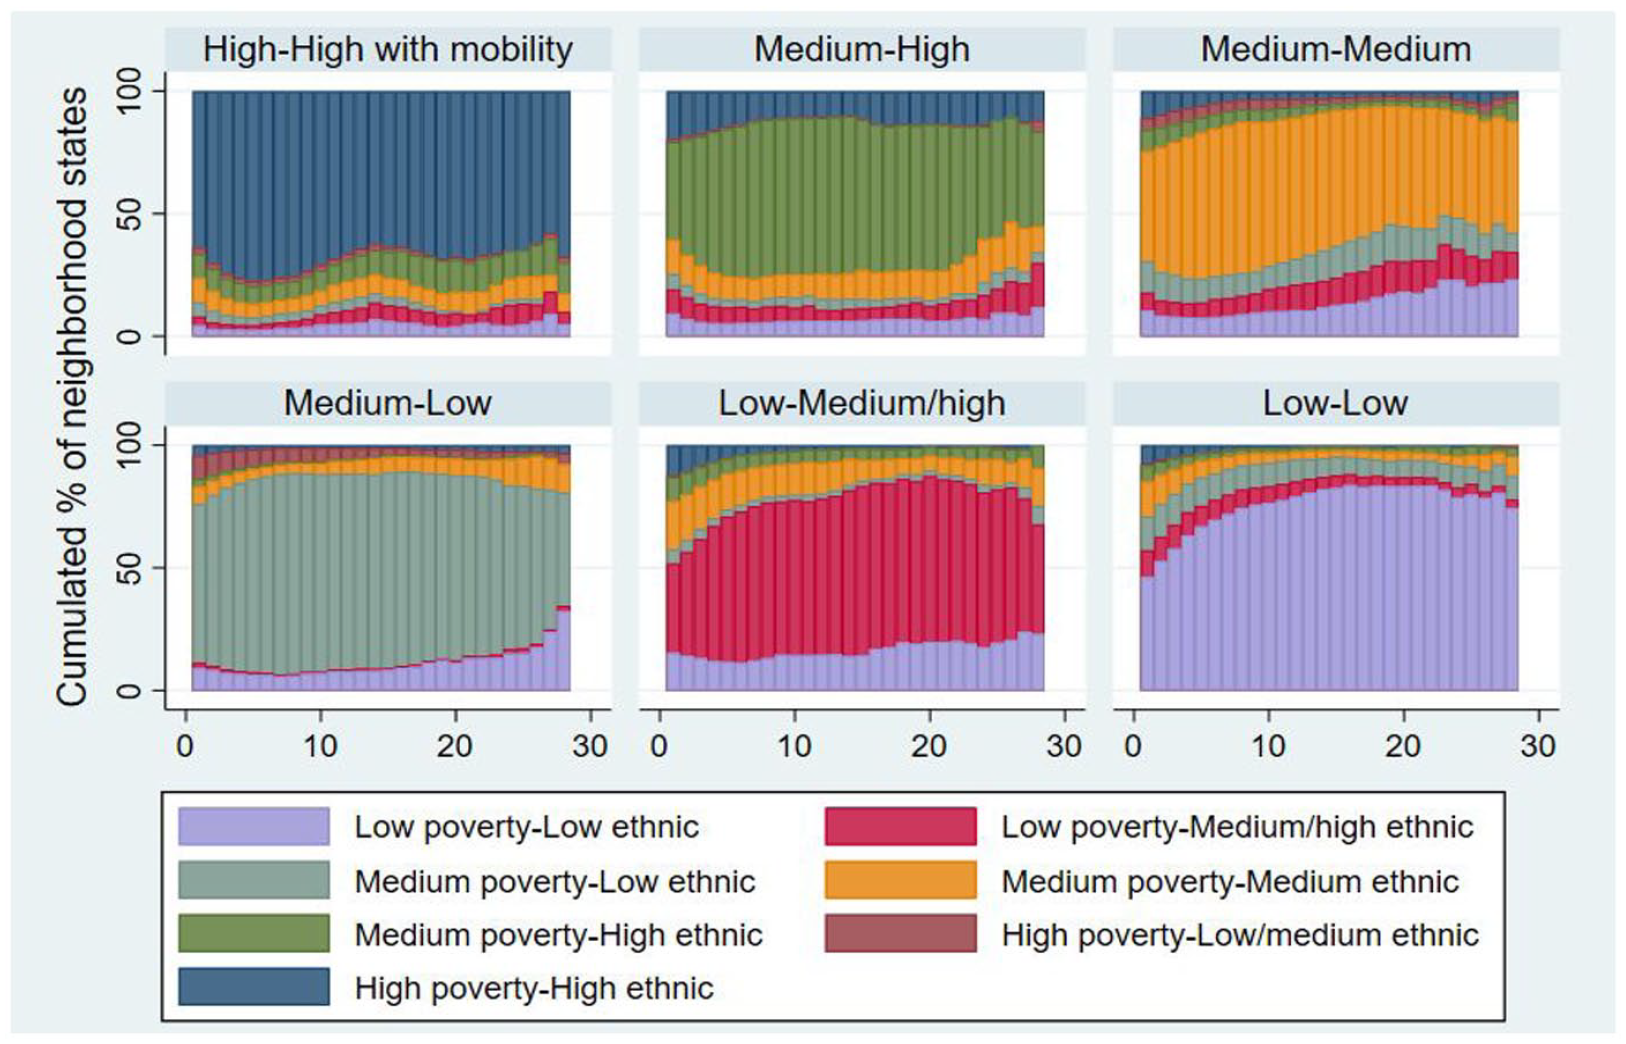
Representative neighborhood clusters of EU15 immigrants.
Representative career sequences
Figure 1 shows the representative labor market clusters for East African immigrants, while Figure 2 presents the corresponding clusters for immigrants from EU15 countries. Presented first is the cluster for East African females labeled Persistently inactive. This labeling springs from the fact that the graph is dominated by inactivity throughout the period. Hence, in all years since immigration, most individuals sorted into this cluster are inactive. At the same time, there are always some individuals who are not inactive, for example, some are studying in their early years since immigration and then toward the end of the period, we see employment as more common. This implies that while many individuals in the cluster Persistently inactive are indeed always inactive, some are moving between inactivity and the other states; however, their individual sequence will always be dominated by inactivity. If they had moved from inactivity in the first years to studying and/or employment in later years, they would instead have been sorted into another cluster, for example, Studying to employed.
Four of the labor market clusters are similar for East African females and males (Figure 1); Persistently inactive, Inactive to retired, Studying to employed, and Employed. These four clusters are also represented among EU15 immigrants (Figure 2). However, despite having the same title/name, the clusters are not directly comparable across ethnic backgrounds and gender. For example, the activities within the cluster Inactive to retired vary across the four groups. Clusters with relatively high shares of parental leave are only visible for East African females, while EU15 immigrants have clusters dominated by self-employment. This neither implies that EU15 women are never on parental leave, nor that no East African women are self-employed. These two states do show up for females of both origins. For EU15 females, parental leave is most visible in the Employed/self-employed cluster, though it does not dominate. For East African females, the self-employed are mostly found in the Parental leave to employed cluster.
For EU15 immigrants, the broad classifications of the clusters are the same across females and males. However, as can be seen from Table 7, the share belonging to each cluster varies across both gender and ethnic background.
In the “Explaining probabilities of different labor market careers” section, we analyze how individual and geographic conditions influence what type of labor market cluster an individual is sorted into, while also distinguishing between active and inactive trajectories.
Representative moving sequences
Figures 3 and 4 present the representative neighborhood clusters for immigrants from East Africa and EU15. As with the labor market trajectories, the neighborhood clusters found by sequence analysis are different between the immigrant groups. Table 8 shows that more than six out of ten East African immigrants have a geographic trajectory dominated by high poverty and high ethnic neighborhoods (High–High). On the other hand, EU15 immigrants are more commonly found in neighborhoods classified as low or medium poverty and low ethnic (Low–Low and Medium–Low). We can thus conclude that immigrants from East Africa move more among neighborhoods with populations that are higher in terms of both risk of poverty and belonging to ethnic minorities, which is in line with the results of Vogiazides and Chihaya (2019).
Within each ethnic group, the representative clusters are the same for females and males, which implies that common neighborhood trajectories do not differ across gender.
Explaining probabilities of different labor market careers
To analyze the determinants of individuals’ labor market careers, we start with two broad groups—Inactive and Active. Figures 5 and 6 illustrate which of the representative labor market clusters found in the “Representative career sequences
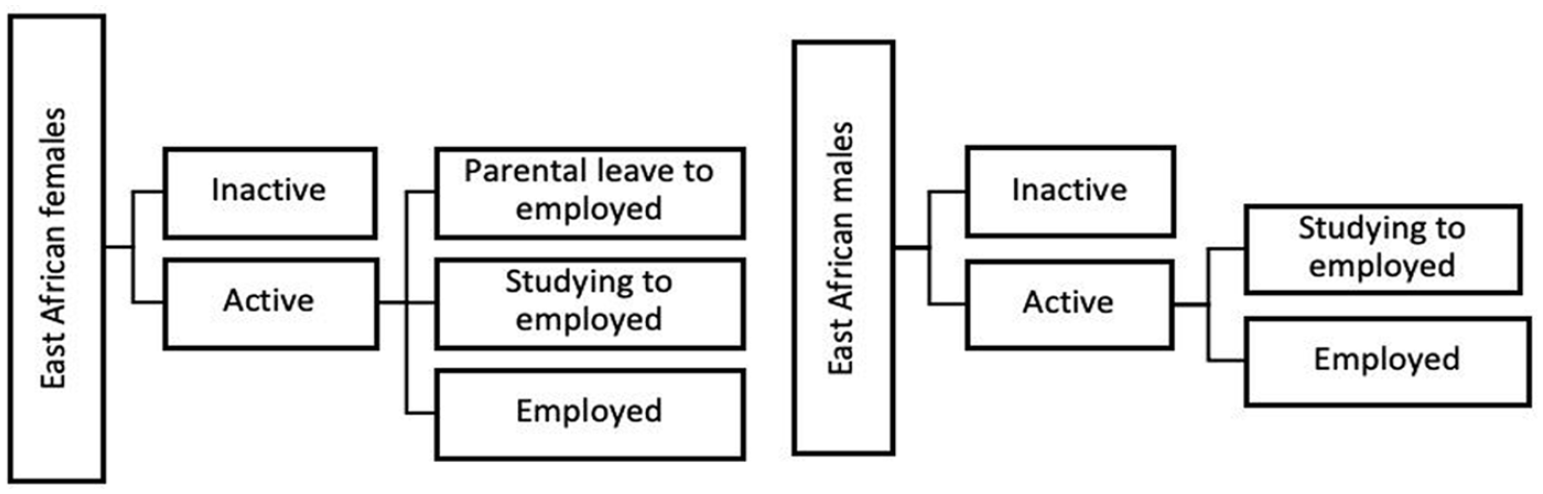
Decision tree for East African females (left) and males (right).
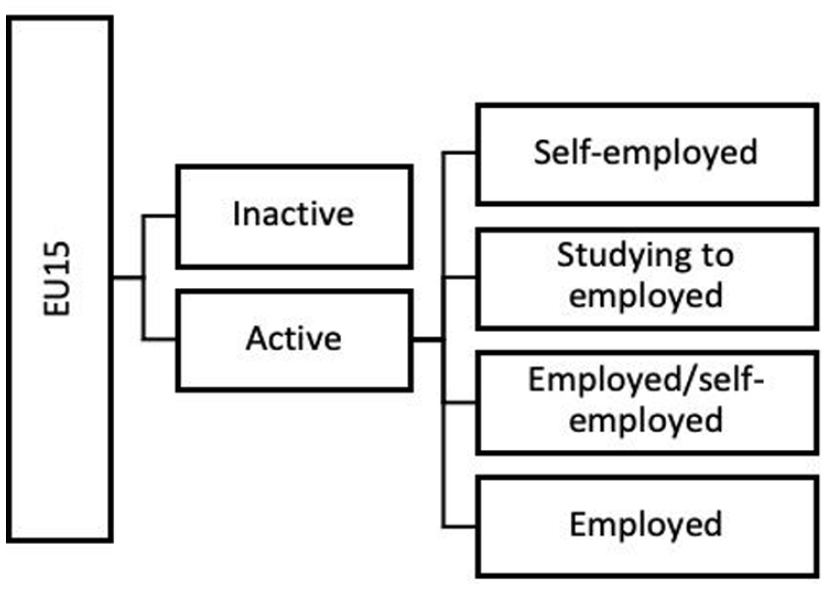
Decision tree for EU15 females and males.
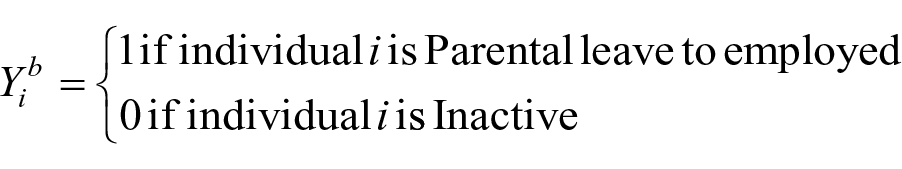
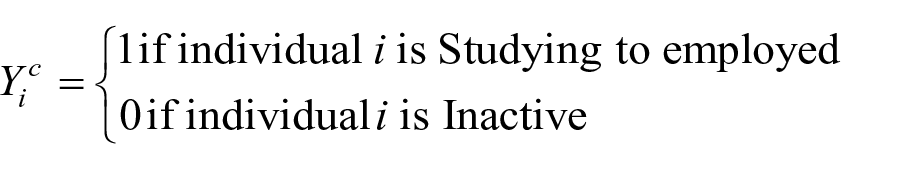
The outcome variable is thus always binary, and in the first step, it is the same across all groups

In the next step, the outcome variables can differ across and within groups. The example below is for East African females

The general empirical model used for the logit estimations is shown by equation (2)

where
Geography and labor market activity
Table 4 presents the results on the relationship between the neighborhood clusters found by sequence analysis as well as the most frequently observed region type, and labor market activity of East African and EU15 immigrants, controlling for individual characteristics. Regarding immigrants originating from EU15, the results are in accordance with the expectations: individuals residing in socioeconomically stronger and less ethnically segregated neighborhoods are more likely to be active in the labor market. The positive relationship may be due to both spatial (cf. Kain, 1968) and social (e.g. Aldén and Hammarstedt, 2014; Portes, 1995) access to job opportunities. In line with the expectations is also that the positive effects of neighborhood seem to be stronger for males compared to females.
Probability of activity in the labor market related to neighborhood cluster and region type by sex and origin.
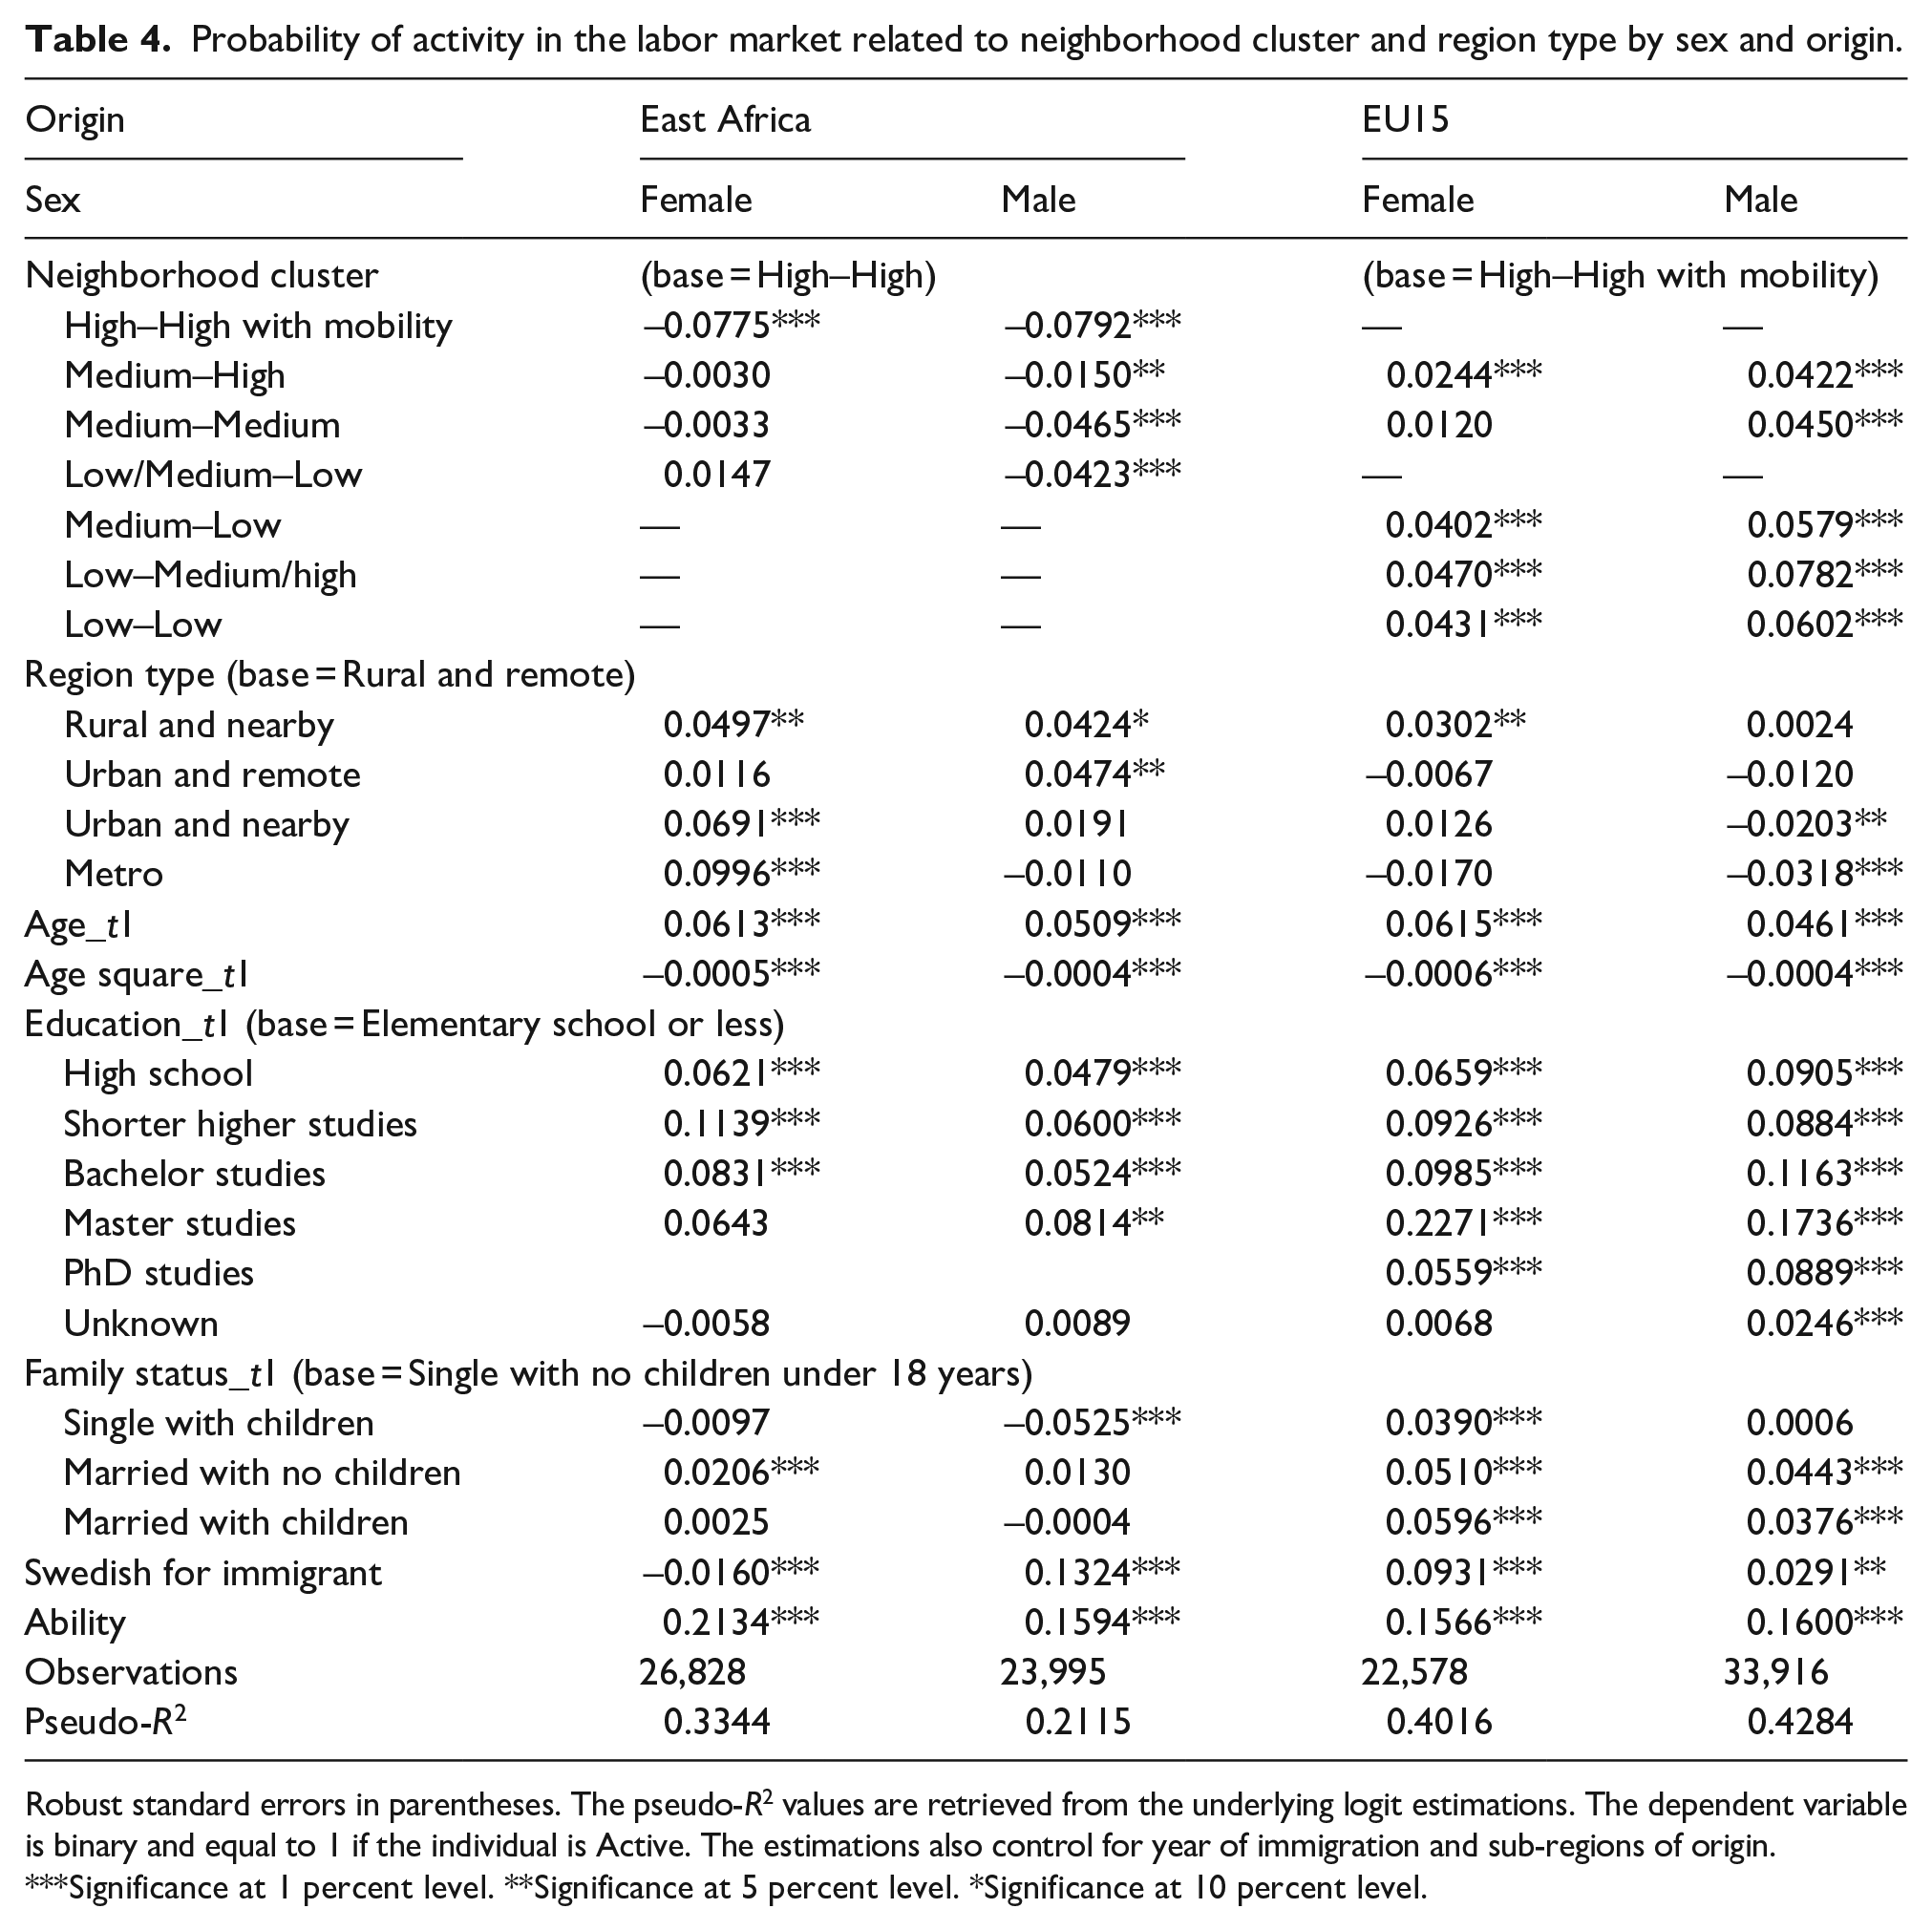
Robust standard errors in parentheses. The pseudo-R2 values are retrieved from the underlying logit estimations. The dependent variable is binary and equal to 1 if the individual is Active. The estimations also control for year of immigration and sub-regions of origin.
Significance at 1 percent level. **Significance at 5 percent level. *Significance at 10 percent level.
For East Africans, the neighborhood cluster High–High with mobility is significantly negative for both genders. That is, the cluster with neighborhoods displaying high poverty and ethnicity rates with some mobility comes out worse than persistently residing in high-poverty, high-ethnicity neighborhoods (High–High, which is the base). This may be connected to the loss of social (ethnic) networks when moving between neighborhoods (Mortimer and Shanahan, 2007). Overall, East African males seem to fare the worst in the labor market when residing in (or moving between) less ethnically segregated and socioeconomically stronger places, which goes against expectations but may be explained by limited networks and social capital of East Africans in neighborhoods dominated by wealthier natives (Bayer et al., 2008; Cutler et al., 2008; Edin et al., 2003; Patacchini and Zenou, 2012).
Regarding regional types, East African females have positive and significant coefficients for metropolitan regions as well as urban and rural regions located near a larger city. East African males have positive and significant coefficients for Rural and nearby regions and Urban and remote regions. Looking at immigrants from the EU15, the pattern is different. For females, the positive and significant coefficient shows up for rural regions close to a larger city (Rural and nearby). For EU15 males, metropolitan regions and urban regions nearby a city display a negative influence. Hence, it is only female East African immigrants that behave according to expected patterns (cf. Duranton and Puga, 2004).
Regarding the individual variables, age is positively correlated with a higher probability of being active but at a decreasing rate for all four groups. The estimate of ability is highly significant and positive, and higher education increases the likelihood of being active in the labor market, which is in line with previous studies for Sweden (Klaesson and Öner, 2021; Wixe and Pettersson, 2020). Regarding family situation within the EU15 group, having children and/or being married is positively related to the probability of being active. For East African males, singles with children are less likely to be active, while for East African females, marriage but not children increases the probability of being active. For all the estimations except East African females, Swedish language training (SFI) is associated with a higher probability of being active in the labor market.
Following previous studies, we test the influence of initial geographic conditions, that is, what type of neighborhood and region the individual resided in at the year of immigration, on labor market activity. The results are presented in Table 5.
Probability of activity in the labor market related to initial neighborhood and region type by sex and origin.
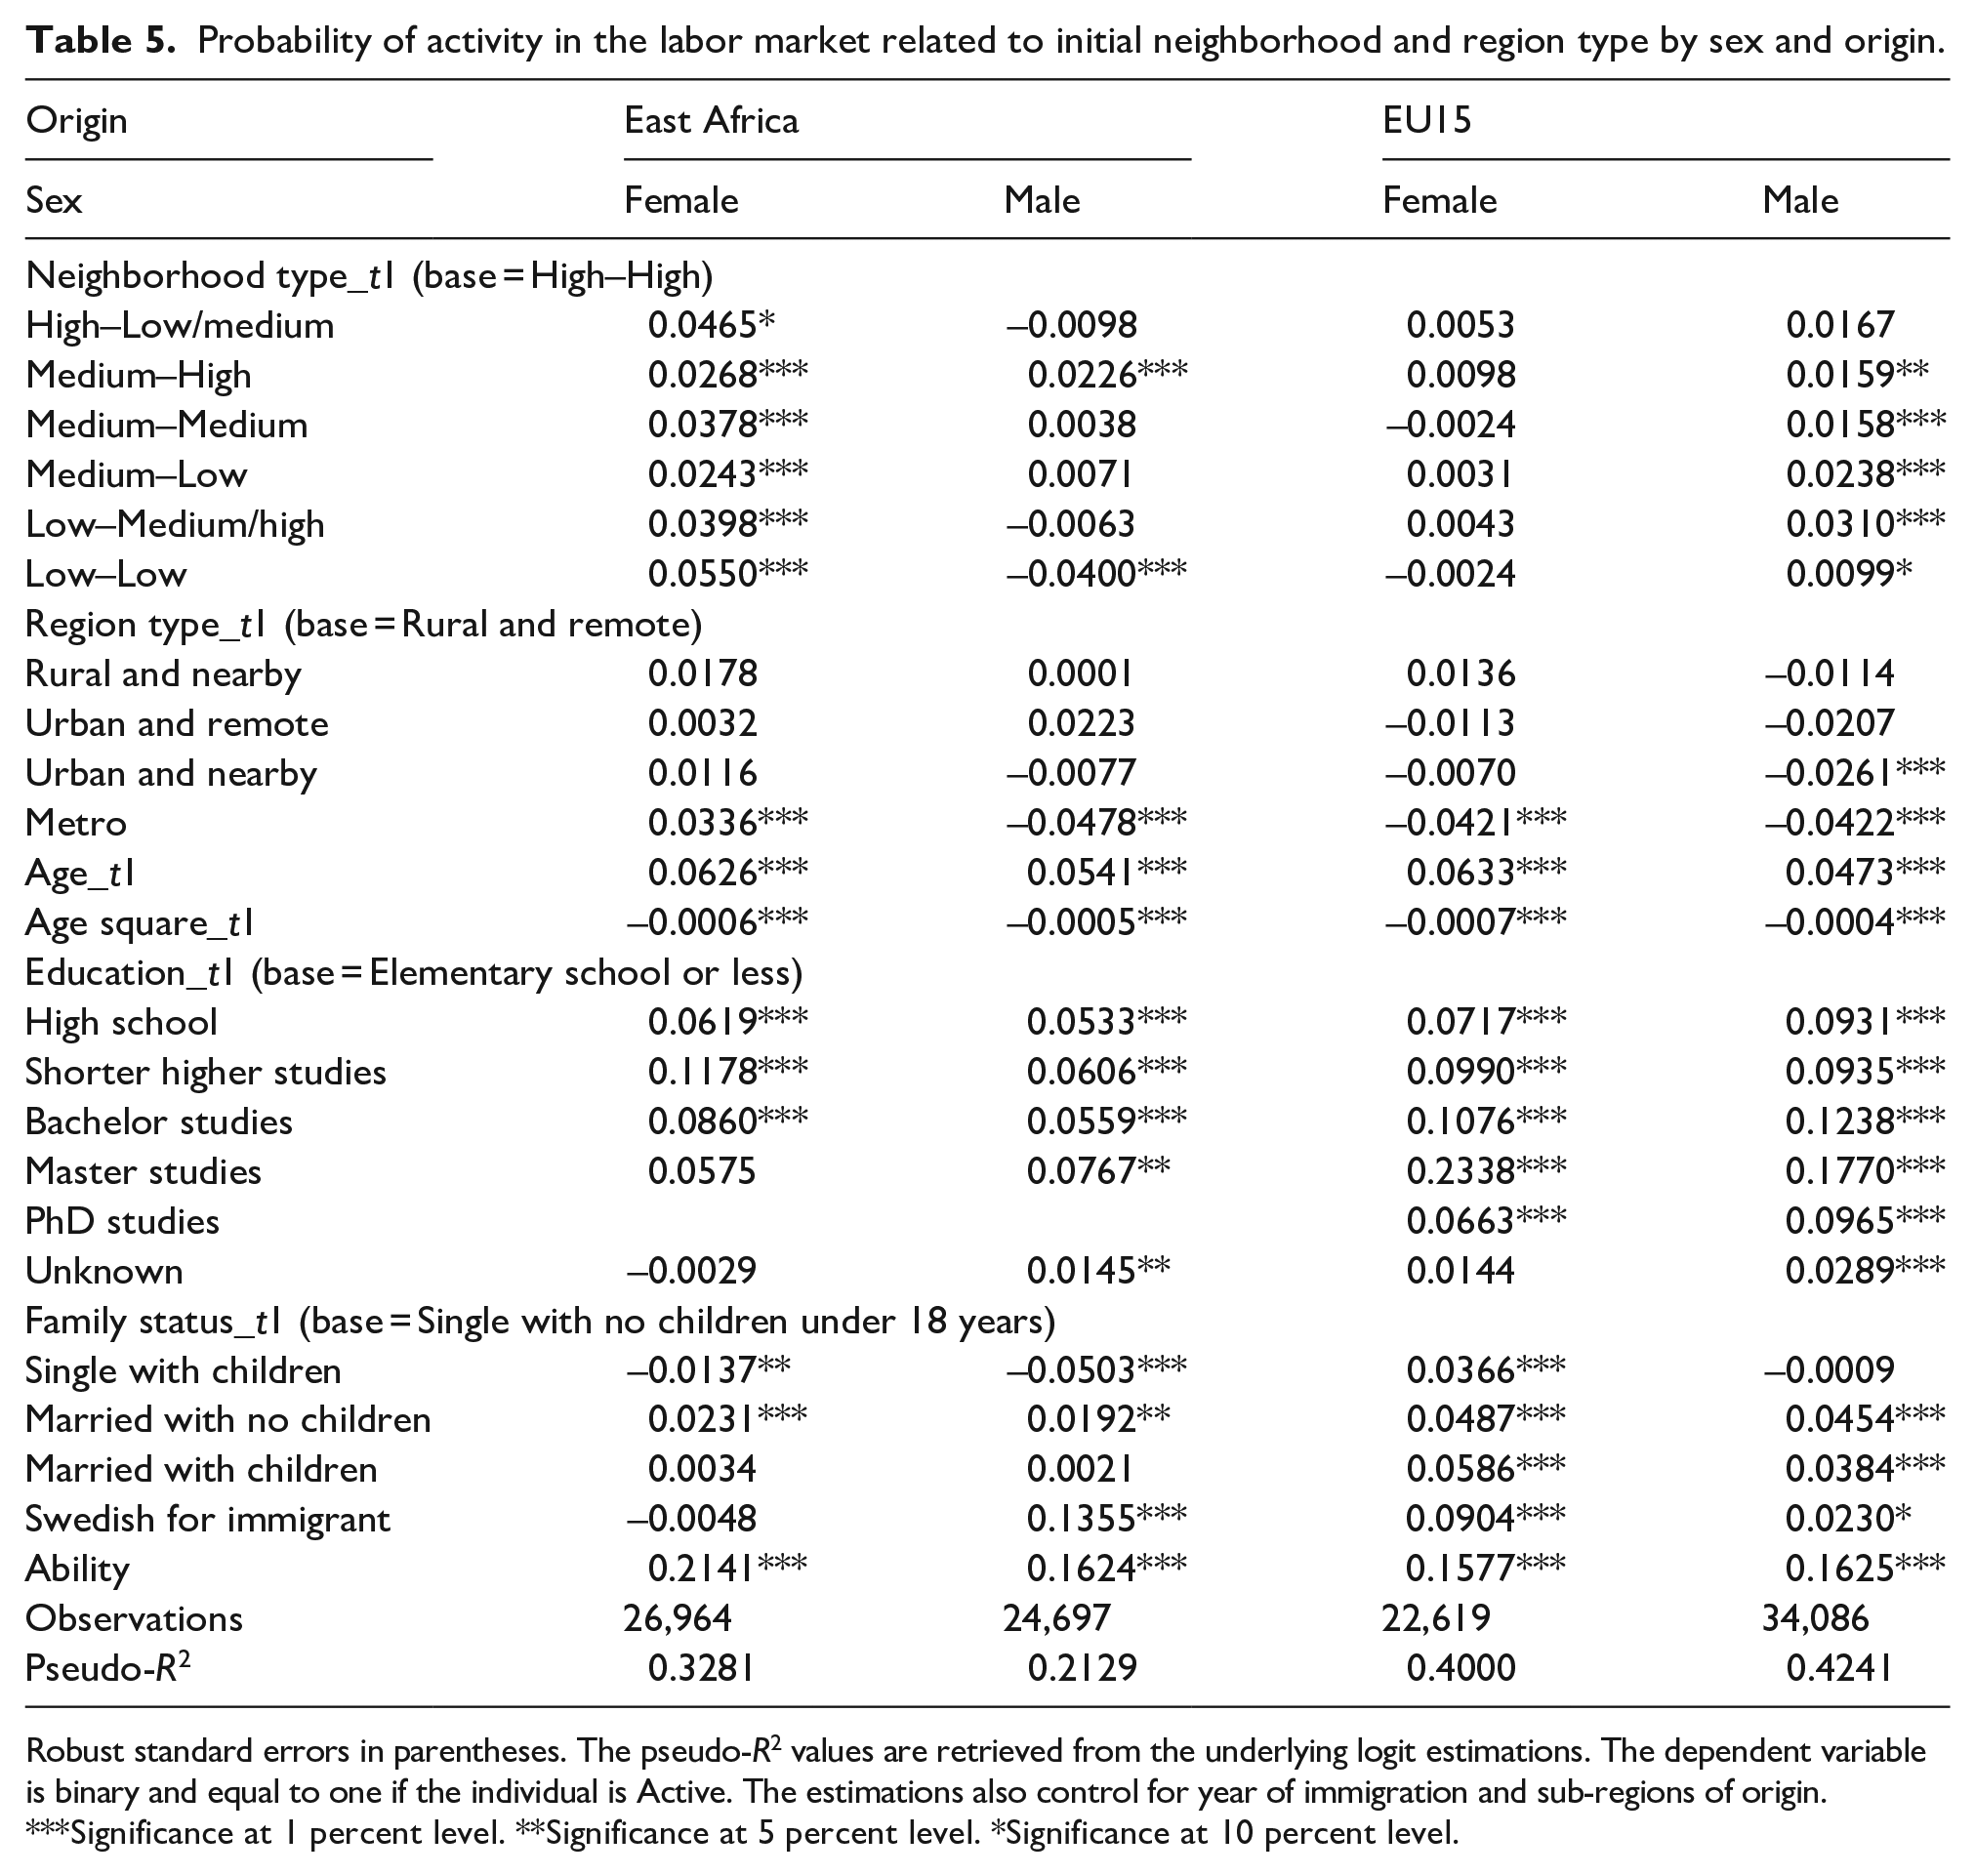
Robust standard errors in parentheses. The pseudo-R2 values are retrieved from the underlying logit estimations. The dependent variable is binary and equal to one if the individual is Active. The estimations also control for year of immigration and sub-regions of origin.
Significance at 1 percent level. **Significance at 5 percent level. *Significance at 10 percent level.
For the initial neighborhood type, the base category is High–High (high share in risk of poverty and high share of non-Nordic/EU15 immigrants) across all four specifications. Females from East Africa and males from EU15 have a higher probability of being active in the labor market when residing in a less ethnically segregated and less poor neighborhood at their arrival in Sweden. This result can be due to adoption of the local social norms and/or links to employment-enhancing social networks (cf. Becker, 1974; Portes, 1995). On the other hand, the labor market paths of females from EU15 do not seem to be influenced by the initial neighborhood of residence. An unexpected result, but which goes in line with Table 4, is that East African males are less likely to take an active labor market path if they initially reside in the least ethnically segregated and least poor neighborhoods. The results on region type are like Table 4, with only East African females benefiting from initially residing in a metropolitan region.
Geography and type of labor market activity
Next, we utilize the information on the various labor market paths within the group of Active to estimate the probability that an individual is sorted into a specific active cluster rather than being inactive.
Female East African immigrants
Table 9 reports the results for female immigrants from East Africa. There are three different active clusters for this group: Parental leave to employed, Studying to employed, and Employed. Most coefficients for initial place are positively significant, indicating that females who initially reside in less ethnically segregated and socioeconomically stronger neighborhoods are more likely to take either of the active paths, rather than being inactive. The marginal effects tend to be stronger for the neighborhoods with the lowest shares in risk of poverty and the lowest shares of non-Nordic/EU15 immigrants.
Regarding the initial region type, the positively significant result for metropolitan regions in Table 5 can be seen for two of the active labor paths, Parental leave to employed and Studying to employed. Hence, East African females initially residing in metro-regions are more likely to take a path through either parental leave or studies to employment rather than being inactive. For Studying to employed, this is also the case for those residing in dense municipalities near a larger city, although the AME is smaller and weakly significant. The likely reason for the results on studying is that more education facilities are found in larger places. In contrast, we find no support that the initial region type influences the probability that female East Africans are sorted into the cluster Employed.
For the neighborhood clusters in Table 9, the pattern of results differs compared to initial geography. However, these results are not directly comparable since the initial neighborhood type is directly observed while the neighborhood cluster is based on similarities in residential/moving patterns among individuals. Through all three types of outcomes, the coefficient for High–High with mobility comes out negative and significant. This means that the geographic sequence High–High with mobility is worse (for the probability of taking one of the active paths) than the High–High one, which is the base for all three outcomes. This suggests that individuals who remain in the high risk of poverty–high ethnic share neighborhoods for the duration of the study period do better than those who move to other (less ethnically segregated and less poor) neighborhoods but move back to the High–High neighborhoods where they spend most of the time. As noted above, one explanation for this result is that those who move back and forth may have less stable peer networks that might aid in getting a job.
As opposed to the consistency for initial neighborhood place across the three active paths, the results differ for the neighborhood clusters. East African females are less likely to be active in the form of Parental leave to employed, than being inactive when being sorted into a neighborhood cluster that is less poor and/or less ethnically segregated. On the other hand, the results for Studying to employed go in the opposite direction. Hence, females from East Africa are more likely to study and then get employed when they reside in (or move between) socioeconomically stronger neighborhoods with a smaller share of non-Nordic/EU15 immigrants. This labor market path may be expected to be more beneficial than going from Parental leave to employed since studying typically leads to higher status and better-paid jobs. The differences in signs in Table 9 for the neighborhood clusters across the three active paths can explain the mainly insignificant neighborhood results for female East Africans in Table 4. This shows the importance of disentangling the various active labor market paths.
Male East African immigrants
Table 10 reports the results for male immigrants from East Africa. Two types of active labor market paths are identified in the data: Studying to employed and Employed.
Regarding the initial neighborhood and comparing with the base High–High, it is more likely that an East African male follows the path Studying to employed rather than being inactive if the initial neighborhood is Medium–High or Medium–Low. An unexpected result is that the neighborhood types with low poverty correlate with a higher probability of inactivity rather than Studying to employed, which contrasts with the female outcomes. Looking at the individuals sorted into the cluster Employed, we observe a similar pattern. The most robust result seems to be that individuals residing in neighborhoods with low shares of both poor and non-Nordic/EU15 immigrants are less likely to be active, both in terms of studying and employment.
The results for initial region type are in line with Table 5. Only the marginal effects for metro-regions are significant and the relationships are negative. Hence, male East Africans are more likely to be inactive than to take a labor market path dominated by either employment or studying and later employment when residing in a metropolitan region than when residing in a rural and remote region. In total, region type seems to play a marginal role in the determination of labor market paths of East African males, which is also supported by the mainly insignificant results for most frequently observed region type in Table 10.
EU15 immigrants
For male and female immigrants originating from EU15, the data indicate four different paths to activity in the labor market: Self-employed, Studying to employed, Employed/self-employed, and Employed. The active outcomes are thus more diverse for this immigrant group as compared to East Africans.
Regarding initial neighborhood place and initial region type for females, Table 11 shows no general pattern for the four labor market clusters, which can explain the mainly non-significant results for EU15 females in Table 5. EU15 immigrants are less likely to be in the cluster Studying to employed than being inactive when initially residing in a neighborhood with low ethnic segregation. The results for Self-employed and Employed show some positive correlations between initially residing in socioeconomically stronger and less ethnically segregated neighborhoods and the probability of being active. Regarding the neighborhood clusters, the results in Table 11 are overall consistent with the results for female EU15 immigrants in Table 4, except for the path of Studying to employed. Hence, residing in (or moving between) socioeconomically stronger and less ethnically segregated neighborhoods promotes both self-employment and employment over inactivity, which is in line with the expectations.
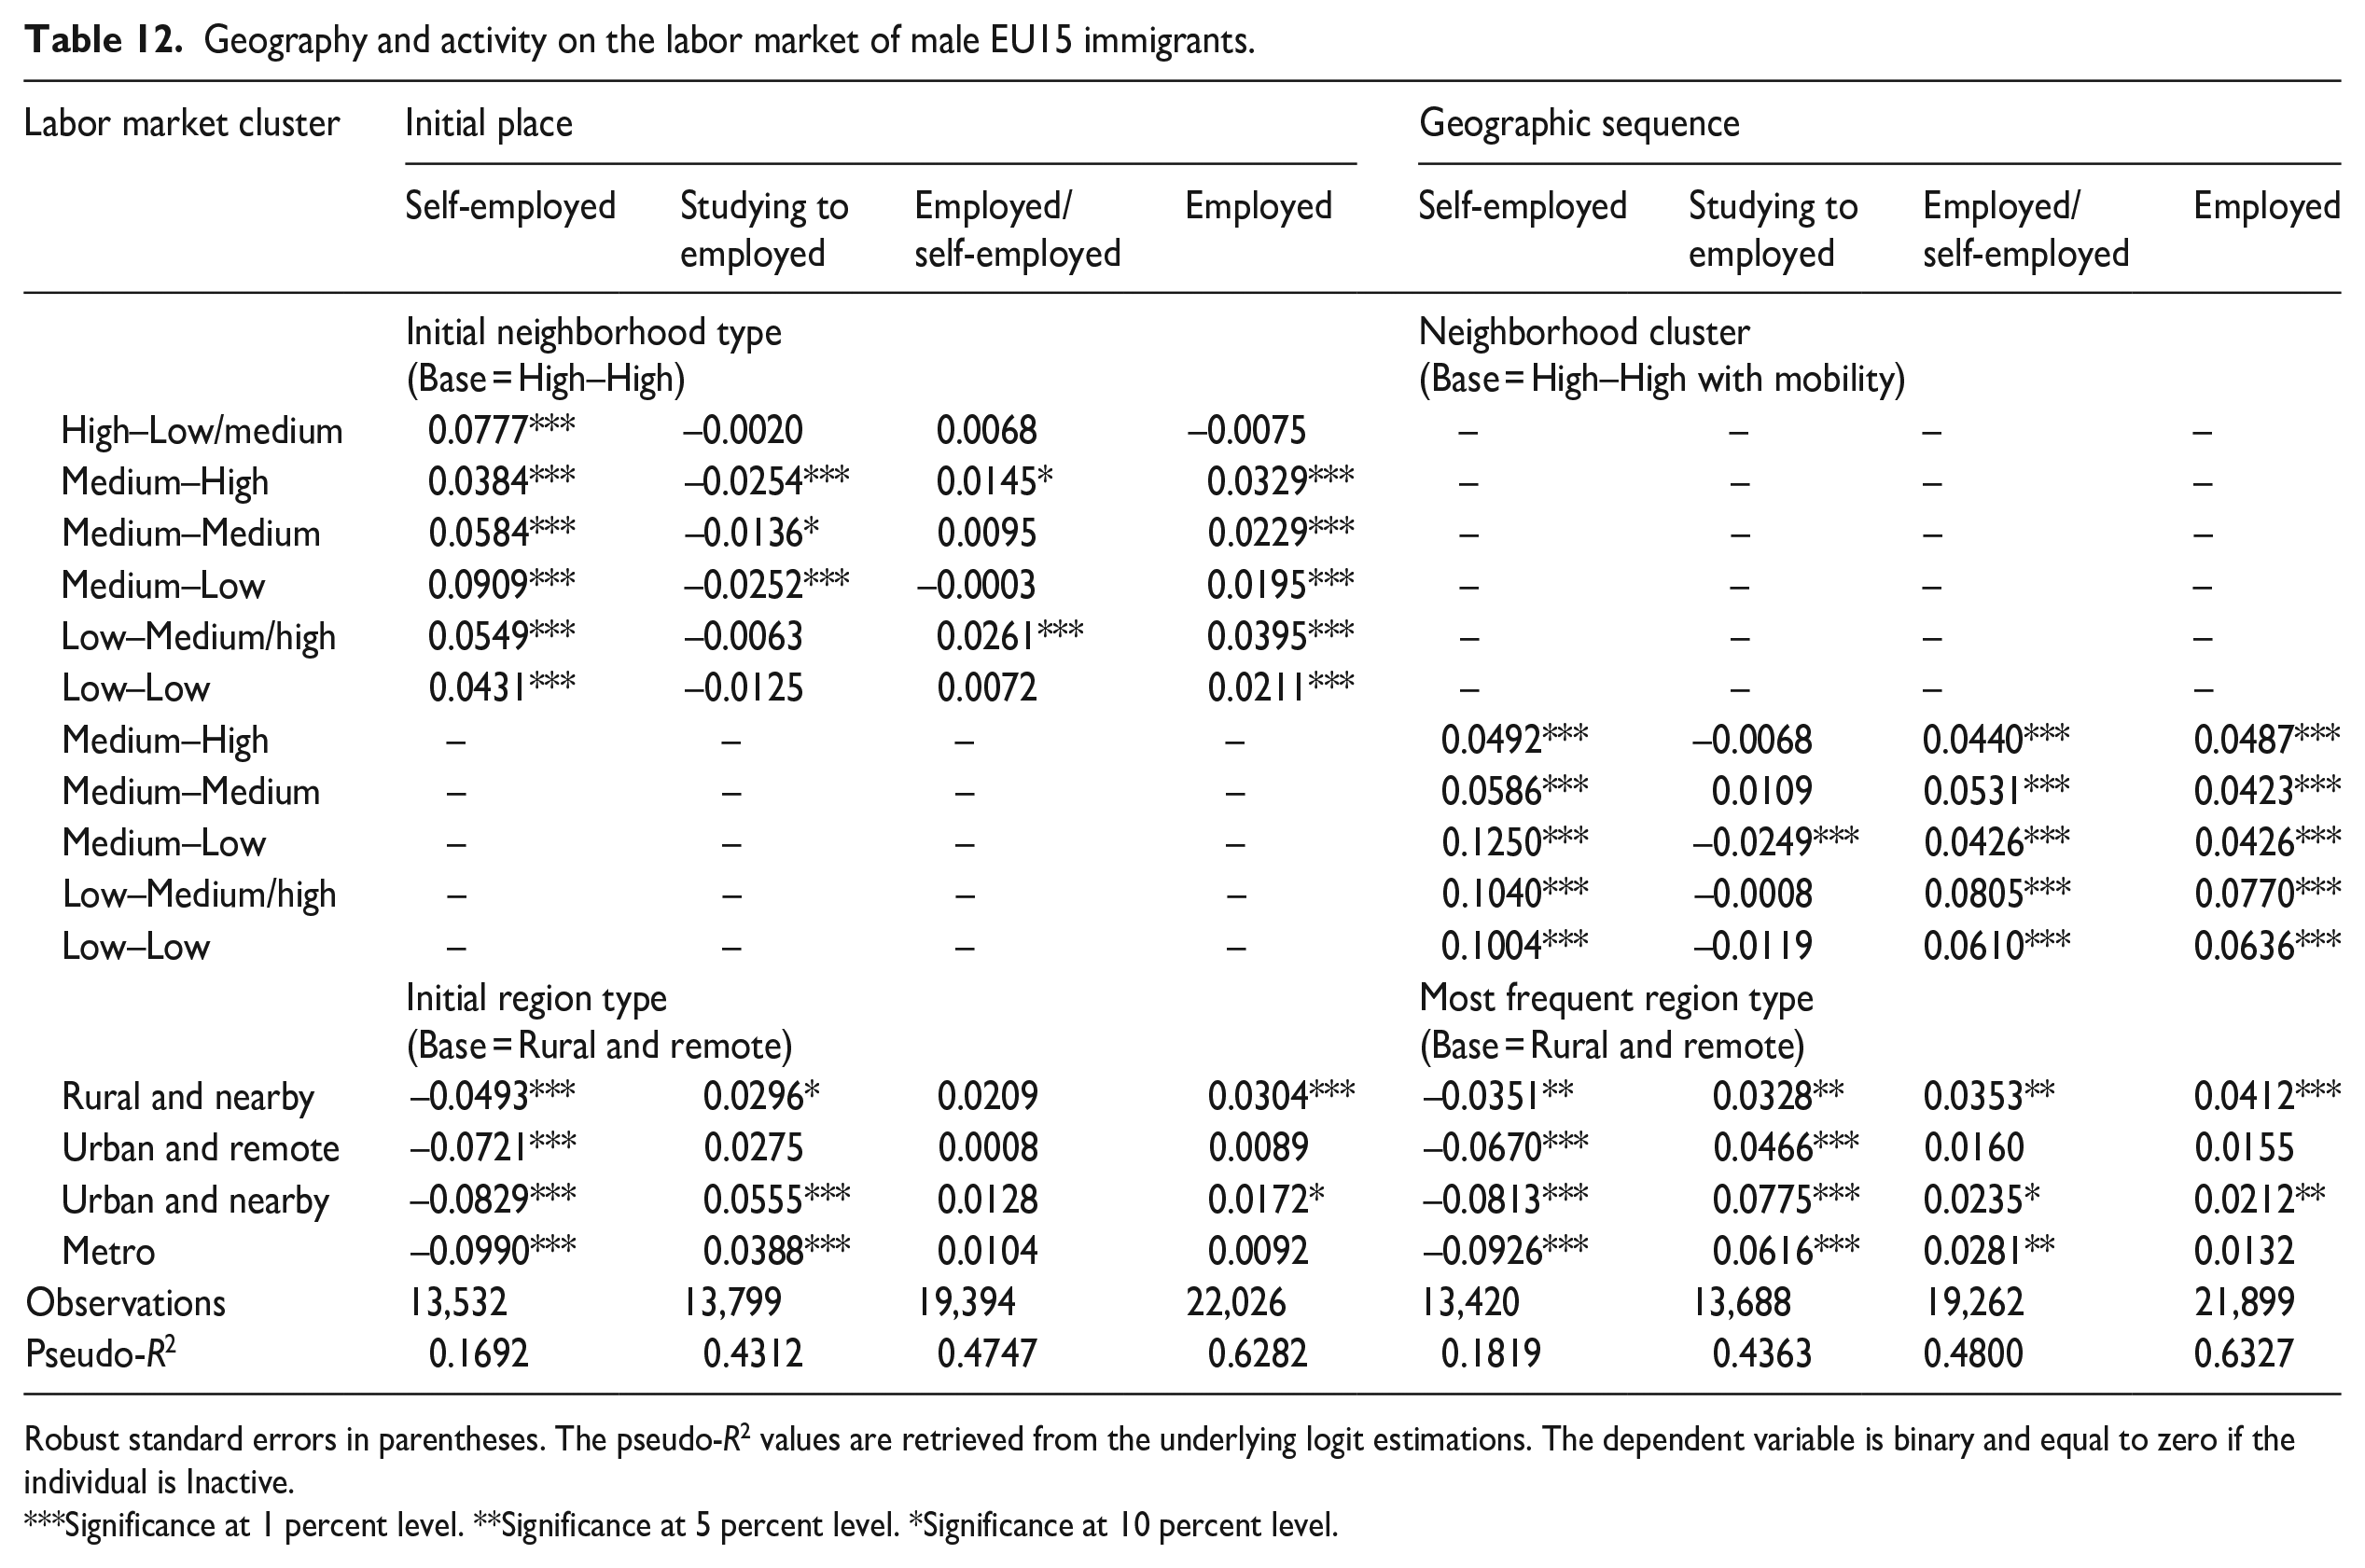
The results for male EU15 immigrants are reported in Table 12. The estimates for the neighborhood level are relatively robust across initial neighborhood types and neighborhood clusters (even though these are not directly comparable, they go in the same direction). They are also consistent with the results on neighborhoods reported in Tables 4 and 5 (for the overall probability to be active). Male EU15 immigrants are more likely to be self-employed and/or employed when initially residing and/or continuously residing in neighborhoods with lower shares in risk of poverty and of non-Nordic/EU15 immigrants. As for females, the exception is the cluster Studying to employed, which seems to be less common than inactivity in socioeconomically stronger and less ethnically segregated neighborhoods. The gender differences in the results for EU15 immigrants support previous studies showing that males are more affected by neighborhood characteristics than females (Andersson, 2021; Wixe and Pettersson, 2020).
Tables 11 and 12 show that the negative probability to be active for EU15 females and males in metropolitan regions, as compared to rural and remote regions, reported in Table 5 (partly Table 4), is driven by individuals in the cluster Self-employed. The results also show that more urban regions do seem to promote both studying and employment paths, which can be explained by agglomeration economies (cf. Duranton and Puga, 2004).
Summary and conclusions
In this study, we disentangle labor market processes and geographic trajectories of female and male immigrants from East Africa and EU15, from their year of entering Sweden between 1991 and 2010 up until 2018. Sequence analysis is used to create clusters based on the time ordering of labor market activities and place (neighborhood) choices. In the empirical estimations, these representative clusters form our dependent variable (labor market sequence) and the independent variable in focus (neighborhood sequence). Moreover, we test the influence of the type of labor market region the individual resides in, and the geographic conditions at the year of immigration, controlling for individual characteristics, including an empirically estimated measure of individual ability. Connecting geographic sequences to labor market paths and controlling for abilities beyond formal education make this study unique in the existing research on labor market integration.
The results show that both the labor market trajectories and the geographic trajectories differ considerably between East African and EU15 immigrants. East Africans tend to reside in neighborhoods with a higher degree of both socioeconomic and ethnic segregation. These neighborhoods are likely to be characterized by strong ties (Granovetter, 1973, 1995) and bonding social capital (Putnam, 2000), resulting in ethnically and socially bounded networks. Despite this, the labor market activity of East Africans seems to be less influenced by neighborhood trajectories than for the EU15 immigrants. Labor market activity of immigrants from EU15 countries, and female East African immigrants, is, however, positively influenced by residing in less ethnically segregated and socioeconomically stronger neighborhoods. These neighborhoods are important for East African females being sorted into a track of studying followed by employment.
From the perspective of an East African female, more affluent neighborhoods provide a weaker (or non-existent) ethnic enclave. Instead, her average neighbor is likely to be a native Swede, employed, and earning a higher wage. The positive influence on labor market activity of residing in such a neighborhood may thus be due to access to higher quality networks that, for example, provide links to the labor market or carry information about studying possibilities (cf. Schüller, 2022). In addition, the likelihood to acquire Swedish language skills is larger with native neighbors and fewer possibilities to rely solely on one’s own language. We see a tendency that EU15 immigrants also benefit from such opportunities in their labor market processes. A conclusion from our study is thus that it may be beneficial to point some immigrants to less distressed neighborhoods.
A confounding circumstance is that our results show that moving to socioeconomically stronger and less ethnically segregated neighborhoods is counterproductive for East African males. A potential explanation for this could be cultural barriers making it difficult for East African men to access and benefit from native social networks (cf. Kawalerowicz, 2021). Further studies are needed to ascertain whether it is the East African males that are the exception to the rule or whether there are larger variations across immigrant groups. There may thus not be a one-size-fits-all type of policy when it comes to strategies for neighborhood (re-)location of immigrants.
Regarding regional types, immigrants who reside in a larger labor market area often have a higher probability to take a path dominated by studying and/or employment rather than being inactive. On the other hand, self-employment among EU15 immigrants seems to be more common when residing in a rural and remote region, indicating that it may be driven more by necessity than opportunity (cf. Eriksson and Rataj, 2019). The benefits (economies) of agglomeration, especially more effective matching in the labor market (cf. Duranton and Puga, 2004), can help explain these results. The exception is again East African males, who tend to be less integrated in the labor market if they reside in metropolitan regions. This may be due to larger ethnic concentrations in bigger cities, which can cause lock-in effects in groups with low education, employment, and income levels. Ethnically and socially bounded networks can thus be expected to be stronger in metropolitan regions, preventing East African males to benefit from agglomeration economies. That East African females seem to be better at utilizing the benefits in more urban regions may be due to weaker roles in the ethnic group and/or labor market projects directed toward women. Further studies, especially using qualitative methods, are encouraged to delve into this issue.
The overall results point to a conclusion that both the initial placement of immigrants and their geographic movements over time have consequences for their labor market careers. Immigrants from EU15 countries have on average a higher observed education level as well as a higher estimated ability than East African immigrants, two factors that are both statistically and economically significant in the higher probability of entering successful labor market pathways. At the same time, EU15 immigrants originate from countries culturally and institutionally more like Sweden than East Africans. Individuals from East Africa may thus be endowed with human capital qualities that are not acknowledged or cannot be utilized in Sweden, and are thus not fully captured by our empirical estimate of ability (cf. Luik et al., 2016). The non-transferability of human capital may pose additional challenges for East African immigrants on the Swedish labor market. Nevertheless, the results of this study indicate that policies might be developed that help improve labor market integration for these populations.
Footnotes
Appendix 1
Geography and activity on the labor market of male EU15 immigrants.
| Labor market cluster | Initial place | Geographic sequence | ||||||
|---|---|---|---|---|---|---|---|---|
| Self-employed | Studying to employed | Employed/self-employed | Employed | Self-employed | Studying to employed | Employed/self-employed | Employed | |
| Initial neighborhood type |
Neighborhood cluster |
|||||||
| High–Low/medium | 0.0777*** | –0.0020 | 0.0068 | –0.0075 | – | – | – | – |
| Medium–High | 0.0384*** | –0.0254*** | 0.0145* | 0.0329*** | – | – | – | – |
| Medium–Medium | 0.0584*** | –0.0136* | 0.0095 | 0.0229*** | – | – | – | – |
| Medium–Low | 0.0909*** | –0.0252*** | –0.0003 | 0.0195*** | – | – | – | – |
| Low–Medium/high | 0.0549*** | –0.0063 | 0.0261*** | 0.0395*** | – | – | – | – |
| Low–Low | 0.0431*** | –0.0125 | 0.0072 | 0.0211*** | – | – | – | – |
| Medium–High | – | – | – | – | 0.0492*** | –0.0068 | 0.0440*** | 0.0487*** |
| Medium–Medium | – | – | – | – | 0.0586*** | 0.0109 | 0.0531*** | 0.0423*** |
| Medium–Low | – | – | – | – | 0.1250*** | –0.0249*** | 0.0426*** | 0.0426*** |
| Low–Medium/high | – | – | – | – | 0.1040*** | –0.0008 | 0.0805*** | 0.0770*** |
| Low–Low | – | – | – | – | 0.1004*** | –0.0119 | 0.0610*** | 0.0636*** |
| Initial region type |
Most frequent region type |
|||||||
| Rural and nearby | –0.0493*** | 0.0296* | 0.0209 | 0.0304*** | –0.0351** | 0.0328** | 0.0353** | 0.0412*** |
| Urban and remote | –0.0721*** | 0.0275 | 0.0008 | 0.0089 | –0.0670*** | 0.0466*** | 0.0160 | 0.0155 |
| Urban and nearby | –0.0829*** | 0.0555*** | 0.0128 | 0.0172* | –0.0813*** | 0.0775*** | 0.0235* | 0.0212** |
| Metro | –0.0990*** | 0.0388*** | 0.0104 | 0.0092 | –0.0926*** | 0.0616*** | 0.0281** | 0.0132 |
| Observations | 13,532 | 13,799 | 19,394 | 22,026 | 13,420 | 13,688 | 19,262 | 21,899 |
| Pseudo-R2 | 0.1692 | 0.4312 | 0.4747 | 0.6282 | 0.1819 | 0.4363 | 0.4800 | 0.6327 |
Robust standard errors in parentheses. The pseudo-R2 values are retrieved from the underlying logit estimations. The dependent variable is binary and equal to zero if the individual is Inactive.
Significance at 1 percent level. **Significance at 5 percent level. *Significance at 10 percent level.
Declaration of conflicting interests
The author(s) declared no potential conflicts of interest with respect to the research, authorship, and/or publication of this article.
Funding
The author(s) gratefully acknowledge funding by Forte - Swedish Research Council for Health, Working Life and Welfare [grant 2019-01320].