
Abstract
This paper analyses the economic and geographic characteristics of the world’s principal non-sovereign territories in the context of the growth challenges facing small economies. These territories enjoy high degrees of policy autonomy within a complex array of relationships with their metropolitan countries. Seven of the ten metropolitan powers are European and account for 38 of the 49 inhabited non-sovereign territories. The territories’ distinct economic and geographic characteristics, notably small size and remoteness, have led to their adopting similar niche sectoral growth strategies to those of small sovereign states and a reliance upon tourism and financial services. In spite of the growth challenges faced, most of these territories have attained high levels of per capita gross national income, placing them in the World Bank High Income category. Global heating, economic crises and regional environmental shocks, along with growing international protectionist sentiments, however, raise critical questions regarding the continued viability of their traditional growth strategies, particularly their heavy reliance upon environmentally harmful long-haul air travel and cruise tourism. This paper bridges the gap between large-scale growth studies, which generally overlook non-sovereign entities, and single case studies to examine the determinants of the growth success of non-sovereign territories and their future growth challenges given the pressing need for both economic and environmental sustainability.
Keywords
Introduction
In addition to more than 200 sovereign states, the global economy is also home to a large group of non-sovereign territories. The latter entities are highly diverse, ranging from territories that are not sovereign in the United Nations (UN) sense, for which metropolitan powers have only a few residual responsibilities, to fully integrated regions – for example, the EU’s outermost regions (ORs) and the Dutch Caribbean special municipalities (bijzondere gemeenten). In between lies an array of territories with complex sets of relationships with their metropoles. The status of these entities remains the subject of debate: imperial ‘remnants of history’ awaiting their destiny of de-colonisation (Muller, 2000) or to be rebranded as full regional ORs (Künhardt, 2019). Relationships with their metropoles remain complex, with some territories pushing for ‘true equality’ yet still harbouring deep dissatisfaction and a desire for independence (Ferdinand et al., 2020). Seven of the ten metropolitan powers are European (i.e. Denmark, France, the Netherlands, Norway, Portugal, Spain and the UK) and account for 38 of the 49 inhabited non-sovereign territories. A lively current policy debate relates to the extent to which the relationship between the territories of EU member states and the EU should be made more consistent and/or closer (Künhardt, 2019). This includes the possible formal designation of more territories as EU ORs – as in the case of Mayotte in 2014. This paper contributes to the wider debate by examining the economic and related environmental challenges facing non-sovereign territories – issues that have generally been neglected in the research literature. In recent decades, many of these territories have adopted the ‘traditional’ growth paradigm of many sovereign small economies focusing on niche activities in offshore finance and tourism as well as natural resources (Armstrong et al., 1998). The continued pursuit of such a growth strategy has, however, reached a critical juncture given major challenges regarding the future economic and environmental sustainability of the two dominant sectors of activity.
The non-sovereign territories have pursued niche sectoral growth strategies for their output and exports owing to their small size that differ greatly from those of most continental regions (Armstrong et al., 1998). In just over a decade, however, many of them have experienced a series of devastating external shocks. The 2008 financial crisis triggered a major global economic recession, the impacts of which were particularly severe for small entities because of its distinct sectoral – on tourism and financial services – and geographic effects – that is, their reliance upon markets in Europe and North America (Armstrong and Read, 2018, 2020a). Those with more diversified tourism sectors, however, may have been better able to recover from the initial shock of the crisis (Podhorodecka, 2018). Prior to full recovery, entities in the Caribbean were struck by several destructive tropical cyclones in 2017, with further adverse impacts on the region’s tourism sector in particular. The 2020 Covid-19 ‘lockdown’ has brought international tourism to an almost complete standstill and is expected to trigger another deep recession. These events raise critical questions regarding the reliability of current growth strategies in many territories and, in particular, their continued reliance upon tourism. This paper analyses the growth challenges facing non-sovereign territories, many of which are linked to European metropolitan powers, in the context of their principal economic and geographic characteristics.
The bulk of the analysis focuses on 49 inhabited territories, although the remaining 22 uninhabited ones may also have a greater role to play in the future. They are of interest scientifically, particularly their rich biodiversity, and currently support a limited amount of fisheries exploitation. In the future, they are likely to offer greater ‘Blue Economy’ opportunities (e.g. deep-sea mining) although their geopolitical status may become even more contested as strategic competition between major powers intensifies. For example, China’s Bridge and Belt Initiative has increased interest in and competition along the Arctic sea routes, and China and the EU will have more opportunities to project ‘soft power’ and influence in previously uninhabited and low-population regions (Kuus, 2020).
This paper attempts to bridge the gap between large-scale studies that generally overlook entities such as the non-sovereign territories and the findings of single-entity case studies that are difficult to generalise. It first reviews the theoretical and empirical literature on the distinctive economic strategies developed by small states and non-sovereign territories. The paper details the key geographic and other challenges facing the non-sovereign inhabited territories. Empirical evidence of the economic performance of the territories and their respective patterns of sectoral specialisation are then presented. It is argued that the largely successful existing pattern of specialisation in non-sovereign territories – and the critically important portfolio of tourism market segments in particular – face serious economic and environmental sustainability issues that need to be addressed in the near future.
Growth challenges for small economies
Small economies – and the very smallest in particular – face a distinctive set of constraints on their economic growth. Early analyses highlight the interaction between small size, indivisibilities in output, efficiency and competitiveness (Scitovsky, 1960), such that increasing returns to scale necessitate specialisation which, in turn, determines domestic economic activity and exports. The import content of domestic consumption is therefore very high and must be financed through exports according to comparative advantage (Kuznets, 1960). International trade therefore provides the means to extend their markets and attain greater scale economies, efficiency and competitiveness (Marcy, 1960) but increases exposure to exogenous economic shocks and protectionist actions by trade partners (Triffin, 1960). The likely high unit cost of providing public goods through an inability to attain sufficient scale (e.g. defence, education, health and infrastructure) are also highlighted.
Orthodox models of economic growth, therefore, have limited traction with respect to small economies. Large-scale labour-intensive industrialisation is predicated upon abundant low-cost labour and a large domestic market, neither of which apply (Demas, 1965; Thomas, 1982). Instead, small economies must necessarily specialise in a limited range of activities that are generally relatively scale neutral and/or more intensive in human capital (Bhaduri et al., 1982). Such specialisation, however, means that limited resources are available for innovation and applying more advanced technologies (Briguglio, 1995; Katnic and Buskovic, 2019).
An alternative perspective views specialisation in small economies as ‘a strategic game theoretic process of self-selected hyper-specialisation’ (Bertram and Poirine, 2018: 209) or ‘speciation’ (Baldacchino and Bertram, 2009) rather than the manifestation of comparative advantage. It is thus chosen autonomously rather than being imposed exogenously by inexorable global economic forces, and is based primarily upon extracting economic rents on ‘traditional’ assets, such as minerals and fisheries, as well as tourism assets (beaches, climate, etc.) (Bertram and Poirine, 2018) and geo-strategic location (Armstrong and Read, 2002). The outcome, however, is the same regardless of the underlying determinants, namely excessive specialisation in a narrow range of export-earning activities.
The patterns of specialisation first observed in small economies, particularly in small island developing states (SIDS), were based upon the key contributions of natural resources, financial services and tourism, together with migrant remittances (UNCTAD, 1997). Although no such states are located in continental Europe, many non-sovereign territories of European countries do fall into this category (e.g. Montserrat and French Polynesia).
Subsequent large-scale cross-country empirical growth studies find that the key determinants of greater per capita gross national income (GNI) – the World Bank equivalent of gross national product (GNP) – in small economies are openness to trade and niche sectoral specialisation. Those with dynamic tourism and/or offshore finance sectors (along with natural resources) significantly outperformed others reliant upon agriculture and manufacturing as well as aid and migrant remittances (Armstrong et al., 1998; Armstrong and Read, 2000, 2001; Read et al., 2012). The literature identifies several additional factors influencing the growth of small economies.
Some 30 of the 43 sovereign states with populations less than 1.5m are islands or archipelagos (69.8%), rising to 75 out of 92 (81.5%) if the 49 non-sovereign territories are included (World Bank, 2019). Much of the literature therefore focuses on small island economies, although small size and islandness have separate and distinct challenges. Islands tend to experience higher transport and communication costs, particularly those that are more remote or isolated from major markets (Deidda, 2016), with knock-on effects on domestic efficiency and comparative advantage. Evidence on the adverse growth effects of islandness, however, is weak (Armstrong and Read, 2000, 2003, 2006; Read et al., 2012). This is not to say that islandness does not pose a challenge to growth, but rather that many small islands have responded successfully to its challenges.
The combination of islandness with small size has been argued to render small island states – and, by implication, non-sovereign small island territories – especially ‘vulnerable’ economically (Briguglio, 1995; Guillaumont, 2010). Bertram and Poirine (2018), however, argue that, since many small islands generally perform well, the inference that they are both ‘resilient’ as well as ‘vulnerable’ is somewhat illogical. Further, by postulating that vulnerability and resilience are ‘opposite or independent variables’, Kelman (2020: 6) argues that this loses the full richness of the debate, but also that this dichotomy ‘can slant discourses and reinforce stereotypes’.
The reliance of small economies upon export-led growth highlights the critical importance of market accessibility and the impact of remoteness, strongly supported by empirical evidence of the benefits of proximity to major markets (Armstrong et al., 1998; Armstrong and Read, 2006; Read et al., 2012). In addition, new growth theory suggests that economic growth has a geographic dimension, leading supra-national organisations to develop specific policies to meet these challenges.
The EU recognises a number of ‘geographical specificities’ – notably islands, mountainous regions and sparsely populated areas – as the basis for special policy packages (Carbone, 2018; European Commission, 2020a). It also recognises remoteness from continental Europe through policies to support the ORs. Territories with low population densities (i.e. sparsely populated) present a range of economic challenges, including the higher cost of utilities and services which raise local business costs. Moreover, highly dispersed populations act as a serious barrier to industrial clustering. A tropical climate adversely affects labour and agricultural productivity owing to the prevalence of debilitating diseases and increases the risk of climatic disruption (Gallup et al., 1999; Sachs, 2001). Many tropical agricultural products are also argued to command systematically lower prices on global markets.
A further important dimension is geographic export concentration (Ostlind, 1953), that is, dependence upon very few export destinations. This increases exposure to imported demand shocks and greater growth volatility (Frankel and Rose, 1998), although these may be ameliorated by more synchronous business cycles with trade partners (Jansen et al., 2016). Many small economies continue to rely heavily on markets in their former/current metropoles (Bertram, 2004). This critical dependence upon export markets in the principal epicentres of Europe and the United States was a primary factor in the transmission of the 2008 crisis to many small economies, over and above their sectoral structures (Armstrong and Read, 2020a).
Human capital is identified as a critical component in the comparative advantage of small economies, yet many poorer and/or more-remote entities have experienced substantial out-migration. These have, in turn, become increasingly reliant upon inflows of remittances and foreign aid; for example, migration, remittances, aid and bureaucracy (MIRAB) economies (Bertram, 2006; Bertram and Watters, 1985). The loss of the most economically active, better educated and younger workers is common among such small economies (Docquier and Schiff, 2008), so weakening their economic and social structures, while remittance flows typically tail off over time (Poirine, 2006). Sustaining living standards, therefore, generates pressure for further out-migration and/or inflows of aid, which may create a culture of dependency. Although out-migration generally has negative effects on the home economy, previous emigrants may trigger quite large reverse tourism flows (Takahashi, 2019). In many more prosperous small economies, including territories, significant levels of in-migration may occur, to help offset local labour supply constraints.
Comparisons between small sovereign states and non-sovereign territories are undertaken only infrequently in the literature, often because the latter are generally regarded as extensions of their metropoles rather than having directly comparable characteristics and growth challenges. In terms of growth and incomes, however, territories have outperformed small states even after normalising for metropolitan fiscal transfers (Armstrong and Read, 2000). This phenomenon remains poorly understood, but may encompass strong trade links with – and capacity to secure additional support from – their metropoles (Bertram, 2004) as well as better governance and institutions. Metropoles may act as ‘benevolent mainland patrons’ (Baldacchino, 2006) that provide a wide range of benefits, including political security, diplomatic representation and the freedom to travel, reside and work in the metropole (Clegg, 2018). In many cases, both territories and metropoles gain from this relationship (Sutton, 2013). These advantages are not absolute guarantees; benevolence may be reversed, as with stronger UK regulation of offshore finance centres and its negotiation for EU exit (Bosque, 2020; Clegg, 2018; Oliver, 2019).
This economic disparity favouring non-sovereign territories may pre-date decolonisation (Bertram, 2015) and reflect differences between ‘settler’ and ‘extractive’ societies (Acemoglou et al., 2002) or the retention of territories with valuable resources and/or in strategic locations and decolonisation of weaker and more troublesome entities (Chai, 1998). The role of sovereignty remains poorly understood, primarily because most studies take a simple binary perspective, whereas it may have many dimensions (e.g. economic, legislative, security) and is almost certainly more of a continuum than a dichotomy (Alberti and Goujon, 2020). Further, limited sovereignty in one dimension does not necessarily mean less in another (Grydehøj, 2020). More remote territories may also have exploited the ‘tyranny of distance’ to develop greater jurisdictional status and autonomy than those located closer to the metropole (Baldacchino, 2020).
The economic growth literature identifies effective policy design and implementation as evidence of good governance. Small economies appear to be more flexible in pursuing growth than larger entities, in spite of having less scope for policy manoeuvre. Export-led growth in an era of liberal global trade has enabled many of them to prosper. In addition, they have been astute at freeriding and rent-seeking, engaging in niche regulatory strategies and opportunistic behaviour (Armstrong and Read, 2002; Baldacchino and Milne, 1999 Kakazu, 1994). High quality policymaking in many small states may also be attributed to governance and institutions that focus on ‘growth-promoting’ rather than ‘market-liberalising’ policies (Khan, 2007). They score highly in the United Nations Development Programme (UNDP) Human Development Index (HDI) (Briguglio, 1995) and their unexpectedly strong growth performance may owe much to the quality of their governance (Congdon Fors, 2014; Read, 2018).
Most small economies are islands, archipelagos or have coastal littorals (i.e. very few are landlocked). They are therefore especially susceptible to ecological, environmental and meteorological factors, including devastating natural catastrophes (Beller et al., 1990; Briguglio, 1995) – for example the 1995 Montserrat volcanic eruption – as well as the long-term effects of climate change. Their natural environments are also often very fragile owing to unique ecosystems and biodiversities that are highly sensitive to environmental encroachment. Environmental vulnerability is, therefore, an additional growth challenge for small entities over and above exposure to external economic shocks, and further amplifies their growth volatility. Many territories face major environmental vulnerability challenges; those in the Caribbean and Pacific regions are subject to severe hurricane and typhoon threats. Many are also volcanic islands, though not all have currently active volcanoes.
The non-sovereign territories
This paper adopts a broad definition of non-sovereign territories and includes those in free association as well as the overseas territories of former European colonial powers (Denmark, France, the Netherlands, Norway, Portugal, Spain and the UK). These are combined with six territories for which Australia and New Zealand have responsibility (three each) and the five unincorporated inhabited territories of the US which are in free association but are not sovereign. To these are added all of the EU ORs because they are both geographically detached (and often remote) from their metropole and, more importantly, have distinctive economic policy autonomy. The UK Crown Dependencies of Guernsey, Jersey and the Isle of Man are included alongside the UK territories for the same reasons.
The Antarctic territories are omitted because they have no permanent inhabitants and their exploitation is limited by international treaties. Hong Kong and Macau have a degree of economic autonomy but are effectively extensions of mainland China and are therefore excluded. The UK Overseas Territory of Akrotiri and Dhekelia is excluded since it comprises purely sovereign military base areas with no functioning economy.
In the full set, there are 71 territories, 22 of which are uninhabited. This paper focuses on the 49 inhabited territories, although the uninhabited territories may have an important role in future policies.
Key geographic characteristics of non-sovereign territories
This section discusses the geographic characteristics that either pose critical growth challenges for small economies or else offer important growth opportunities. The principal defining characteristic of small economies is population size, which is the most comprehensively available measure. Two additional geographic size measures are also relevant: land area and ocean available for exploitation within the 200 nautical mile limit – that is, the exclusive economic zone (EEZ).
The land areas of the 49 non-sovereign territories are plotted against their populations in Figure 1 along with the global set of sovereign states. The UN size threshold of 1.5m is used to distinguish between small and large sovereign states, while those with populations below 100,000 in 2017 are also identified. The territories are very small, in terms of both their populations (as expected) and land areas, but also relative to small states. Their median population was 55,620 (compared with 403,117 for small states) and median land area is 260 km2 (compared with 1815 km2). The territories therefore have more in common with those states with populations below 100,000 than either set of the other comparators.
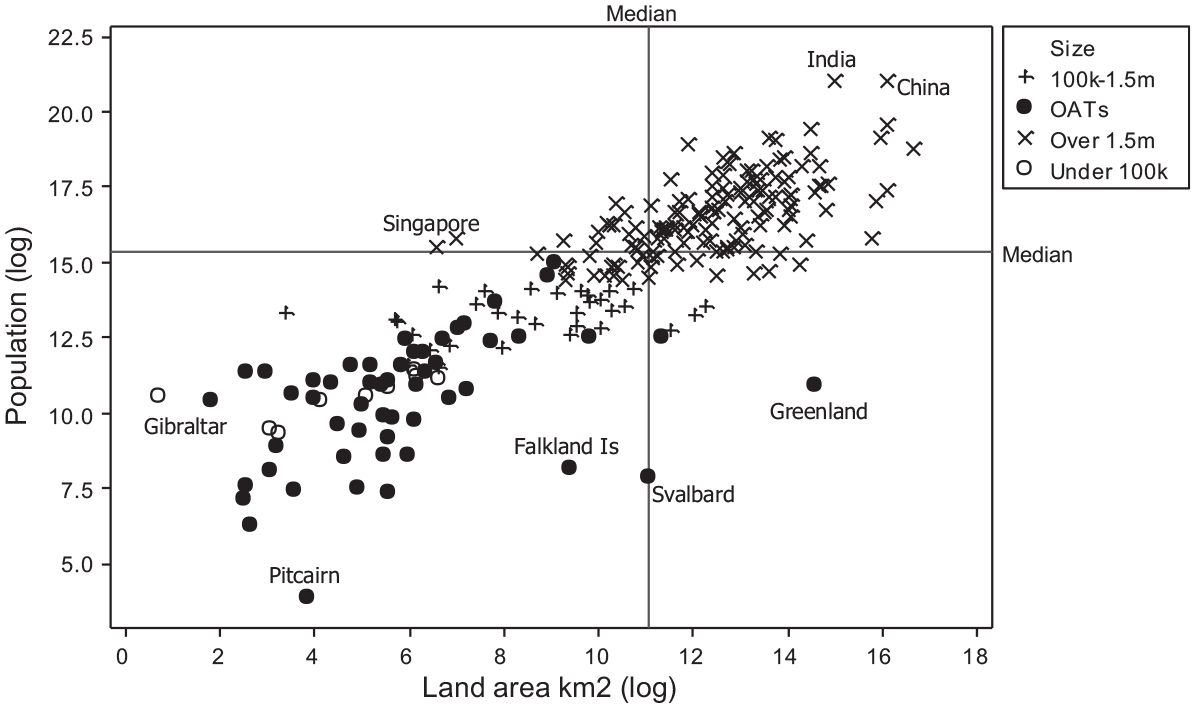
Population and land area of non-sovereign territories and sovereign states, 2017.
Non-sovereign territories, however, whether inhabited or uninhabited, are not small with regard to the size of their EEZs. The average of the former is 118,291 km2 – larger than that for either the small or large sovereign state groups (98,450 and 106,870 km2 respectively) – while that of the 22 uninhabited ones is even greater at 412,146 km2. France, the UK and the US, in particular, possess significant numbers of uninhabited territories with extensive EEZs.
The population and geographic size data have profound implications for the territories in that, while they face severe growth challenges, their large EEZs offer substantial potential growth opportunities from the Blue Economy (Commonwealth Secretariat, 2016; COGEA srl, 2017; European Commission, 2019; World Bank, 2017). Although more traditional niche specialisation in coastal tourism and fisheries is being actively pursued, new Blue Economy niches (e.g. offshore energy, seabed mining) are still in their infancy.
Several other important geographical characteristics are detailed in Table 1. The first two columns show the extent to which the 49 inhabited territories are remote from key global markets. ‘Distglobe3’ is the great circle distance to the nearest of the three main global markets of East Asia (calculated using Beijing as the centroid), Western Europe (Brussels), and North America (the nearest of either Washington D.C. or Los Angeles). This measure typically has a highly significant negative statistical effect on economic performance (Armstrong and Read, 2000, 2006, 2020a; Read et al., 2012) and may account for half the difference in welfare between small island economies (McElroy and Lucas, 2014). ‘Distmetrop’ measures the great circle distance to a territory’s metropole. This has a statistically significant positive effect since territories (and small states) tend to trade disproportionately with their current metropole or former colonial power (Bertram, 2004). Ideally, a more nuanced measure of remoteness could be used, possibly based upon transport mode choice sets and transport link analysis (Karampela et al., 2014) but comprehensive global data of this type do not currently exist.
Geographic characteristics of inhabited non-sovereign territories, 2017.
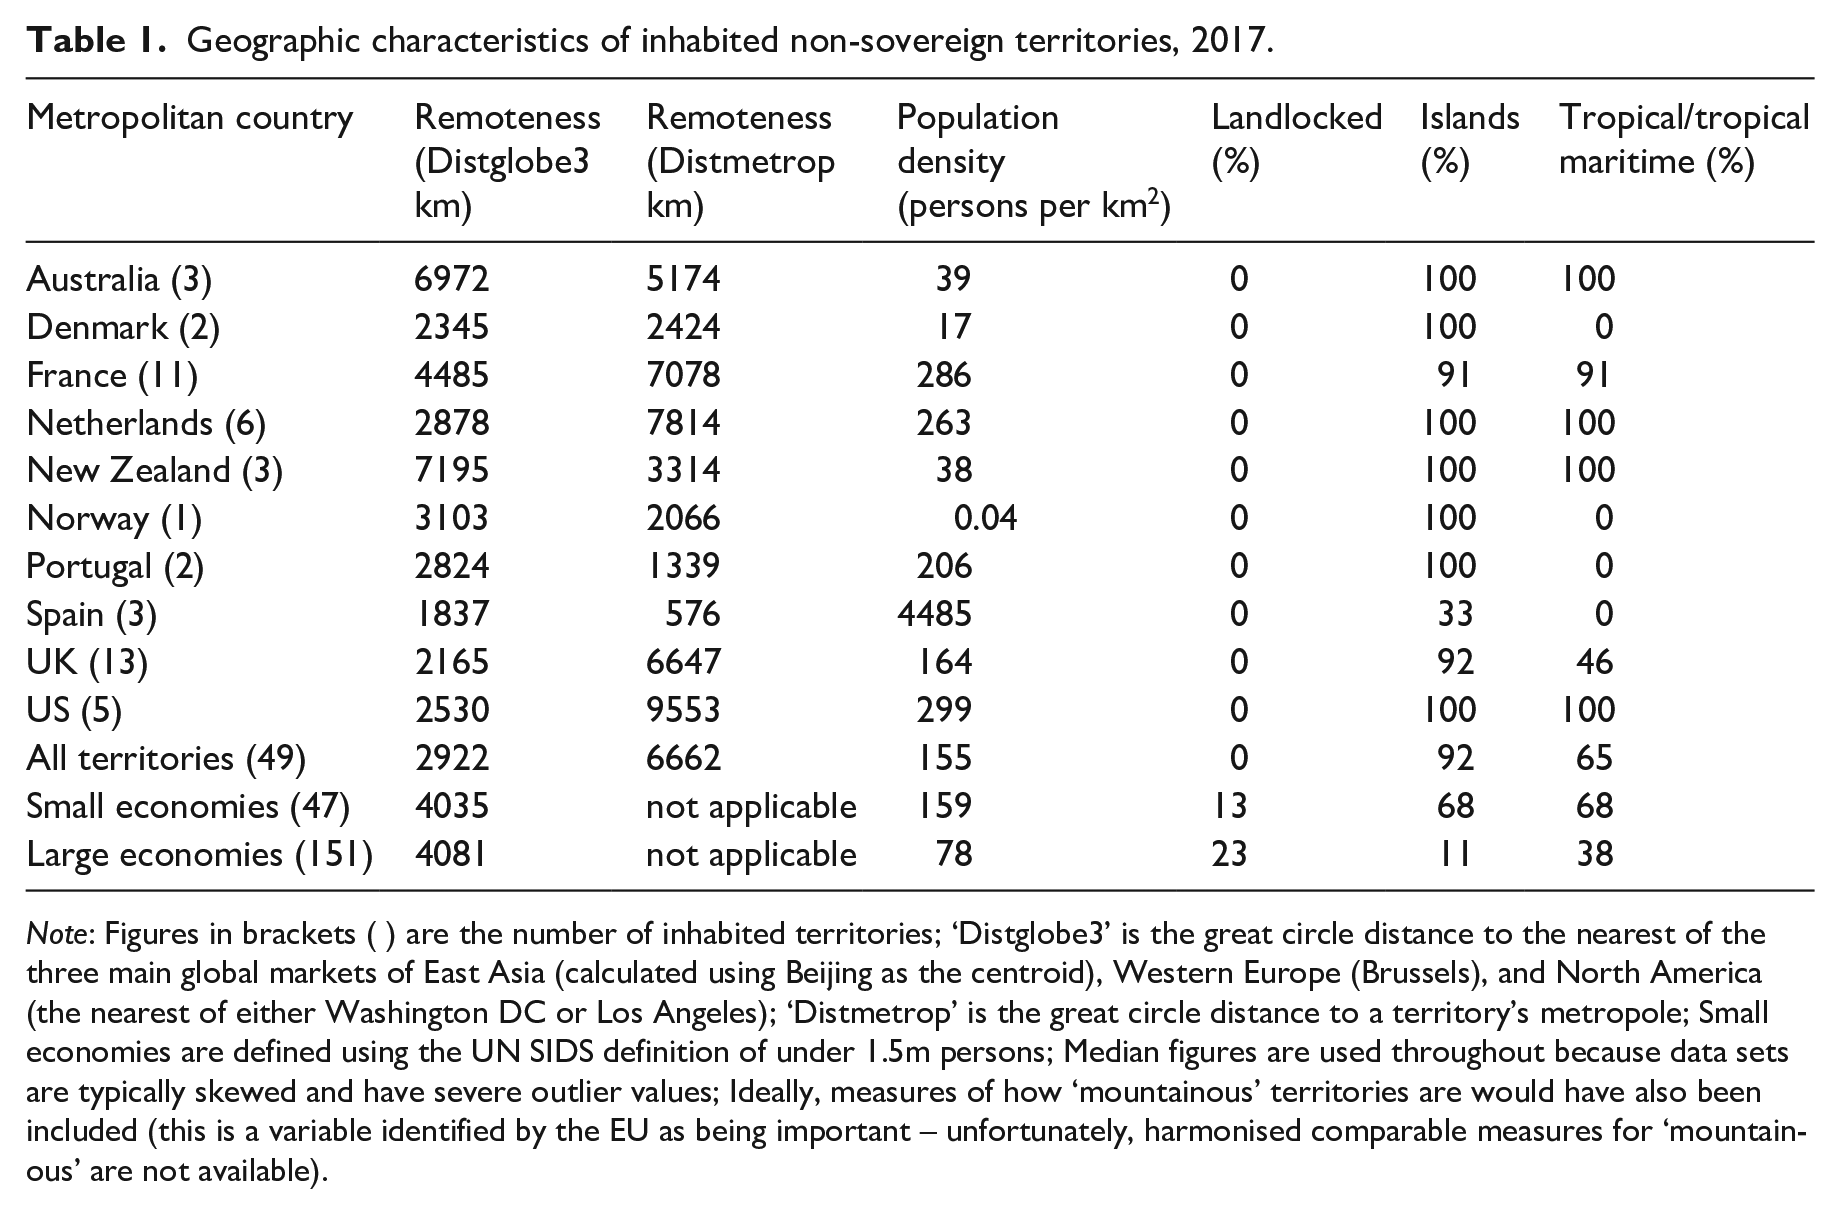
Note: Figures in brackets ( ) are the number of inhabited territories; ‘Distglobe3’ is the great circle distance to the nearest of the three main global markets of East Asia (calculated using Beijing as the centroid), Western Europe (Brussels), and North America (the nearest of either Washington DC or Los Angeles); ‘Distmetrop’ is the great circle distance to a territory’s metropole; Small economies are defined using the UN SIDS definition of under 1.5m persons; Median figures are used throughout because data sets are typically skewed and have severe outlier values; Ideally, measures of how ‘mountainous’ territories are would have also been included (this is a variable identified by the EU as being important – unfortunately, harmonised comparable measures for ‘mountainous’ are not available).
The challenge of remoteness is more subtle than might be expected; European territories have much lower Distglobe3 values than those of Australia, New Zealand and the United States. In addition, the average value for the territories is ‘only’ 2922 km, lower than those for either small or large states (4035 km and 4081 km, respectively). The Distmetrop average, however, is substantially greater at 6662 km – ‘distance to the metropole’ is not appropriate for sovereign states – and is a surprising finding given the extreme remoteness of some inhabited territories (e.g. Pitcairn Islands). The principal reason is an ‘historical accident of geography’; a disproportionate number of European territories are in the Caribbean and therefore relatively close to the large North American market but distant from their European metropoles. This accounts for the greater imbalance between Distglobe3 and Distmetrop values for France, the Netherlands and the UK. The territories are, therefore, on average, extremely remote from their metropoles but less so from the three major global markets. Nevertheless, an average Distglobe3 value of 2922 km is hardly ‘accessible’ and lies at the upper end of ‘medium-haul’ air travel (Eurocontrol, 2018). Moreover, these average values hide large variations; a minority of inhabited territories are very remote from major global markets. The 22 uninhabited territories are, on average, much more remote than their inhabited counterparts − 8234 km for Distglobe3 and 8166 km for Distmetrop.
Of the other three important geographic characteristics, 92% are islands or archipelagos and 65% have a tropical or tropical maritime climate but none are landlocked. The challenges of islandness are therefore of particular significance to the inhabited territories, greatly exceeding those for small and large states.
Economic growth in non-sovereign territories
This section demonstrates that non-sovereign territories have been able to attain high levels of per capita income. To analyse this issue in an appropriate context, however, it is necessary to outline the severe data issues encountered in any in-depth study of the territories.
The analysis of small economies involves serious data deficiencies and this is even more severe for non-sovereign territories, so raising critical methodological issues. These problems are discussed at length elsewhere (Armstrong et al., 1998; Armstrong and Read, 2020a) but are summarised here. The principal global harmonised datasets all suffer from severe systematic truncation problems, particularly the exclusion of smaller economies (both sovereign and non-sovereign). These entities often lack the capacity and expertise to produce detailed harmonised statistics and, in the case of many territories, because they are not members of major international organisations (e.g. the UN, World Bank, World Trade Organization (WTO)). The resultant systematic dataset truncation poses major problems for statistical analyses such that any research must rely upon the available data and carefully qualify its findings. This study uses the principal global harmonised datasets wherever possible, supplemented by local non-harmonised statistics. Two important features of the non-harmonised data however, render this exercise less heroic than it might appear. Many territories have improved the range of statistics collected and have begun to harmonise them more closely with international conventions. Their domestic economies also tend to be dominated by just two or three sectors such that better data are often collected specifically for these key sectors.
In spite of very severe economic and geographic challenges, many small economies enjoyed considerable growth and income success prior to the 2008 global crisis. In addition, although non-sovereign territories are on average smaller, they appear to have outperformed sovereign states during this period (Armstrong and Read, 2000). ‘Best estimates’ of national income per capita for the 49 inhabited territories are provided in Table 2. The table demonstrates the difficulties in producing comparable statistics but also reveals clear results. The core data are the harmonised 2017 GNI per capita statistics from the World Development Indicators database (World Bank, 2019), the most recent year for which the number of territories can be maximised. It is sufficiently distant from the 2008 global crisis for most entities to have made an almost full recovery and is also prior to the Covid-19 pandemic ‘lockdown’. The particularly severe Caribbean hurricane season in 2017, however, is reflected in some statistics. The World Bank produces per capita GNI data in two forms; in current US dollars at market exchange rates and broader ordinal data according to its four-fold income classification, which includes estimates for some territories excluded from the continuous dataset. The remaining data are the authors’ own best estimates, drawing upon local and sometimes regional statistics.
Gross national income (GNI)/gross domestic product (GDP) per capita of non-sovereign territories, 2017.
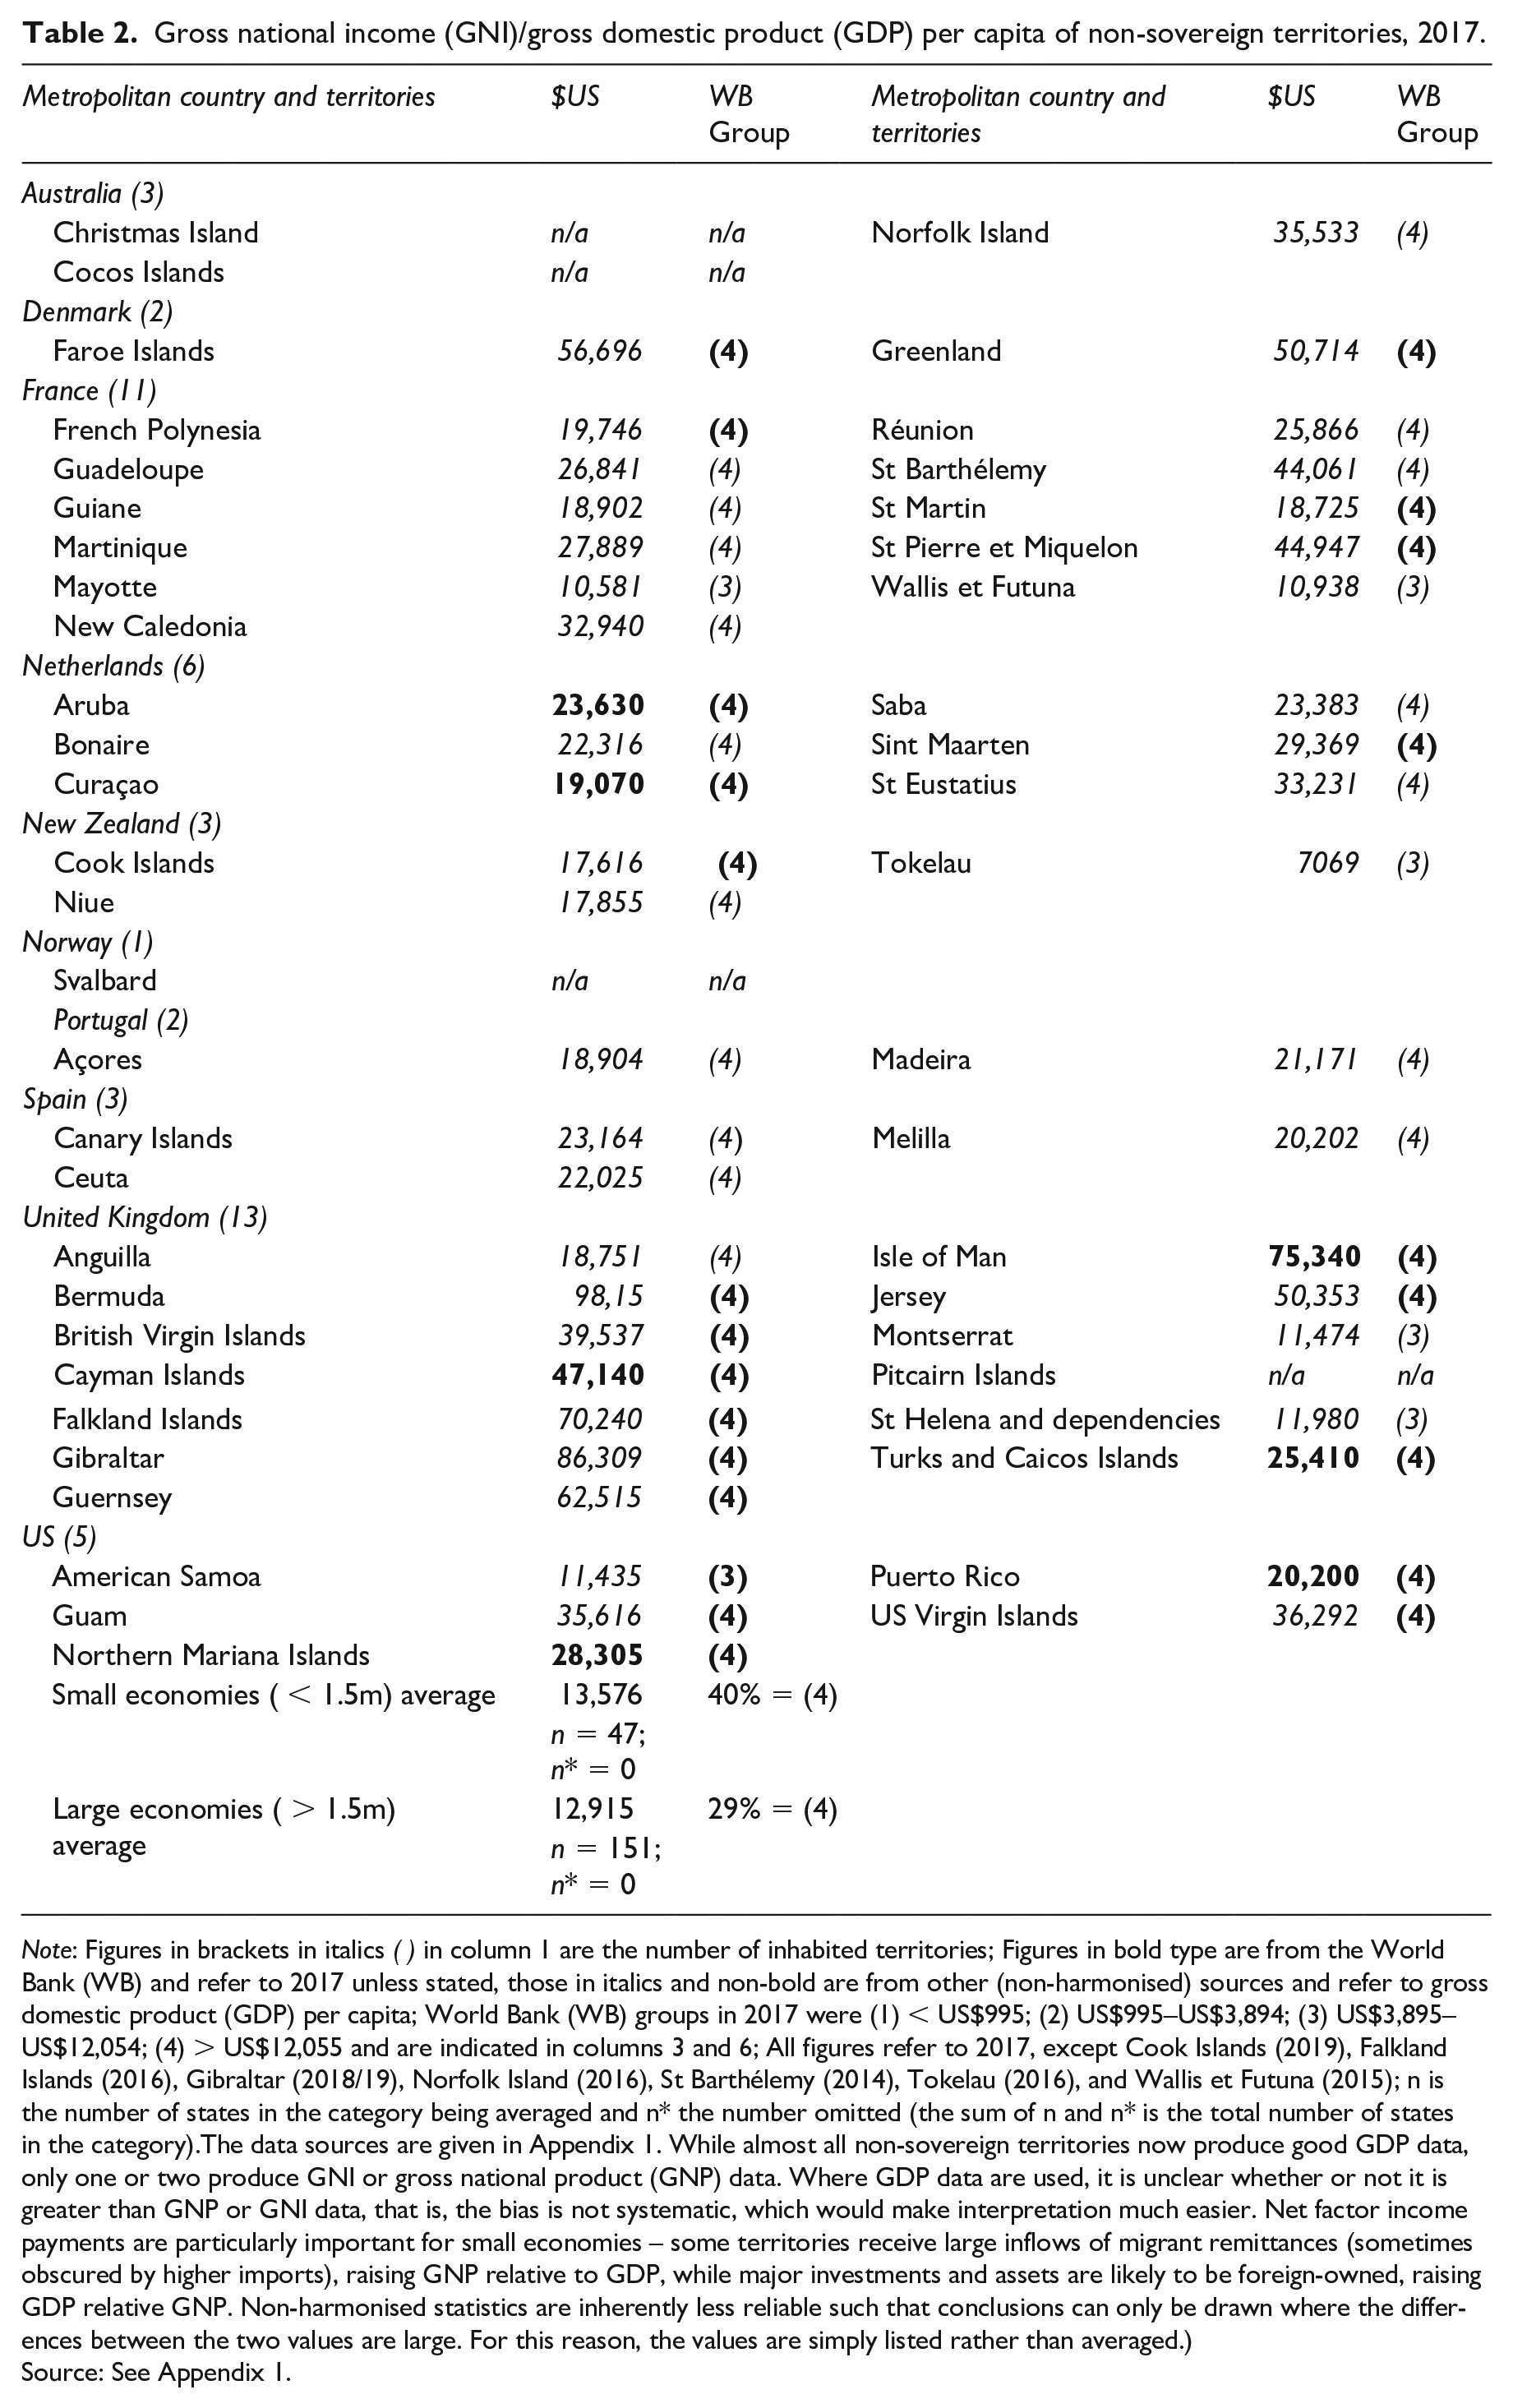
Note: Figures in brackets in italics ( ) in column 1 are the number of inhabited territories; Figures in bold type are from the World Bank (WB) and refer to 2017 unless stated, those in italics and non-bold are from other (non-harmonised) sources and refer to gross domestic product (GDP) per capita; World Bank (WB) groups in 2017 were (1) < US$995; (2) US$995–US$3,894; (3) US$3,895–US$12,054; (4) > US$12,055 and are indicated in columns 3 and 6; All figures refer to 2017, except Cook Islands (2019), Falkland Islands (2016), Gibraltar (2018/19), Norfolk Island (2016), St Barthélemy (2014), Tokelau (2016), and Wallis et Futuna (2015); n is the number of states in the category being averaged and n* the number omitted (the sum of n and n* is the total number of states in the category).The data sources are given in Appendix 1. While almost all non-sovereign territories now produce good GDP data, only one or two produce GNI or gross national product (GNP) data. Where GDP data are used, it is unclear whether or not it is greater than GNP or GNI data, that is, the bias is not systematic, which would make interpretation much easier. Net factor income payments are particularly important for small economies – some territories receive large inflows of migrant remittances (sometimes obscured by higher imports), raising GNP relative to GDP, while major investments and assets are likely to be foreign-owned, raising GDP relative GNP. Non-harmonised statistics are inherently less reliable such that conclusions can only be drawn where the differences between the two values are large. For this reason, the values are simply listed rather than averaged.)
Source: See Appendix 1.
The World Bank income classification provides the most comprehensive GNI per capita data for 23 territories, of which 22 are High Income (i.e. 95%). Most non-harmonised values are also High Income (17 of 22 – i.e. 77.3%) while four of the five Upper-Middle Income territories lie close to its upper bound – American Samoa, Mayotte, Montserrat, and St Helena and dependencies – hence great caution should be exercised in drawing conclusions in these cases. No useable income data are available for Christmas Island and the Cocos Islands (Australia), Svalbard (Norway) and Pitcairn (UK). The evidence indicates that the European territories appear to have been the most successful of all, particularly those in the Caribbean.
The data in Table 2 strongly supports the view that most non-sovereign territories have prospered under the traditional small economy growth model, especially those in the Caribbean, irrespective of their metropole. The performance of some territories, principally those of the UK, has been outstanding – most of which are offshore finance centres.
The most successful small economies are those specialising in some combination of international tourism, financial services and resource exploitation (Armstrong et al., 1998; Armstrong and Read, 2000, 2020a). Analysing niche sectoral specialisation in non-sovereign territories, however, suffers from serious data deficiencies and requires extreme care in collating and interpreting statistics. Sectoral export data is highly desirable but rarely available and it is necessary instead to rely upon production data. The approach adopted is to: (a) focus on those harmonised variables encompassing the most comprehensive set of territories; (b) analyse the three key sectors before broadening out; (c) use non-harmonised data only where it can be suitably identified and with appropriately qualified conclusions.
International tourism
Most small economies have developed important international tourism sectors, the growth of which has been facilitated by the increasing availability of low-cost long-haul flights and expansion of cruises. The critical importance of the sector to export earnings has led many to be described as small island tourism economies (SITEs) (McElroy, 2006). A more recent classification reinforces the importance of tourism; four of the ten categories of small island economies identified by Bertram and Poirine (2018, Figure 9.17) incorporate tourism (‘tourism plus exports’, ‘moderate-impact tourism’, ‘high-impact tourism’ and ‘offshore finance plus tourism’). Tourism is also a critically important source of employment and has been central to growth strategies advocated by the International Monetary Fund (IMF) and other institutions (Bishop, 2010; Hawkins and Mann, 2007). The sector remains critically important for both growth and living standards, including in less-developed small island economies (Puig-Cabrera and Foronda-Robles, 2019). Many citizens of SITEs, however, are well aware of the trade-offs between tourism-based economic growth and its adverse environmental and other implications (Figueroa and Rotarou, 2016). While the exports of many small entities are dominated by tourism, most also undertake a range of other activities.
The importance of tourism and its key market segments to non-sovereign territories are shown in Table 3. The proxy variable for average distance travelled is based upon the authors’ own calculations, drawing upon UNWTO data on the global region, sub-region and country of origin of tourists. Wherever possible, data refer solely to tourists rather than total visitors (‘tourists plus excursionists’ in UNWTO terminology) because these different types of visitors have widely differing economic (spending) and, even more importantly, environmental impacts. This distinction is key to understanding the magnitude of the future challenges facing territories.
Key tourism segments, metropolitan market share and distance of non-sovereign territories, 2017.
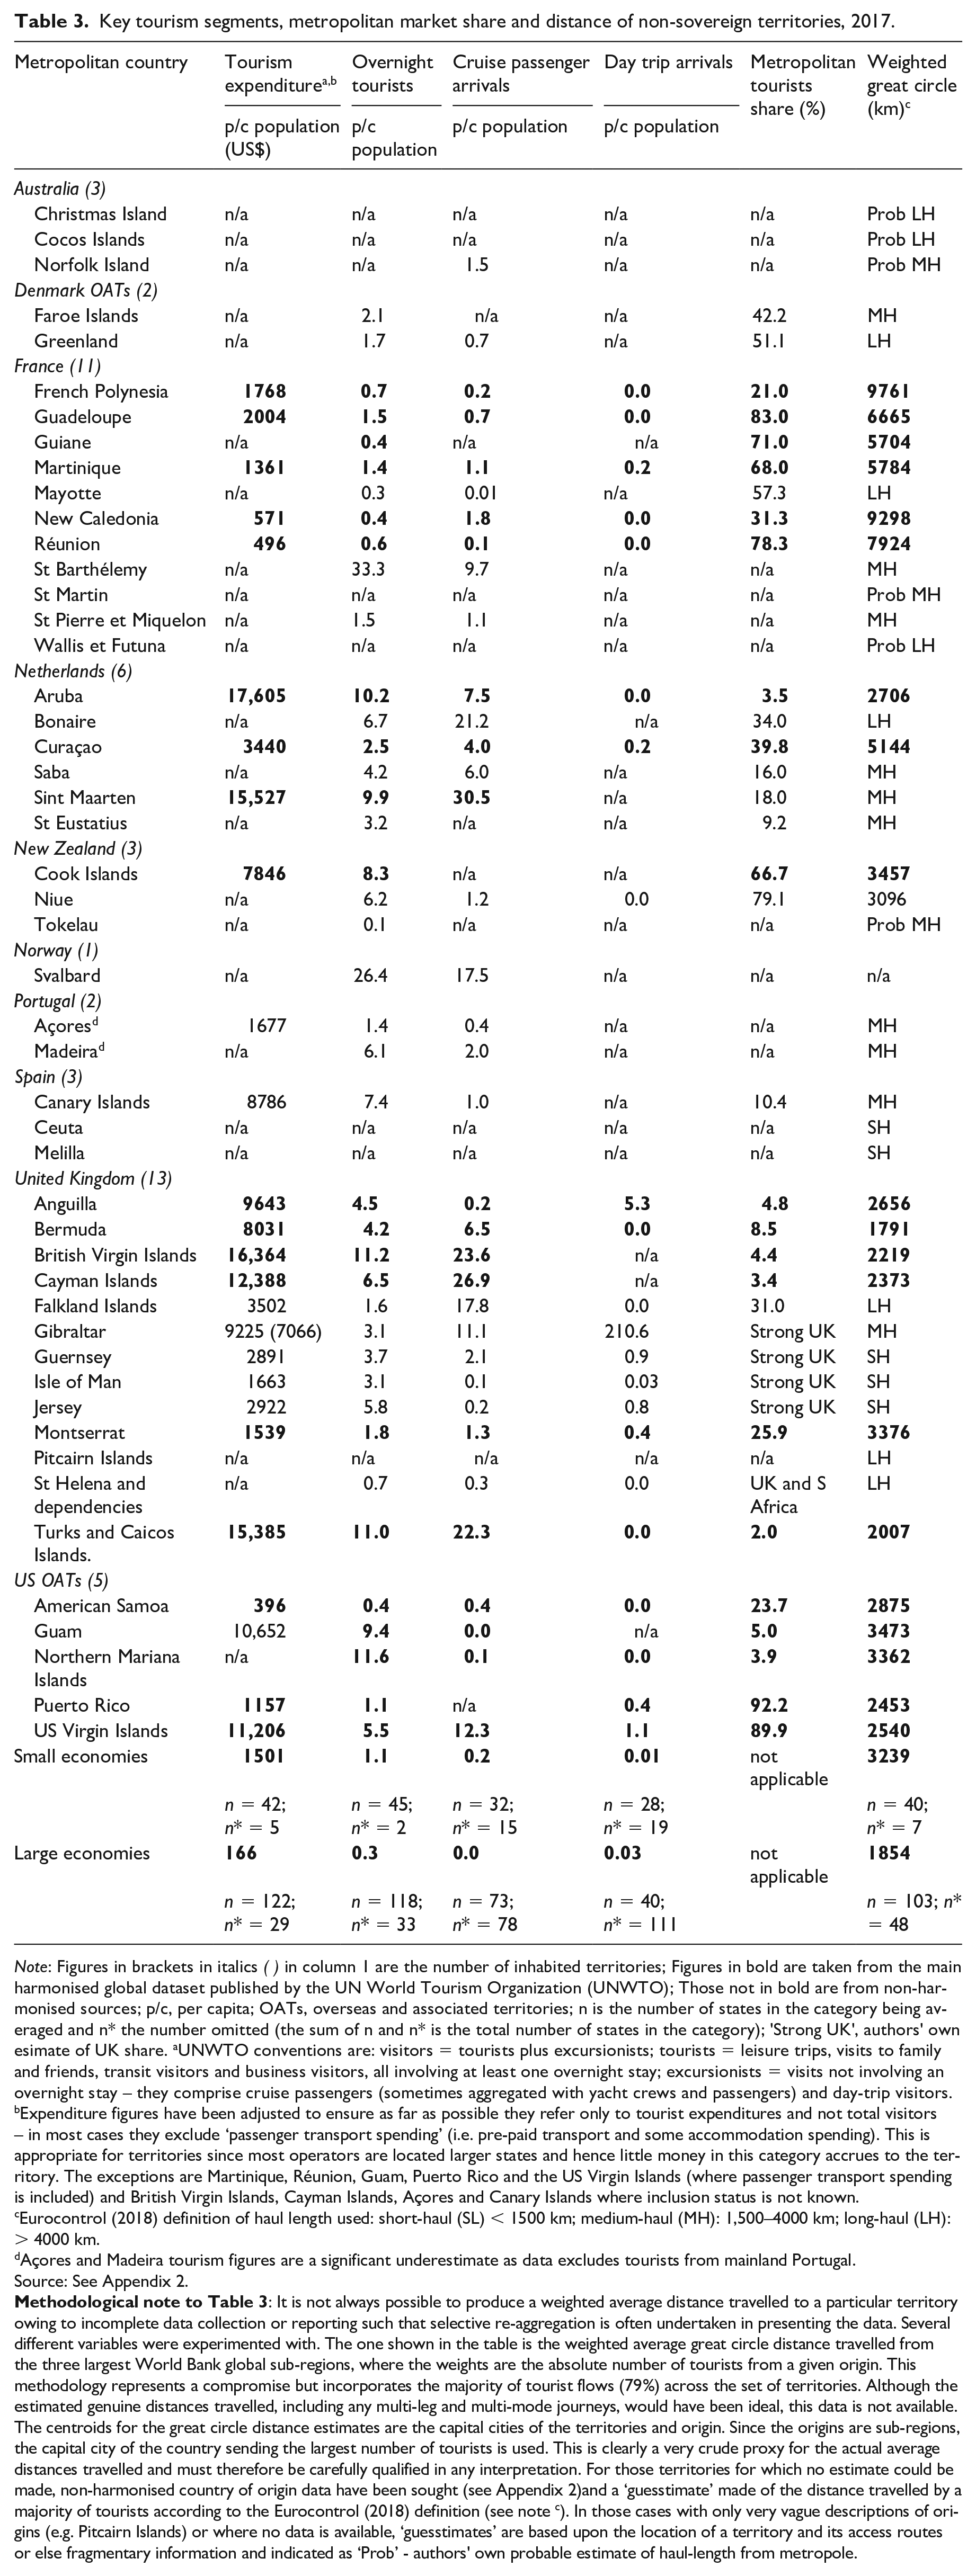
Note: Figures in brackets in italics ( ) in column 1 are the number of inhabited territories; Figures in bold are taken from the main harmonised global dataset published by the UN World Tourism Organization (UNWTO); Those not in bold are from non-harmonised sources; p/c, per capita; OATs, overseas and associated territories; n is the number of states in the category being averaged and n* the number omitted (the sum of n and n* is the total number of states in the category); ’Strong UK’, authors’ own esimate of UK share. aUNWTO conventions are: visitors = tourists plus excursionists; tourists = leisure trips, visits to family and friends, transit visitors and business visitors, all involving at least one overnight stay; excursionists = visits not involving an overnight stay – they comprise cruise passengers (sometimes aggregated with yacht crews and passengers) and day-trip visitors.
Expenditure figures have been adjusted to ensure as far as possible they refer only to tourist expenditures and not total visitors – in most cases they exclude ‘passenger transport spending’ (i.e. pre-paid transport and some accommodation spending). This is appropriate for territories since most operators are located larger states and hence little money in this category accrues to the territory. The exceptions are Martinique, Réunion, Guam, Puerto Rico and the US Virgin Islands (where passenger transport spending is included) and British Virgin Islands, Cayman Islands, Açores and Canary Islands where inclusion status is not known.
Eurocontrol (2018) definition of haul length used: short-haul (SL) < 1500 km; medium-haul (MH): 1,500–4000 km; long-haul (LH): > 4000 km.
Açores and Madeira tourism figures are a significant underestimate as data excludes tourists from mainland Portugal.
Source: See Appendix 2.
The first two columns of Table 3 indicate ‘tourism intensity’ in terms of expenditure and numbers of tourists per capita of the resident population. There is considerable variation in both measures; not all territories have dominant tourism sectors and cannot be realistically described as SITEs. Nevertheless, the final two rows of the table show that tourism intensity in most cases is significantly greater than the averages for both small (under 1.5m) and large states.
The ‘high tourism intensity’ territories – that is, those with per capita resident averages well above the small state average (US$1501 expenditure and 1.1 tourists per capita) – appear to be of three types. The Caribbean – almost certainly including St Martin in spite of the lack of data – with the exception of Montserrat, Martinique and Puerto Rico, all of which nevertheless have significant tourism sectors; the Pacific, notably the Cook Islands, Guam and the Northern Mariana Islands; and a select ‘European’ group comprising the Canary Islands, Gibraltar and Madeira, but not the Açores, Guernsey, Jersey and the Isle of Man, in spite of the rapid growth of ‘cold water’ tourism in recent years. The data for the Açores and Madeira, however, are significant underestimates since these exclude tourists from mainland Portugal. More-remote territories – for example Greenland, Pitcairn Islands, St Helena and Dependencies, and Tokelau – perhaps unsurprisingly appear to have struggled to develop strong tourism sectors.
Cruise visitors per capita resident, including yacht visitors in many but not all cases, are shown in column 3. This segment is dominated by the Caribbean and driven by the rapid expansion of the large North American market, facilitating within-sector diversification. Territories in the region with relatively fewer cruise visitors – for example Guadeloupe and Martinique – still have per capita values greater than or equal to the small state average. Outside the Caribbean, only the Falkland Islands, Gibraltar and Svalbard have relatively large cruise tourism segments.
Data for ‘excursionists’ or day-trippers (column 4) has many missing entries, which is unfortunate since this segment has the lowest carbon footprint, being both short-haul and using less-polluting modes of transport, particularly arrivals by land. Great care is therefore needed in interpreting the data. Since most territories are islands, few have extensive potential day-trip niches and land arrivals are rarely large in number with the exception of Gibraltar. Several others have developed substantial day-trip niches, including Guernsey and Jersey (from the UK and France), Ceuta and Melilla (from Spain) and some Caribbean islands – Anguilla and (probably) St Martin.
Two further characteristics stand out in Table 3. There is a very strong metropolitan bias within tourism flows (column 5), particularly for Dutch, French and US territories. This bias is less strong for UK territories yet almost all have metropolitan shares in excess of the UK’s global population share (less than 1%). As with trade in goods, disproportionately strong tourism links with metropoles may be the result of good transport links as well as shared language, culture and religion, all of which boost tourism flows significantly (Dropsy et al., 2020). Further, the average weighted great circle distance of tourist travel to territories and small states are broadly similar (column 6) in spite of territories being predominantly islands, including some of the most remote communities on earth, and at a substantial distance from their metropoles. The distance averages, however, are skewed downwards owing to the proximity of territories in the Caribbean to the largest market (North America). Average weighted distances are typically much greater for many others, notably French territories in the Indian and Pacific Oceans, although several are benefiting from growing markets in East Asia (e.g. Guam and Northern Mariana Islands) and Australasia (e.g. the Cook Islands, Niue and Norfolk Island).
The growth effects of tourism comprise three principal elements: employment, export earnings and domestic multiplier effects on GDP. Domestic employment is often the most visible indication of tourism’s importance to host economies. Its average share of the labour force in small states ranges from 5% to 15%, but just 1.7% in Puerto Rico, the only territory for which data are available (Armstrong and Read, 2020b, Table 1). Tourism may therefore provide a useful means to reduce low-skilled unemployment in small entities (Armstrong and Read, 1995). The share of tourism in export earnings in small economies averaged more than 60% in 2015–2017, including Aruba 68.9%, French Polynesia 66.4% and Sint Maarten 73.2% (Armstrong and Read, 2020b, Table 1). The high dependence of many territories upon tourism, however, exacerbates their exposure to external shocks (e.g. Covid-19). The sector’s contribution to growth is determined by its multiplier effects on the demand for local goods and services. This is especially problematic for small economies because of their narrow and shallow economic structures (Read, 2005) which mean that ‘leakages’ are likely to be large owing to high import dependence (Armstrong and Read, 2020b). These growth effects may be greater in ‘traditional’, as opposed to enclave and/or all-inclusive resort, tourism (Mitchell and Ashley, 2006) and in more developed host economies (Meyer, 2007). The actual contribution of tourism to growth in the territories may therefore be very limited because it generates little local value added.
The primary focus of this analysis is on the economic implications of tourism in non-sovereign territories. This cannot be separated from the sector’s wider environmental impact, however, which relates to both its effects on host economies but also, perhaps more importantly, its high per capita carbon footprint (Climate Scorecard, 2020; Gössling and Peeters, 2015). Gains from reducing this footprint through the adoption of more ‘sustainable’ tourism practices, however, have been more than offset by the sector’s underlying growth (Lenzen et al., 2018). From a global perspective, the absolute impact of greenhouse gases and hence global heating from tourism’s per capita carbon footprint in territories is almost insignificant – that is, a classic case of The Tragedy of the Commons. Given that many have few alternative sources of income, the easy option of pursuing tourism-led development is perhaps understandable. Nevertheless, the territories can and should address the wider environmental impacts of their activities. Global heating represents an existential threat such that it is ultimately in their own self-interest that they adopt mitigation policies. In practice, almost all are already actively developing more environmentally sustainable tourism.
From Table 3, the territories have a distinctive portfolio of tourism sub-sectors with important implications for their wider environmental impact and therefore longer-term sustainability. Comparing the characteristics of this portfolio for the three ‘high intensity tourism’ groups of territories with those of small states highlights distinct adverse environmental implications. Tourism in the territories is predominantly overnight hotel accommodation driven and hence has a high carbon footprint (Ewing-Chow, 2019). They are heavily reliant upon air links and also receive disproportionate numbers of cruise passenger arrivals, both of which have above average greenhouse gas emissions (Transport and Environment, 2019). The combination of islandness and remoteness means that few territories have been able to develop the less-polluting day-trip segment using land transport modes (apart from Gibraltar) or short-haul sea and air transport (apart from Ceuta, Guernsey, Jersey, the Isle of Man and Melilla). A strong metropolitan bias is also evident in their principal tourism markets, generally increasing great circle distances travelled by air. Any credible policy strategy to reduce the environmental effects of tourism must therefore necessarily substantially reduce the unsustainable carbon footprint of long-haul air travel and high emission cruise tourism.
Financial services, resources and manufacturing
Data for other niche sectoral activities in non-sovereign territories are presented in Table 4.
Non-tourism sectoral specialisation in non-sovereign territories, 2017.
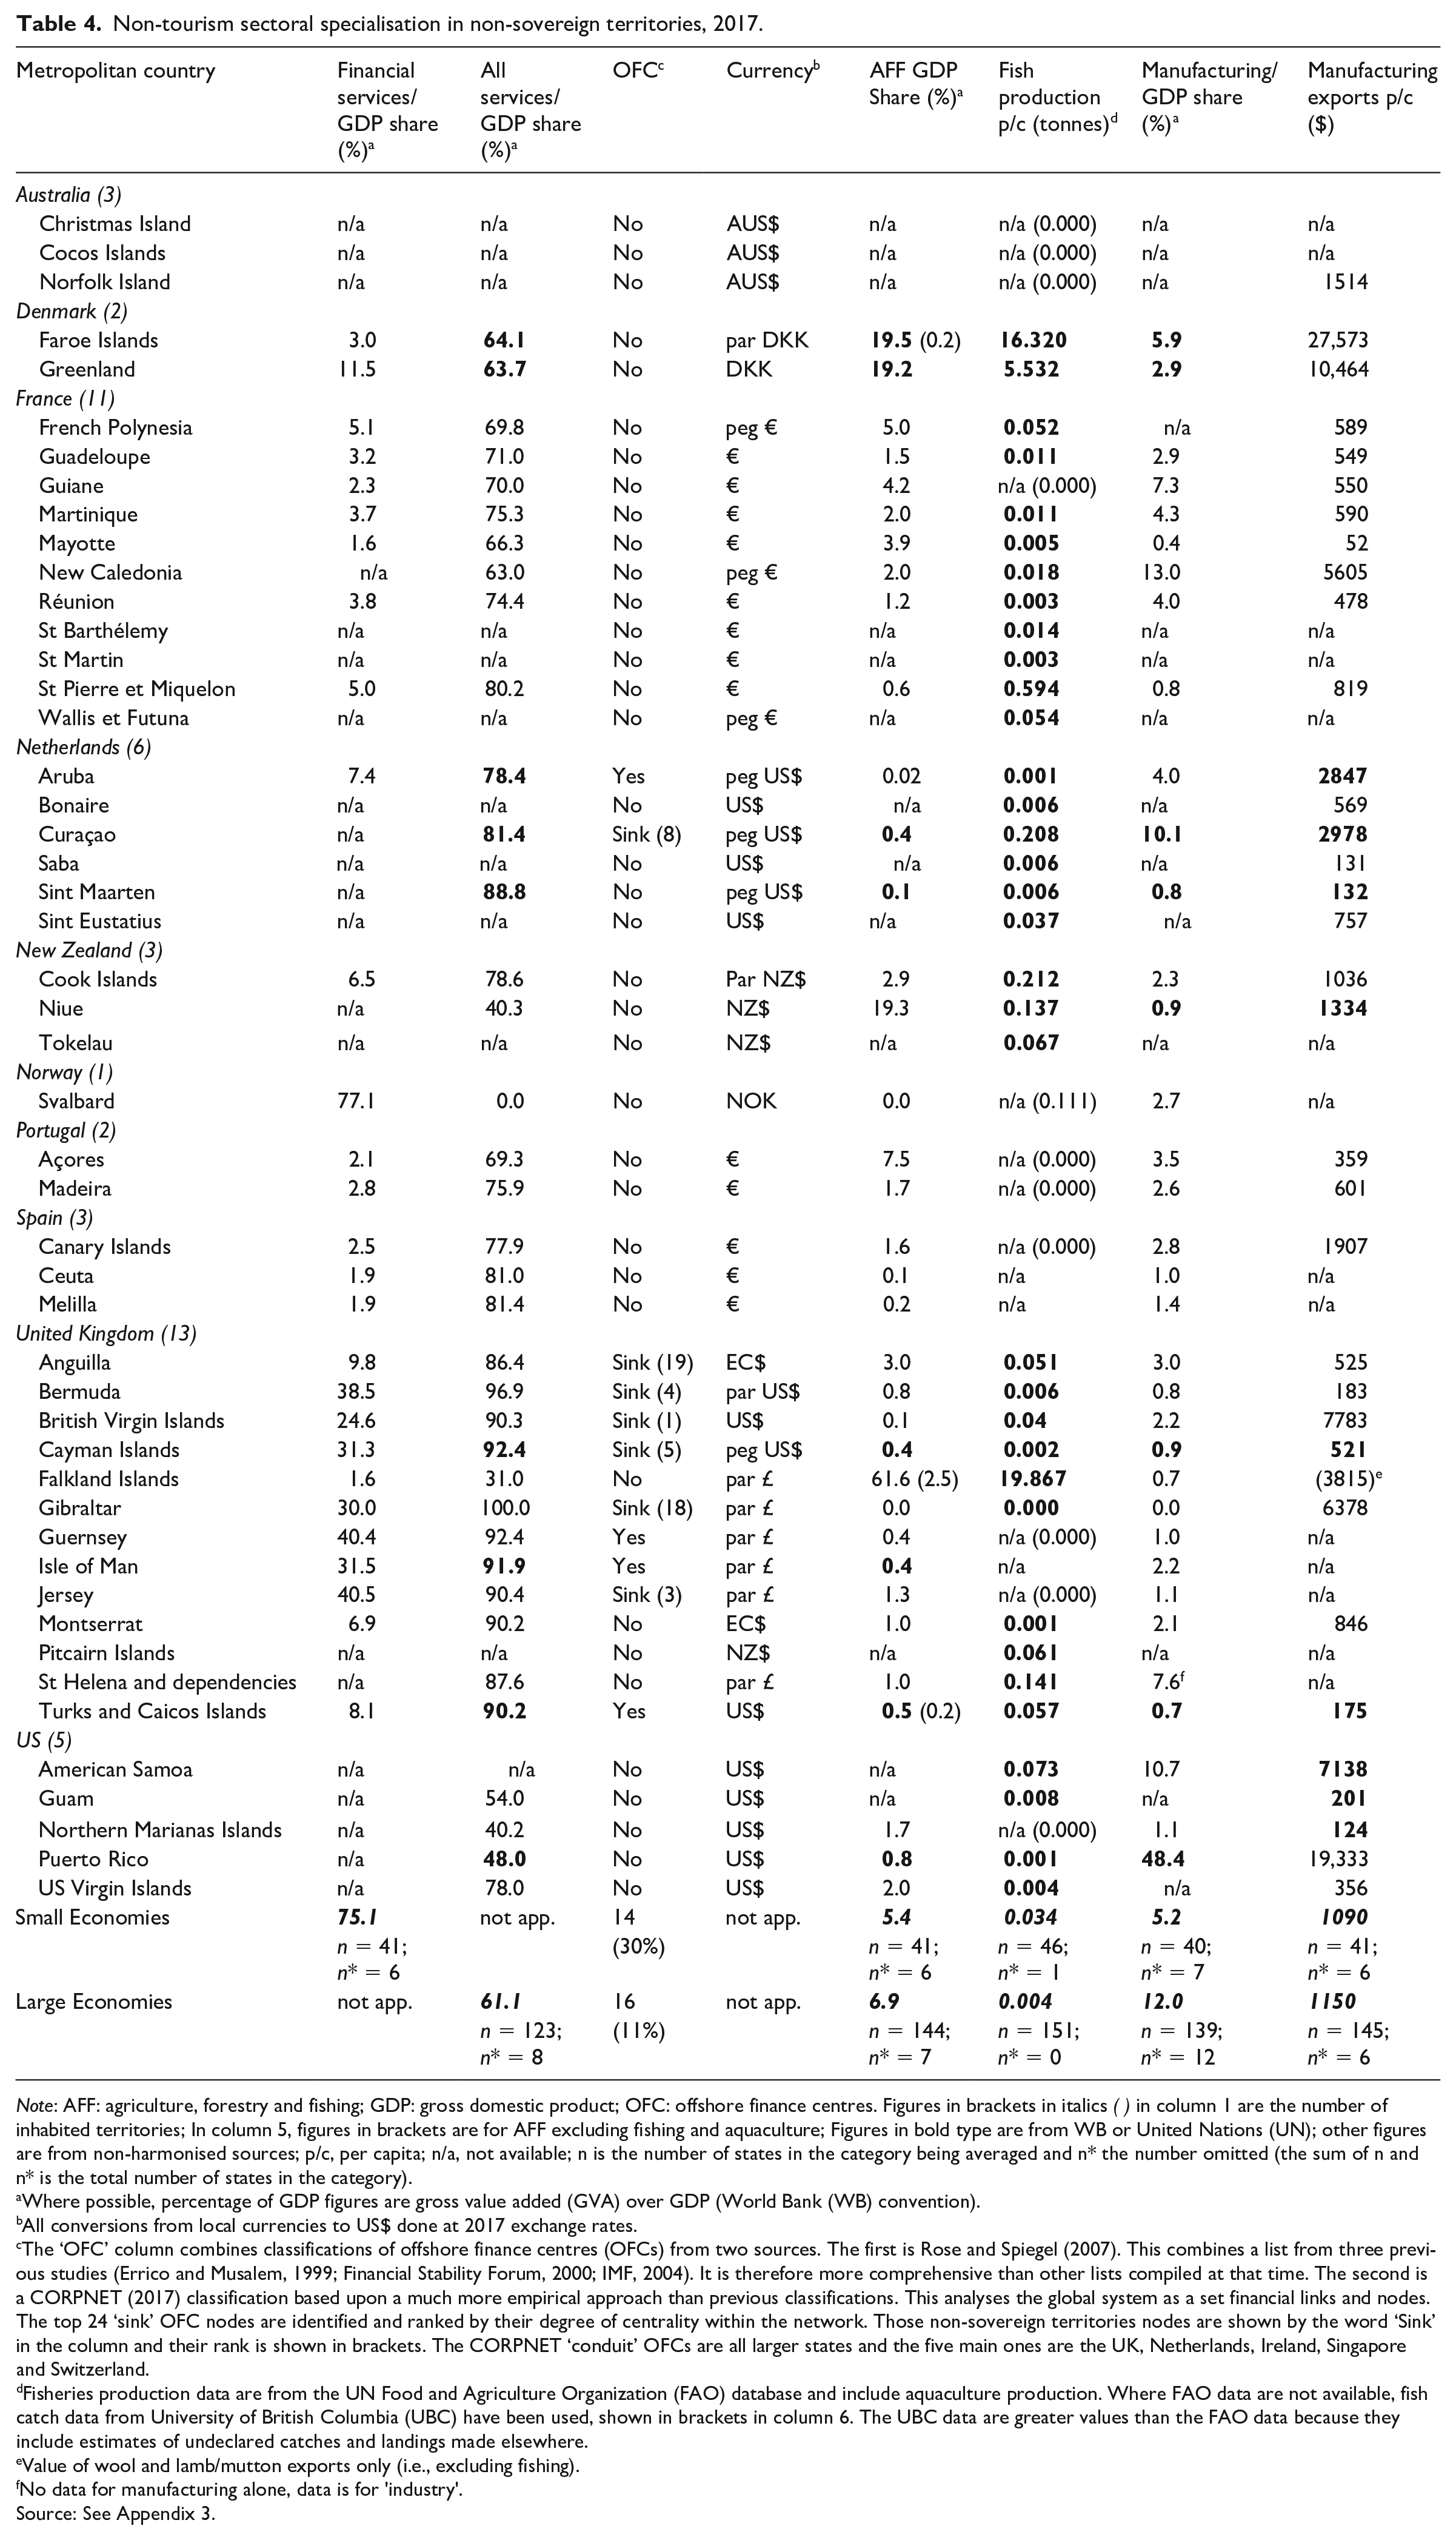
Note: AFF: agriculture, forestry and fishing; GDP: gross domestic product; OFC: offshore finance centres. Figures in brackets in italics ( ) in column 1 are the number of inhabited territories; In column 5, figures in brackets are for AFF excluding fishing and aquaculture; Figures in bold type are from WB or United Nations (UN); other figures are from non-harmonised sources; p/c, per capita; n/a, not available; n is the number of states in the category being averaged and n* the number omitted (the sum of n and n* is the total number of states in the category).
Where possible, percentage of GDP figures are gross value added (GVA) over GDP (World Bank (WB) convention).
All conversions from local currencies to US$ done at 2017 exchange rates.
The ‘OFC’ column combines classifications of offshore finance centres (OFCs) from two sources. The first is Rose and Spiegel (2007). This combines a list from three previous studies (Errico and Musalem, 1999; Financial Stability Forum, 2000; IMF, 2004). It is therefore more comprehensive than other lists compiled at that time. The second is a CORPNET (2017) classification based upon a much more empirical approach than previous classifications. This analyses the global system as a set financial links and nodes. The top 24 ‘sink’ OFC nodes are identified and ranked by their degree of centrality within the network. Those non-sovereign territories nodes are shown by the word ‘Sink’ in the column and their rank is shown in brackets. The CORPNET ‘conduit’ OFCs are all larger states and the five main ones are the UK, Netherlands, Ireland, Singapore and Switzerland.
Fisheries production data are from the UN Food and Agriculture Organization (FAO) database and include aquaculture production. Where FAO data are not available, fish catch data from University of British Columbia (UBC) have been used, shown in brackets in column 6. The UBC data are greater values than the FAO data because they include estimates of undeclared catches and landings made elsewhere.
Value of wool and lamb/mutton exports only (i.e., excluding fishing).
No data for manufacturing alone, data is for ’industry’.
Source: See Appendix 3.
The role and importance of financial services is shown in columns 1–4 of the table. The share of financial services – primarily financial intermediation (i.e. mainly banking and insurance) – in GDP is shown in column 1. Column 2 shows the total share of services, public as well as private, which is considerably larger than for both small and large states. Whether a territory is an offshore finance centre (OFC) is indicated in column 3, based upon the classifications of CORPNET (2017), Rose and Spiegel (2007) and Garcia-Bernardo et al. (2017). Several findings stand out. Some 22.4% of territories possess an OFC compared with 30% of small and 11% of large states. Regardless of the sector’s importance, all territories have either adopted a hard currency or have a link at par or a fixed exchange rate peg (column 4), reducing exchange rate risk for capital inflows and ensuring currency convertibility (Armstrong and Read, 1998) over and above any economic policy benefits. Apart from Curaçao, OFCs are found exclusively in UK territories and are all categorised as ‘sink’ – that is, locations where wealth is stored/lost, as opposed to ‘conduit’ operations – nodes in the flow of international capital (CORPNET, 2017). This is perhaps unsurprising given that London and Amsterdam are two of the world’s top five ‘conduit’ OFCs. The latter are defined as ‘attractive intermediate destinations in the routing of international investments . . . (which) . . . enable the transfer of capital without taxation’ (Garcia-Bernardo et al., 2017: 1) and are globally dominated by Ireland, the Netherlands, Singapore, Switzerland and the UK. By contrast, ‘sink’ OFCs attract and hold capital, often in a non-transparent manner.
An important challenge for territories with OFCs therefore is the regulatory and ethical issues relating to tax evasion and avoidance, including money laundering. The OECD and the EU have initiated a series of measures, notably promoting transparency and the exchange of information for tax purposes (European Commission, 2013, 2020b; OECD, 1996, 2000). The G20 advocated ending banking secrecy in response to the global financial crisis given anticipated shortfalls in tax revenues needed for recovery. The role of OFCs is therefore likely to be increasingly constrained by further regulation of such capital flows. This may be a slow and contested process, since many OFCs have been set up in close collaboration between territories and their metropoles (Gravelle, 2014).
Data for agriculture, forestry and fishing (including aquaculture) (AFF) in the territories is provide in columns 5 and 6 in Table 4. Their shares in GDP are generally well below those for both small and large sovereign states (5.4% and 6.9%, respectively). A few are major producers and exporters of fish and aquaculture per capita (notably the Falkland Islands, the Faroe Islands and Greenland). Figures in brackets in column 5 give the AFF share in GDP excluding fisheries and aquaculture (where possible) and indicate that it is not an important activity in most territories. The available data also suggests that the Pacific MIRAB territories, apart from Niue, do not possess large agriculture sectors, primarily because most of these activities are subsistence and not included in the GDP figures.
The pattern of manufacturing in the territories is broadly similar to that of AFF (Table 4, columns 7 and 8). Puerto Rico is the only major manufacturing centre, aided by its proximity and preferential access to the US/North America Free Trade Agreement (NAFTA) markets. Every territory possesses some specialist manufacturing but, in most cases, these are not major export earners. The substantial merchandise exports for American Samoa are dominated by processed tuna from the largest cannery in the region. Aruba, Curaçao and Gibraltar appear to be significant manufacturing exporters but are all heavily involved in bunkering and re-exporting. This involves the supply, storage, loading and distribution of fuel for ships and aircraft. The only significant non-renewable natural resource exporter is New Caledonia (tin), although several other territories are currently engaged in oil-prospecting.
Conclusions
This paper provides an in-depth exploration of the geographic characteristics and economic structures of the world’s 49 principal inhabited non-sovereign territories. These entities are subject to similar growth constraints to sovereign small states but are distinct in terms of their very small populations, limited land areas and extensive EEZs. They have benefited from pursuing the same export-led growth strategies and adopting similar patterns of niche sectoral specialisation, notably in tourism and financial services, which have generated high per capita incomes. The European territories appear to have been particularly successful.
The global financial crisis, the 2020 Covid-19 lockdown, and a series of environmental shocks in the Caribbean have revealed fundamental weaknesses in this traditional growth paradigm; many territories now appear to be heavily over-exposed to external conditions. Most relatively prosperous territories are highly specialised in a combination of financial services and tourism, both of which have been adversely affected by these shocks. Global heating also poses a significant challenge placing emphasis upon environmental rather than economic sustainability. The heavy dependence of territories upon tourism is based primarily upon medium- and long-haul air travel, given their remoteness combined with a continued reliance upon distant metropolitan markets. In the Caribbean in particular, this environmental challenge also encompasses cruise tourism. OFCs also face a critical challenge relating to international regulatory proposals to control or eliminate financial service activities associated with tax evasion.
Extensive diversification is not a feasible option for the territories owing to their small size, but policy moves to reduce over-specialisation and concomitant exposure to shocks are surely warranted, particularly to reduce the environmental footprint of tourism. There is therefore an urgent need for further agile ‘flexible specialisation’ (Baldacchino, 2019) to identify niche activities to replace tourism and offshore finance. New niches may emerge from within the Blue Economy as well as agriculture and manufacturing, limited examples of which already exist. These latter two niches typically exhibit high-value-low-weight and/or enjoy phytosanitary (e.g. organic certification, non-genetically modified (GM)), security (e.g. diamond cutting) and other advantageous characteristics. The current dominance of tourism and financial services may also have ‘crowded out’ potential alternative activities by bidding up domestic factor prices such that these effects might subsequently be reversed by limited diversification.
Policies to promote new niches and greater environmental sustainability in the territories will need to be locally led with sensitive involvement by the metropoles. Over-zealous ‘top-down’ sustainability policies may have potential damaging economic and social effects, such as in Guadeloupe and Martinique (Rauzduel, 2020). Marginalising the voices of the territories together with constraints on local financing may be becoming particular problems where sustainability policies are being developed (Ferdinand, 2018; Robinson, 2018; Schwebel, 2018). The struggle for territories to turn ‘their natural and socio-economic handicaps into assets’ will be hard (Gil, 2016: 5). As always, what is needed is an appropriate partnership between territory and metropole.
The implementation of this fundamental change in strategy represents a major new growth challenge for non-sovereign territories. Many will be naturally uneasy about making such changes given the sustained success delivered by the traditional growth paradigm to date, their heavy dependence upon the existing patterns of sectoral specialisation and, in many cases, the limited opportunities to diversify by developing new niche activities. This quest for greater future economic and environmental sustainability is critically important and new solutions need to be found and new relationships forged sooner rather than later. Tensions may arise from the ‘accident of geography’ that placed many territories closer to major global markets other than Europe, especially in the Caribbean, in spite of the strong economic and other ties with their metropolitan power. EU integration may also bring new strains for the territories, especially if the EU moves to a closer and more consistent policy with respect to the territories of its member states as some are proposing. Paradoxically, the UK exit from the EU has created new tensions because of the number of territories involved, requiring new relationships to be developed.
This paper focuses on the inhabited territories, but the 22 uninhabited territories may have a greater role to play. At present they are mainly of interest in terms of scientific biodiversity and limited fisheries. Some also have a geopolitical dimension; for example the joint UK–US military bases on Ascension Island and Diego Garcia (British Indian Ocean Territory) – the latter being the subject of legal dispute at the International Court of Justice. The increasing importance of emerging Blue Economy options in conjunction with geopolitical manoeuvring by major global powers may bring the role and resources of the uninhabited territories into sharper strategic focus.
Footnotes
Appendix 1: Data Sources for Table 2
Appendix 2: Data Sources for Table 3
Appendix 3: Data Sources for Table 4
Acknowledgements
The authors are grateful to Jacinta Garcìa Mora of the World Tourism Organization (UNWTO), Madrid, for access granted to their statistical database, and to both the journal editor and two anonymous referees for their valuable comments, suggestions and contributions. This paper is part of an ongoing extensive research project by the authors on growth issues relating to small economies.
Declaration of conflicting interests
The author(s) declared no potential conflicts of interest with respect to the research, authorship, and/or publication of this article.
Funding
The authors received no financial support for the research, authorship, and/or publication of this article.
Data Availability Statement
All data used are from public domain statistics of the main international and European organisations (e.g. World Bank, UN, Eurostat) except for UNWTO.