
Abstract
Using Swedish longitudinal micro-data, the aim of this paper is to analyse how regional economies respond to crises. This is made possible by linking gross employment flows to the notion of regional resilience. Our findings indicate that despite a steady national employment growth, only the three metropolitan regions have fully recovered from the recession of 1990. Further, we show evidence of high levels of job creation and destruction in both declining and expanding regions and sectors, and that the creation of jobs is mainly attributable to employment growth in incumbent firms, while job destruction is primarily due to exits and micro-plants. Although the geography of resistance to crises and the ability of adaptability in the aftermath vary, our findings suggest that cohesive (i.e., with many skill-related industries) and diverse (i.e., with a high degree of unrelated variety) regions are more resilient over time. We also find that resistance to future shocks (e.g., the 2008 recession) is highly dependent on the resistance to previous crises. In all, this suggests that the long-term evolution of regional economies also influences their future resilience.
Introduction
Despite national figures showing positive trends for employment and productivity, regional data tend to tell a much more diverse story about the evolution of the economic landscape, indicating increasing differences between leading and lagging regions (Essletzbichler, 2007; Gardiner et al., 2013; Lundquist et al., 2008; Martin, 2012). These persistent spatial differences are at the core of this paper.
Using the Swedish economy as an example, we analyse how regional economies responded to crises in the period 1990–2010. The aim is to gain further understanding of how regional micro-processes influence regional resilience or, more specifically, the ability of resistance in times of recession and adaptability in the aftermath. We thereby address the following questions: What are the driving forces generating and destroying regional employment? How are the regional differences in employment and the ability of resistance and adaptability to crises related to the structure of regional industries and plants?
We focus on employment change over time to analyse the dynamics of resilience. This is motivated because, firstly, employment effects in relation to crises tend to be more persistent than output effects (Martin, 2012). Secondly, adaptability tends to be dependent on the characteristics of the regional labour force and changing labour market conditions (Diodato and Weterings, 2015; Eriksson et al., 2014). Sweden is a particularly well-suited case for this type of analysis since the chosen time frame comprises three periods of crisis and two phases of recovery, ending in the latest 2008 recession.
We make two contributions to the literature. Firstly, the availability of geo-referenced matched employer–employee data make it possible to follow in detail the evolution of regional economies over time, and decompose net employment changes into gross job flows consisting of simultaneous processes of job creation and destruction. Thus, compared to the majority of studies analysing employment shifts based on net employment figures, this approach allows us to discern the driving forces generating and destroying employment (entries, exits and incumbents) over time and space (e.g., Essletzbichler, 2007). Secondly, in contrast to previous studies on gross employment flows, we link the processes of job creation and destruction to the notion of regional cyclical sensitivity, as proposed by Martin (2012). In so doing, we link the characteristics of micro-processes to outcomes at the macro level, and acknowledge the temporality of resilience. This is crucial, since the ability to both absorb shocks and develop new growth paths is fundamental for understanding the scope for re-orienting regional skills, technologies and institutions (cf., Boschma, 2015).
The remainder of the paper is structured as follows. The second section provides the conceptual motivation for studying the geography of resilience from an evolutionary perspective, using both net employment change and gross job flows. The third section consists of the empirical analysis, which explains the evolution of the Swedish economy from the 1990s and onwards, together with a description of the data and results. The fourth section concludes the paper.
Theoretical framework
With diverging regional economic trajectories and diverse regional responses to severe global recessions (Gardiner et al., 2013; Lundquist et al., 2008; Martin, 2012), the notion of regional resilience to shocks is gathering considerable interest in both policy and academic circles (Boschma, 2015; Hudson, 2010). The term resilience has mainly been referred to as an economic system that diverges as little as possible from the initial state (Christopherson et al., 2010). Hence, a resilient region would be one that does not change, thereby neglecting the role of time and space in the transformation of the economic landscape.
Economic geographers have developed the work on resilience towards a more evolutionary and spatial understanding, creating a framework that encompasses diverging and uneven spatial trends of resilience (e.g., Boschma, 2015; Dawley et al., 2010; Martin, 2012; Pike et al., 2010). Regions are evolving on/through several different open-ended trajectories, whereby development is regarded as a process rooted in the present and formed by the past. These path-dependent transformations do not imply deterministic developments but give rise to continuity through the inertia of institutions and behavioural routines, and change through the ‘creative destruction’ of novelties (Schumpeter, 1951). As these economic processes are both geographically and historically specific, the evolution of the economic landscape gives rise to enduring inter-regional differences and intra-regional similarities concerning both what is being done and how it is being done (Rigby and Essletzbichler, 1997). Institutions per se will not be addressed in this paper, but they are reflected in the changes as well as the continuity observed in the regional characteristics and outcomes.
Martin (2012) uses periods of shocks to understand the temporality and spatiality of regional development and resilience. Thus, by developing a temporal dimension of resilience we, in a similar fashion to Martin (2012), break down the resilience concept into the regional reaction, or resistance, to the initial phase of the crisis, and the later recovery phase after the shock, which is the region’s adaptability to new conditions. While resistance is closely linked to the traditional usage of resilience, the adaptability concept introduces a more complex understanding of how and when a region is resilient – for example, the renewal of a certain path or the creation of a new one (Martin, 2012). We will also address the potential trade-off between resistance and adaptability, something Boschma (2015) argues is in great need of being re-evaluated.
To empirically address regional resistance and adaptability we have chosen, in line with Martin (2012), employment change as our analysis unit. This is due to the tendency for employment change to have much greater difficulty than output during periods of recovery, as well as the severe consequences that the employment rate and labour market conditions have on local economiew (Martin, 2012; Massey and Meegan, 1982) employment change data. As argued by Massey and Meegan (1982), cannot be substituted with output information because there is no simple and distinct relation between productivity and employment change. Net figures are the most common measurement of employment change (e.g., Gardiner et al., 2013; Lundquist et al., 2008; Martin, 2012; Massey and Meegan, 1982; Simmie and Martin, 2010). However, as argued by Boschma (2015), to understand the dynamic complexity of regional resilience we need to understand the micro-processes at work. When one assesses the evolving landscape of labour, net employment dataseldom reveal the continuous creation and destruction of jobs. Studies on the manufacturing sector in the UK (Essletzbichler, 2007) and the USA (Davis and Haltiwanger, 1999; Essletzbichler, 2004) show that small incremental changes in net employment conceal a high turnover of jobs and are, therefore, a poor approximation of the changing labour demand in local labour markets. By including a spatial dimension, Essletzbichler (2004, 2007) reveals the highly geographical nature of gross employment flows, and further shows that UK regions depend on the creation and destruction of jobs from different plant changes (exit, entry, incumbent) to various degrees. Essletzbichler (2007) also concludes that intra-regional and intra-sectorial flows are much more important than is commonly identified in studies using net employment change, in which mobility is mainly assumed to be driven from declining to expanding industries and regions.
Based on these contributions, this paper focuses on the micro-dynamics of gross employment flows, because in contrast to net changes this acknowledges the complexity of the spatiality and temporality of labour demand. A second reason is that, in contrast to mainstream economics where labour tends to be simplified into a commodity, employees are both place-bound and idiosyncratic (Castree et al., 2004). It is thus not only radical changes in net figures that will have an effect on workers; changes at the micro-level will also have an effect on the everyday life of the workforce, as these are ‘region-specific relational assets’ (Storper, 1997: 137), relationally (re)produced norms, skills and ambitions that change the labour characteristics and qualities through a path-dependent evolution and spatial division of labour (Storper and Walker, 1989). This implies that even though regions would face the same temporal pressure, they process these in different ways, ending up with different outcomes (Castree et al., 2004). These strategies and outcomes are one of the main concerns within resilience research.
What has been found in previous studies is that different regional resources matter in different phases of a shock. While the resistance in the first phase is dependent on regional embeddedness (i.e., persistent local buyer–supplier relationships) and strong ties between agents, the phase of adaptability depends on network structures, institutions and the relational position towards other regions, but also on the industry mix and particularly industry relatedness (Boschma, 2015; Diodato and Weterings, 2015; Eriksson et al., 2014; Pike et al., 2010). Specialized regions are dependent on the same resources and demand and tend to be more vulnerable, since a shock might disturb the whole economy (Diodato and Weterings, 2015; Eriksson et al., 2014). The effects from specialized regions are also primarily innovations leading to higher productivity rather than employment growth (Frenken et al., 2007). Diverse regions are less exposed to sector-specific shocks, and diverse regions with many related sectors can also absorb laid-off workers due to the transferability of their human capital resources (Frenken et al., 2007). This would mean that a region with a combination of industries that are ‘close’ in terms of these human capital resources would be a region that is cognitively cohesive and that facilitates adaptability in times of crisis. This implies that different policies will lead to diverse effects in the different phases of a recession. According to Pike et al. (2010), a single focus and strategy to foster the initial resistance that is currently happening in the form of privatization and marketization might only be a short-term solution that results in institutional homogenization. As exemplified in Grabher’s (1993) study on the Ruhr area, too much homogeneity and inflexible industrial structures could lead to lock-in and subsequent regional decline.
To improve our understanding of what it is that makes regions resistant and adaptable, there is a need to understand the dynamics of local labour markets. This is addressed in this paper by analysing the aggregated micro-processes of gross employment changes at work in Swedish regions over time as well as in different phases of recessions.
Explaining uneven regional development
Data
We have used longitudinal matched employer–employee data, originating from Statistics Sweden (SCB). This enables us to connect information on the number of employees at each plant, and then follow that plant over time. We follow the definitions on gross employment flows by Essletzbichler (2007) (see definitions in Table 1); net is job creation (JC) minus job destruction (JD), while gross is the sum of job creation and job destruction. All figures on creation and destruction are shown as percentages of the total number of jobs. Each plant was defined as exit, entry or incumbent, following SCB’s official definitions of firm survival. 1 Following Essletzbichler (2007), we define job creation as the sum of all created jobs at a plant, categorized as entry or expanding incumbent; job destruction is defined as the sum of jobs destroyed at a plant categorized as an exit or a declining incumbent.
Variable definitions.
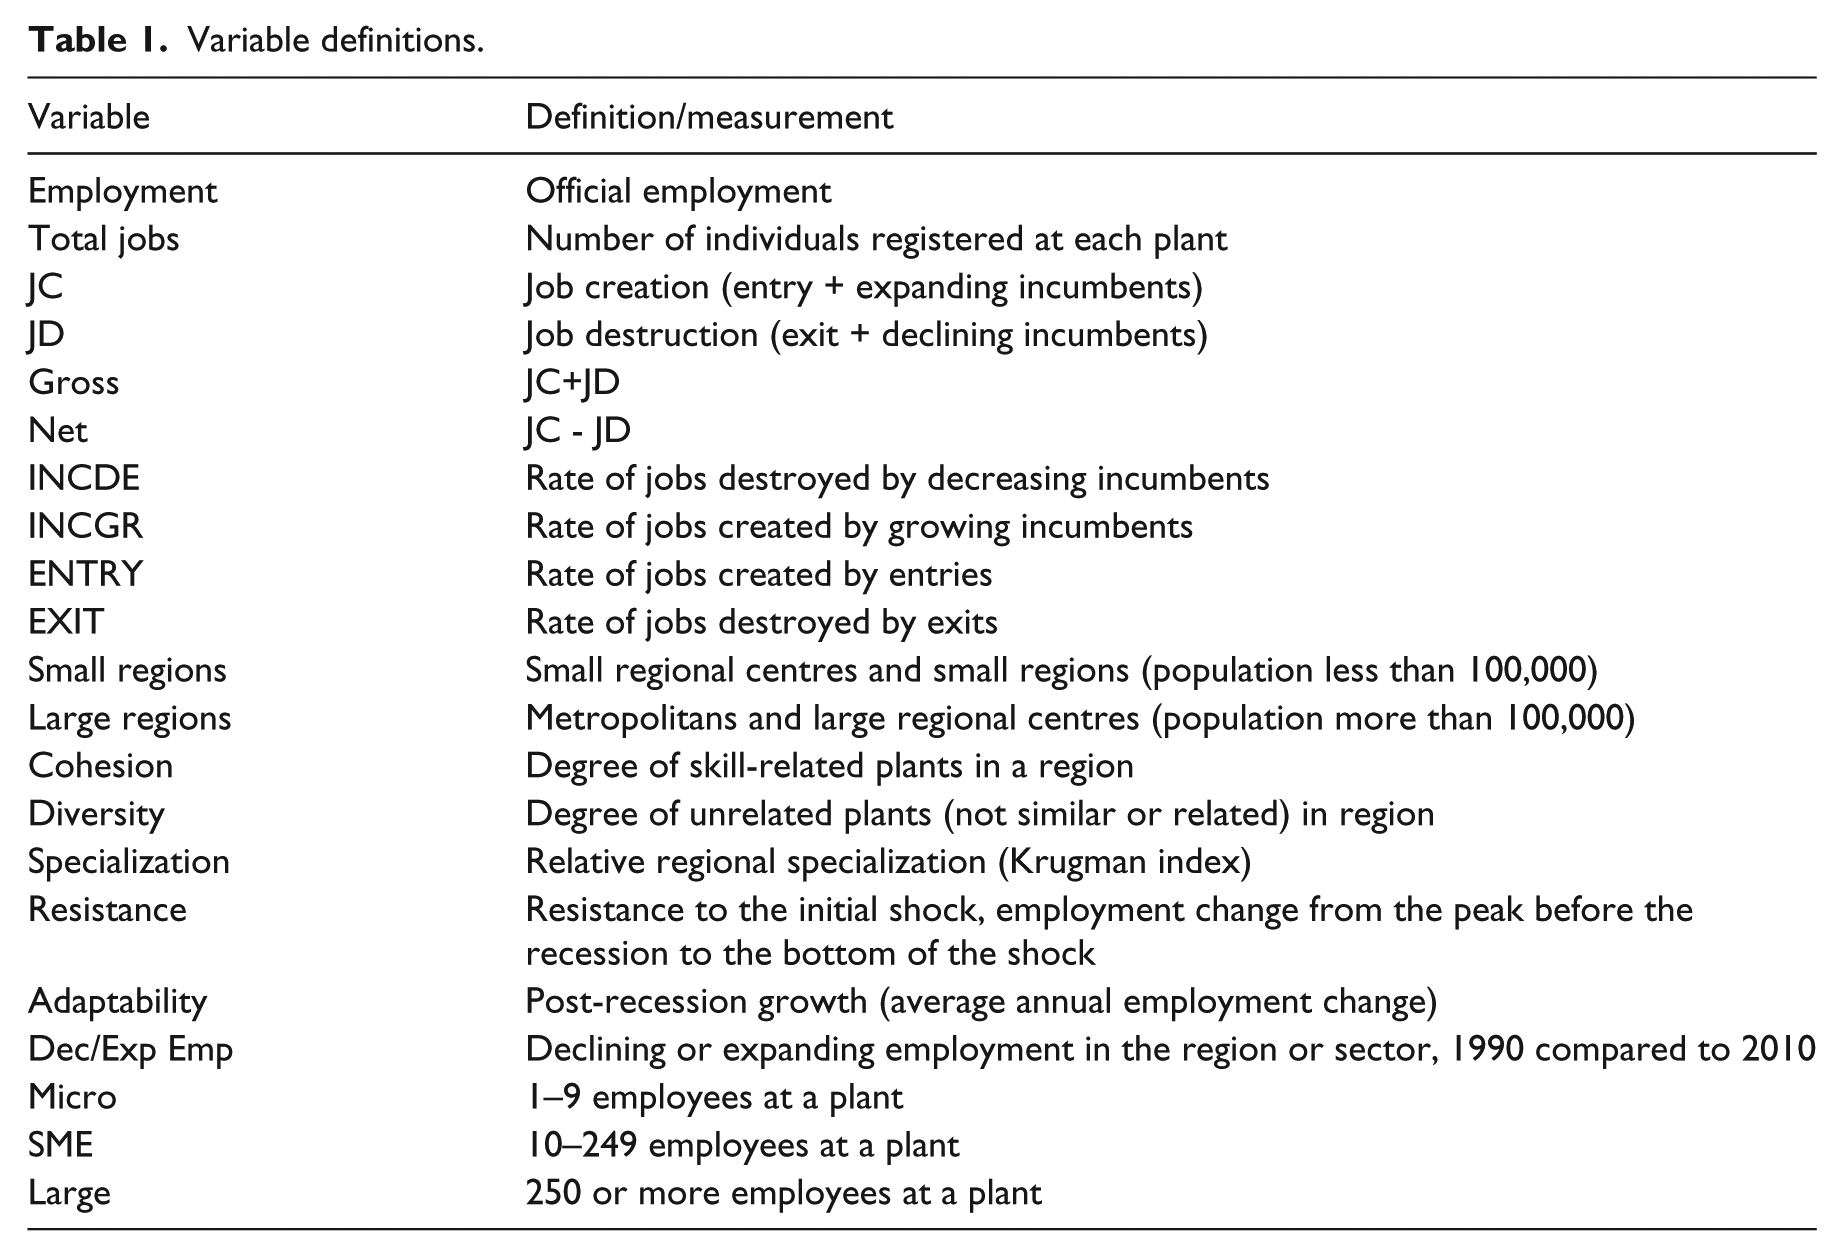
Since previous studies highlight the importance of industry mix for understanding regional differences in resilience (Diodato and Weterings, 2015), we address this in the form of related and unrelated diversity and regional specialization. Related variety is based on the skill-relatedness concept developed by Neffke and Svensson-Henning (2013), in which they argue that high proportions of labour flows between two industries (given differences in wages and growth) are an indicator of cognitive proximity since this captures how transferable human capital is between sectors. Similar to Neffke et al. (2011), we then summarized the number of plants in each region that were skill-related as a ratio of all plants present in the region. This sum is used as a measurement of the intra-regional interconnections, or cohesion, reflecting the degree of related variety in the region. Unrelated plants are those that are not in the same sector or related (as defined above). The definition of regional specialization is based on the so-called Krugman Specialization Index (Krugman, 1991), whereby the relative number of plants in industry i in region r is compared to the national share of that industry (except region r). According to previous studies (e.g., Boschma et al., 2014; Frenken et al., 2007), we expect that specialized regions are less likely to be well protected from sticky unemployment in cases of shock due to a relative shortage of other employment opportunities in the region, while more diverse regions are more capable of withstanding asymmetric shocks due to portfolio effects providing employment opportunities for redundant labour in a wide array of regional sectors. The influence of cohesiveness (relatedness) is expected to differ depending on the type of shock. Diodato and Weterings (2015) find that cohesive regions are better at absorbing sector-specific shocks as this enables a better matching between sectors that are skill-related, while it may be less protective for general shocks affecting the entire region since in such cases all skill-related sectors are likely to be affected.
Two different spatial levels have been used for the analysis (see Figure A1 in the Appendix). The smallest regional unit is the Functional Analysis regional division (FA regions) created by the Swedish Agency for Economic and Regional Growth (2011). These 72 FA regions are constructed from labour-commuting patterns between municipalities, intended to represent functional labour markets that are somewhat persistent over time. The larger regions are based on the European Union’s administrative units Nomenclature des Unités Territoriales Statistiques 2 (NUTS 2) (Eurostat, 2012), but have been altered in this paper from seven to eight regions and are referred to as the NUTS8. Minor modifications have been made so that the NUTS8 will work with the FA regions, while a major change has been made in the north of Sweden to reflect a coast–inland divide; a prominent difference in matters such as the proportion of highly educated employees and developments in population growth as well as employment, since the coastal areas house all the major regional centres and expansive hinterlands while the inland regions are sparsely populated and face population decline (e.g., Holm et al., 2013).
Background
Before we turn to the empirical findings, some notes on the evolution of the Swedish economic landscape are warranted. From the early 1950s to the early 1970s Sweden developed a strategy later referred to as the Swedish model; welfare politics were put at centre stage, with large state investments in social reforms, strong unions, a solidaristic wage system and low unemployment (Movitz and Sandberg, 2013). This meant a shift in living conditions for the average Swedish citizen; income differences decreased while consumption increased dramatically among the majority of the population. The result was a major structural transformation with a decline in agriculture and an expansion of the manufacturing and service sectors, which affected the geography of people and production in the form of an intensified urbanization. A period of growth followed the oil crisis in the 1970s, with new political strategies referred to as ‘the third way’, a step towards the later prominent substitution of welfare with workfarism (Peck and Theodore, 2001). The focus shifted towards the supply-side, and firm profitability was to be achieved through currency devaluation and stagnating wages. Ultimately, this led to an overheated Swedish market and a major macroeconomic recession at the beginning of the 1990s, where gross domestic product (GDP) fell by 6% and unemployment rose from 1.5% (1989–1990) to 8.2% in 1993 (Magnusson, 2002). The recession hit the economy hard and, as shown in Figure 1, it took a long time before Sweden managed to recoup an employment level with a magnitude similar to that of the late 1980s. Like in many other Western societies (e.g., Bristow, 2010), the 1990s also marked the start of a shift towards more knowledge-intensive production, in particular services due to perceived competitive advantages, as this was assumed to secure the future competitiveness of regional economies.
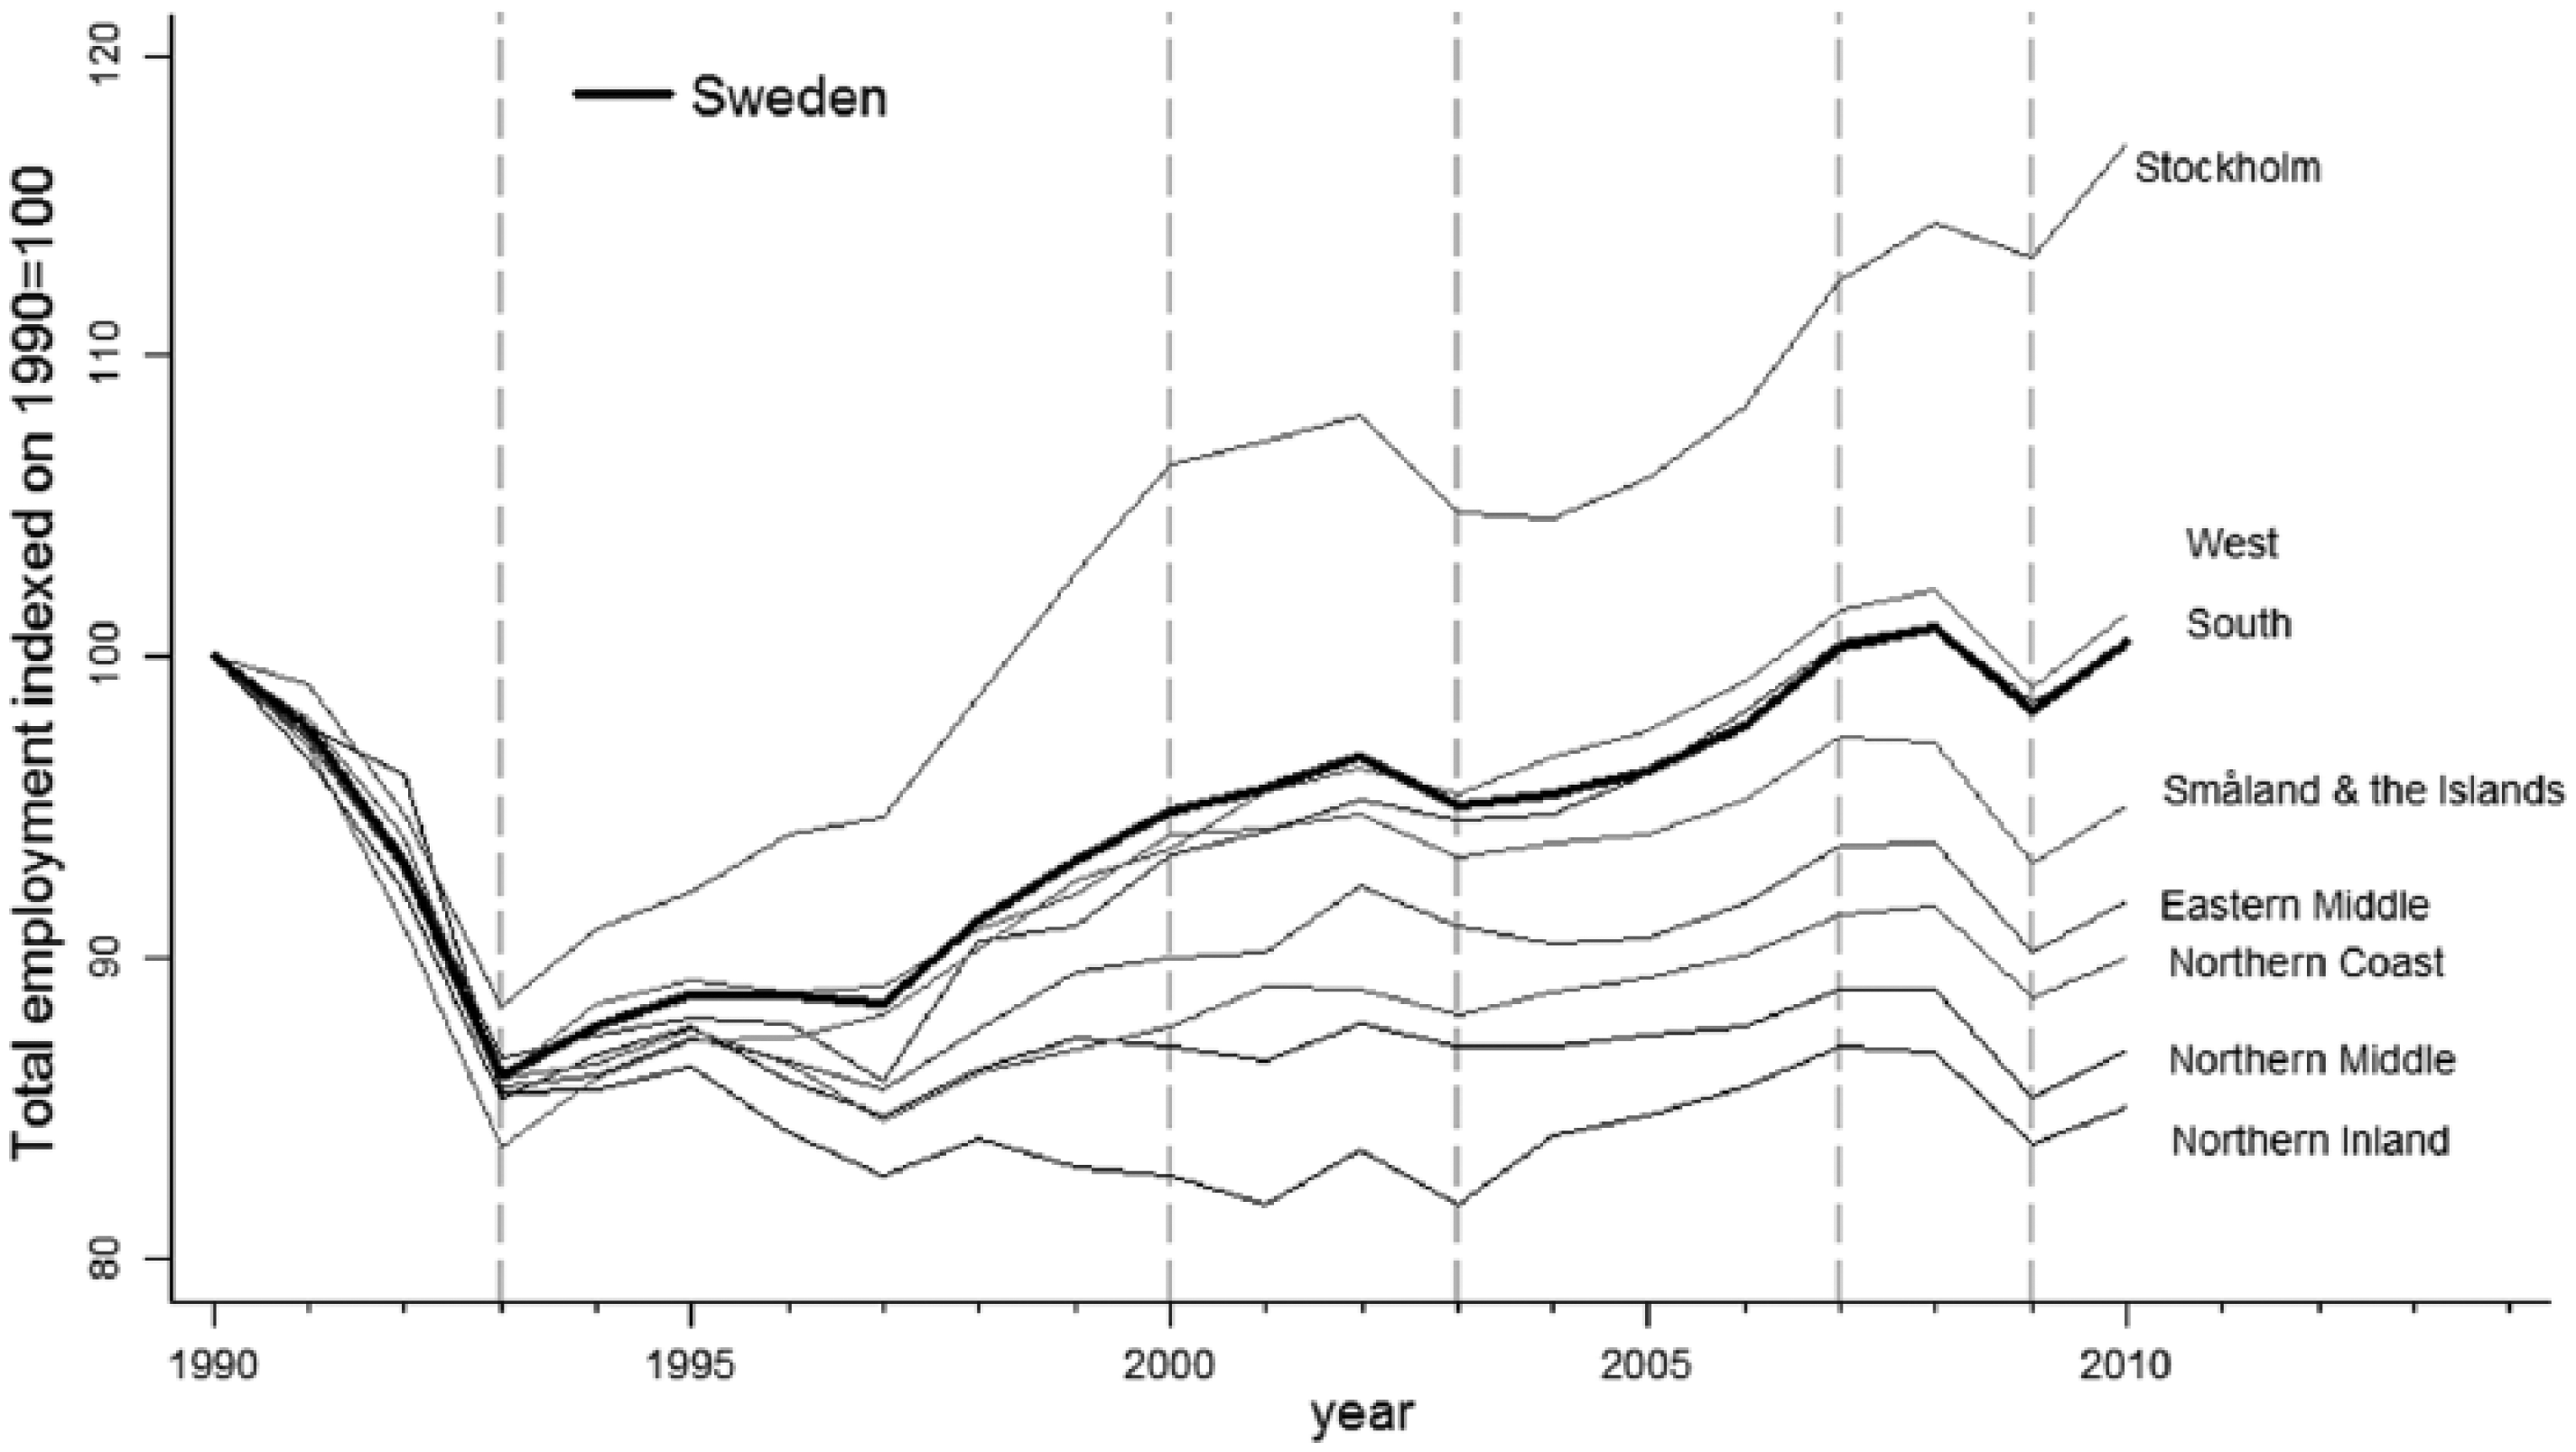
Employment change in Sweden and NUTS8 regions (index = 1990).
During this period the turbulent employment change was mainly due to the job destruction of open-ended contracts, and in 10 years (1990–2000) the number of fixed-term contracts (temporary work) rose by 50% (Holmlund and Storrie, 2002). These changes are due to both economic and political reasons. Sweden is increasingly experiencing a neo-liberal new public management accompanied by an intense privatization, a union density that keeps decreasing, decreased unemployment benefits, stronger local regulation and cuts in taxes (Bruhn et al., 2013; Harvey, 2005; Movitz and Sandberg, 2013). Since 1993 the national employment levels have been steadily increasing, apart from some small temporary fluctuations. However, these accumulated figures conceal divergent regional trajectories, as depicted in Figure 1. For the NUTS8 regions, it is only those containing the three metropolitan regions (Stockholm, South with Malmö and West with Gothenburg) that have seen an overall positive trend that has led to a total employment level in line with or above that of the starting year of 1990. The Northern Inland region, on the other hand, felt the most severe rate of employment decline and continued on a development path with negative employment growth even after the recession. The inland regions, which have mostly specialized in primary and secondary sectors, have faced great difficulties catching up after the 1990–1993 recession, while the metropolitan regions, on the other hand, have managed the structural transformation towards more service-oriented sectors much better. This confirms previous findings of increasing regional disparities in Sweden (Lundquist et al., 2008) and that ‘new economy sectors’, such as knowledge-intensive business services, compared to manufacturing mainly agglomerate in the largest Swedish regions, leaving the more sparsely populated regions less space for renewal and development (Eriksson and Hansen, 2013).
Exploratory results
Gross job changes and regional, sectorial and plant characteristics
Table 2 shows the gross employment flows from 1990–2010 for the whole Swedish economy, and further decomposes the flows into expanding/declining regions (reg) and sectors (sec), measured by the size of the labour force. We use Functional Regional Families constructed by the Swedish Agency for Economic and Regional Growth (2011) to divide the regions into large and small regions. This division has been included as earlier findings state that the primary factors determining resilience are characteristics usually related to large regions (e.g., Polèse, 2010). The second part of the table shows the components of gross flows for the manufacturing and knowledge-intensive business sectors (KIBSs). 2 These two groups of industries have been chosen to show the gross flows in relation to the qualitative transformation of the economy, towards what is often referred to as the ‘learning economy’. This is of particular importance in the Swedish case, which has seen a strong manufacturing economy move towards a greater emphasis on sustaining a productive edge in knowledge-based service sectors.
Gross job flows in expanding and declining regions, sectors and labour markets in Sweden, 1990–2010 (N = 72 functional regions).
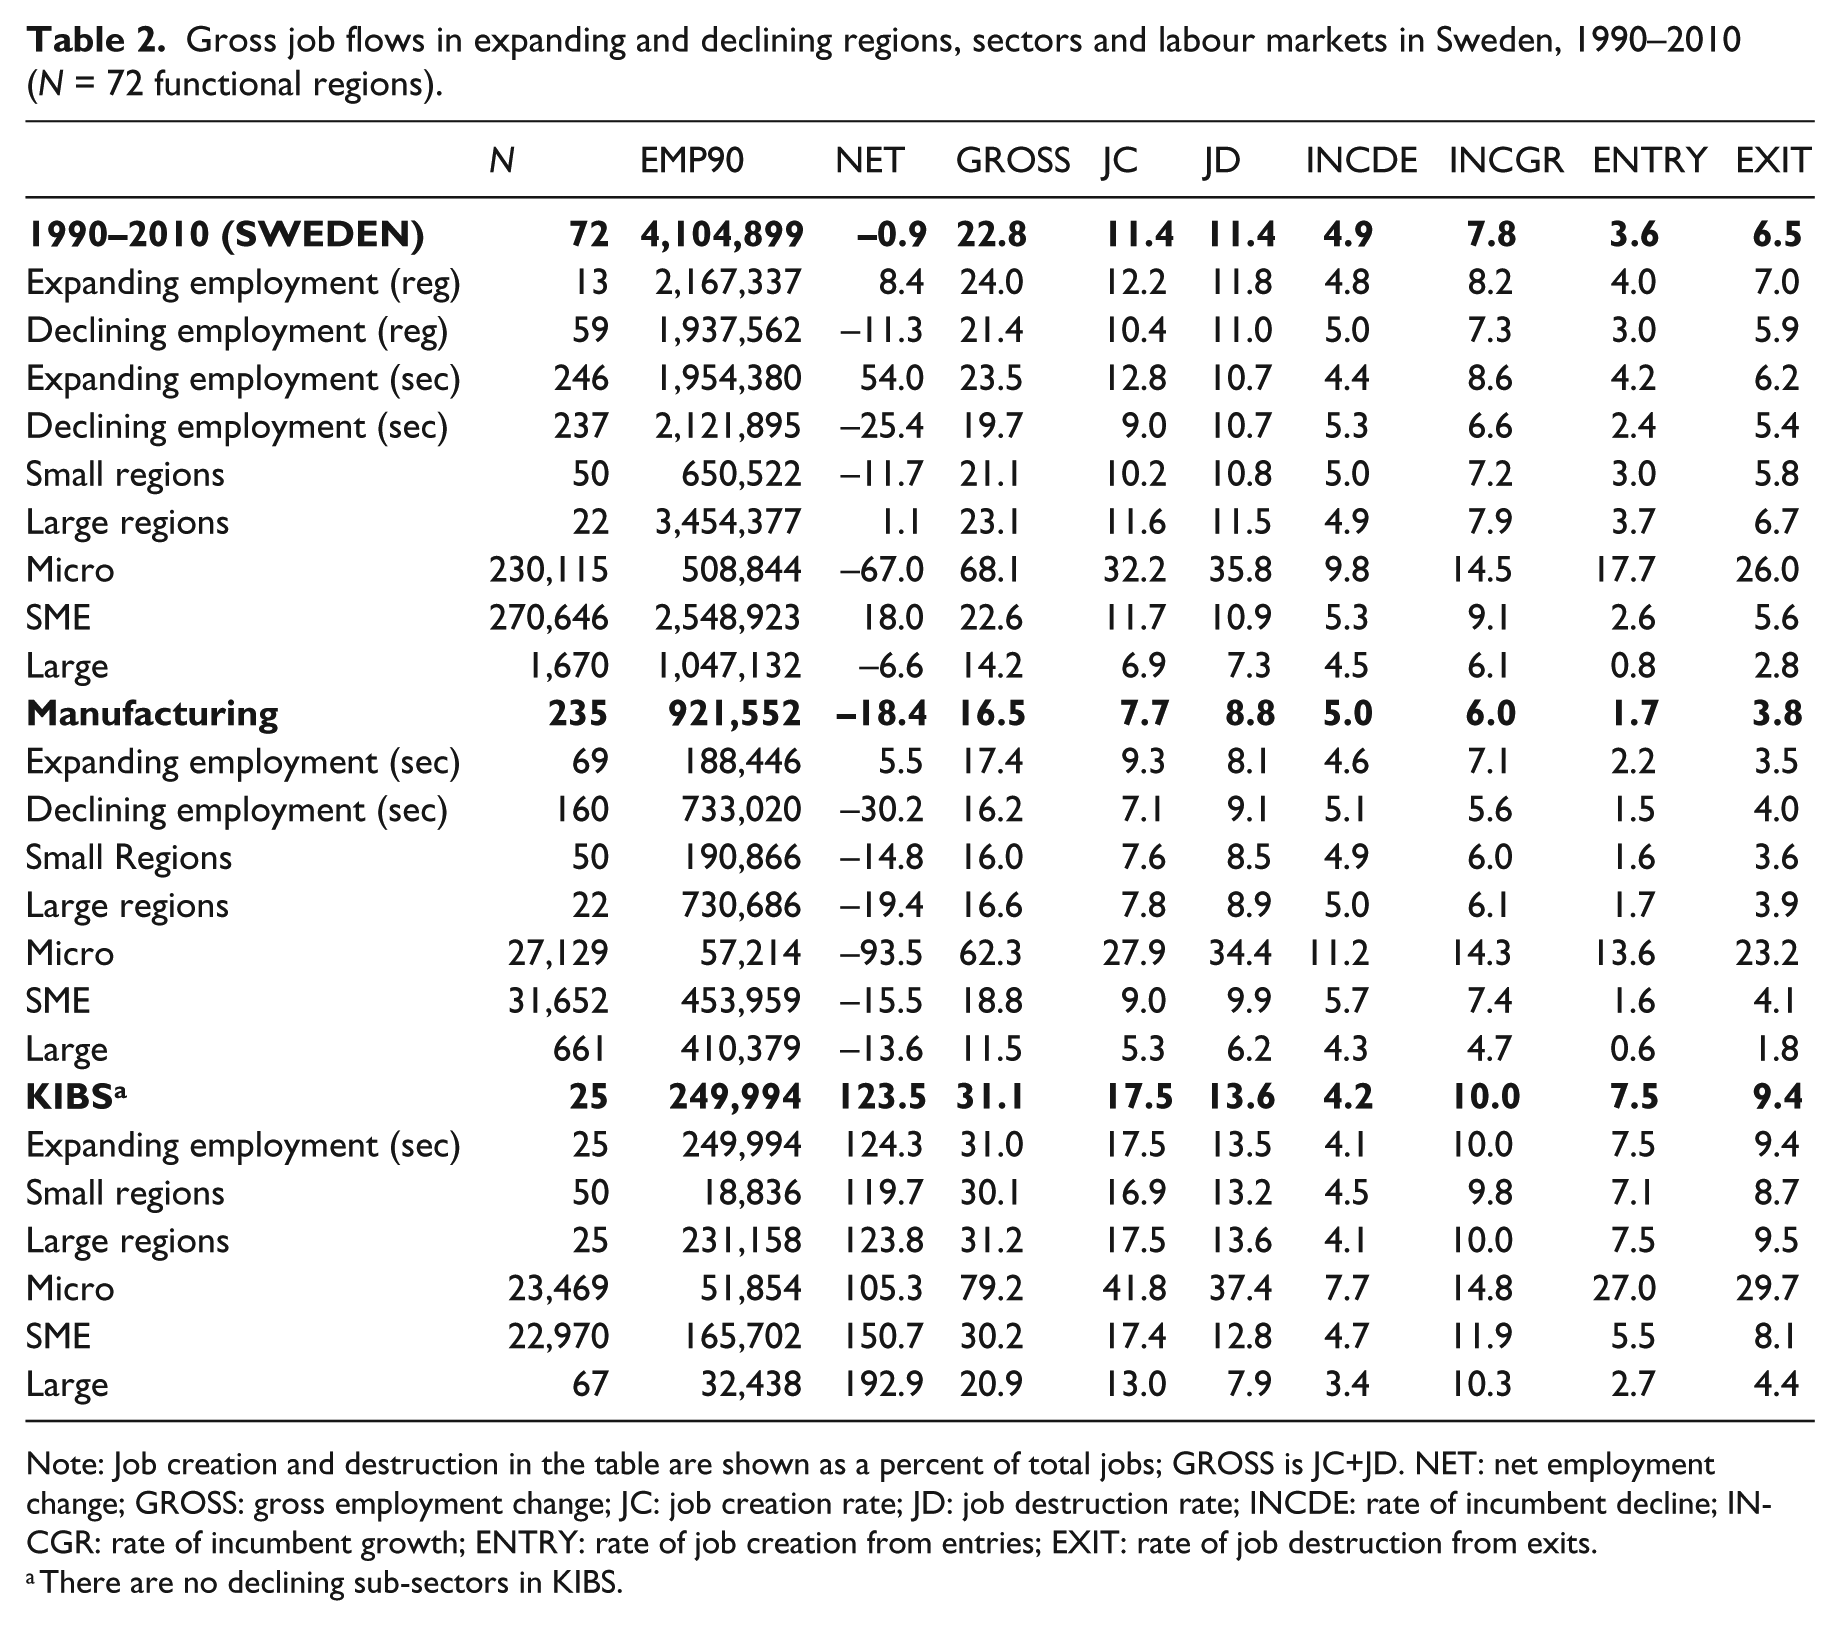
Note: Job creation and destruction in the table are shown as a percent of total jobs; GROSS is JC+JD. NET: net employment change; GROSS: gross employment change; JC: job creation rate; JD: job destruction rate; INCDE: rate of incumbent decline; INCGR: rate of incumbent growth; ENTRY: rate of job creation from entries; EXIT: rate of job destruction from exits.
There are no declining sub-sectors in KIBS.
The national average shows a high gross employment flow, an indication of significant labour flows between plants in the Swedish economy. If these gross employment flows were primarily the movement from declining to expanding regions/sectors, job destruction would primarily be concentrated in declining regions/sectors, and job creation in expanding regions/sectors (Essletzbichler, 2007). However, Table 2 clearly shows that there are high levels of creation and destruction in both expanding and declining regions and sectors, suggesting that net changes at the regional or sectorial level would be insufficient to explain labour demand at the regional level.
The figures on plant change show that incumbent plants are the main contributor to the creation of jobs and that exits are the main source of job destruction. This is in line with the study by Essletzbichler (2007). There does not seem to be a so-called ‘red tape’ issue for new entries, but rather a major problem of surviving and growing (Audretsch and Fritsch, 2002; Bartelsman et al., 2005). Entries can, however, have an indirect positive effect on incumbent developments, but they tend to be positively correlated with population size (Fritsch and Noseleit, 2013). In terms of plant size, micro-plants have the highest gross, and the rate of job destruction greatly exceeds the number of jobs created during the period. The number of entries is high, but the bulk of them become exits. While small- and medium-sized enterprises (SMEs) are the main source of employment growth, large plants experience a negative net employment growth – but less so compared to micro-plants.
The second section of Table 2 shows that both large and small regions have experienced a substantial employment decline in manufacturing. However, the higher job destruction rate in the larger regions indicates the noticeable shift of manufacturing away from the larger cities. There is a very high rate of job creation at micro-plants due to new entries, accompanied by an even higher rate of job destruction due to exits; there seems to be an incentive for small start-ups in manufacturing, but a very low survival rate. As anticipated, KIBS experience a high rate of net employment growth but also the highest rate of gross employment flows. For this group, micro-plants contribute to a positive net employment growth, but it is the SMEs that are the dominant source of jobs and the large plants that have had the highest net developments since the 1990s.
To control for whether these processes are driven by specificities of the Swedish economy or are more general processes attributable to other economies, Table 3 shows the pairwise correlation coefficients for the main gross employment variables. The table shows a positive correlation between net and gross, but only at a 90% confidence level. This implies that even though this study is set in Sweden and looks at the whole economy, the same conclusions can be drawn as in Essletzbichler’s (2007) study of the UK. High turnover is not the most essential mechanism for net employment growth.
Correlations between regional components of employment change (N = 72 functional regions).
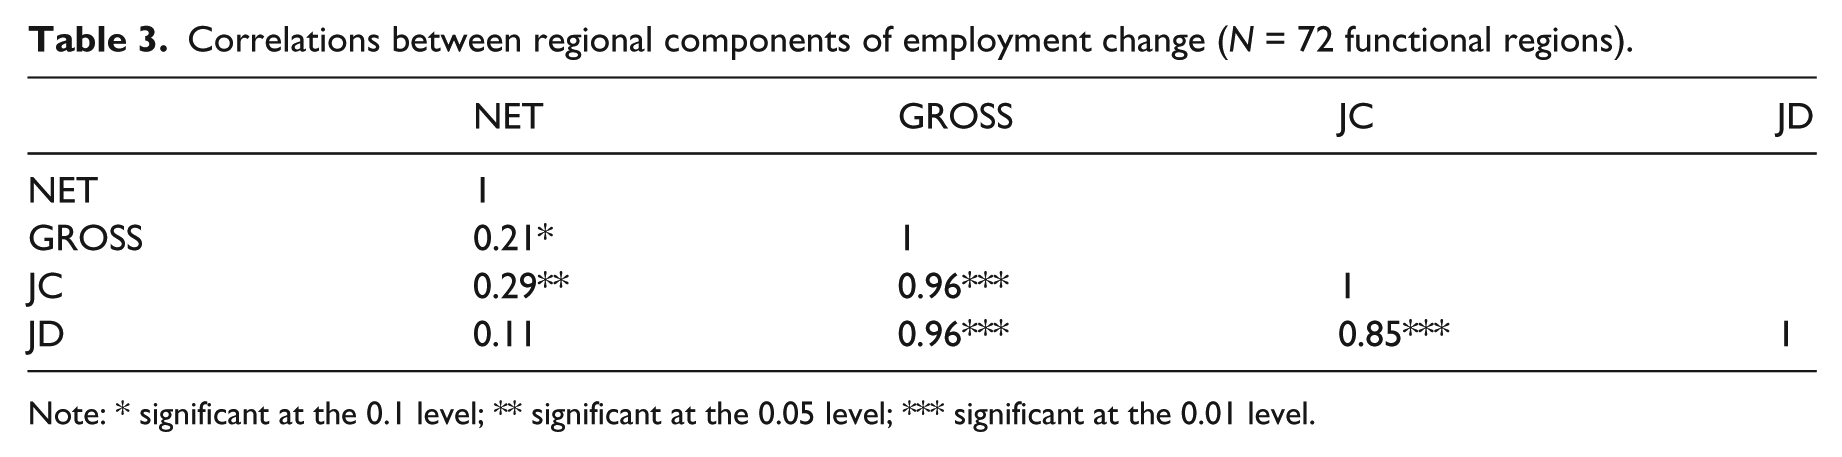
Note: * significant at the 0.1 level; ** significant at the 0.05 level; *** significant at the 0.01 level.
Diverse geographies of resilience
As we argue for the importance of understanding the dynamics of resilience in analysing the development of local economies (Boschma, 2015), we have plotted the period of crisis against recovery in Figure 2 (1990–1999) and Figure 3 (2000–2007). Similar to Martin (2012), the y-axis shows the resistance to the recession by comparing the employment rate at its very low point to its peak before the recession (1993 indexed on 1990; 2003 indexed on 2000). The x-axis shows the annual average growth in the period of recovery. The reference lines are the median for each axis for each time period. The further up a region scores on the
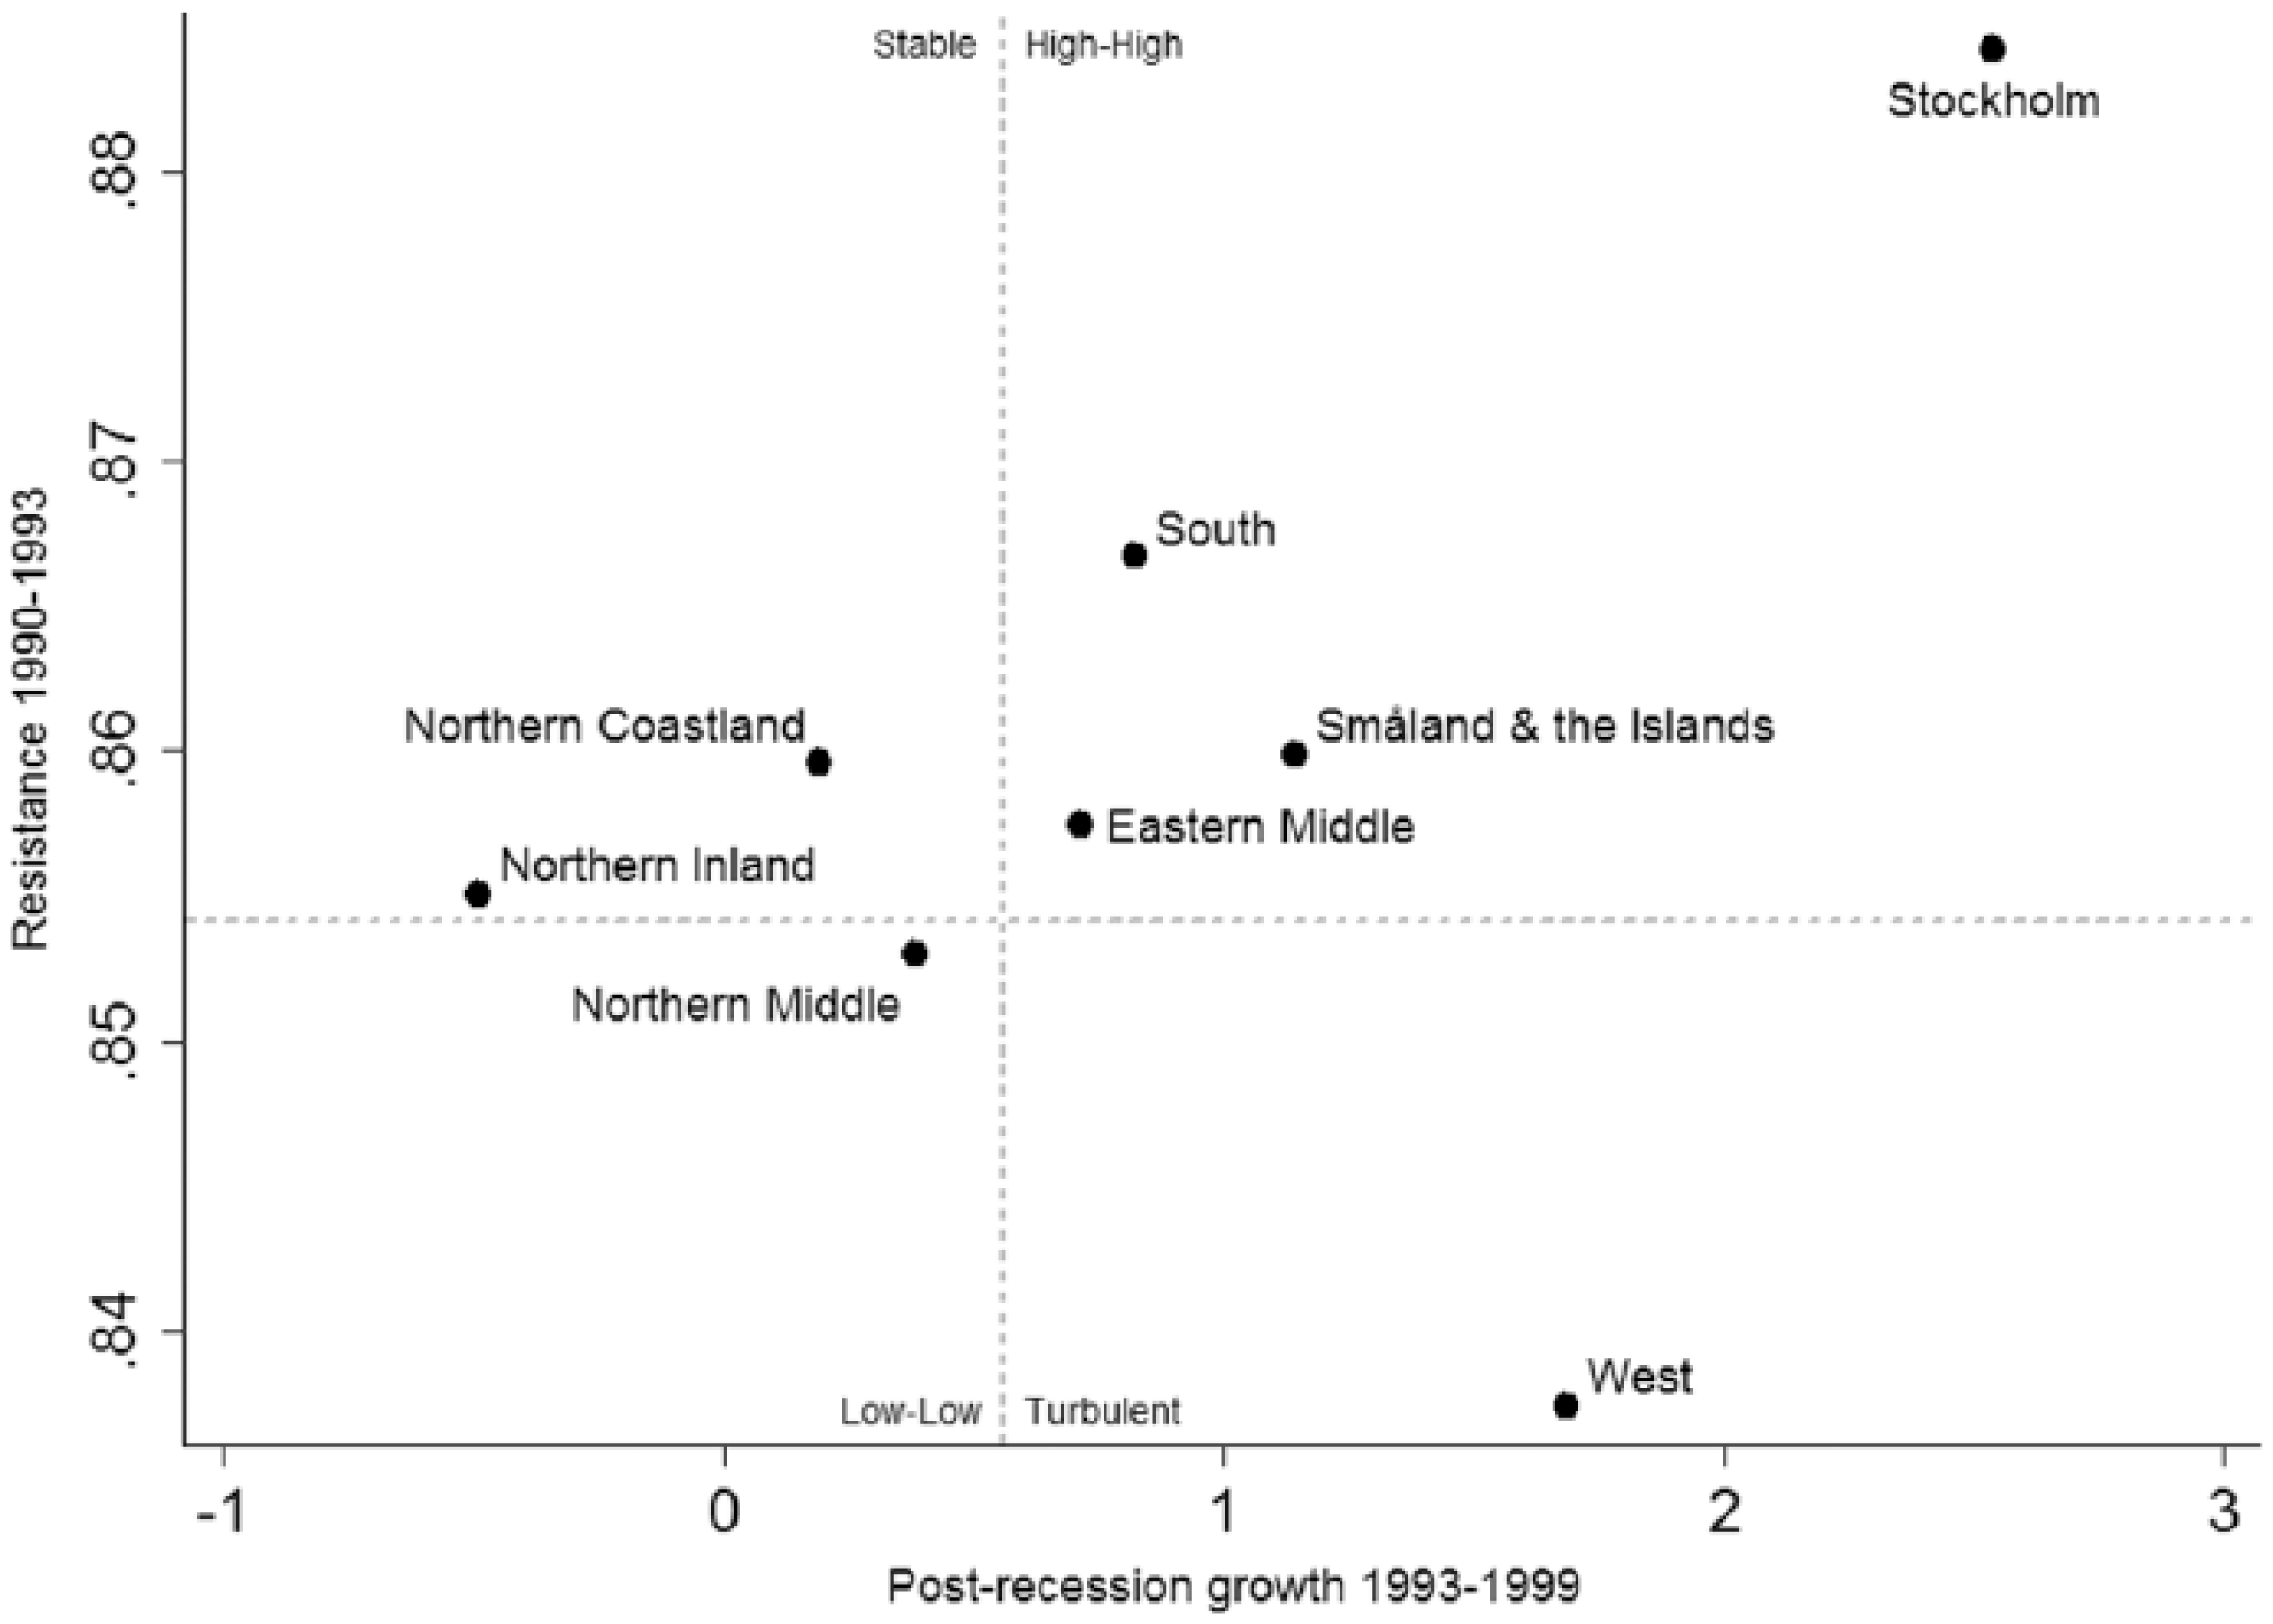
Resilience 1990–1999. Resistance on the y-axis and post-recession growth on the x-axis (N = 8 NUTS8 regions). Dotted lines indicate median value.
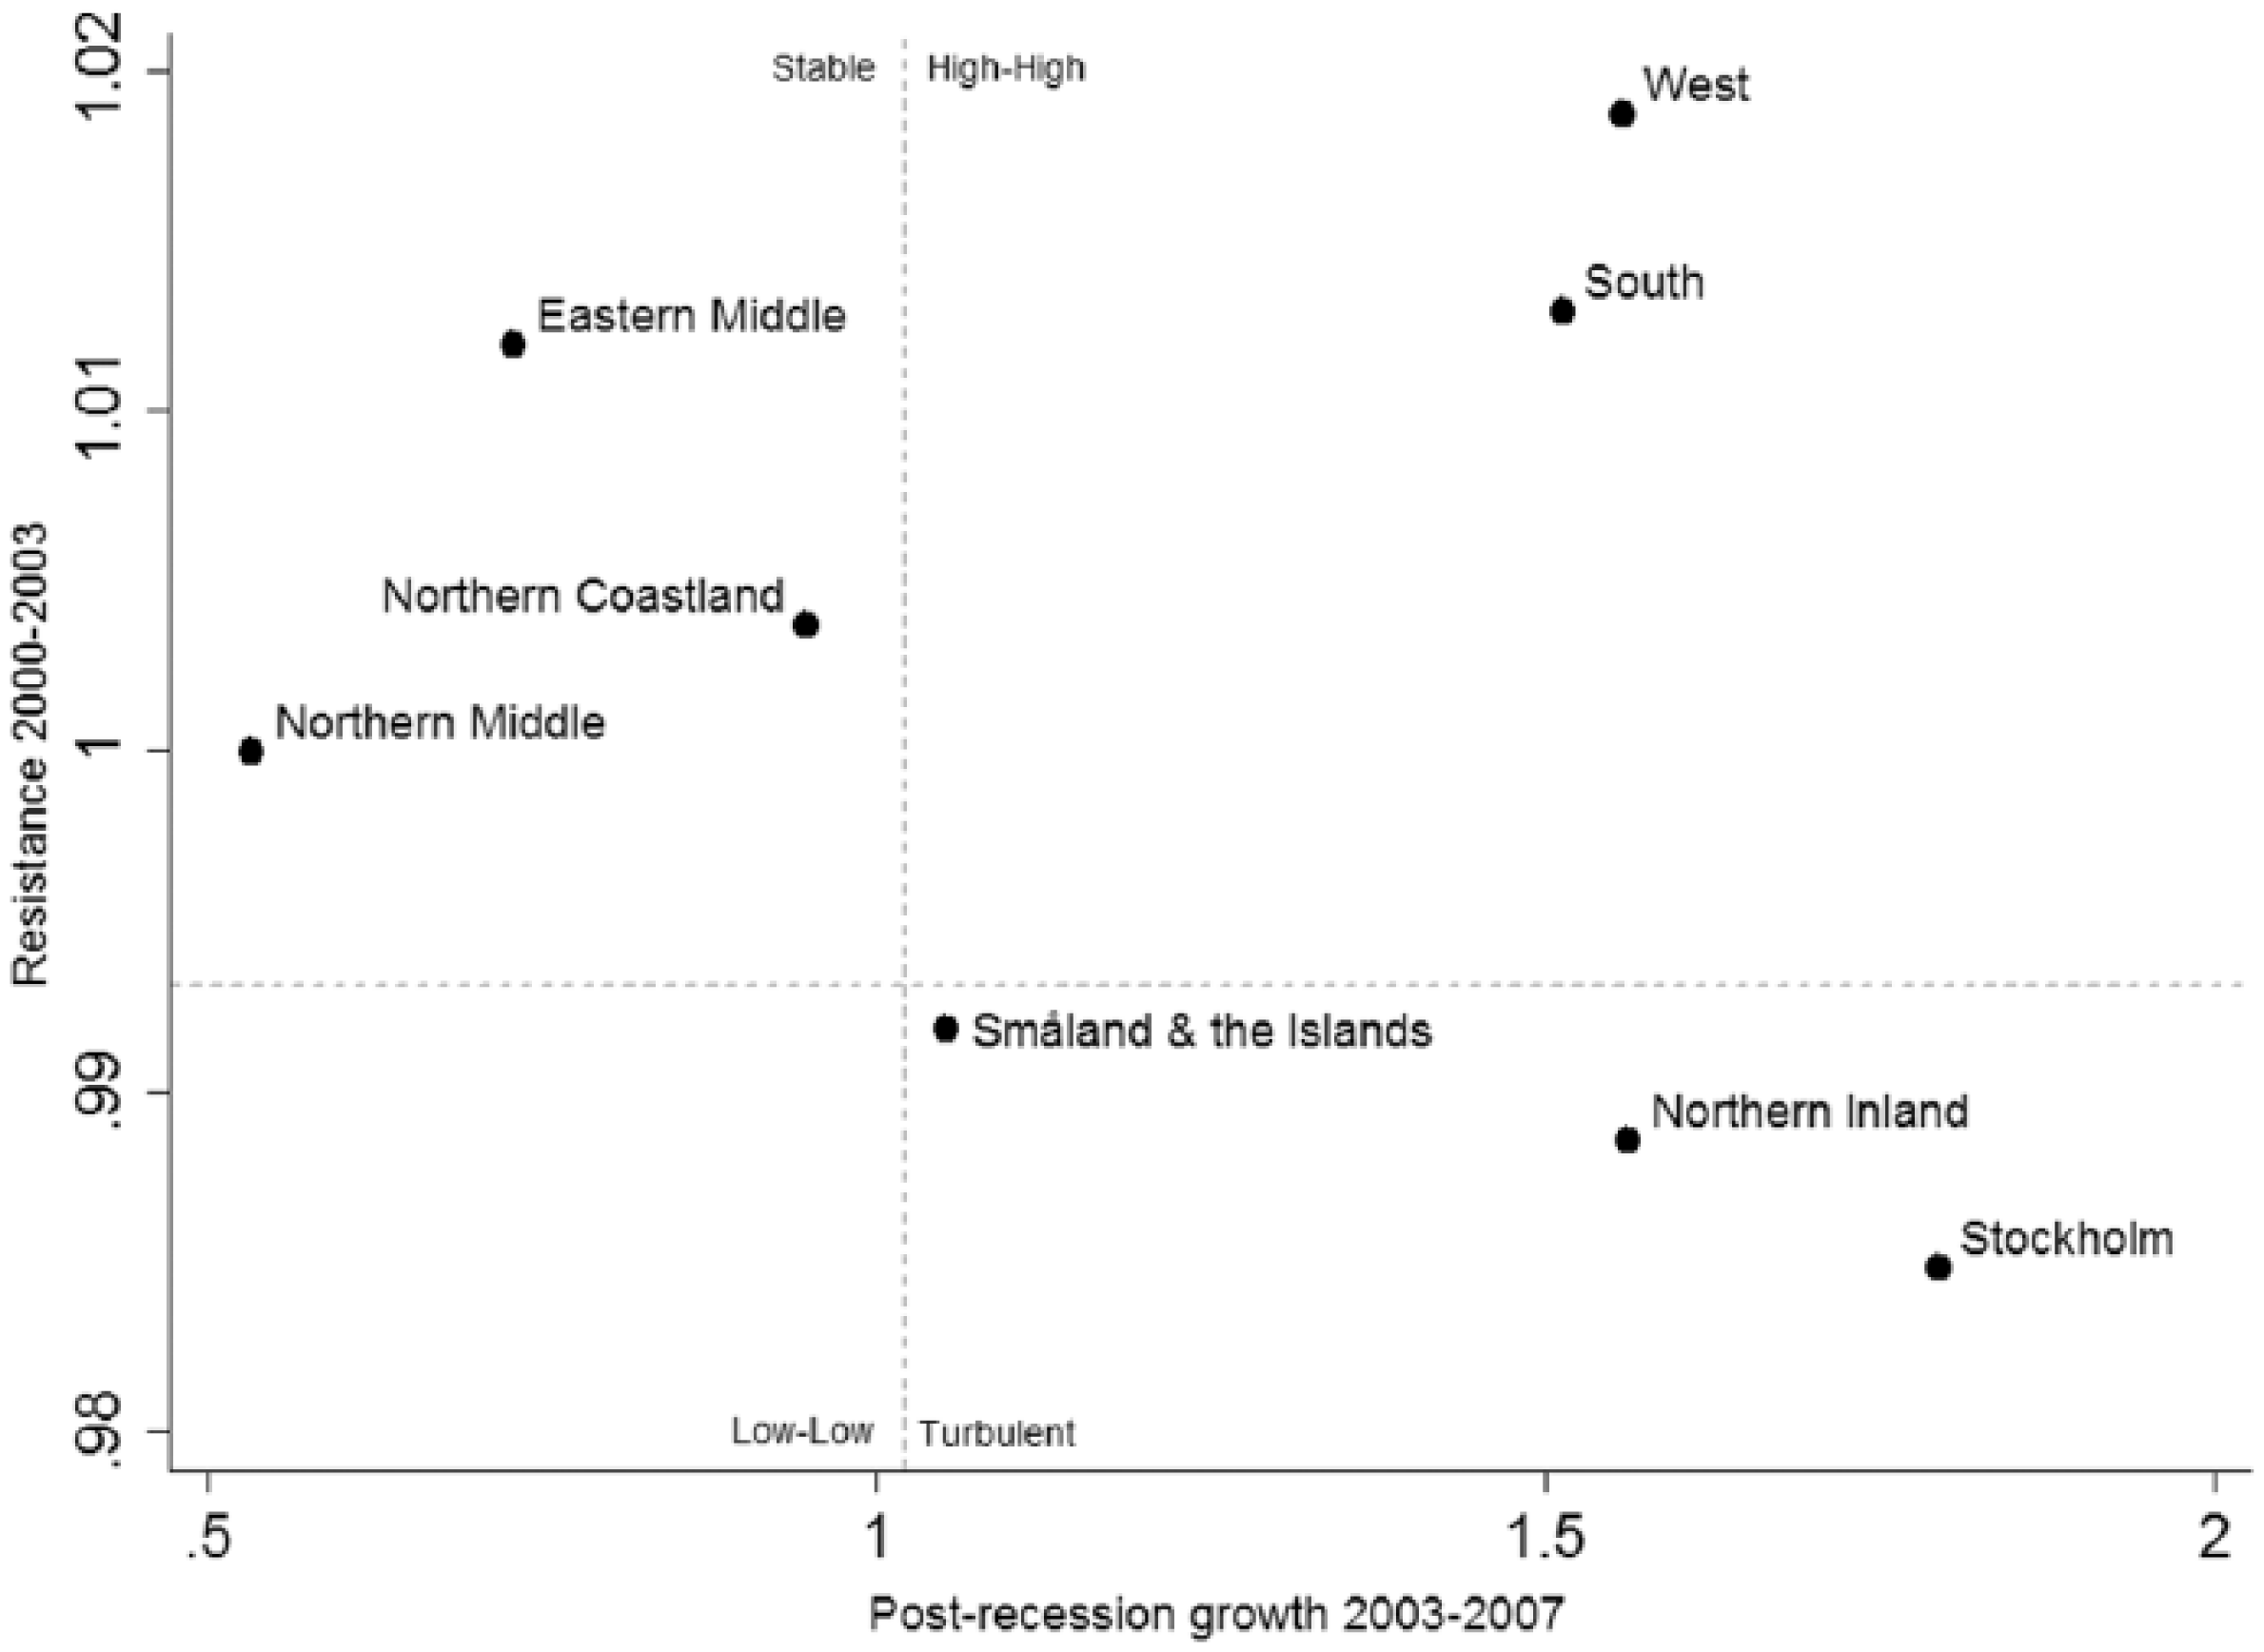
Resilience 2000–2007. Resistance on the y-axis and post-recession growth on the x-axis (N = 8 NUTS8 regions). Dotted lines indicate median value.
For the three metropolitan regions (Stockholm, South and West) the crisis of 1990 had very different effects. As shown in Figure 2, Stockholm was the most resilient region, with high resistance and post-recession growth. Region West enjoyed the second-best post-recession growth, but only after the most encompassing employment destruction. Of the metropolitan NUTS8 regions, South was the one with the lowest post-recession growth. These differences might be explained by the characteristics of their industry portfolios. While Stockholm had already started evolving from manufacturing to service, Gothenburg was still highly reliant on manufacturing and was therefore hit harder. The Malmö region was hit hard by the shipyard crisis of the 1980s and struggled for a long time to enter a new successful development path (Eriksson et al., 2014). For the other regions, the most noticeable finding is that all regions below the median in terms of post-recession growth are located in the northern part of Sweden, the less populous areas. As noted in previous studies (e.g., Lundquist et al., 2008), these findings point to the fact that the economic core regions have been more successful in rebounding from the crisis while the economic peripheries have faced greater difficulties, especially since less emphasis in policy circles has been on redistribution, with a preference for more supply-side policies aiming to increase the competitiveness of already strong industries and regions (cf. Bristow, 2010).
The crisis of 2000 (Figure 3) was a quite different recession, less encompassing and more targeted towards certain areas of the economy – IT, telecom and the financial sector (Doms, 2004). The higher median speaks to this, as does the fact that some of the regions actually have higher employment at what is supposed to be the ‘bottom’ of the recession. Neither South nor West was hit especially hard employment-wise, while Stockholm had a mirrored position to that in the 1990s crisis and is the least resistant region of all. One explanation for this is the agglomeration of sectors with crisis-specific vulnerability. The Northern Inland region is positioned at the bottom, but compared to its position during the first recession it experienced a notable post-recession growth. This could be a sign of breaking the negative employment trend or ‘path’ seen since 1990, also visible in Figure 1. The mining boom during the 2000s halted the negative employment trend in many local areas in the north (Knobblock and Pettersson, 2010), and could be a cause of the overall development changes.
Resistance and adaptability
There seem to be somewhat different reactions to the different recessions, as argued by, for example, Martin (2012), Pike et al. (2010) and Dawley et al. (2010). There are regions that have managed to stay on a successful path, like Stockholm, while others have shown indications of breaking a lock-in – that is, a negative trajectory – such as could be seen for the West in 1993 and the Northern Inland region in 2002. Others seem to be stuck in the status quo, like the Northern Middle region, which has seen only minor negative impacts from both recessions but shows no tendencies of growth (also see Figure 1). We claim that all these regions show different forms of resilience. Therefore, using the resilience scatterplot and the median divider we are able to define four different groups of regions that responded very differently to the crises. The two squares, or groups, in the upper half of Figures 2 and 3 are more resistant to crises, and would be defined as resilient in the more classical sense. The regions to the left have lower post-recession growth (Stable group), while those in the upper right corner experience high post-recession growth (High-High group). The two groups at the bottom half both experience low resistance to recessions, but while the regions in the left corner have low post-recession growth (Low-Low group), those in the right enjoy high post-recession growth (Turbulent group) and exhibit another form of resilience. Hence, by using the concepts of resistance and adaptability we end up with three different ways to look at resilience: resistant (Stable), adaptable (Turbulent) or both (High-High). However, the NUTS8 areas are large geographical units containing a diverse set of regions. Instead, we group FA regions according to how they are positioned in the resilience scatterplot. 3 As the median was used as divider, the different groups consist of more or less equal numbers of FA regions (see maps in the Appendix).
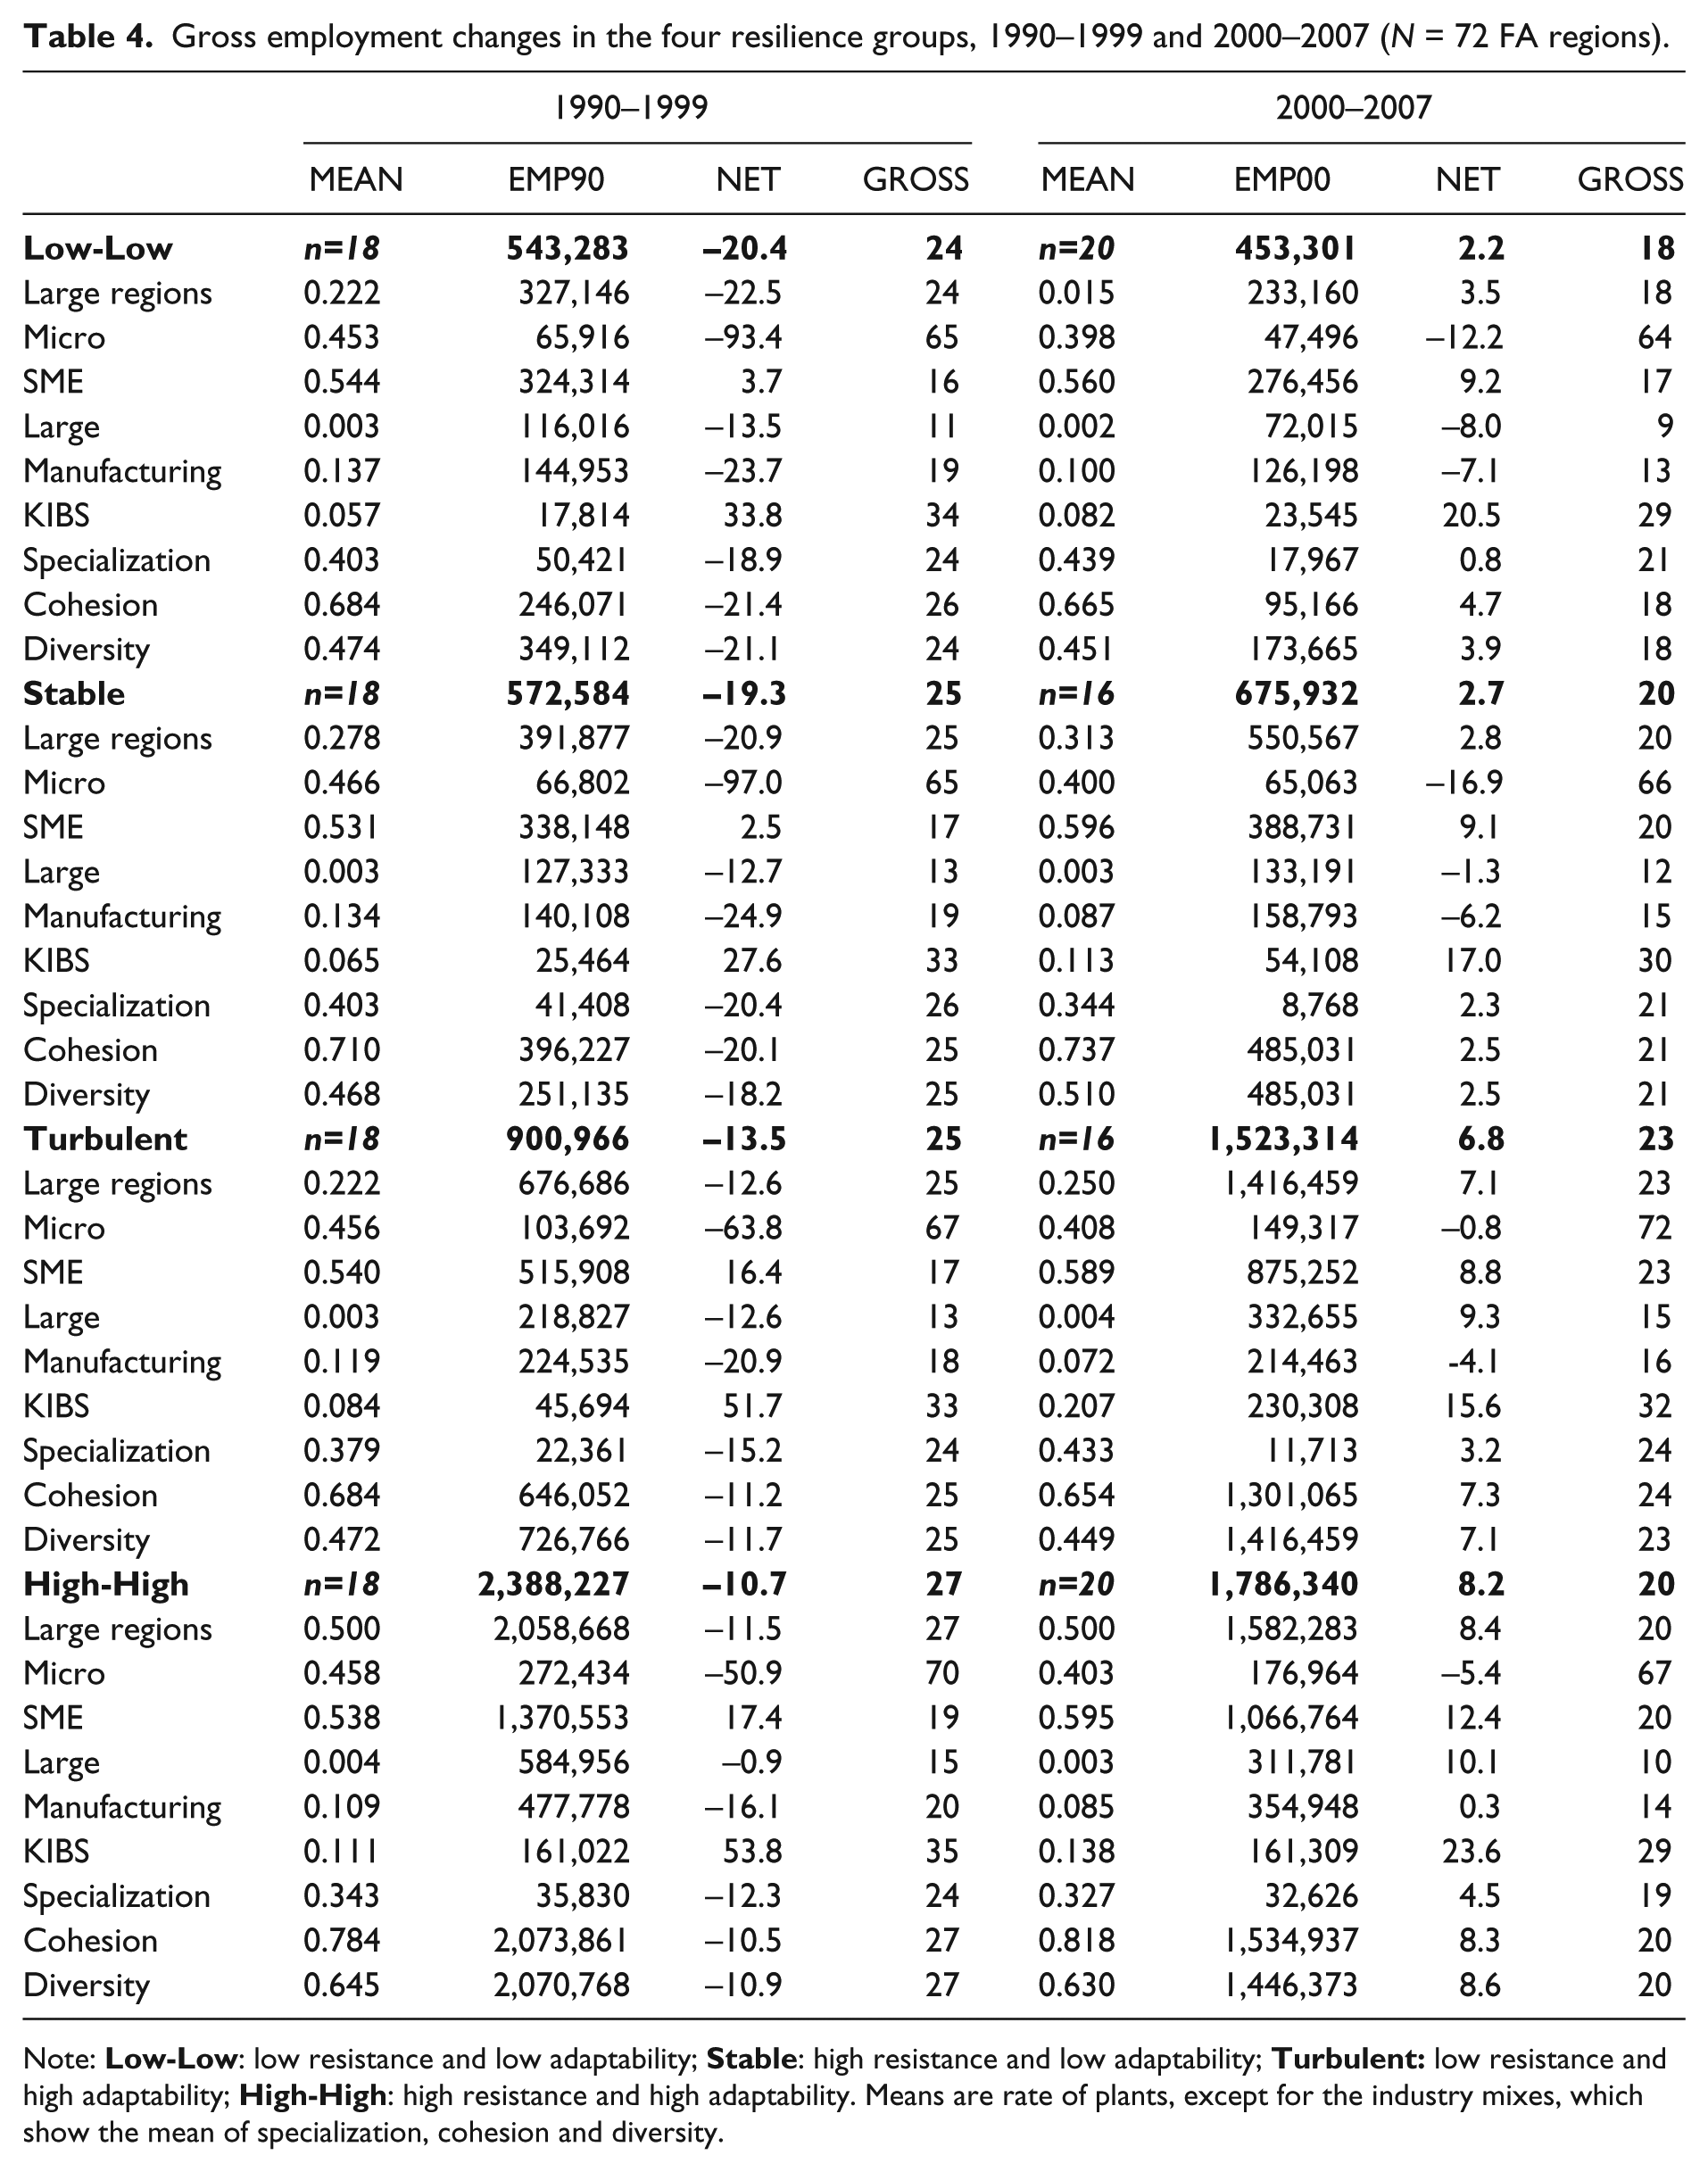
Table 4 displays information on the components of employment change in these different resilience groups for the two periods. To analyse how the more specialized, diverse and cohesive regions perform in terms of resilience, the top 25% in the whole country have been categorized as such. The figures on these are then included as separate rows in the resilience group where they end up in the crises. 4
Gross employment changes in the four resilience groups, 1990–1999 and 2000–2007 (N = 72 FA regions).
Note:
A couple of key features of the table should be highlighted. Firstly, the Low-Low and Turbulent groups, which exhibit low resistance, tend to be dominated by small regions, which implies that regional size seems to influence the degree of resilience (cf., Polèse, 2010). Secondly, the micro-plants for each group in both periods experience negative net employment, and the decline after the recession in 1990 is severe. In particular, the regions defined as the least resilient (Low-Low) are those that seem to have the highest rate of people employed at micro-plants in both periods. The SMEs are the ones that in each resilience group employ the most people in the starting year, and comprise the type of plants that are most resilient.
Thirdly, the type of sector is also related to regional resilience. In 1990, all regions experienced a severe decline in manufacturing, while KIBS had a positive net for both periods. The sector composition in the different resilience groups thus means that the impact on the regional economies is very different. Even though KIBS’ development is positive in each group, the two groups with high adaptability (Turbulent and High-High) have the highest rate of employees in KIBS, and also have the lowest in manufacturing for 2000. The Low-Low group is not only more dependent on the manufacturing sector, but also had a less resilient manufacturing sector in both crises. This is in line with Simmie and Martin (2010), who found that regions less successful in transforming their economy also are less resilient.
Fourthly, by comparing the means across groups it is possible to conclude that the least resilient regions (Low-Low) are the most specialized ones, while the most resistant ones (Stable and High-High) are more cohesive in their industry structure (i.e., a high degree of related industries). In particular, the most resilient regions (High-High) score the highest on both cohesion and diversity. These are crude figures and large heterogeneous groups, but our findings are however in line with the literature on industry mix and resilience. While specialization makes the region vulnerable, an industry mix of unrelated and related activities helps resist shocks and absorb redundant labour (Diodato and Weterings, 2015; Eriksson et al., 2014).
The path-dependency of regional resilience
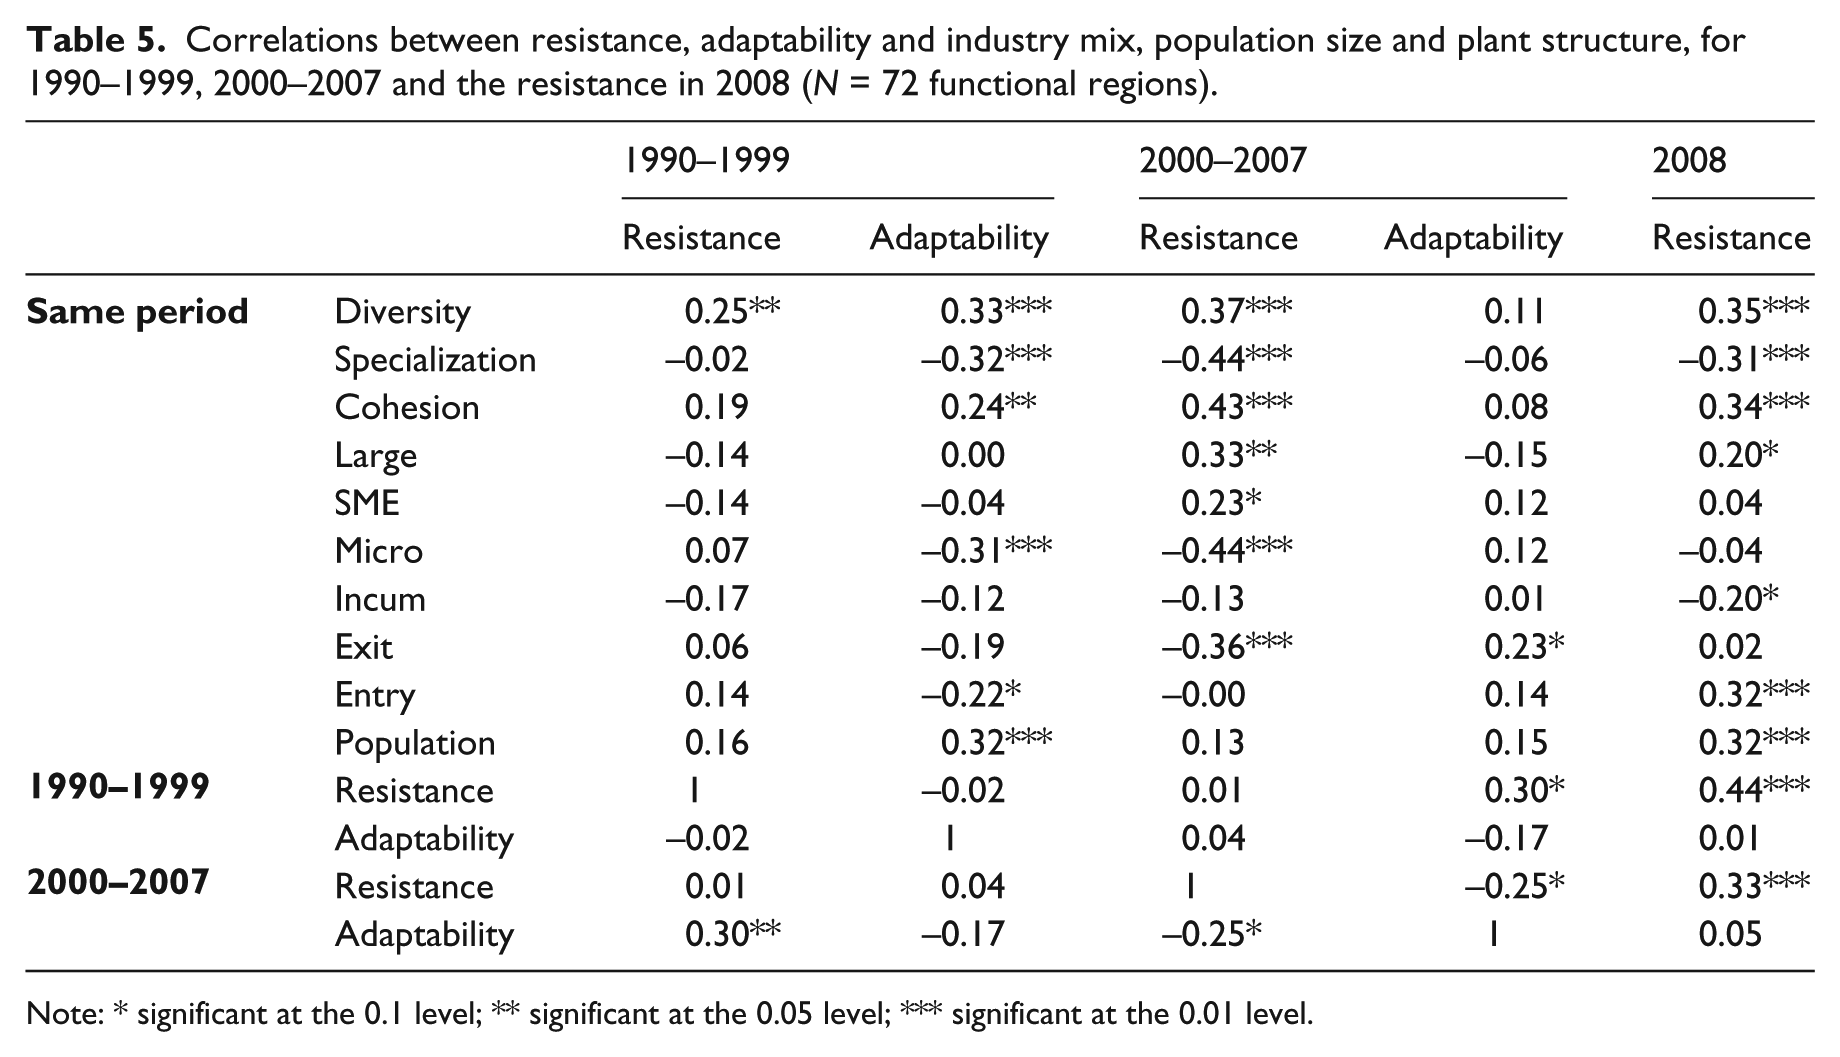
By adding a correlation table, we can further link the results on resilience with the micro-dynamics of gross employment flows. Table 5 shows the pairwise correlations between resistance and growth in 1990 and 2000, and each region’s industry mix as well as population size and plant structure. The available data make it possible to add also the first phase of the latest crisis (2008).
Correlations between resistance, adaptability and industry mix, population size and plant structure, for 1990–1999, 2000–2007 and the resistance in 2008 (N = 72 functional regions).
Note: * significant at the 0.1 level; ** significant at the 0.05 level; *** significant at the 0.01 level.
A couple of outcomes should be noted. Firstly, the industry mix of regions does influence both resistance and adaptability. It is only high diversity that can explain resistance in 1990, while growth in 1990 as well as resistance in 2000 and 2008 is positively correlated with both cohesion and diversity, and negatively associated with specialization. This confirms earlier studies (e.g., Boschma et al., 2014; Diodato and Weterings, 2015; Frenken et al., 2007) claiming that diversity generates portfolio effects that protect for unemployment, while specialization tends to be more sensitive to sticky unemployment.
Secondly, population size does indeed seem to matter when explaining resilience, but in contrast to previous research (c.f., Polèse, 2010) our findings show that size is not the sole explanation for resilience. While positively correlated with adaptability in 1990 and resistance in 2008, size per se is not the primary determinant, for two main reasons. Firstly, the correlation coefficient between adaptability in 1990 and resistance in 2008 is slightly higher for diversity (as well as for cohesion in 2008) than for population. Secondly, it could be argued that diversity is a function of size (i.e., larger regions are more diverse); however, this is not the case, since the correlation is about 0.56 between size and diversity and 0.55 between size and cohesion.
Thirdly, the structure of plants in regions influences employment developments. Micro-plants seem to be negatively associated with both adaptability (1990) and resistance (2000), while SMEs and large plants are positively correlated with resistance in 2000 and 2008 (large plants only). However, plant size has no relation to resistance in 1990, which points to the fact that this crisis was very widespread. We also find a pattern of vulnerability among micro-plants and high rates of start-ups, which lead to exits and employment decline. However, the resistance in 2008 is positively correlated with the rate of new entries, which might be due to the selectivity of the latest crisis, primarily affecting export-oriented sectors, while some industries and regions were largely unaffected.
Fourthly, the relationship between resistance and adaptability is far from straightforward. There is no significant correlation between resistance and adaptability in 1990. In 2000, however, there appears to be a negative correlation between resistance and growth, which could be due to the fact that the most resistant regions continued on the same development path while the larger ones that were hit relatively harder also managed to bounce back almost immediately. This finding confirms the literature arguing for the complex and different natures of the initial stage of resistance and the following period of adaptability (e.g., Boschma, 2015; Diodato and Weterings, 2015; Eriksson et al., 2014; Pike et al., 2010), and Pike et al. (2010) debating the necessity of understanding these differences when determining policy implementations. There is also no significant correlation between the resistance in 1990 and that in 2000, which confirms the different natures of the two crises. However, resistance to the latest crisis in 2008 has a positive significant correlation with both earlier periods of resistance – which could imply that the nature of the last recession shared common features with both prior ones. For example, it was all-encompassing like the crisis of 1990, but shared financial characteristics similar to the dotcom bubble.
Conclusions
The objective of this paper was to analyse how regional economies respond to crises. This was made possible by linking gross employment flows to the notion of regional resilience in Sweden from 1990 to 2010. We have thereby contributed with an analysis of gross employment flows of the whole economy, not only in manufacturing, as has been done in previous studies (e.g., Davis and Haltiwanger, 1999; Essletzbichler, 2007). Still, our results confirm previous findings from the USA and UK on the driving forces behind regional employment change, despite quite different institutional frameworks and the much more regulated labour market in Sweden. We find great regional disparities of net employment growth during the period studied, and also incremental changes in net employment concealing high levels of creation and destruction in both expanding and declining regions as well as sectors.
In particular, our results highlight that there does not seem to be a so-called ‘red tape’ limitation on new start-ups, but rather difficulty for new entrants and micro-plants to survive, which implies that such firms have a negligible effect on the employment in regions (Fritsch and Noseleit, 2013). Instead, incumbent plants, particularly SMEs and large plants, are the main source of employment growth. We can also show that the contribution to regional employment by micro-plants is not primarily a cyclical issue. It is negatively correlated with both the resistance in the crisis and the ability to adapt in the aftermath. There are also signs that a high level of new entries is not enough to secure a positive employment growth after crises, and at times it even has a negative effect on the ability to recover.
Further, apart from placing processes of gross employment flows in a temporal context, a key contribution of this paper is the finding on the impact of regional industry mix on resistance and adaptability. Compared to specialization, regional cohesiveness and diversity are beneficial characteristics for both resistance and adaptability. In fact, the composition of industries is the single most important driver not only for resisting shocks but also for adaptability, even compared to the impact of size per se. This runs counter to many dominating ideas on the role of size for sustaining resilience (e.g., Polèse, 2010), but is in line with notions stressing the portfolio effects of diversity compared to urbanization (e.g., Frenken et al., 2007) and the role of cohesiveness for regional renewal (Neffke et al., 2011). However, no previous study has explicitly been able to show this in relation to resistance and adaptability. It is notable that one of the major differences between adaptive and less adaptive regions is how well the region manages to transform from manufacturing towards a ‘learning economy’.
This adaptability seems to be closely related to the position within the regional hierarchy. In line with increasing focus on supply-side policies (Bristow, 2010), peripheral regions have been encouraged to focus on comparative advantages, which have lead to a specialization in primarily manufacturing but also service sectors, such as tourism, since many small and peripheral regions face difficulties attracting high-end investments. Rather than strengthening these regions, this has lead to increased volatility. Specialization in combination with a small population size decreases the resilience of regions. Instead, our study indicates that it is only the largest and/or most diversified regions that enjoy stable job creation. In combination with a continuous dismantling of the manufacturing sectors and a further focus in policy circles on knowledge-intensive services – that tend to agglomerate in large regional centres due to localization economies and diversity of local markets (Eriksson and Hansen, 2013) – this may lead to a deepning of spatial divisions characterized by even greater regional disparities.
Even so, regional development trajectories are diverse and the ability to absorb shocks and develop new growth paths is greatly dependent on the internal structure of regional economies. By explicitly focusing on the micro-dynamics of regions, rather than aggregates as in previous studies (e.g., Martin, 2012), we find that the industry mix and the composition of plants influence the resilience of regions in diverse ways. The study also shows that it is important to understand resilience as a dynamic and path-dependent phenomenon. If a region is able to resist previous shocks its likelihood of absorbing future shocks is higher. In the macro-economic recession, it is also evident that what was needed in the regional resistance in the initial phase did not involve the same characteristics as those needed to be able to adapt and renew the economy in the later growth phase. We did, however, not find a clear trade-off between the regional ability to be resistant and adaptable since that depends on the spatial and temporal context.
The broader implication of this study is that policies aiming for development based on the assumed traits of specialization, entrepreneurs and new start-ups may benefit some regions at the expense of others. Due to high levels of turnover, a continuously changing economy and the present development towards a more knowledge-intensive labour demand, increasing the supply of generic education among the workforce would benefit both the individuals and the region. Policies should also aim at fostering local institutions and support systems to increase the survival rate of start-ups, rather than supporting start-ups per se, as well as encourage related diversification to introduce further (related) variety in, particularly, small regions.
By grouping regions together we gained knowledge of the overall trends, but may have lost a deeper understanding of the diversity and particularities of each region. Future studies could certainly pay more attention to processes at a more local level, and further analyse individual outcomes in relation to the different phases of resilience. Given the indications presented here it would be interesting to gain further understanding of the extent to which related variety and unrelated variety may influence the creation and destruction of jobs, and their effects on the resilience of regions, especially given the role of relatedness in regional branching processes (Neffke et al., 2011). It is also important to acknowledge that it is not only a question of the creation of jobs, but also of the quality of those created and the potential to match regional labour supply and demand. A high turnover may not imply high quality for an employee who needs to rely on short-term contracts.
Footnotes
Appendix
Acknowledgements
The authors are grateful for the comments by Ron Boschma, Urban Lindgren, David Rigby and Anet Weterings on previous versions of this paper. The authors would also like to thank two anonymous reviewers whose comments substantially improved this paper. Any remaining errors are the responsibility of the authors. Financed by the Swedish Research Council for Health, Working Life and Welfare (Forte), grant number 2013-1313
Declaration of Conflicting Interests
The author(s) declared no potential conflicts of interest with respect to the research, authorship, and/or publication of this article.
Funding
The author(s) received no financial support for the research, authorship, and/or publication of this article.