
Abstract
Objectives
Designing cancer screening trials for multi-cancer early detection (MCED) tests presents a significant methodology challenge, as natural histories of cell-free DNA-shedding cancers are not yet known. A microsimulation model was developed to project the performance and utility of an MCED test in cancer screening trials.
Methods
Individual natural history of preclinical progression through cancer stages for 23 cancer classes was simulated by a stage-transition model under a broad range of cancer latency parameters. Cancer incidences and stage distributions at clinical presentation in simulated trials were set to match the data from Surveillance, Epidemiology, and End Results program. One or multiple rounds of annual screening using a targeted methylation-based MCED test (Galleri
Results
In simulated trials, accounting for healthy volunteer effect and varying test sensitivity, positive predictive value in the prevalence screening round reached 48% to 61% in 6 natural history scenarios. After 3 rounds of annual screening, the cumulative proportions of stage I/II cancers increased by approximately 9% to 14%, the incidence of stage IV cancers was reduced by 37% to 46%, the reduction of stages III and IV cancer incidences was 9% to 24%, and the reduction of mortality reached 13% to 16%. Greater reductions of late-stage cancers and cancer mortality were achieved by five rounds of MCED screening.
Conclusions
Simulation results guide trial design and suggest that adding this MCED test to routine screening in the United States may shift cancer detection to earlier stages, and potentially save lives.
Keywords
Introduction
In the United States, screening tests are available for just five cancers: colorectal, breast, lung in high-risk individuals, cervical, and prostate cancer on an individual basis.1–5 For many other cancers, single-organ cancer screening in the general population is not cost-effective because of low incidence and/or lack of an appropriate test. Yet, in 2020, approximately 76% of estimated cancer-related deaths in the US population aged 50–79 were from cancers without population screening programs. 6
Significant progress has been made recently to develop blood-based, multi-cancer early detection (MCED) tests, with some tests utilizing features of cell-free DNA (cfDNA), such as cancer methylation signatures or fragmentation patterns.7–10 The performance of these MCED tests has been evaluated in retrospectively identified cancers and controls. For example, one MCED test (Galleri
Development of a biomarker for cancer screening is a lengthy endeavor. The Early Detection Research Network has proposed a five-phase pipeline to facilitate the development of screening tools for early cancer detection. 12 In “phases 1–3” studies, a biomarker is developed and evaluated in retrospective studies; “phases 4–5” prospective studies will then be conducted to investigate feasibility, clinical utility, and potential harms in an asymptomatic, intent-to-screen population. Compared to single-cancer screening modalities, diagnostic resolution of an MCED test positive result (“cancer signal detected”) is more challenging due to the complexity of determining the cancer signal origin. Therefore, the goal of a “phase 4” MCED study is to evaluate the feasibility, effectiveness, and safety of diagnostic work-up procedures. Other endpoints include positive predictive value (PPV) in a screening population, characteristics of screen-detected cancers, and impact of negative MCED test results on participants’ adherence to existing cancer screening programs. Examples of “phase 4 studies” include PATHFINDER (NCT04241796) and PATHFINDER 2 (NCT05155605).13,14
Ultimately, the gold-standard design for evaluating clinical utility of a cancer early detection test is the randomized controlled trial (RCT) with a cancer-specific mortality endpoint (“phase 5” study). However, a cancer-specific mortality endpoint requires a large trial population and many years, often over a decade of follow-up, as observed in previous clinical utility trials for cancer screening.15–17 In lieu of the long trial duration needed for a cancer-specific mortality endpoint, reduction of late-stage cancers has been proposed as a clinically meaningful surrogate endpoint for an early evaluation of clinical benefit in breast and colorectal cancer screening trials.18–20 Recently, the proportion of early-stage cancers was used as the primary endpoint for the Early Detection Initiative trial for pancreatic cancer screening. 21 The NHS-Galleri trial (ISRCTN91431511) was designed to detect a significant reduction in the incidence rate of late-stage (stages III and IV) cancers targeted by GalleriⓇ. 22
The design of an MCED screening trial presents significant methodological challenges because the performance and utility of an MCED test in a screening population depend on the natural history of cfDNA-shedding cancers, which are unknown. Specifically, sojourn time—the length of a cancer's preclinical detectable period—has not been studied for MCED-detectable cancers. Existing knowledge of the natural histories for a few cancers was obtained through single-cancer screening studies, examining the numbers of screen-detected cancers and interval cancers missed by screening. 23 Few studies have reported sojourn times by cancer stage,24,25 which, as we show in this work, will dictate the degree of stage shift triggered by early detection. While there are mathematical formulas for determining sample size for an RCT with cancer mortality as the primary endpoint,26–29 it is difficult to determine the timing of mortality analysis: depending on natural history and frequency of screening, mortality reduction typically appears after a delay and eventually dissipates after screening stops.30,31
In this article, we propose a microsimulation model, coupled with a broad spectrum of preclinical latency scenarios to enhance robustness, for planning a screening study for the Galleri
Methods
Natural history of 23 cancer classes and stage-specific sojourn times
We define 23 stageable cancer classes, with additional refinement into subtypes for breast (hormone receptor HR+, HR−, and HR unknown) and lung (adenocarcinoma, squamous cell carcinoma, small cell, and all other) cancers using ICD-O-3 site and histology code definitions (Supplemental Table S1). Cancer stages were categorized according to the American Joint Committee on Cancer (6th edition) as I, II, III, or IV. Individual cancer progression trajectories through stages were characterized by a state-transition model (Figure 1(a)). The time span a preclinical cancer would stay in a stage before progressing to the next more-advanced stage was defined as stage-specific dwell time. 34
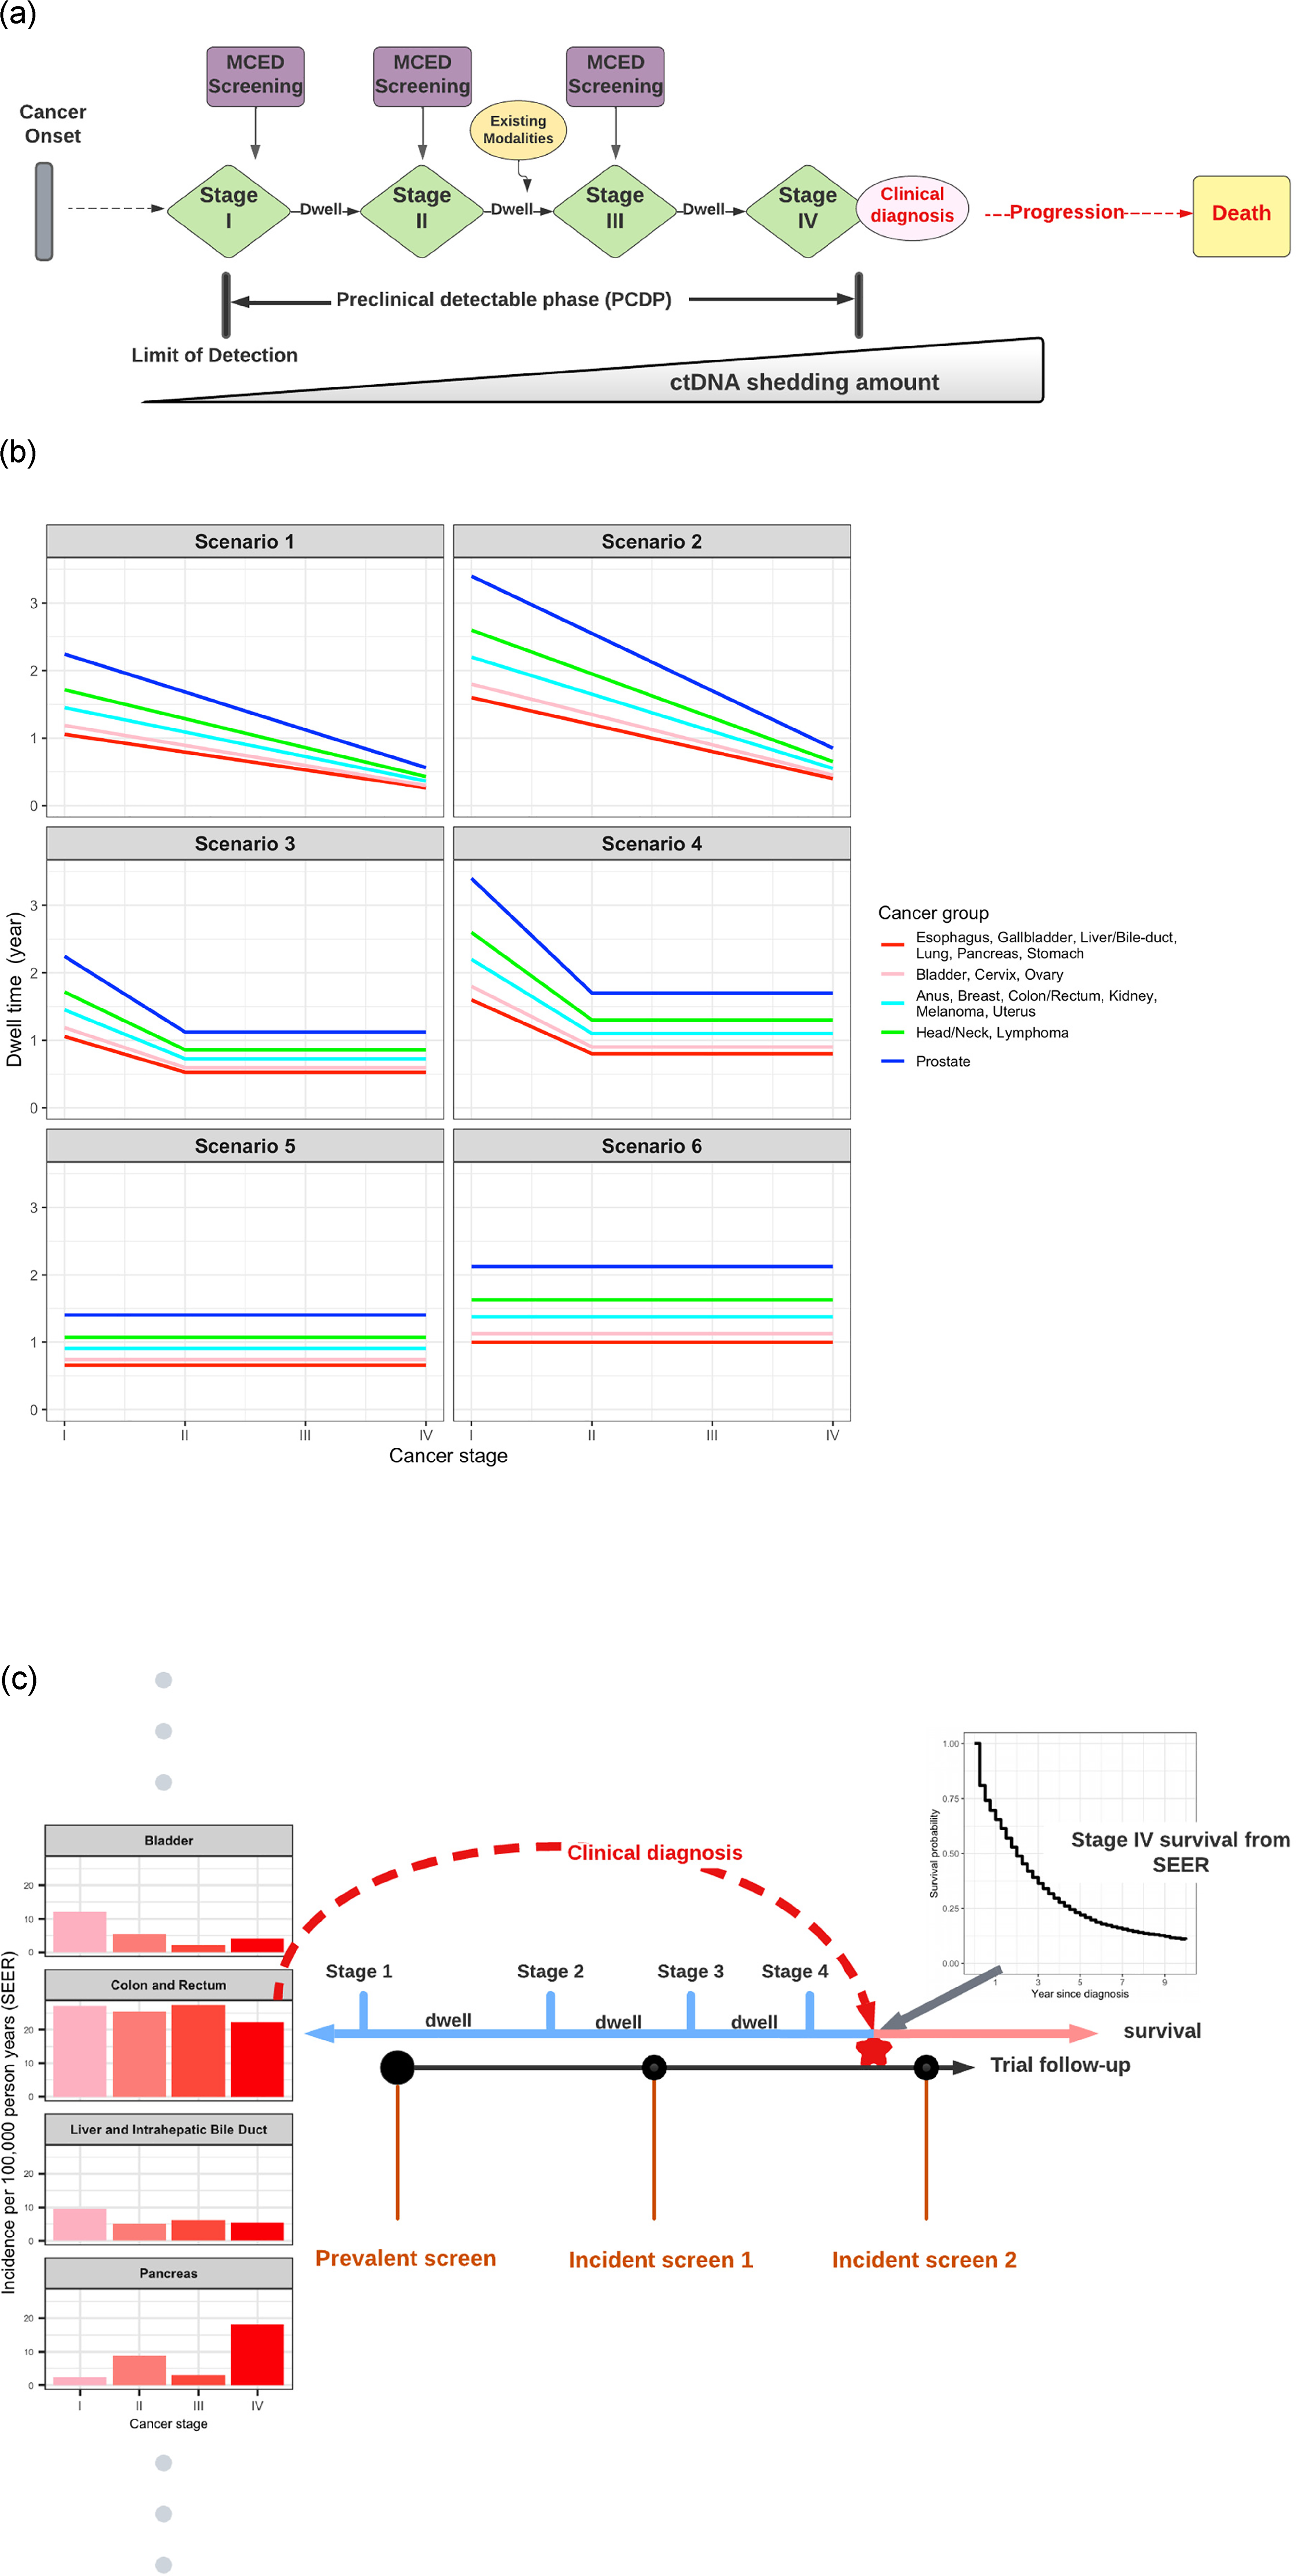
Microsimulation model for simulating cancer natural history and MCED. (a) An illustration of the natural history of a clinically diagnosed stage IV cancer and hypothetical MCED screening based on cfDNA shedding. Note that clinical symptoms can arise at any stage, but are most likely at later stages, particularly stage IV. (b) Six scenarios of dwell time by cancer stage. Cancers are combined into five groups based on SEER survival probabilities (Figure S1 in Supplemental material). The first two scenarios represent faster progression in later stages; the middle two scenarios have a longer dwell time for stage I but equal dwell times for stages II, III, and IV; the last two scenarios have equal dwell times in all four stages. (c) Mechanics of simulating cancer natural history and the MCED screening schedule. The time of clinically diagnosed cancer at a particular stage is first generated from SEER cancer incidence and stage distribution. The times for preclinical cancer stages were determined by back subtracting the hypothesized dwell times illustrated in (b). Survival and mortality were simulated from SEER survival data. Prevalence and incidence screening schedules were subsequently superimposed on the cancer natural history. cfDNA: cell-free DNA; MCED: multi-cancer early detection; SEER: Surveillance, Epidemiology, and End Results.
Because of the lack of knowledge on the natural histories of many cancers, including cfDNA-shedding cancers, we cast a wide net on potentially plausible sojourn time scenarios (Figure 1(b)). In a previous work, 34 three sets of hypothetical tumor growth scenarios were constructed to define mean dwell time per cancer type and stage. These scenarios assume shorter mean dwell times in more advanced stages, reflecting the common view of accelerated late-stage cancer growth. In this work, we expand plausible dwell time scenarios, now including the possibility that dwell times may not accelerate in later stages. Figure 1(b) shows graphically the dwell time at each stage for 23 cancer classes (also shown numerically in Supplemental Table S2), clustered into five groups based on their survival probabilities (Supplemental Figure S1). In scenarios 1 and 2, dwell time shortens with the progressing stage, representing the conventional understanding of cancer progression. In scenarios 3 and 4, dwell time decreases from stages I to II, then remains constant for stages II, III, and IV. This pattern of dwell time by cancer stage is motivated by the literature on lung and colorectal cancers.24,25 Further information on constructing these dwell time scenarios and additional scenarios is included in the Supplemental material (Figure S3 and Table S5). In scenarios 5 and 6, dwell times remain equal across four stages, which may be less plausible but of interest for testing the model's robustness.
Figure 1(c) shows an illustrative example of simulating the natural history of a stage IV cancer at clinical diagnosis. After enrollment, each individual received a time of cancer diagnosis that follows an exponential distribution. The mean rate of the diagnosed cancer for each cancer type and stage was set to be the corresponding cancer incidence in Surveillance, Epidemiology, and End Results (SEER) data for the population aged 50–79 years when diagnosed with invasive primary cancer from 2006 to 2015. The simulation accounted for the healthy volunteer effect commonly observed in cancer screening trials, 35 by applying a pre-specified percentage of reduction to the SEER cancer incidence rates. For all simulated trials in this article, we used a 15% reduction of the cancer incidences to model the healthy volunteer effect. This level of healthy volunteer effect was observed in the first 4 years of the Prostate, Lung, Colorectal, and Ovarian Cancer Screening Trial. 35 The preclinical natural history was connected to the time of clinical diagnosis in a backward fashion: the time a preclinical cancer dwelled at the stage of clinical diagnosis before clinical detection was drawn randomly from the uniform distribution; then the dwell time of each preclinical cancer stage was sequentially generated from an exponential distribution at each cancer stage (Figure 1(c)). This backward simulation strategy is similar to a microsimulation model for ovarian cancer screening. 36 From clinical diagnosis, survival and mortality were simulated for each individual by sampling the empirical cancer type and stage-specific survival probabilities from SEER.
Screening the study population prospectively by the MCED test
As illustrated in Figure 1(a), a preclinical invasive cancer sheds cfDNA into blood, which becomes detectable by the MCED test during the preclinical detectable phase. Screening by MCED test can be a one-time blood draw, or several rounds of annual blood draws to assess the cumulative effect of a screening program. In the microsimulation, a key assumption was that a cancer detectable at a certain stage will also be detectable at a more advanced stage, whereas a cancer that is undetectable at a certain stage is undetectable at all earlier stages, reflecting that cfDNA shedding amount increases by cancer stage.
MCED test sensitivity by cancer type and stage and an overall specificity were estimated using data from the case-control Circulating Cell-free Genome Atlas (CCGA; NCT02889978) study. 9 The simulation program can apply a prespecified percentage reduction (e.g. 15% reduction for all trials simulated in this article) to the CCGA-derived sensitivity to reflect the potentially decreased sensitivity when detecting preclinical cancers in an asymptomatic population. A 15% to 20% reduction in test sensitivity is a conservative estimate for screening preclinical cancers; although this is pending confirmation by screening trial data. The overall specificity across all cancer types and stages was set to be 99.5%. We did not model the diagnostic journey, and assumed the diagnostic workup for each positive test result either resulted in a definitive resolution of cancer or a false positive.
We used a stage-shift model to attribute improved survival to screen detection at a stage earlier than clinical diagnosis37–39 for a fraction of participants. Cancer survival time after MCED test detection was added to the original clinical diagnosis time to avoid lead-time bias and the implausible result of worse survival by screening, using the stage at the time of detection by MCED test and the corresponding stage-specific survival probabilities extracted from SEER. We also modeled worse stage-specific survival among MCED-positive participants compared to MCED-negative participants (Supplemental material, Figure S4). 40
Validation of the modeling approach
Our microsimulation model was validated by simulating lung cancer data from the National Lung Screening Trial (NLST) and comparing it to the published data on lung cancer stages. 15 The estimated stage-specific natural history parameters and sensitivity for low-dose computed tomography (LDCT) were obtained from previous modeling work. 25 Using the cancer incidence and stage distribution in the control arm of the NLST, simulated trials yielded stage distribution in the LDCT arm consistent with the reported distribution: simulated stages I–IV proportions were 46%, 8%, 24%, and 23%, while observed stages I–IV proportions were 50%, 7.1%, 21.2%, and 21.7%. The reduction of stage III/IV lung cancers in simulated trials was 18%, close to the observed 20% reduction in NLST. Further details are provided in Supplemental material.
Computation and algorithm implementation
The proposed simulation model was executed by the computationally efficient programming language, Julia, which affords both speed and straightforward parallelization for a prospective screening study with a large sample size. 41 One thousand simulated trials were generated in parallel on an Amazon EC2 M5 Instance. Trial endpoints for hypothetical trials were summarized and details are provided in Supplemental material.
Code/data availability
Requests for code and data should be emailed to jdai@grailbio.com.
Results
Hypothetical phase 4 prospective single-arm study: Evaluating safety and performance of an MCED test in an asymptomatic screening population
When evaluating an MCED test in an asymptomatic US population aged 50 years or older, a test positive result (“cancer signal detected”) would trigger a diagnostic work-up pathway, which could include imaging and invasive biopsy procedures. Therefore, the primary safety endpoints would be the number and the type of invasive procedures performed among false positive participants. Regulatory agencies might require a minimal number of MCED test positive (“cancer signal detected”) results returned to healthcare providers to evaluate the safety of MCED screening, which would have implications for the sample size of a phase 4 trial.
MCED performance metrics in a prospective asymptomatic population would be evaluated as co-primary endpoints, including PPV and cancer detection rate (CDR; the proportion of screened participants who receive a test positive result and are diagnosed with cancer). Other performance metrics, such as sensitivity, specificity, and negative predictive value, could not be directly evaluated because diagnostic workup would only be triggered for MCED test positives, and MCED test negatives could not be determined to be false negatives or true negatives.
Table 1 shows a summary of the key endpoints for the MCED test in a hypothetical prospective screening study with 20,000 participants. There was a prevalence screening round followed by two annual incidence screening rounds. In 1000 simulated datasets and across six different dwell time scenarios, accounting for the healthy volunteer effect and 15% reduced test sensitivity in a screening population, PPV estimates in the prevalence round ranged from 48.3% to 60.6%. The PPV estimates in the incidence rounds were lower (31.7%–34% for the first incidence round and 30.1%–32.7% for the second incidence round), reflecting the lowered rate of cancers after the prevalence round. Similarly, the number of test positives and CDR both decreased after prevalence screening. Across the six dwell time scenarios, we observed that the number of test positives, PPV, and CDR increased with the overall sojourn time, since a longer preclinical latency would increase the chance of a preclinical cancer being detected in a prevalence screen. The relative length of stage-specific dwell time had a minor effect on these endpoints.
Summary of key endpoints and performance metrics for an MCED test in simulated prevalence screening and incidence screening.
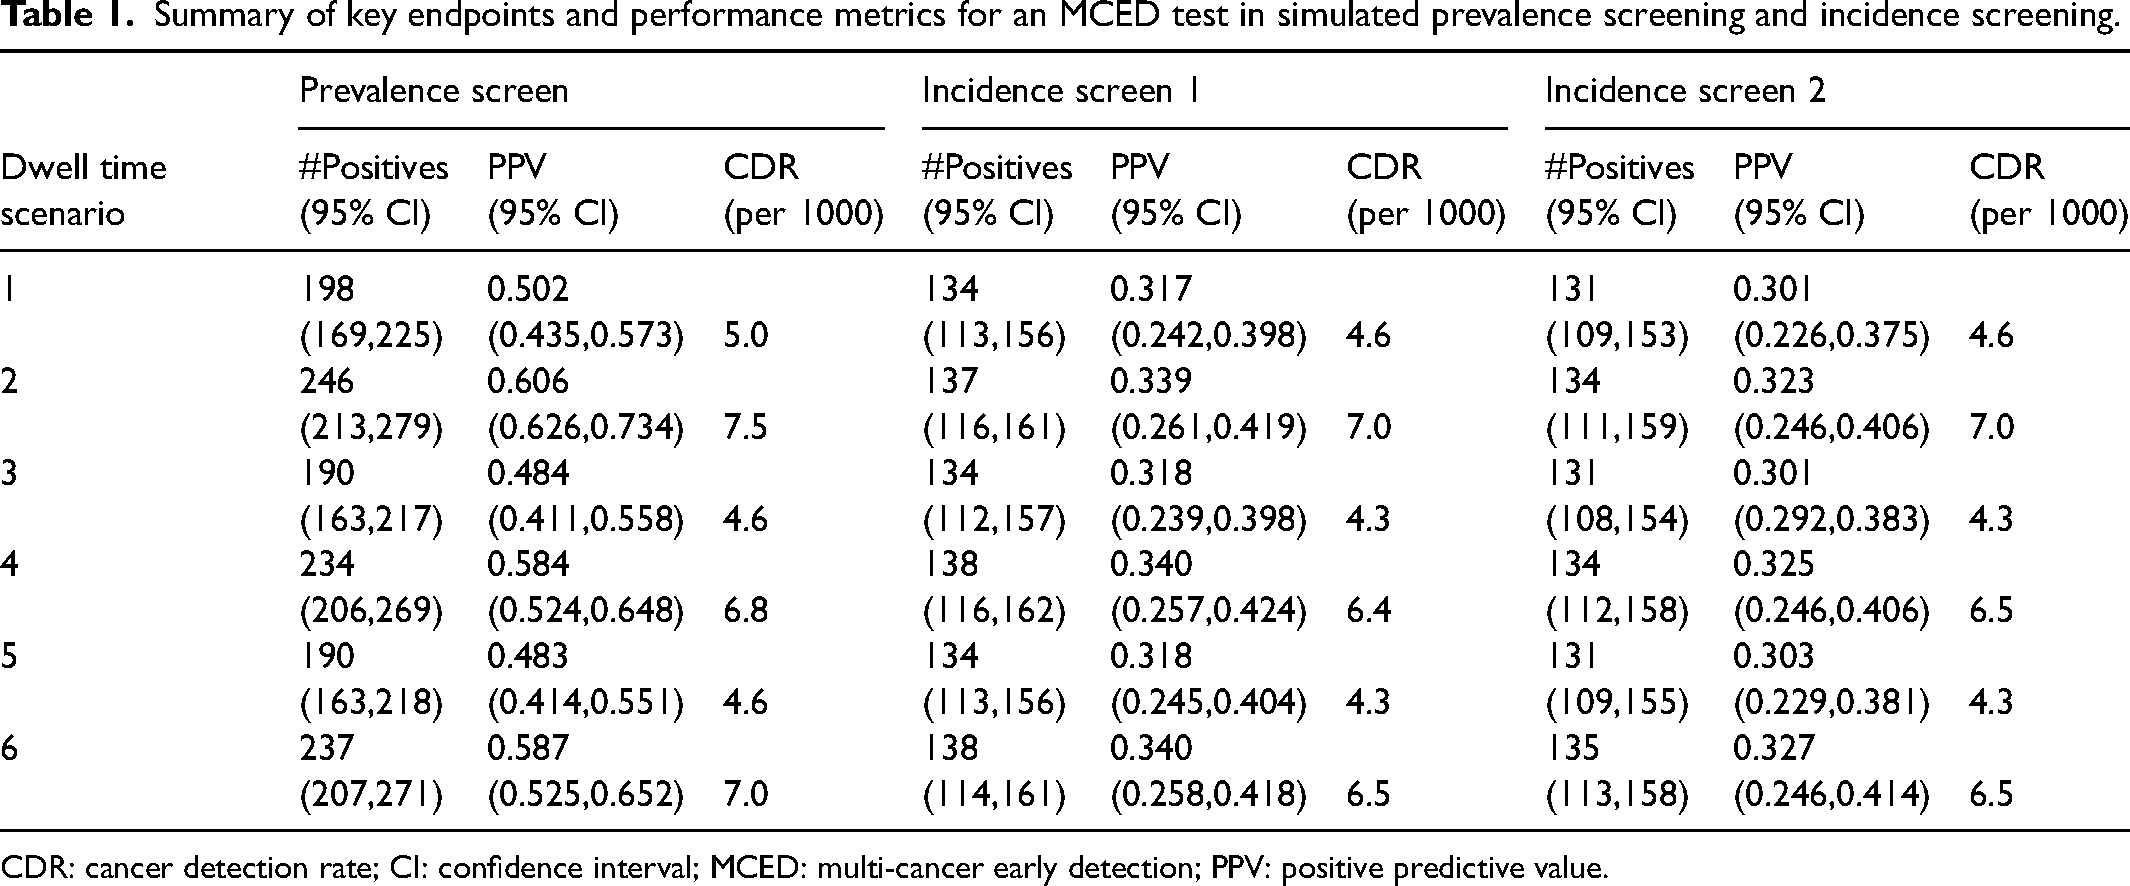
CDR: cancer detection rate; CI: confidence interval; MCED: multi-cancer early detection; PPV: positive predictive value.
Hypothetical phase 5 randomized controlled screening trial: Evaluating clinical utility of MCED in an asymptomatic population
One hundred thousand participants aged 50–79 were randomly allocated at a 1:1 ratio to the intervention and control arms. The hypothetical sample size of N = 50,000 in each arm was chosen to resemble the sample size in the two active screening arms in UKCTOCS for ovarian cancer screening. 17 Participants in the intervention arm underwent three or five annual blood draws, and MCED tests were performed. MCED test positive results would be returned to participants and healthcare providers for diagnostic confirmation. Participants in the control arm underwent annual blood draws, and blood samples were stored. An annual dropout rate of 6% was assumed.
Using the microsimulation model, and accounting for healthy volunteer effect and a 15% reduced test sensitivity, we investigated the projected effect size for the three clinical utility endpoints: stage shift (proportion of stage I/II cancers), reduction of late-stage (stages III and IV) cancer incidence, and reduction of cancer-specific mortality. In the context of MCED testing, cancer-specific mortality is defined as the mortality caused by any of the cancer classes screened by the MCED test. Other design considerations can also be evaluated, such as whether five rounds of repeated MCED screening could achieve a greater reduction in late-stage cancers and cancer mortality. Another important consideration for a trial designed to assess mortality is to predict the temporal pattern of mortality benefit and determine the follow-up window.
Shifting cancer stage distribution to stage I/II
Table 2 shows the proportions of stage I/II cancers among all cancers that were diagnosed after three or five rounds of annual MCED screenings. In the control arm, the proportion of stage I/II cancers was approximately 62% on average, reflecting the proportion in SEER data. In the intervention arm, sojourn time parameters affected stage shift to some degree, though not substantially. The proportion of stage I/II cancers in the intervention arm ranged from 71% to 76% and 72% to 76% for three and five annual MCED screening rounds, respectively. In dwell time scenario 1, where tumor growth is accelerating in late stages, the absolute increase in proportion of stage I/II cancers between the intervention arm and the control arm reached as high as 12%–13%, a relative increase of 20%. The power to test whether there is a difference in the proportion of stage I/II cancers between the two arms was uniformly greater than 0.99 across all dwell time scenarios because this test is highly efficient, conditional on the number of cancers being diagnosed during the trial follow-up. Additional simulation scenarios to further explore the impact of dwell times on stage shift are described in the Supplemental material (Figure S4).
Cumulative proportion of stages I and II cancers diagnosed after three or five rounds of annual MCED screening.
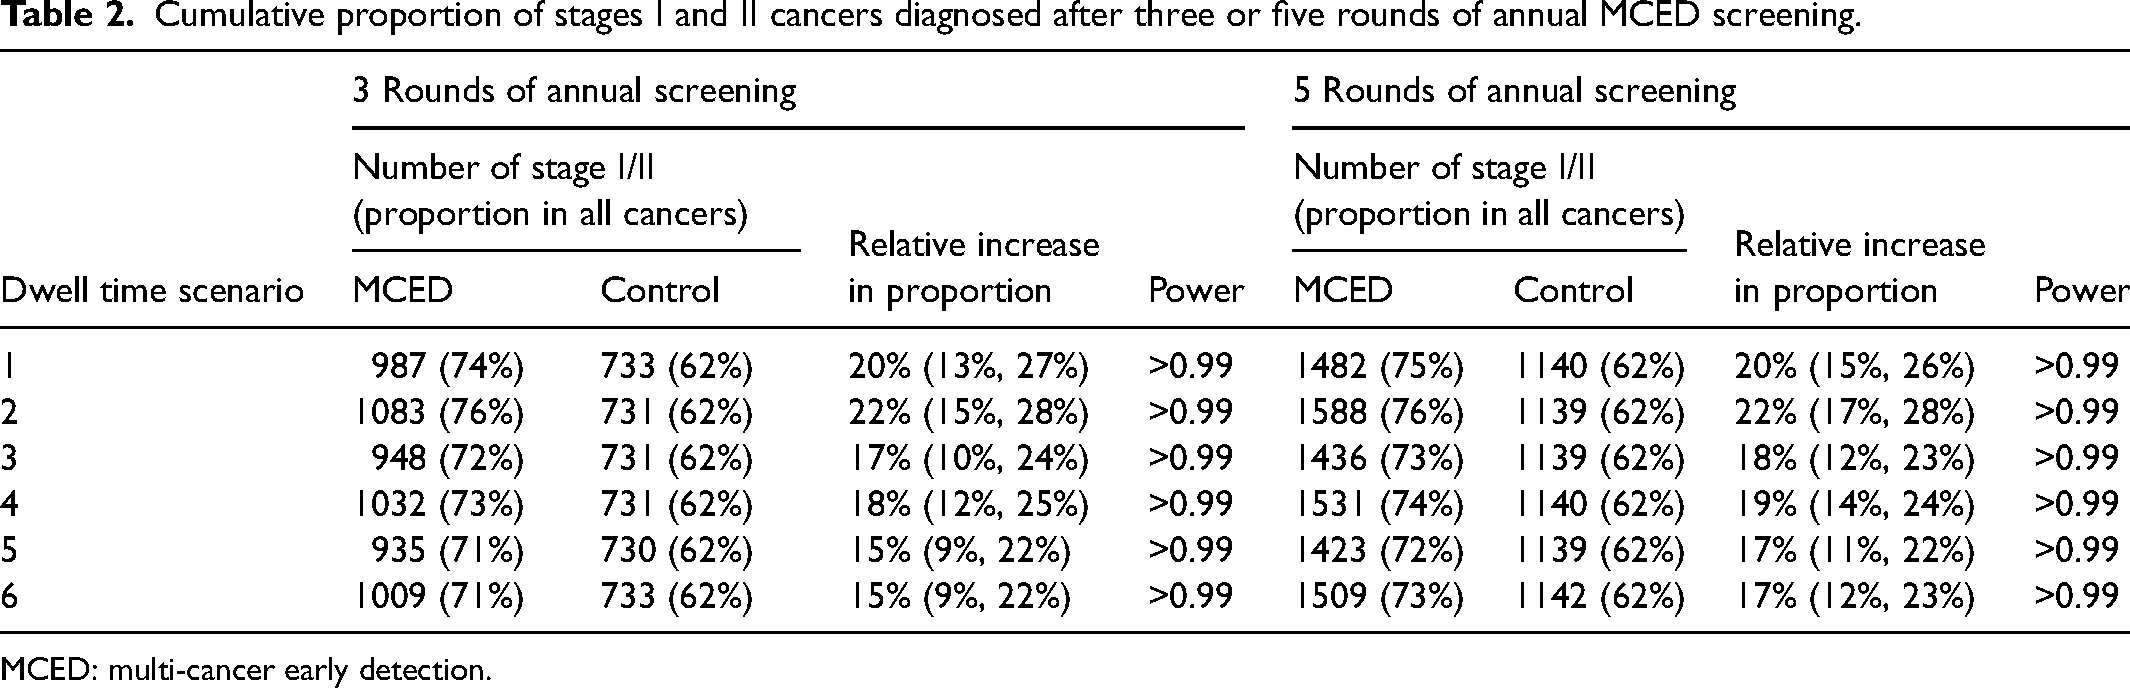
MCED: multi-cancer early detection.
Reducing the incidence of late-stage cancers
Table 3 and Supplemental Figure S2 present the comparison of incidence rates of late-stage cancers in the two arms diagnosed cumulatively during the follow-up period (from randomization to 1 year after the final round of MCED screening) for three or five annual screening rounds. Late-stage cancers could either be stage III/IV cancers or stage IV cancers alone. As illustrated in Supplemental Figure S2, the incidence of stage III/IV cancers in the MCED arm decreased as the relative length of stage I/II sojourn time increased (e.g. dwell time scenarios 1–2, 3–4, vs 5–6) because a longer dwell time for stage I/II cancers permits a higher probability for the MCED test to intercept them during their progression to late-stage cancers. On the other hand, for a fixed ratio between dwell times in stage I/II and dwell times in stage III/IV (e.g. dwell time scenario 2 vs 1), the longer dwell time in stage III/IV led to a higher stage III/IV incidence and a smaller reduction in the intervention arm. This composite effect led to a greater reduction of late-stage cancers and greater power to detect the difference between the two arms in dwell time scenario 1 (24% reduction and 97% power), while the relative reduction and the power were the lowest (9% reduction and 29% power) in dwell time scenario 6 for three rounds of screening. When only stage IV (metastatic) cancers were counted as late-stage cancers, three rounds of annual MCED screening resulted in >35% reduction of stage IV incidence, which can be tested with power >99% for all scenarios. Five rounds of annual MCED screening further reduced the incidence of late-stage cancers. For instance, the percentage of reduction for stage III/IV incidence reached >19% for all scenarios after five rounds of screening.
Reduction of late-stage cancer incidence after three or five rounds of annual MCED screening.
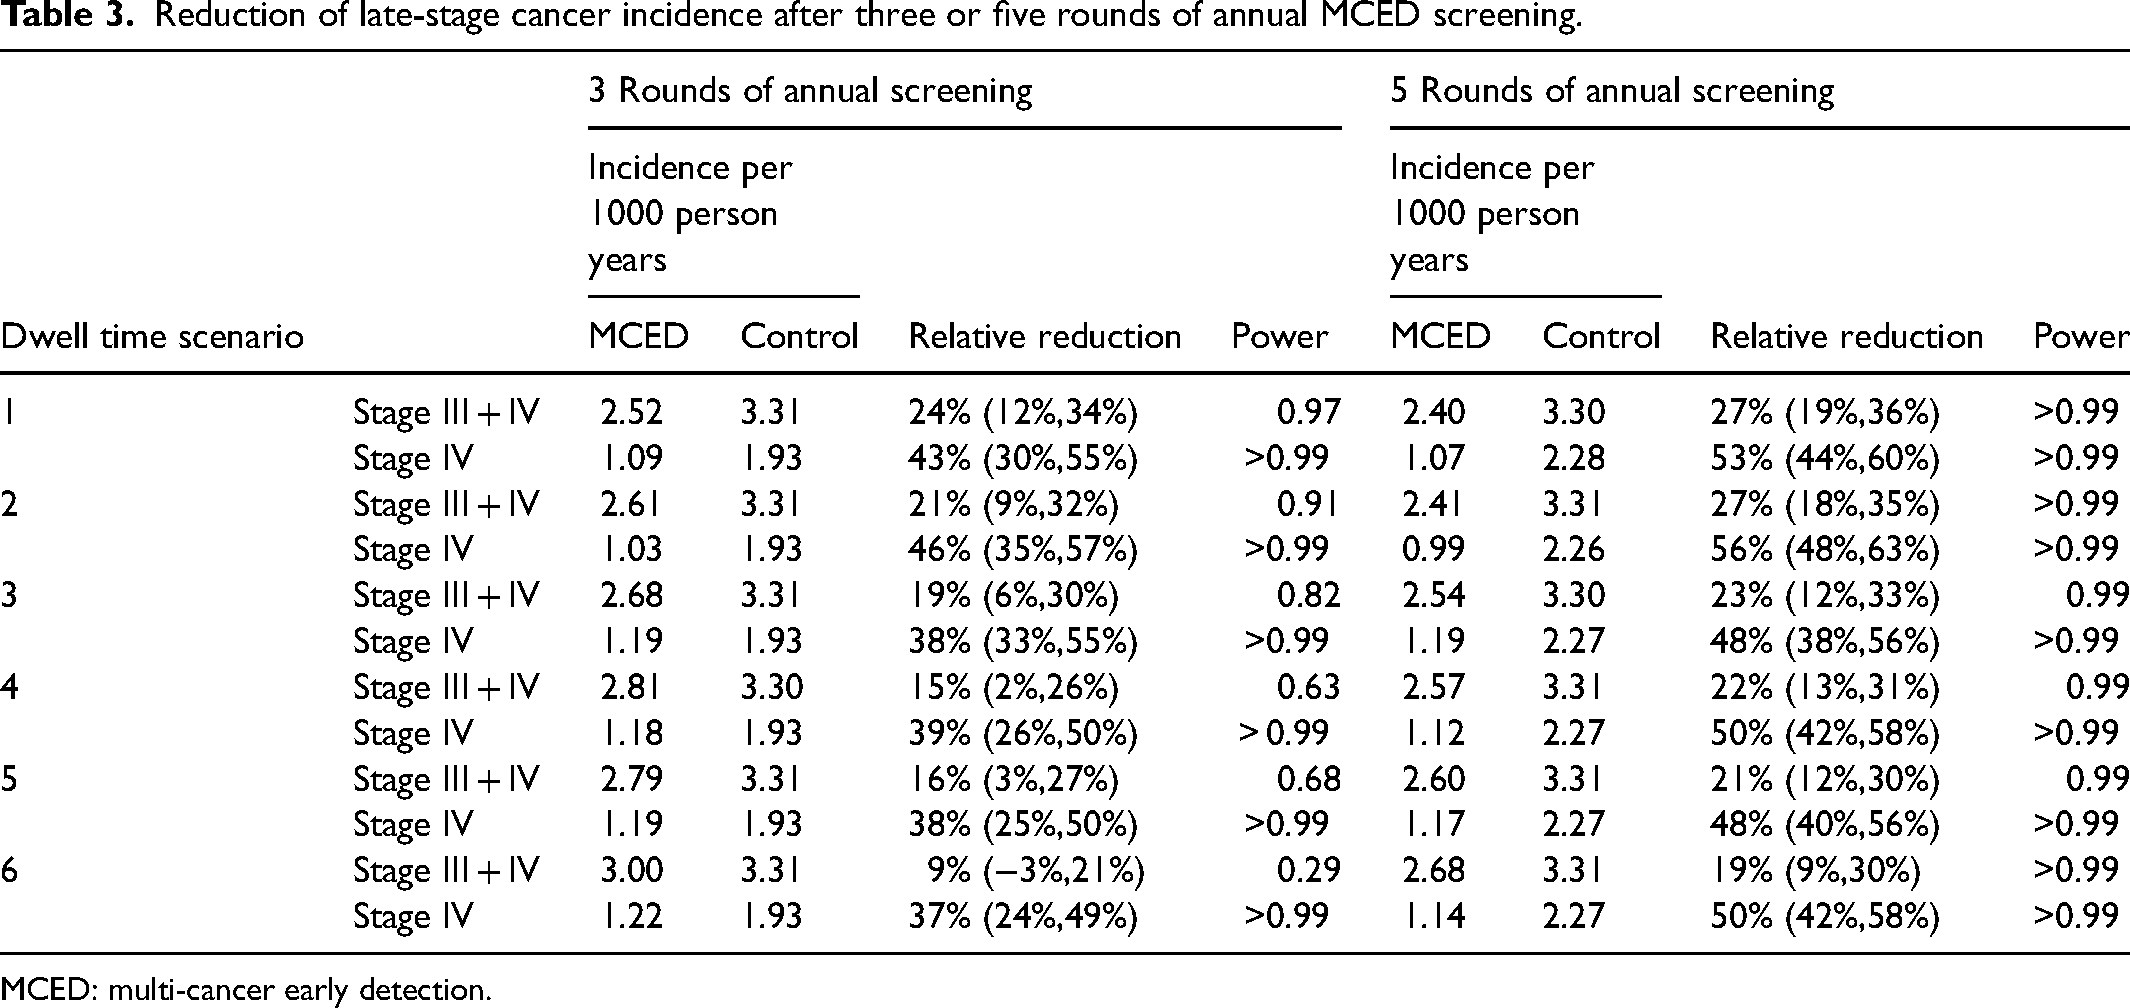
MCED: multi-cancer early detection.
Reducing cancer-specific mortality
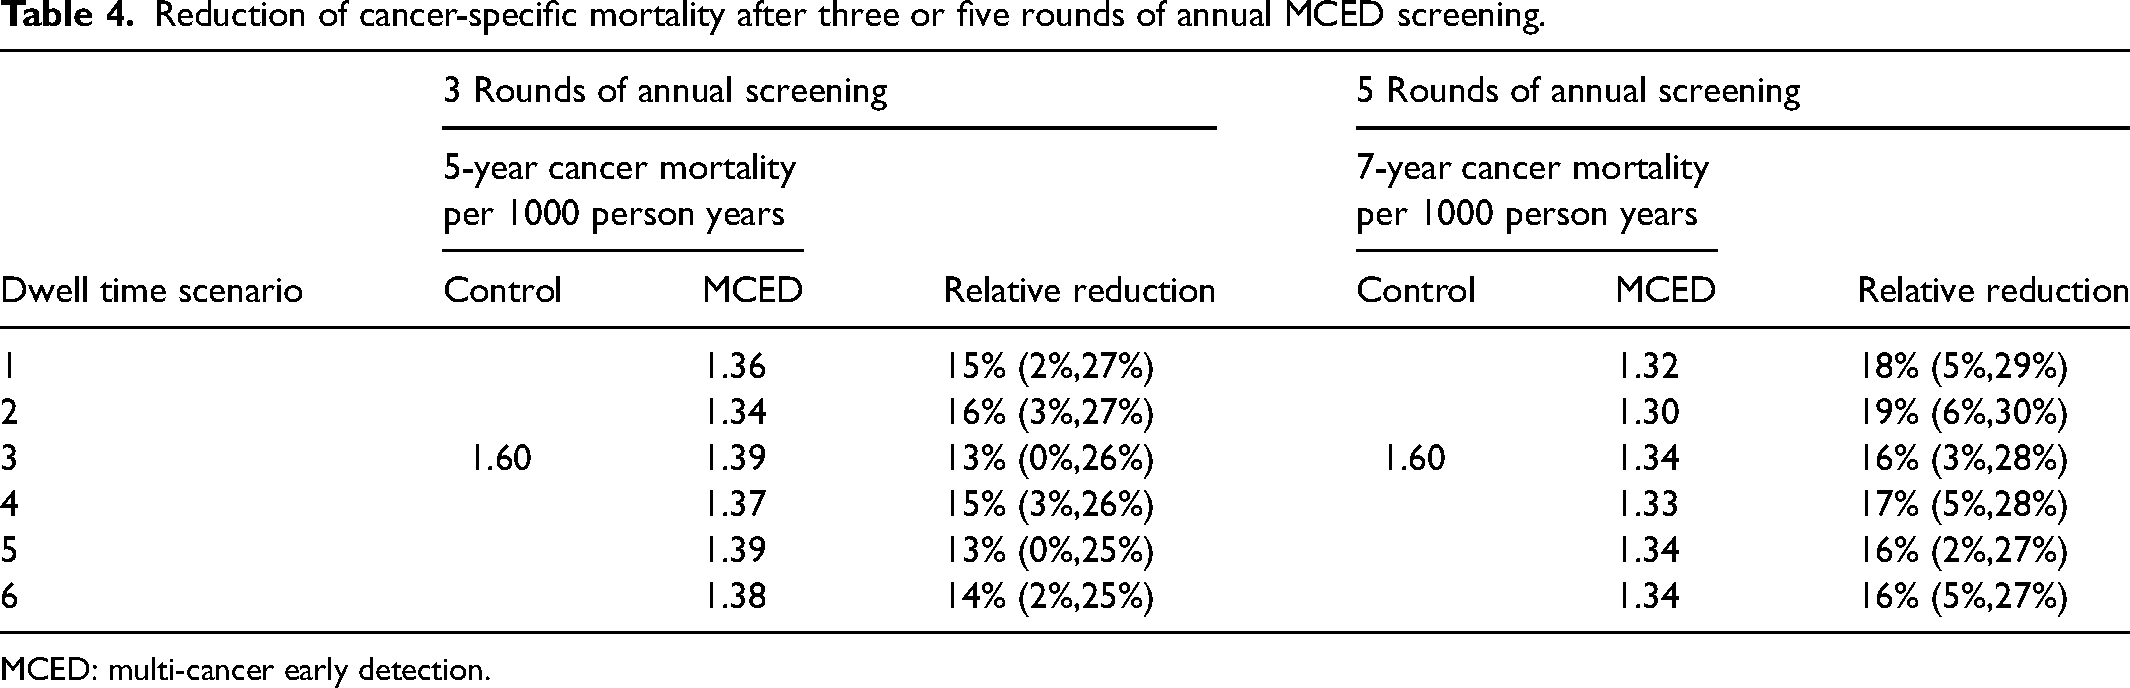
Table 4 shows that the relative reduction of cancer-specific mortality reached 13%–16% for all dwell time scenarios at year 5 for three rounds of annual MCED screening, and 16%–19% at year 7 for five rounds of annual MCED screening. Among the six dwell time scenarios, the trend of mortality reduction was consistent with the pattern of reduction in stage III/IV incidence: a greater reduction of mortality was observed when the dwell time in stage III/IV was shorter. The effect sizes of mortality reduction for other years are summarized in Supplemental Tables S3 and S4. Figure 2 shows the temporal pattern (from years 3 to 10) of power to detect a statistically significant reduction in cancer-specific mortality. When there were three rounds of annual MCED screening at years 0, 1, and 2, the power continued to increase after screening had ended, reaching the maximum at year 5 for most of the dwell time scenarios. However, none of the dwell time scenarios had >80% power for detecting mortality reduction. Adding two more rounds of annual MCED screening substantially increased the power, which reached the maximum (>80%) for most dwell time scenarios at year 7.
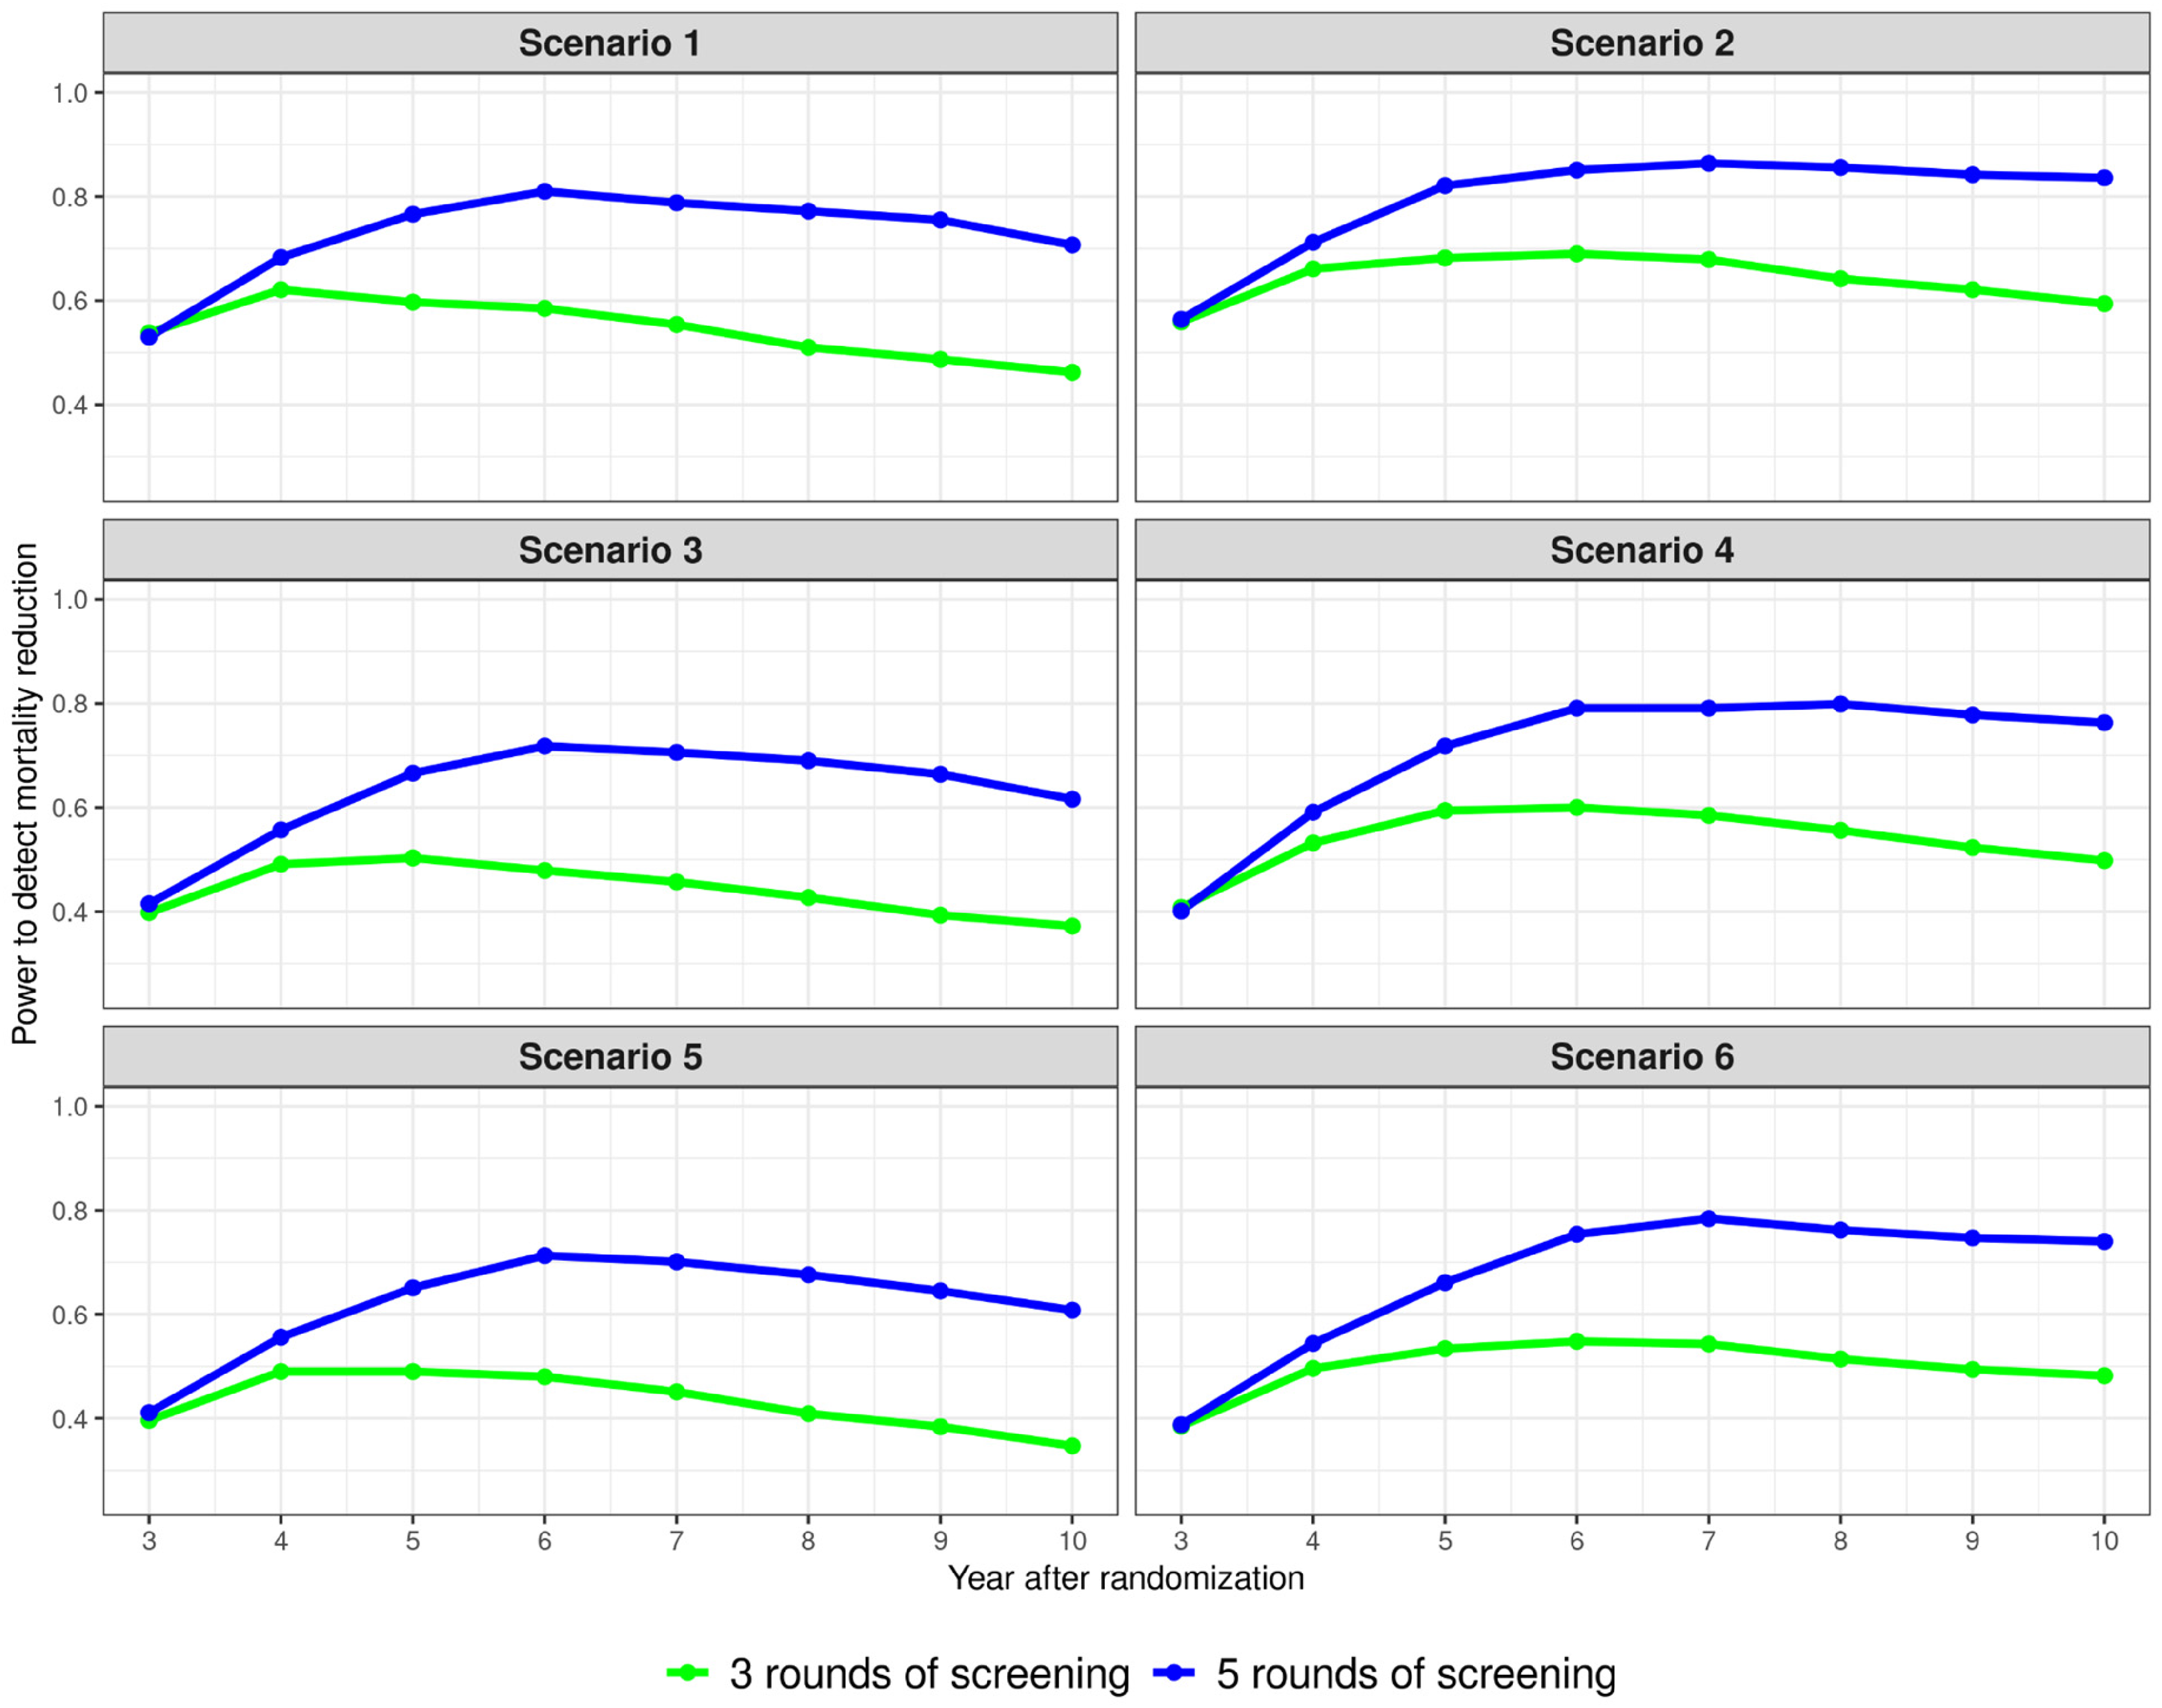
The temporal trend of the power to detect a reduction of cancer-specific mortality in the intervention arm with three or five rounds of annual MCED screening for six dwell time scenarios. Randomization occurred in year 0; for three rounds, annual MCED screening occurred in years 0, 1, and 2; for five rounds, annual MCED screening occurred in years 0, 1, 2, 3, and 4. MCED: multi-cancer early detection.
Reduction of cancer-specific mortality after three or five rounds of annual MCED screening.
MCED: multi-cancer early detection.
Discussion
We developed a novel microsimulation model for projecting effect sizes of key study endpoints and informing the design of cancer screening studies for an MCED test (Galleri
When compared to the prior mathematical interception model, 34 the structure and assumptions of this microsimulation model remain consistent. Several differences in the features of the two modeling approaches led to different projected reductions in late-stage cancers and cancer mortality. First, a broader range of dwell time scenarios were considered in this work, varying both the total sojourn time and the dwell time in preclinical cancer stages. Second, the simulation in this work also considered reduced sensitivity in a screening population (a 15% reduction) when compared to the sensitivity estimated from the CCGA3 case-control study, and applied a crude healthy volunteer effect that reduced the SEER cancer incidences by 15%. We expect that this microsimulation model will be improved as we learn more about natural histories for cfDNA-shedding cancers from ongoing MCED screening studies (e.g. PATHFINDER2 and NHS-Galleri).
In a hypothetical phase 4 single-arm screening study, the PPV estimates in simulated datasets ranged from 48% to 61% in the prevalence screening round, and 30% to 34% in the incidence rounds (Table 1). This is much higher than the typical <10% PPV estimates of existing single-cancer screening tests43–45 because of the low false positive rate of the MCED test and aggregated detection of many cancer types in one blood test.
We observed that the relative distribution of stage-specific dwell times had little impact on the number of test positives and various performance metrics, appearing to mainly affect the relative reduction of late-stage cancer incidence (Tables 2 and 3; Supplemental Figure S2). The reduction of stage III/IV incidence appears to be more affected by variation of late-stage dwell times, particularly in the scenario with equal dwell times across four stages (16% and 9% in dwell time scenarios 5 and 6). Compared to three rounds of annual MCED screening, five rounds considerably increased the reduction of stage III/IV cancer incidence (>19% in all scenarios). Compared to stage III/IV cancers, the power and the effect size for the reduction of stage IV cancers (>35%) were consistently higher across all scenarios. This is because stage IV is the end stage before clinical symptomatic diagnosis, when the MCED test has the highest sensitivity and, therefore, is more likely to be shifted to an earlier stage, including stage III.
The choice of stage shift or reduction of late-stage cancer incidence as the primary endpoint of a clinical utility trial has been supported but remains a topic of debate. The proportion of early-stage cancers is subject to the issue of overdiagnosis,46,47 that is, screen-detected preclinical early-stage cancers that would otherwise neither progress nor be diagnosed clinically in the absence of screening. This phenomenon has been frequently observed after implementing a screening program, such as those for breast and prostate cancers.46,47 In contrast, meta-analyses of breast cancer screening trials consistently showed a strong correlation between a larger degree of reduction of late-stage cancer incidence and a greater reduction of cancer mortality.19,20
The degree of reduction in cancer mortality in a screening trial depends on the natural history of the cancer, test sensitivity, and the delivery of cancer care and treatment in the particular clinical trial setting for the enrolled sites. It is therefore more difficult to predict mortality benefit for a clinical trial via a microsimulation model. The stage-shift model we used to predict mortality reduction makes certain assumptions, for example, that screen-detected cancers have the same survival probabilities as the clinically detected cancers at the same stage, which we relaxed in extended models provided in the Supplemental material. In addition, the model adds prolonged survival from the time of clinical detection in the absence of screening to avoid lead-time bias, which can be arbitrary. Moreover, the cancer incidence and survival probabilities used in the model are based on SEER data from the general US population from 2005 to 2016, which may not exactly match cancer incidence and survival during a long follow-up window for a future RCT. As such, results in Table 4 and Figure 2 should be interpreted within this context.
There are limitations in the current version of the model. Aimed to inform study design, our model is relatively simple compared to single-cancer CISNET models for informing screening policies and recommendations, 33 without considering age, gender, and other risk factors. The extent of overdiagnosed cancers detected by cfDNA-based MCED tests has not been systematically studied and, therefore, was not explicitly modeled in this work. For this reason, we focused on the reduction in late-stage cancers in Table 3. The presence of overdiagnosis may increase the number of stage I/II cancers and increase stage shift. Several lines of evidence suggest that cfDNA-based MCED testing may be less prone to overdiagnosis of slow-growing cancers. This MCED test has lower sensitivity for early-stage breast and prostate cancers detected by standard-of-care screening, so it appears to not detect these often overdiagnosed, possibly indolent cancers. Furthermore, more rapidly growing and aggressive tumors tend to shed more cfDNA, and are therefore more likely to be detected by cfDNA-based MCED screening tests.48–50 In addition, stage-shift models for attributing mortality benefit make strong assumptions and may not capture the entire path from cancer diagnosis to mortality. 38 Finally, diagnostic resolution depends on the capacity of healthcare providers and may not be achieved for every screen-detected cancer. Future work should include refinements of the microsimulation model to address these limitations.
Conclusion
The proposed microsimulation model provides a flexible and robust tool to inform the design of screening studies for an MCED test. The simulation results showed that, with a small number of rounds of annual screening, the blood-based MCED test (Galleri
Supplemental Material
sj-docx-1-msc-10.1177_09691413241228041 - Supplemental material for Clinical performance and utility: A microsimulation model to inform the design of screening trials for a multi-cancer early detection test
Supplemental material, sj-docx-1-msc-10.1177_09691413241228041 for Clinical performance and utility: A microsimulation model to inform the design of screening trials for a multi-cancer early detection test by James Y Dai, Jing Zhang, Jerome V Braun, Noah Simon, Earl Hubbell and Nan Zhang in Journal of Medical Screening
Footnotes
Acknowledgements
We thank Christina A Clarke (GRAIL, LLC) for generating the SEER incidence and survival statistics. The authors thank Amy Sinor-Anderson, Rachel McMullan, and Randall Janairo (GRAIL, LLC) for help with manuscript development. Project management assistance was provided by Prescott Medical Communications Group (Chicago, IL, USA).
Author Contributions
JYD, JZ, and NZ conceived the study. All authors planned the study. JYD, JZ, JVB, EH, and NZ performed the analysis and interpretation of the data. JYD, JZ, and NZ drafted the manuscript and all authors participated in the critical review and editing of the work, as well as approval of the final version. JYD is the guarantor. The corresponding authors attest that all listed authors meet authorship criteria and that no others meeting the criteria have been omitted.
The Corresponding authors (JYD and NZ) affirm that the manuscript is an honest, accurate, and transparent account of the study being reported, and that no important aspects of the study have been omitted.
Declaration of conflicting interests
JYD, EH, and NZ are employees of GRAIL, LLC. JZ is a former employee of GRAIL, LLC and is a current employee of Adela, Inc. JVB is an independent statistical consultant at GRAIL, LLC. NS has received consulting fees from GRAIL, LLC.
Funding
The authors disclosed receipt of the following financial support for the research, authorship and/or publication of this article: This project was funded by GRAIL, LLC.
Supplemental material
Supplemental material for this article is available online.
References
Supplementary Material
Please find the following supplemental material available below.
For Open Access articles published under a Creative Commons License, all supplemental material carries the same license as the article it is associated with.
For non-Open Access articles published, all supplemental material carries a non-exclusive license, and permission requests for re-use of supplemental material or any part of supplemental material shall be sent directly to the copyright owner as specified in the copyright notice associated with the article.