
Abstract
Objective
We aimed to introduce a concept of overdiagnosis with actual formulae. In screening for invasive cancer, the detection proportion to incidence rate (D/I) ratio is used as an intermediate indicator of effect. D is the detection rate (proportion) at screen and I is the background risk (i.e. the expected incidence rate if there were no screening). We sought to determine a proper use of the D/I ratio in the estimation of overdiagnosis in screening.
Methods
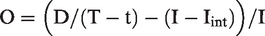
We propose the difference between the D/I ratio per year and incidence-based sensitivity as an estimate of overdiagnosis. As an example to evaluate this, we used screening for colorectal cancer, run as a randomized public health policy in Finland.
Conclusion
The use of the D/I ratio is inappropriate in predicting effect, and we recommend that the D/I ratio be used as a component in the estimation of overdiagnosis in screening for invasive cancer.
Introduction
Mortality reduction is the ultimate outcome goal of cancer screening. Process indicators such as detection proportion (D) to incidence rate (I) ratio (D/I) are used to predict the outcome, because they are available before any final evaluation.1,2 In the traditional D/I ratio, D is the number of screen-detected cancers divided by the number of screening attenders. The terms detection rate and (especially for the first round) prevalence proportion or rate are also used. Incidence (I) is the hypothetical expected incidence rate of cancer in the attenders during the screening interval in the absence of screening.
Screen-detected cases of cancer in D include cases that because of screening did not cause death, those in which the outcome was unaffected by the screening and those which were only ever diagnosed because of screening (i.e. overdiagnosed cases). Because of this mixture of benefit and harm, the D/I ratio is valid in prediction of outcome only if the harm of overdiagnosis is small compared with the benefit of preventing death through screening. In this paper, we use D/I ratio to estimate overdiagnosis, rather than to indicate any benefit.
Methods
The framework of a screening programme with a fixed length of screening round will be considered. The duration of a screening round (T) is the time period from one screening test to the next subsequent test (Figure 1). The screening round is divided into a period of diagnostic assessment (t) called episode and a screening interval (T–t). The episode is the period during which the result of the test is confirmed as positive (i.e. cancer), or negative (i.e. no cancer). The interval is the period from the end of the episode to the time of the next test. The round includes the point in time of taking the first but not the subsequent test.
Time periods in estimates of detection and incidence rates.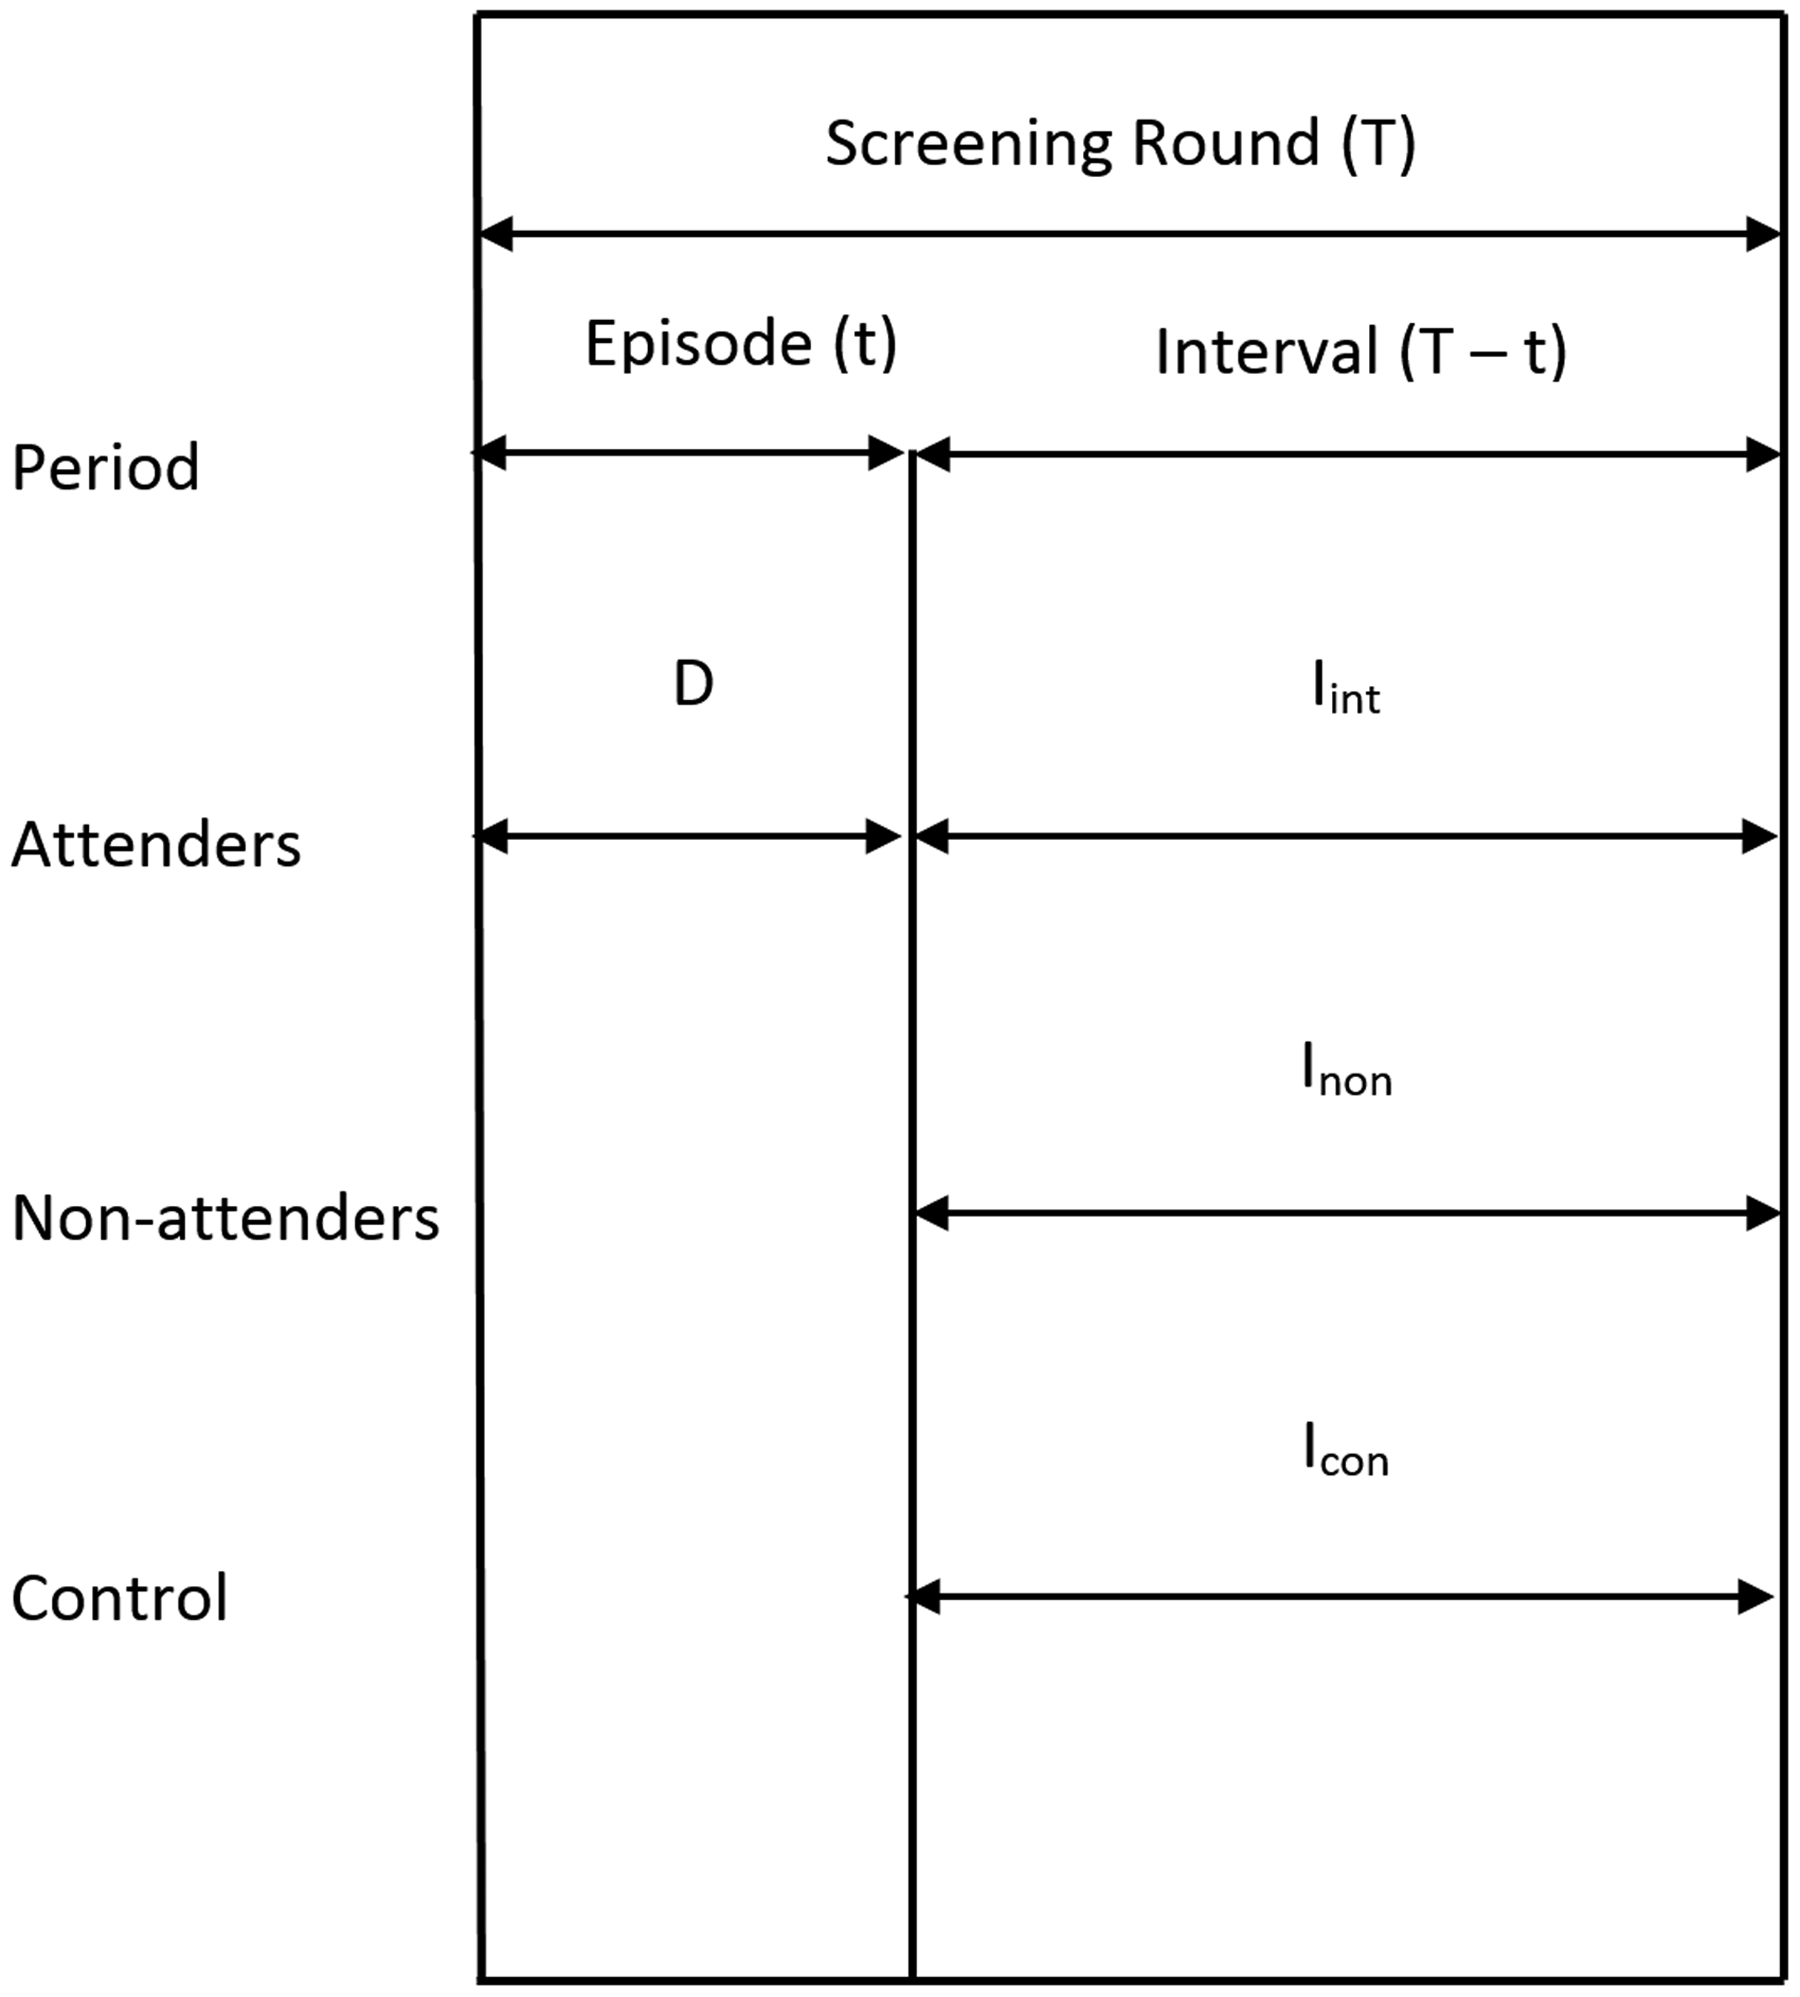
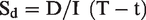
Screen-detected cancers are those detected within the screening episode. They were unrecognized and in the detectable preclinical phase (DPCP) at the time of the test. Screening for invasive cancer does not, per definition, affect the true cancer incidence; it affects only the timing of the diagnosis due to early detection. Therefore, the expected interval cancer incidence (I) equals the incidence of cancers that enter into the DPCP during the screening interval. A proportion of these cancers defined by sensitivity will be screen detected at the subsequent screen. Therefore, the D/I-ratio divided by the length of the interval equals with episode sensitivity and will be called detection-based sensitivity (Sd).
The D/I-ratio can alternatively be described as the time period after the episode during which screen-detected cancers would have surfaced clinically in the absence of screening. Both interpretations assume that no overdiagnosis exists in screening.
The incidence method offers an independent estimate of episode sensitivity (Si) that does not suffer from overdiagnosis
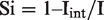
The expected incidence (I) refers to those actually screened. It is not the same as the incidence in those intended to screen, because the non-attenders are a (self) selected group by the risk, incidence.
A relatively good estimate of the expected incidence (I) can be found from a randomized screening study
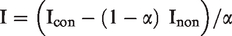
Icon is the incidence rate of cancer in the control arm in the interval
Inon is the incidence rate of cancer in non-attenders in the interval
α is the proportion of person years of attenders out of all person years in the invitees in the interval.
We assume a fixed length T of screening round, t of screening episode, and a population-based invitation system as in a randomised screening trial or in a randomised health services study of screening. Therefore, cancers and person years are known for interval cancer incidence in the controls (Icon) and in the non-attenders (Inon).
As an empirical example, we present data from the randomised health services study on screening for colorectal cancer in Finland. The programme consisted of biennial screening at ages 60 to 68 with guaiac FOB test. We used a fixed six-month episode, and therefore the interval was 18 months. 3
Results
Of the 63,958 individuals who attended the first round in 2005–2008, 61,689 were invited for the second round and 57,142 attended (Table 1). In the attenders, 61 cancers were diagnosed during the episode and 64 during the interval. Therefore, the detection proportion (D) was 107 per 100,000 persons, and interval cancer incidence was 75 per 100,000 person years. Out of the interval cancers, 10 were diagnosed in non-attenders and 175 in controls, which resulted in an incidence of Inon = 147 and Icon = 130. The person year proportion of second round attenders was 93% in those who had attended the first round. Therefore, the expected incidence rate (I) was 129. These results imply a detection-based sensitivity estimate of 55% (107/(1.5 × 129)), and incidence-based sensitivity estimate of 42% ((129–75)/129) and, therefore, an overdiagnosis of 13% (55–42).
Second round of the Finnish randomised screening programme for colorectal cancer.
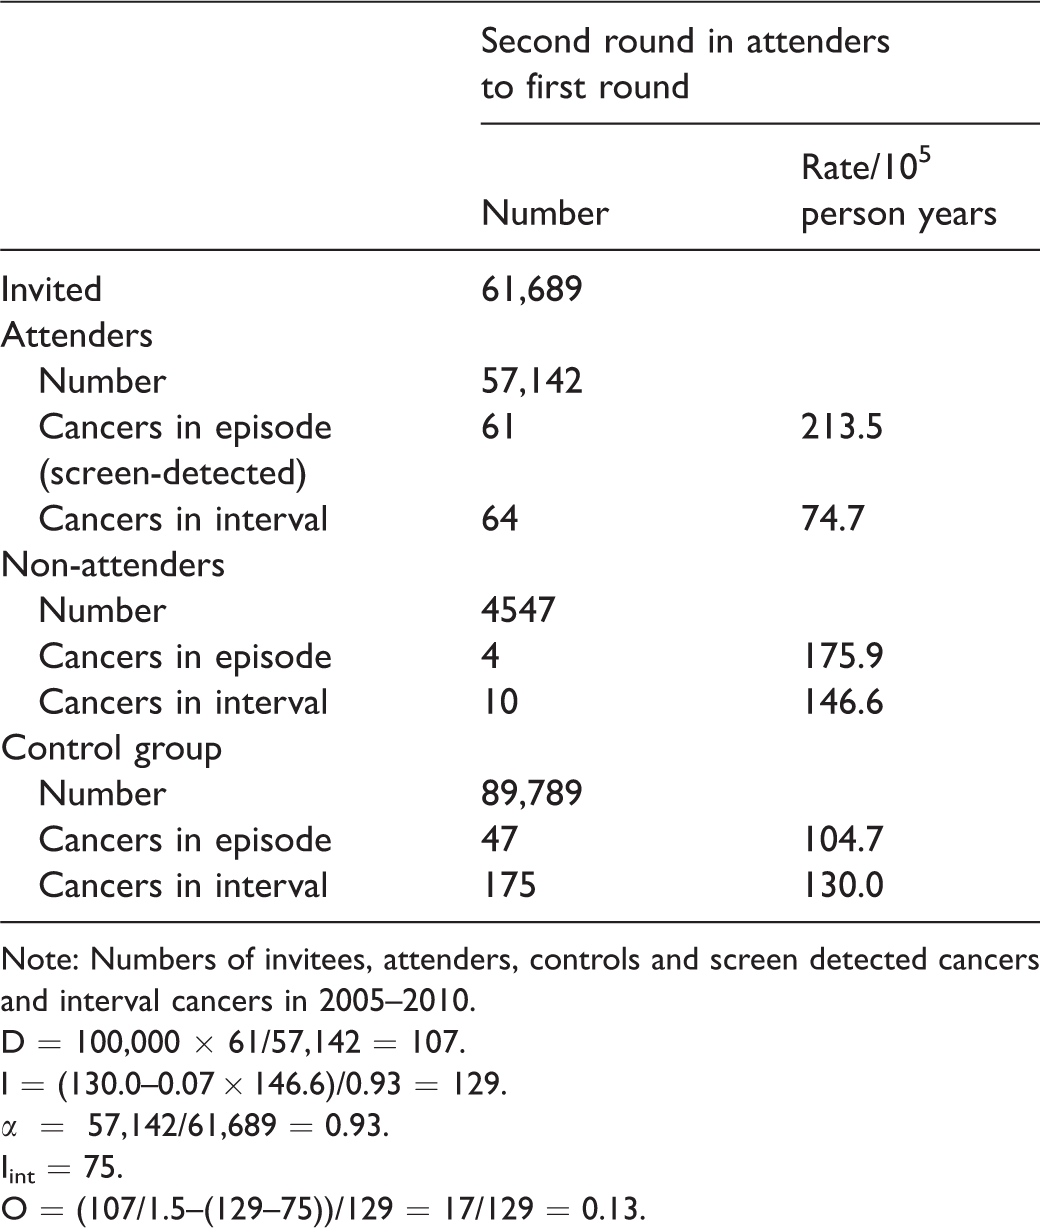
Note: Numbers of invitees, attenders, controls and screen detected cancers and interval cancers in 2005–2010.
D = 100,000 × 61/57,142 = 107.
I = (130.0–0.07 × 146.6)/0.93 = 129.
α = 57,142/61,689 = 0.93.
Iint = 75.
O = (107/1.5–(129–75))/129 = 17/129 = 0.13.
Discussion
The objective of cancer screening is to reduce cancer-specific mortality by identifying unrecognized cancer in the DPCP.4,5 Screen-detected cases are an intermediate indication of screening meeting the final objective. They are measured by detection proportion at screening (D). It depends on the risk of cancer (background incidence), on the length of the DPCP (sojourn time), the lengths of the screening episode and of the screening interval, on sensitivity of the test and of the diagnostic assessment phase and on overdiagnosis in detection of cancers in the DPCP. Because of these several determinants of D, it does not have a straightforward interpretation.
We developed an estimate of overdiagnosis from the screen-detected cases through controlling for the determinants other than overdiagnosis. The use of D/I-ratio eliminated the effect of background incidence. The restriction to a single screening round with a fixed length eliminated the effect of the screening interval. The comparison of detection-based sensitivity (Sd) with episode sensitivity estimated by the incidence method (Si) eliminated the effects of sensitivity of the test and lengths of the episode and DPCP. Hence, the difference between the two sensitivities, one based on detection (after taking the length of interval into consideration) and the other based on incidence, is a measure of overdiagnosis. The limitations are the same as the limitations of the incidence-based sensitivity Si to indicate the ultimate effect.
Theoretically, sensitivity is the ability to detect cancer in the DPCP. The proportion of these cancers detected at screen out of all cancers in the DPCP was estimated under assumptions, e.g. on the distribution of sojourn time of cancers in the DPCP.6–10 Here, we took a pragmatic attitude. The expected incidence rate in the incidence-based sensitivity estimate is restricted to those cases in DPCP which would surface within one screening interval. After the first round, the same is true for the detection-based sensitivity estimate.
The aim of our paper is to introduce a concept of overdiagnosis with actual formulae. Because this is conceptually different from proposals based on growth rates and other assumptions, the numerical values will not be comparable with the other estimates, and our result on colorectal cancer serves only as an example. Also, application to screening for cancers in other primary sites remains for future evaluation.
Our estimate of overdiagnosis does not apply to the first screening round because the sojourn times are undefined, and the mean expected incidence is unknown.
Our method applies to a screening programme run as a public health policy, including repeated screening rounds. The limitation of our method is that some screen-detected progressive cancers are misclassified as overdiagnosed cases. They would be cancers diagnosed after the screening round in the absence of screening.
Screen-detected cancers are generally slow growing.11,12 The screen-detected but misclassified cancers would surface clinically only after a period that is longer than the screening round. Hence, they represent the slow-growing end of the distribution of sojourn times. If the screen would be postponed by one round, all these misclassified cancers would still be in the preclinical phase, and these patients would escape the physical and mental harms of screening. Therefore, incorporating the misclassified patients into the group of overdiagnosis was justified during the screening round in question.
Full agreement on the screen-detected cancers assumes definition of the length of episode. The same length of episode for both test positives and test negatives should be applied in estimation of any indicator to describe screening. 13 It is, however, commonplace to count person years for interval cancer rates from the time of the initial test to the next subsequent test in screen negatives, and from the time of final assessment to the time of the next subsequent test in screen positives. This method results in biased estimates, as it underestimates the interval cancer rate (Iint) and overestimates the episode sensitivity (Si). If the length of the screening round is short, including the episode in screen negatives results in large bias. In our example, the bias in interval cancer rates would be more than 30%, because in the biased method the length of episode (six months) was included in the follow-up time of interval (1.5 years) in almost all screens, i.e. in the screen negatives.
The estimates of Si and O depend on the length of episode, and on the actual organizing of screening, whether the diagnostic assessment is frequent early or late in the episode. If it is justified to shorten the episode, it is likely that the estimate of overdiagnosis will be less than with a longer episode. This limitation is identical with incidence-based sensitivity.
The expected background incidence in absence of screening, the denominator in the D/I-ratio and in the incidence-based sensitivity (Si), is unknown. It has been estimated as the incidence in non-attenders to screening, or as the historical incidence for the same area (based on e.g. cancer registry data). Both these methods are likely to be biased. The incidence in controls of a randomised screening trial is also biased and should be corrected for selective attendance using data on proportion of person years of attenders and incidence in non-responders. In non-experimental studies, the separation of these groups of non-invitees and non-attendees is not possible, and bias occurs. Further, the results from trials seldom apply to service screening. Therefore, any public health policy should preferably be introduced with a randomised health services study. 14
The use of the D/I ratio as an intermediate indicator of screening efficacy 1 has been recommended in guidelines, 2 and major screening programmes for breast cancer have reported the D/I ratio before the evaluation of effectiveness.15–18 Its use is no longer as common as previously, and more emphasis is placed on risk of interval cancers,19,20 which is a component of sensitivity by the incidence method. The D/I ratio is a combination of overdiagnosis and sensitivity, i.e. a mixture of benefit and harm. We propose that the D/I ratio still has a use as a component in estimation of overdiagnosis when evaluating screening for invasive cancer.
Footnotes
Declaration of conflicting interests
The author(s) declared no potential conflicts of interest with respect to the research, authorship, and/or publication of this article.
Funding
The author(s) received no financial support for the research, authorship, and/or publication of this article.