
Abstract
Objective
To quantify changes in the proportion of women aged 35 and older choosing serum screening for Down’s syndrome over time and the effect on false positive and detection rates.
Methods
From Rhode Island hospital-based laboratory prenatal screening records (2013–2017) we extracted the test performed (Integrated, Combined, Quadruple), maternal age, and Down’s syndrome risk; documented observed changes in maternal age distributions and false positive rates, and modelled the impact of varying proportions of older women choosing screening on each test’s performance using the 2015 United States birth cohort as baseline.
Results
Over five years, observed false positive rates for Integrated testing declined from 1.9 to 1.3% (−32%). The proportion of older women tested declined from 14.9 to 8.5%, from which modelling predicts a 16% decline in the false positive rate. This is lower than our observed change but consistent with a reduction driven by declining participation by older women. Modelling predicted a detection rate reduction from 89 to 87%. Larger detection rate impacts were predicted for Combined and Quadruple testing.
Conclusions
This study documents, for the first time, the declining proportion of older women choosing Down’s syndrome serum screening and subsequent impact on screening performance. The American College of Obstetrics and Gynecology recommends offering cell-free DNA screening for these ‘high risk’ pregnancies and uptake may increase further. Screening programmes could consider increasing use of Integrated testing over other serum screening tests or lowering risk cut-offs so false positive rates approach those of 2012 to regain lost detection.
Introduction
Prenatal maternal serum screening for Down’s syndrome has evolved over time, with increasing detection and decreasing false positive rates. There are currently multiple methodologies utilized and estimates of the detection, false positive, and test failure rates are based on tens of thousands of observations.1–12 With the latest option of sequencing cell-free (cf) DNA from the maternal circulation, detection is about 99% at a false positive rate of one or two per thousand.1–3 Initially, professional organizations13–17 recommended that such testing should be offered only to women at increased risk (e.g. advanced maternal age, serum screen positive, family history or an abnormal ultrasound finding). More recently, these limitations have been relaxed.18,19 Over the last five years in the prenatal serum screening programme at Women & Infants Hospital (Rhode Island, USA), changes have occurred in the numbers of women screened, which screening test was chosen, and the distribution of maternal ages, and there has been a fall in the screen positive rate for some tests. We aimed to quantify these changes and to determine whether it might be appropriate to consider modifying the Down’s syndrome risk cut-off levels to provide more reliable serum screening for those women who do not qualify, cannot afford, or choose not to have cfDNA screening. This information might also allow for more appropriate patient and provider education.
Methods
The prenatal screening programme at Women & Infants Hospital provides serum-based screening to the majority of pregnancies in Rhode Island. In addition, it serves several out of state clients, and these remained constant over the time period studied (2013–2017). Our screening programme offers second trimester Quadruple marker testing (alphafetoprotein (AFP), unconjugated oestriol, human chorionic gonadotrophin, and dimeric inhibin-A). 16 We also offer first trimester Combined testing (pregnancy-associated plasma protein-A and the ultrasound marker nuchal translucency, together with human chorionic gonadotrophin). The Integrated test uses a combination of the best markers in both trimesters, with results not reported until all data have been collected, sometime in the early second trimester. The alternative Sequential test identifies a small subset of women with very high risks in the first trimester (e.g. 1:50 or greater), who are offered diagnostic testing immediately, as their risks are unlikely to be screen negative with further information. Both Integrated and Sequential testing are also offered, but as their screening performances are nearly identical, they have been combined into a single ‘Integrated’ test category for the purposes of this report. Our programme utilizes αlpha software (Logical Medical Systems, London, England) to interpret and provide test results. Data were extracted in six-month intervals and included maternal age, test chosen, gestational age, AFP multiple of the median (MoM), and Down’s syndrome risk. This study was considered to be exempt by the Institutional Review Board for Human Studies at Women & Infants Hospital.
We determined changes in the percentage of older women, the screen positive rate, and the percentage of each test performed in a six-month interval for the Integrated, Combined, Quadruple, and AFP Only tests. The AFP Only test is now commonly performed to screen for open neural tube defects (ONTDs) in women choosing to have cfDNA testing for aneuploidy. Down’s syndrome risk screening cut-offs for the Integrated, Combined, and Quadruple tests were one in 110 (second trimester), 1:230 (first trimester), and 1:270 (second trimester), respectively. Results for women selecting sequential screening were reported in the first trimester if their risk was one in 25 or greater. A screen positive result for ONTD is an AFP value at or above 2.0 MoM. The screen positive rate is a reliable indicator of screening test performance when complete follow-up of all pregnancies is not available. The screen positive rate is essentially equal to the false positive rate, but will include an occasional true positive, and will therefore be slightly higher. Special attention is needed to interpret results collected during an intervention study that offered cfDNA screening at no charge to the general pregnancy population in Rhode Island. 20 During 2015A (Jan-Jun), when most women enrolled in the study, one might expect a reduction in the numbers of women having serum screening and an increase in AFP Only testing. Contingency tables were analysed by the Chi square test, and changes in the maternal age distribution, screen positive rates, and percentages of samples tested were analysed via linear regression. Statistical analyses were performed using BMDP (Statsols, Boston, MA) and graphics produced in Prism 7 (GraphPad Software, La Jolla, CA). Statistical significance was two-tailed at the p = 0.05 level.
An Excel (Microsoft Inc., Redmond, WA) model was created using the US maternal age distribution for births in 2015, 21 and maternal age-specific detection and false positive rates for each screening test were available through our laboratory interpretative software. Overall, 16.3% of US deliveries in 2015 occur to women aged 35 and older. Age-specific term Down’s syndrome risks 22 were used to estimate the number of cases occurring for each year of maternal age. The remaining births were assumed to be unaffected. The age-specific detection rates were weighted by the number of Down’s syndrome births, while the age-specific false positive rates were weighted by the remaining births at each age. The modelled Down’s syndrome births detected and falsely positive unaffected births were then summed and divided by the total births in each group, to obtain the overall detection and false positive rates. Additional maternal age distributions were then created by multiplying the number of women in single year age groups beginning at 35 years by the factors 0.8, 0.6, 0.4, 0.2, and 0, corresponding to reductions in these older women of 20, 40, 60, 80, and 100% (e.g. no women aged 35 and older). The impact of these reductions on screening performance would allow estimation for any reduction in older women (e.g. 12%) via interpolation. Test performance among those women having AFP Only testing for ONTD is not dependent on maternal age.
Results
Selected data were extracted from our programme’s clinical records database for all women having serum screening between 1 January 2013 and 31 December 2017. Repeat tests, incomplete reports, and multiple pregnancies were excluded. Overall, 54,635 unique patient records were available for analysis.
Figure 1 shows the percentage of women aged 35 for each test type (e.g. Integrated), stratified into 10 six-month time intervals. For each tests the highest percentage of older women occurred within the first year (2013), while the lowest percentage occurred in the last year (2017) for the Integrated and Combined tests. There was a general tendency for the rates to be lower over time, with all but the Integrated test reaching statistical significance. Both the Integrated and AFP Only test plots have relatively low percentages of women aged 35 and older for 2014B and 2015A, probably due to the competing cfDNA study, as a higher proportion of younger women were accepting cfDNA testing. Were those two data points to be removed, the Integrated test slope would be −1.14%/six months (p = 0.042) and the AFP Only slope would be −7.74%/six months (p = 0.006). In 2013, 15.0% of women tested via multiple markers were aged 35 or older, similar to the 16.3% found for the US population in 2015. 21 AFP Only testing was associated with a much higher proportion of older women, with over two-thirds being of advanced maternal age in 2013, and this proportion remained high at 40% over age 35 in 2017. The underlying data for Figure 1 are contained in Supplemental Table 1.
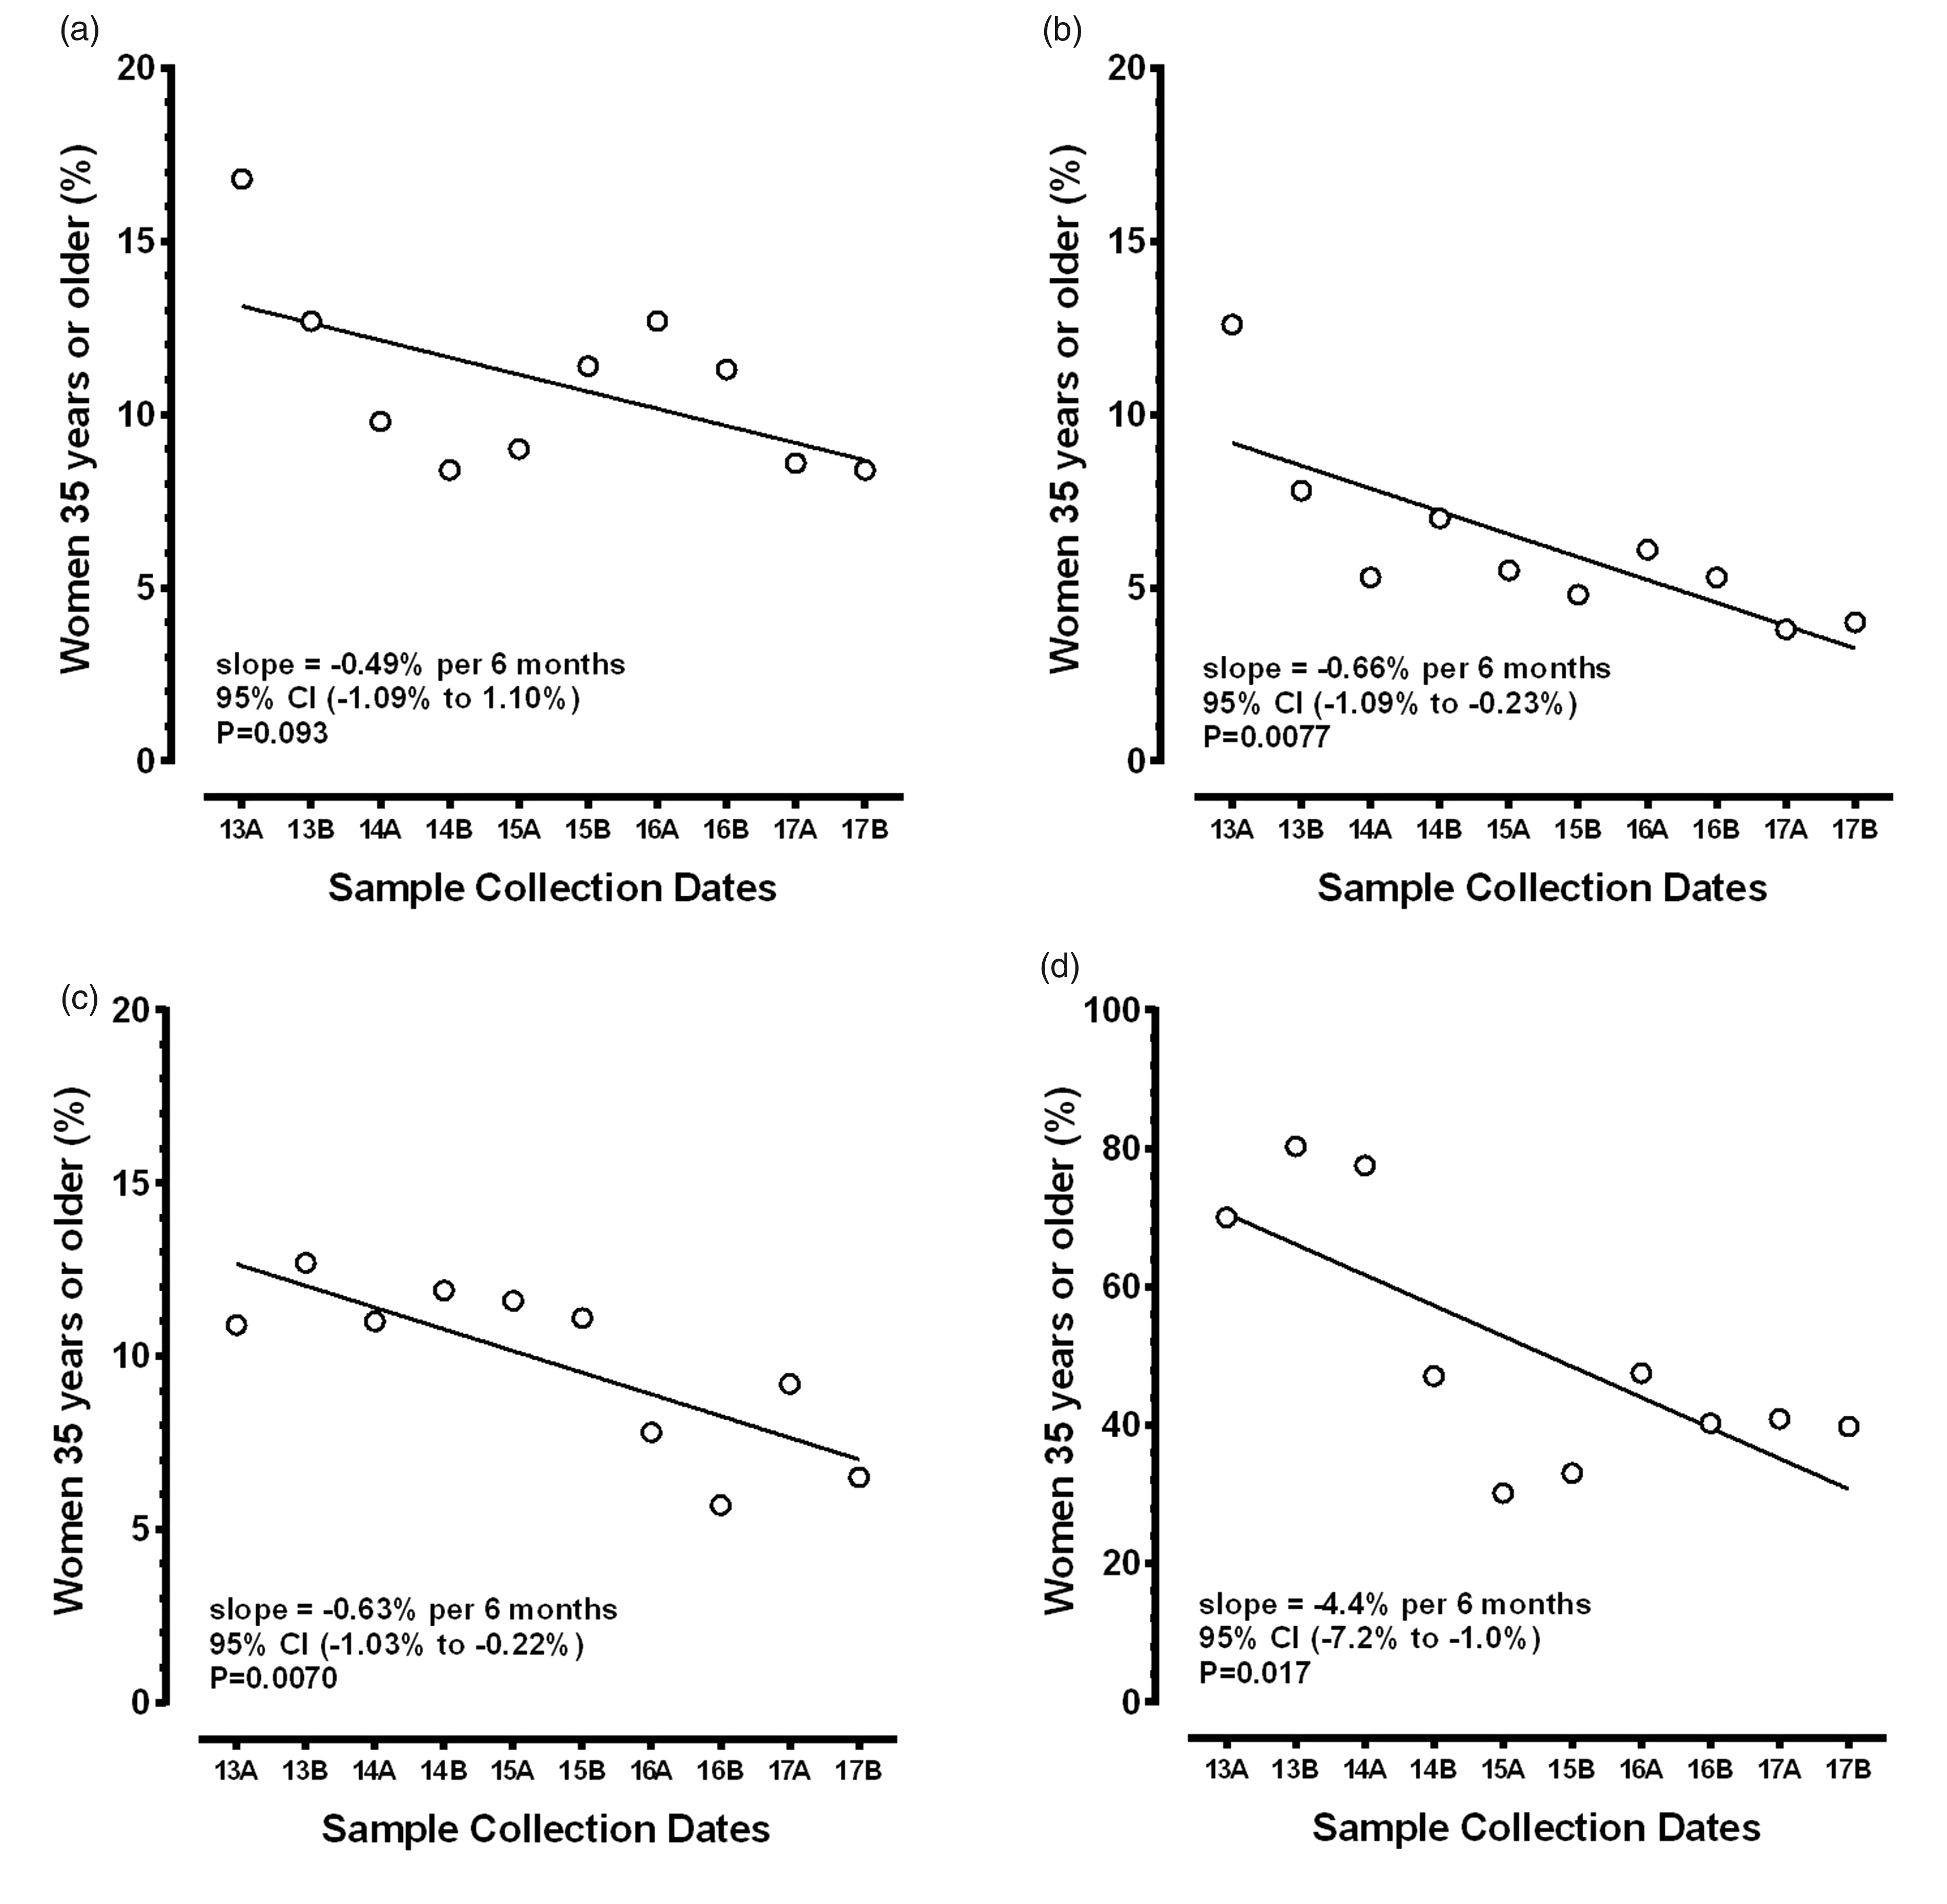
Scatterplots and linear regression for changes in the per cent of women aged 35 and older over time, stratified by maternal serum screening test. The horizontal axis shows the 10 six-month intervals while the vertical axis shows the percentage of women aged 35 and older. (a) to (d) shows those results for the Integrated, Combined, Quadruple, and AFP Only tests, respectively. The slope of the fitted line is in per cent decrease per six-month interval. All the reductions were statistically significant, except for the Integrated test.
Modelling the impact of the percentage of pregnancies in women aged 35 and older on the detection rate, false positive rates, and the positive predictive value for three serum-based screening tests for Down’s syndrome.
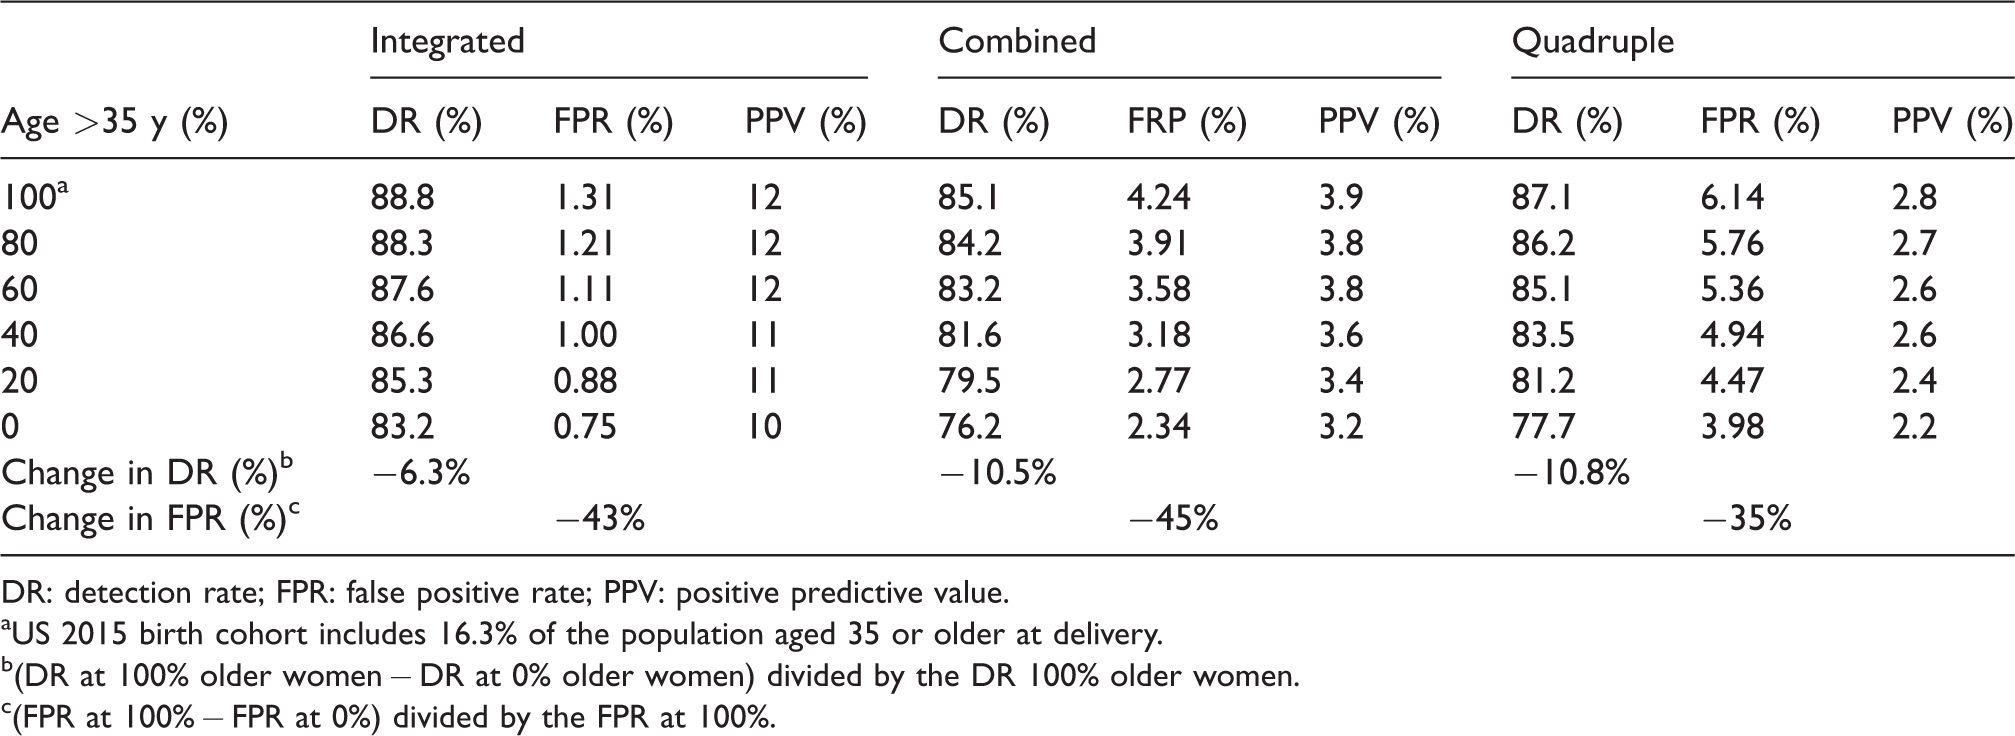
DR: detection rate; FPR: false positive rate; PPV: positive predictive value.
aUS 2015 birth cohort includes 16.3% of the population aged 35 or older at delivery.
b(DR at 100% older women − DR at 0% older women) divided by the DR 100% older women.
c(FPR at 100% − FPR at 0%) divided by the FPR at 100%.
Figure 2 shows the percentage of women screened using each test performed, stratified over time (data in Supplemental Table 1). If the same percentage of women chose the test every six months, those observations would fit a horizontal line at 10% (assuming the total numbers of women tested were equally distributed in each of the 10 time intervals). The Integrated and Combined tests had statistically significant reductions in the percentage choosing those tests over time. In contrast, the Quadruple test had a relatively steady percentage over the 10 intervals. As might be expected, the AFP Only percentages increased significantly over time, as more women opted for cfDNA testing as their primary screen, because such testing does not screen for ONTD. For AFP Only, the number of tests had an obvious outlying value in 2015A, when the competing trial of cfDNA testing was at its peak enrolment. Once that project was completed, most of the participating sites reverted back to their original methods of serum screening (Integrated and Quadruple), which already included a second trimester sample. For these reasons, that data point was censored from the regression analysis.
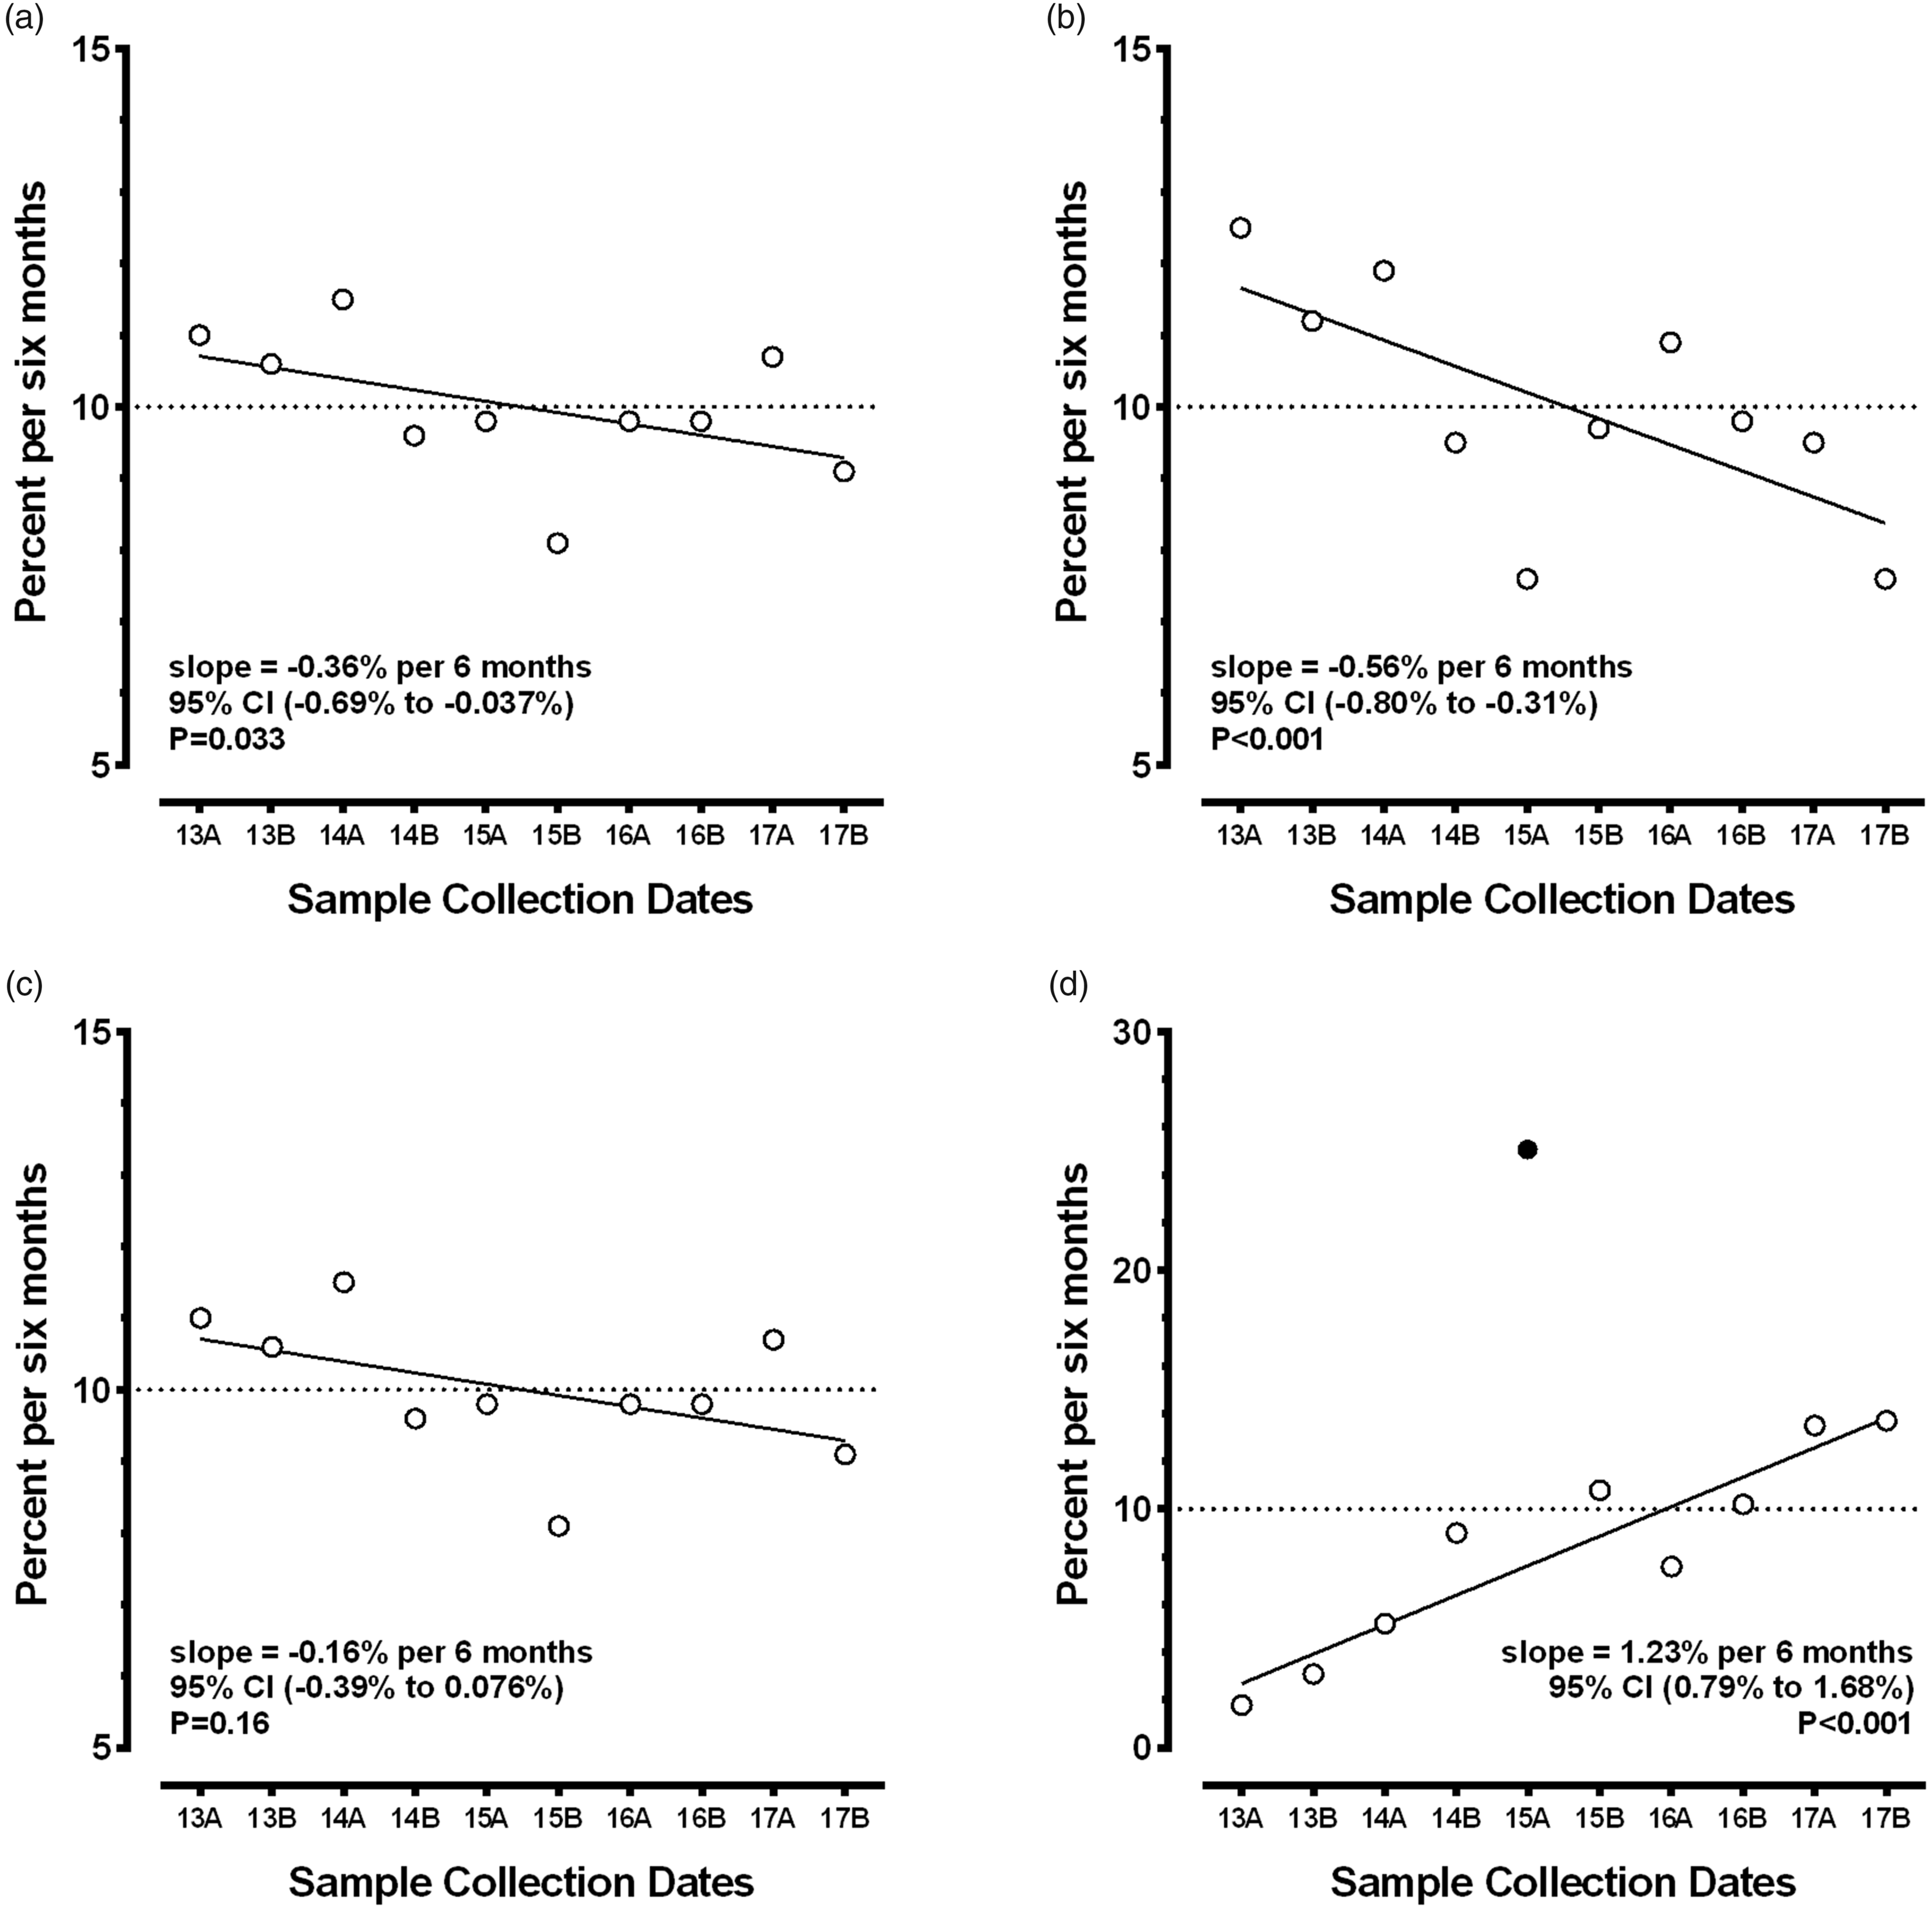
Scatterplots and linear regression for changes in the percentage of women screened over time, stratified by maternal serum screening test. The horizontal axis shows the 10 six-month intervals while the vertical axis shows the percentage of women screened in each six-month interval. The dotted line shows the expected rates if there was no effect (all 10 intervals at 10% of the total). (a) to (d) shows those results for the Integrated, Combined, Quadruple, and AFP Only tests, respectively. The slope of the fitted line is the change in the percentage of women tested per six-month interval. Only the slope for the Quadruple test was not statistically significant. The 2015A observation for the AFP Only test (d) has a censored observation (filled circle). The rationale for censoring is described in the ‘Results’ section.
Figure 3 shows the screen positive rates for the four tests (data in Supplemental Table 2). Although the three multiple marker screening tests show a general lowering of the screen positive rate for Down’s syndrome over time, none reached statistical significance. In contrast, the AFP Only screen positive rate for ONTD remained quite constant at 2.8% (p = 0.68). Among the women choosing an Integrated or Quadruple test, the screen positive rate for ONTD was also 2.8%.
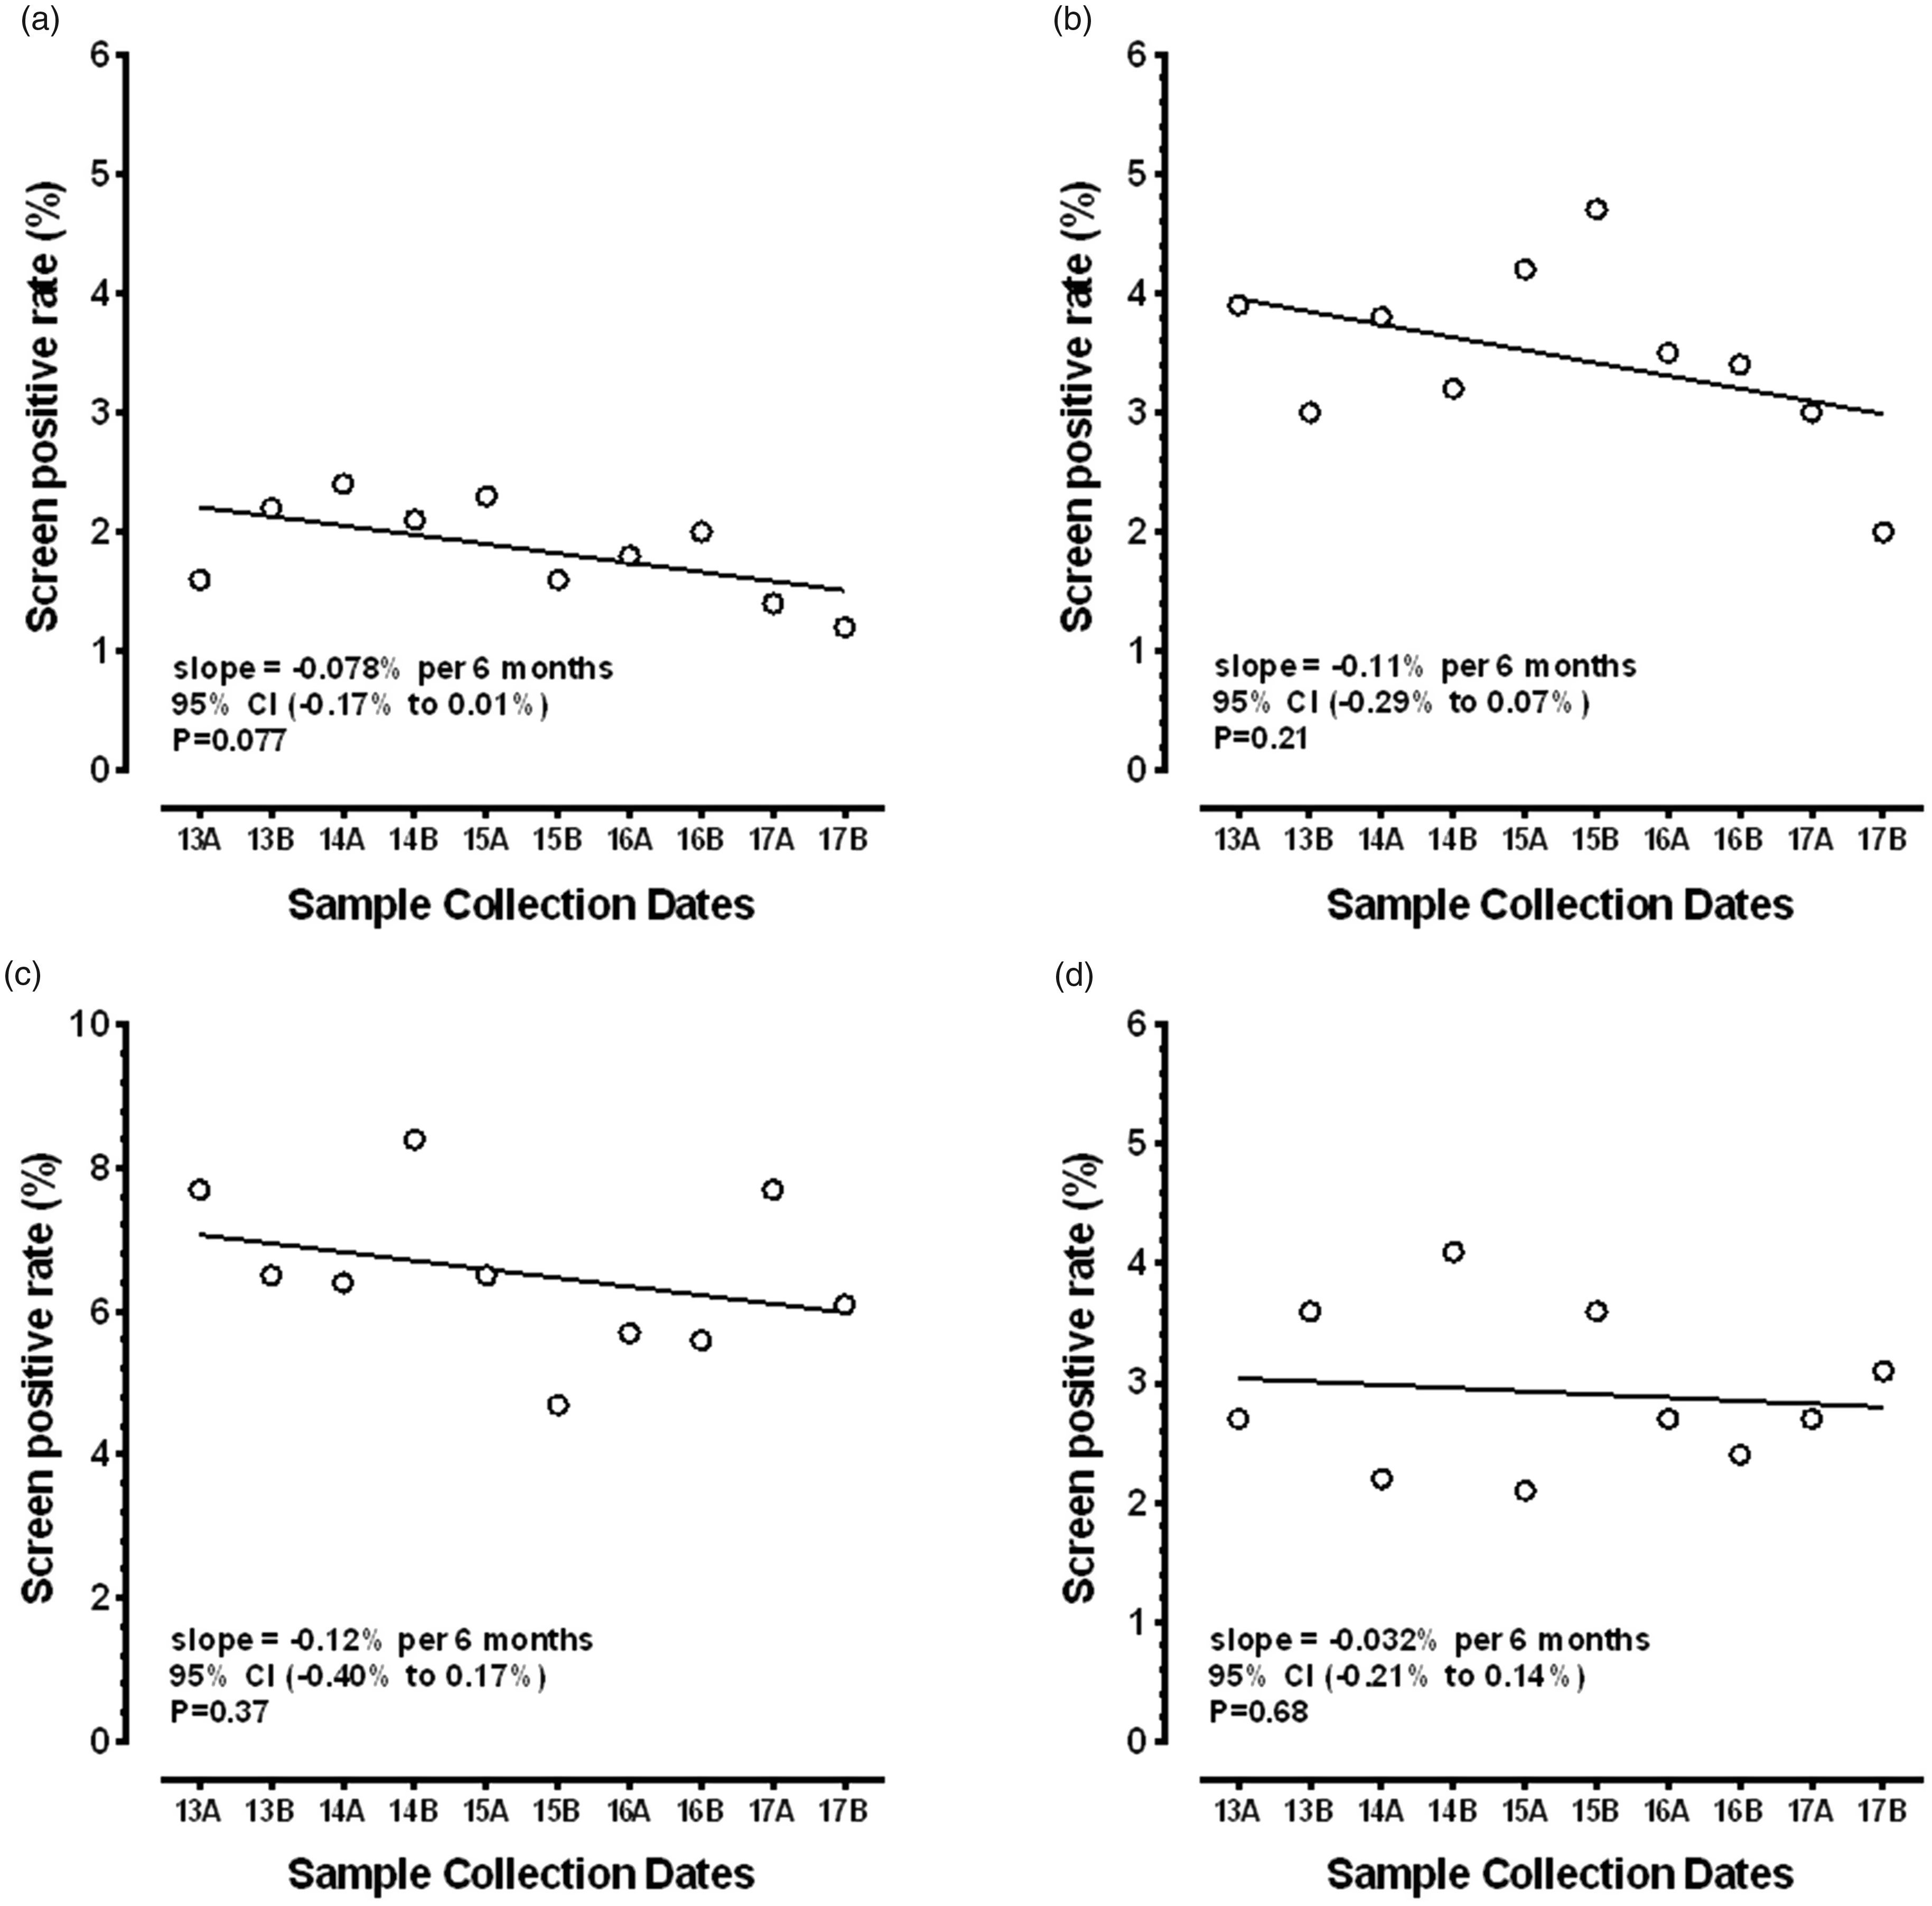
Scatterplots and linear regression for changes in the screen positive rates, stratified by maternal serum screening test. The horizontal axis shows the 10 six-month intervals while the vertical axis shows the screen positive rates. (a) to (d) shows those results for the Integrated, Combined, Quadruple, and AFP Only tests, respectively. The slope of the fitted line is the change in the screen positive rate per six-month interval (e.g. for Integrated testing, there was a 0.078% reduction this test every six months). For (a) to (c), the screen positive rate is for Down’s syndrome; for AFP Only, it was for ONTD. None of the changes reached statistical significance.
At least some of the reductions in the screen positive rates found for the multiple marker tests (Figure 3) are likely to have been due to the reductions in the observed proportions of women aged 35 and older being screened over time (Figure 1). Using the 2015 US birth records as the baseline population 21 (Supplemental Table 3), the 3,978,497 recorded births would include an estimated 7961 Down’s syndrome births in the absence of prenatal diagnosis and selective termination (term risk 1:500). Overall, 16.3% of all women would be aged 35 years or older at the time of giving birth and account for 57.8% of the Down’s syndrome births (term risk 1:140). Among the deliveries in the 83.7% of women under age 35, the remaining 42.2% of Down’s syndrome births would occur (term risk 1:990). If all women aged 35 and older were to opt out of serum screening, the prior population risk of Down’s syndrome would, on average, be cut in half (from 1:500 to 1:990). This lower prevalence among the remaining population would result in reductions in both the false positive and detection rates for all serum-based screening tests, as maternal age is used to determine the a priori risk for all multiple marker screening tests.
The distribution of women aged 35 and older from the first year of data (2013) was then compared with that collected in the last year (2017), to determine whether there was an equal reduction for each of the one-year maternal age intervals. Based on log-linear regression of the reduction in numbers of women screened at each age (e.g. 35, 36) in these two time periods for the three multiple marker screening tests, we found that the percentage reductions for a given test were relatively constant over the one-year age intervals (Supplemental Figure 1). For example, when examining the reduction for the Integrated test, the reductions for 35-, 36-, 37-, and 38-year-old women were 63, 60, 60, and 56%, respectively. This finding allows for the use of a single proportional reduction to women aged 35 and older for each of the multiple marker tests. However, the actual percentage reduction differed by the screening test being considered. The Integrated, Combined, and Quadruple tests had average reductions in older women of 55, 78, and 39%, respectively.
We then modelled the impact of reducing the number of women aged 35 and older by steps of 20% from 100% (observed 2015 rates) to 0% (no women over age 35) on the detection and false positive rate, using the baseline US 2015 birth cohort. The numbers of women at each maternal age of 35 and older were reduced by the proportions provided above for each test. For these analyses, the numbers of women under age 35 remained constant. Table 1 and Figure 4 show the resulting overall detection and false positive rates for the three screening tests at the earlier specified Down’s syndrome risk cut-off levels. The smallest impact on the detection rate was for Integrated testing (88.8 to 83.2%), while there were larger changes for the Combined (85.1 to 76.2%) and Quadruple (87.1 to 77.7%) tests. As screening tests improve, the impact of changing the underlying age distribution is lessened. False positive rates dropped by 43, 45, and 35%, respectively. There were only modest reductions in the positive predictive values as fewer older women participated. Although the prior risk is reduced as older women decline screening more frequently, the likelihood ratio (detection rate/false positive rate) increases because the detection rates drop more slowly than the corresponding false positive rates.
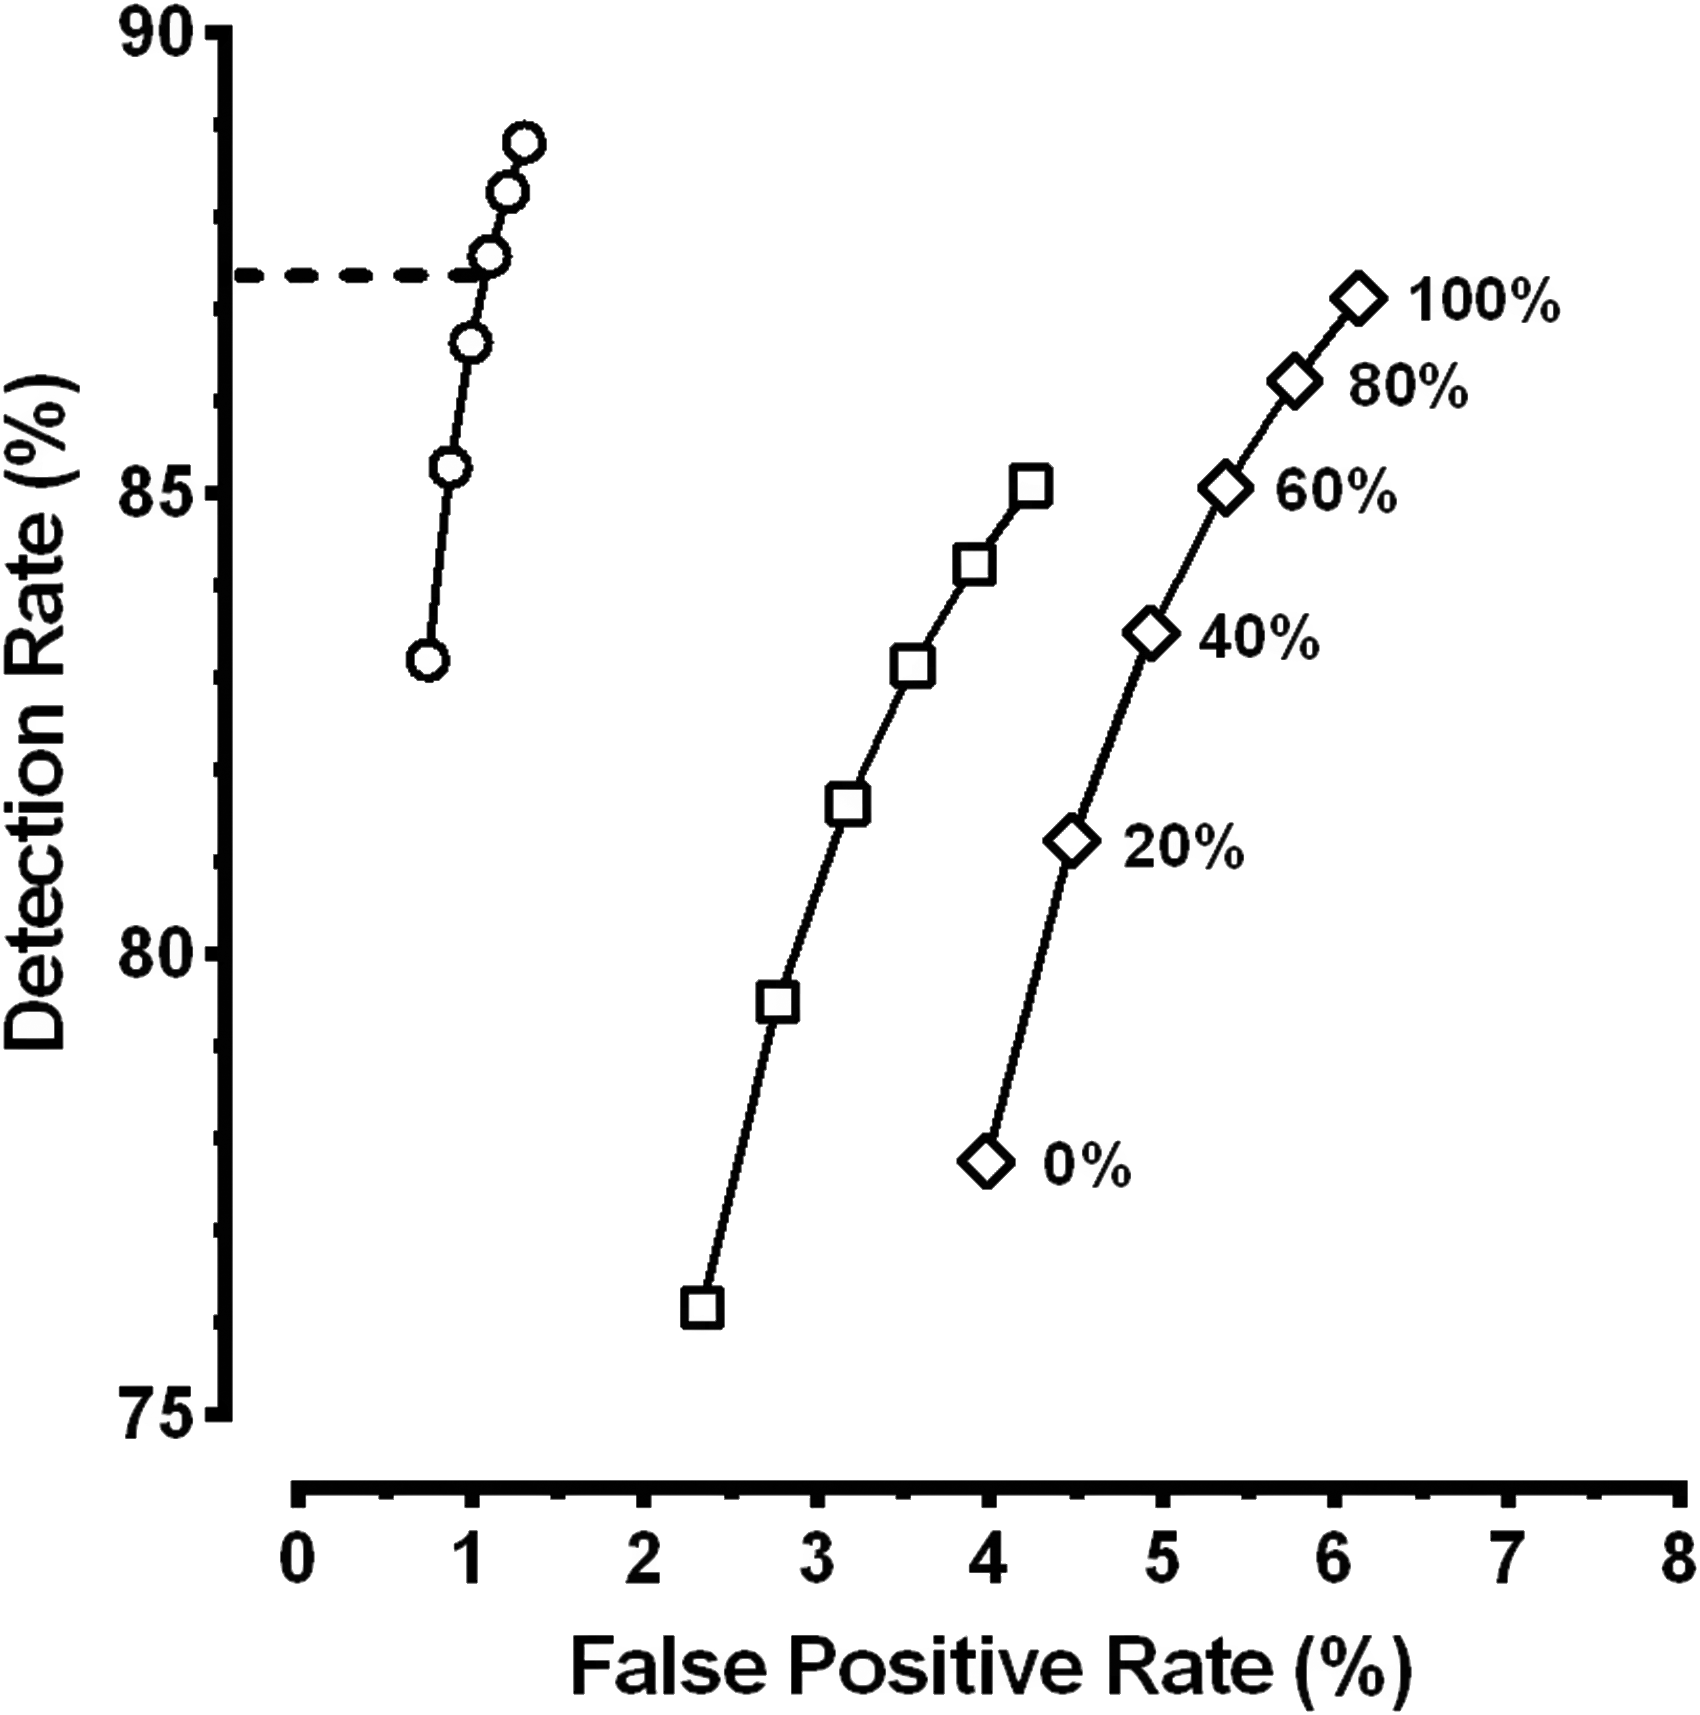
Relationship between the Down’s syndrome detection rate and false positive rate for three serum screening tests at various proportions of women aged 35 and older. The three lines, from left to right show the relationship for the Integrated (open circles), Combined (open squares), and Quadruple (open diamonds) serum screening tests. The six observations for each test show the proportion of women aged 35 and older (100 to 0%) from the 2015 US birth cohort used for modelling performance. The horizontal dashed line corresponds to our observed reduction of 43% in women aged 35 and older for the Integrated test. The 43% reduction in the number of women aged over 35 is plotted as a line at 57% (100–43). According to our modelling, this lower rate of women 35 and older having testing corresponds to a Down’s syndrome detection rate for the Integrated test of 87%.
These predicted reductions in the false positive rates due to changes in the proportion of women aged 35 and older (Figure 4) can be compared with our observed reductions in participation by older women with Integrated testing (Figure 1, Supplemental Table 1: 14.9% in 2013 and 8.5% in 2017; a 43% reduction). Using Figure 4, that 43% reduction in women aged 35 and older should have produced a drop of about 16% in the false positive rate (from a modelled 1.31 to 1.10%). Our observed screen positive rate was reduced from 1.9% in 2013 to 1.3% in 2017, a 32% reduction (Supplemental Table 2). Although our observed reduction was slightly larger (and our observed screen positive rates slightly higher) than that found via modelling, the changes are consistent with the reduction in women aged 35 and older choosing such screening being the primary cause. The modelling (Figure 4, Table 1) also allows us to estimate that our Down’s syndrome detection rate is slightly reduced to 87%.
Discussion
This study, for the first time, documents the falling proportion of women aged 35 and older choosing serum screening for Down’s syndrome in a US hospital-based laboratory and its subsequent impact on the screen positive rates and detection rates. Over the last five years, our screening programme has found that the proportion of women aged 35 and older has dropped by 43 and 63% from 2013 to 2017 for those choosing Integrated or Combined screening, with associated reductions in the respective screen positive rates. Modelling indicates that the reduction in older women choosing screening is likely to explain the falling screen positive rates and that the detection rates are lower than most programmes are probably quoting in informational materials. For example, most programmes offering Integrated screening state a Down’s syndrome detection rate of about 90% for a 2–3% false positive rate. Our programme’s screen positive rate for Integrated screening dropped from 1.9% in 2013 to 1.3% in 2017 (a fall of 32%). With this change in demographics, modelling suggests that our associated detection rate dropped from 89% to about 87% (Figure 4).
The reduction in women aged 35 and older choosing serum screening is probably due to the introduction of cfDNA screening beginning in 2011. In 2012, the American College of Obstetrics and Gynecology recommended that cfDNA testing be offered as a secondary screening test to women at ‘high risk’ of aneuploidy, including those aged 35 or older at delivery.13,18 This is in conflict with their 2016 recommendation that all testing modalities should be offered regardless of age. 18 Their reasoning may include the argument that women aged 35 and older were more likely to have invasive testing as their first prenatal test, and so choosing cfDNA as an alternative for women is safer, nearly as reliable, and relatively cost neutral. This would not be the case for younger women, as few younger women choose invasive testing as their primary prenatal test. In the US, many insurance companies are now routinely reimbursing for cfDNA testing in ‘high risk’ women with, at most, modest out-of-pocket expenses. It is likely that this trend will continue in the near future, and serum screening programmes will continue to see a drop in the percentage of women aged 35 and older opting for multiple marker serum screening, as well as an overall drop in number of pregnancies screened.
Serum screening laboratories that see similar impacts may consider taking action. One such action would be to encourage using multiple marker tests that are less dependent on maternal age, such as the Integrated or Sequential test, in place of the Combined or Quadruple test. Another would be to lower the Down’s syndrome risk cut-off such that the current screen positive rate is more similar to that found before cfDNA testing was widely available. Our programme, for example, had a 1.9% screen positive rate for the Integrated test in 2013. Given our current distribution of maternal ages and Down’s syndrome risks, our second trimester cut-off of 1:110 could be reduced to about 1:280 to regain that former rate. This would result in an increased detection rate to a level near that of 2013 (about 90%). Although this would restore the higher false positive rate, it is counterbalanced by the new widespread practice to offer cfDNA as a secondary screening test before invasive diagnostic testing. If cfDNA is selected to follow a screen positive serum screening result, the invasive testing rate is likely to remain very low.
This study has limitations. During the second half of 2014 and the first half of 2015, we were offering cfDNA screening in select practices in Rhode Island to women at any age at no cost to the patient or their insurance company. This was accomplished under a study protocol funded by Natera, Inc. (San Carlos, CA, clinical trials.gov NCT01966991). 20 During those years, the serum screening programme parameters may have been affected, and we attempted to account for related outlying observations. In addition, the primary care providers probably felt more comfortable with offering and interpreting cfDNA testing, and the study could have accelerated the uptake of such testing among older women in Rhode Island in the following years. These observations should be independently confirmed by individual laboratories prior to making any changes in their screening cut-off risks or protocols. Lastly, there are other variables that may account for changes in the screen positive rate that are not related to maternal age. These include variations in assay results relative to the gestational age-specific reference values (medians) that are used to convert raw results to MoMs. Although we closely monitor the individual assay median MoM levels, they are occasionally higher or lower than our acceptable limits, and the medians need to be recomputed. These systematically higher (or lower) MoM levels will shift the computed Down’s syndrome risk and have the potential to change the screen positive rate by as much as a few tenths of a per cent over a six-month interval.
Conclusions
With the introduction of cfDNA screening for Down’s syndrome and the associated professional recommendations, an increasing proportion of women aged 35 and older in the US are opting out of multiple marker serum screening for Down’s syndrome. Those decisions are affecting the screen positive rates that many laboratories use for epidemiological monitoring. 23 Serum screening programmes should be aware of this phenomenon and might consider encouraging the use of Integrated or Sequential models that are less dependent on maternal age and/or modifying their risk cut-off as a way to maintain Down’s syndrome detection as the proportion of women aged 35 and older in the serum screening population declines.
Supplemental Material
MSC797961_Supplemental material - Supplemental material for Fewer women aged 35 and older choose serum screening for Down’s syndrome: Impact and implications
Supplemental material, MSC797961_Supplemental material for Fewer women aged 35 and older choose serum screening for Down’s syndrome: Impact and implications by Geralyn Lambert-Messerlian and Glenn E Palomaki in Journal of Medical Screening
Footnotes
Declaration of conflicting interests
The author(s) declared the following potential conflicts of interest with respect to the research, authorship, and/or publication of this article: Drs Messerlian and Palomaki supervise the Division of Medical Screening and Special Testing at Women & Infants Hospital in Providence, Rhode Island which provides prenatal screening services.
Funding
The author(s) received no financial support for the research, authorship, and/or publication of this article.
Supplemental material
Supplemental material is available for this article online.
References
Supplementary Material
Please find the following supplemental material available below.
For Open Access articles published under a Creative Commons License, all supplemental material carries the same license as the article it is associated with.
For non-Open Access articles published, all supplemental material carries a non-exclusive license, and permission requests for re-use of supplemental material or any part of supplemental material shall be sent directly to the copyright owner as specified in the copyright notice associated with the article.