
Abstract
Objectives
Incidence-based mortality quantifies the distribution of cancer deaths and life-years lost, according to age at detection. We investigated the temporal distribution of the disease burden, and the effect of starting and stopping ages and interval between screening mammography examinations, on incidence-based mortality.
Methods
Incidence-based mortality was estimated using an established breast cancer simulation model, adapted and validated to simulate breast cancer incidence, screening performance, and delivery of therapies in Canada. Ten strategies were examined, with varying starting age (40 or 50), stopping age (69 or 74), and interval (1, 2, 3 years), and “No Screening.” Life-years lost were computed as the difference between model predicted time of breast cancer death and that estimated from life tables.
Results
Without screening, 70% of the burden in terms of breast cancer deaths extends between ages 45 and 75. The mean of the distribution of ages of detection of breast cancers that will be fatal in an unscreened population is 61.8 years, while the mean age of detection weighted by the number of life-years lost is 55, a downward shift of 6.8 years. Similarly, the mean age of detection for the distribution of life-years gained through screening is lower than that for breast cancer deaths averted.
Conclusion
Incidence-based mortality predictions from modeling elucidate the age dependence of the breast cancer burden and can provide guidance for optimizing the timing of screening regimens to achieve maximal impact. Of the regimens studied, the greatest lifesaving effect was achieved with annual screening beginning at age 40.
Keywords
Introduction
In developing strategies for reducing the burden of death and morbidity associated with breast cancer, it is useful to understand the origin of that burden, namely: At what age are breast cancers that ultimately lead to death, detected? and How can we intervene most effectively to reduce that burden? One metric for this burden is incidence-based mortality (IBM),1,2 where the number of deaths due to breast cancer or the number of life-years lost (a measure of premature mortality) is expressed versus the age at which the disease surfaces clinically or is detected by screening.
We have recently completed an evaluation of the effects of different screening scenarios, i.e. the ages to begin and discontinue mammography screening and the interval between screens, on health outcomes, cost-effectiveness, and cost–utility.3–5 We used a well-established breast cancer model, developed using US data and adapted to the Canadian context. The model allows the impact of screening to be quantified in terms of lives saved (premature breast cancer deaths averted) as well as life-years and quality-adjusted life-years (QALY) saved.
The model also allows the prediction, within a birth cohort, of the age at which each breast cancer would be detected by screening or through clinical finding, and the age at which each woman in the cohort would die from breast cancer or some other cause. In designing an intervention program, it is helpful to understand the distribution of disease burden, i.e. IBM, and how an intervention may affect that distribution. In an analogous manner, the reduction of breast cancer-related deaths or the increase in life-years attributable to screening can be assessed in relation to the age at which cancer was or could have been detected.
Methods
We utilized a version of the Wisconsin Cancer Intervention and Surveillance Modeling Network (CISNET) breast cancer model6–10 which we had previously tailored to the Canadian population. 3 The model is a discrete event simulation where a large birth cohort (in this case two million women) moves through life. Events are triggered by random number selections with weightings for initiation of a breast cancer, its growth rate, hormone and HER2 receptor status, detection by screening or clinically, etc., all calibrated such that average values match empirical data for these variables. Once a breast cancer is initiated in the model, its growth follows a Gompertz-type function, with various sizes used as surrogates for progression of the cancers from in situ, to locally invasive, regional, or distant metastases. For example, for treatment, the model uses a cure/no cure approach, with a cure rate that has been calibrated to match 10-year survival. The model also incorporates components reflecting cancers with limited malignant potential. 8 The model begins with baseline survival data in the absence of treatment and modifies survival on the basis of data derived from the meta-analysis of the chemotherapy trials conducted by the Early Breast Cancer Trialists’ Collaborative Group.11–15 Patients are either cured or not cured (die from breast cancer) and, in the model, are also exposed to competing causes of death. For those not cured, the cancers continue to grow until they reach a specified size that is used as a surrogate for the point of death. Women without breast cancer eventually die from other causes, again according to life-table-weighted random number selection. The model reflects the performance of modern digital mammography, and includes use of trastuzumab as part of the therapeutic regimen, 3 with survival improvements based on the report by Howlader et al. 16 In addition, we updated the sensitivities and specificities for screening mammography, based on the data from the NCI’s Breast Cancer Surveillance Consortium (BCSC) in the US 6 and from the Screening Mammography Program of British Columbia (SMPBC). 17
The model incorporates four major components: (1) initiation, growth, and progression of a breast cancer, including its characteristics; (2) detection clinically or through screening; (3) response to therapy; and (4) death of cohort members by causes other than breast cancer. These are more fully described in publications on the University of Wisconsin CISNET Model.6–10 Inputs are either applied directly in the model, or are used indirectly to calibrate model outputs, such as stage-specific incidence and mortality, to empirical data. Some key aspects of the model and input variables, as well as identification of the source of data are summarized in Table 1. Data are either applied directly in the model (D in Table 1), or used indirectly (I) in an iterative calibration to match model outputs such as incidence, stage distribution, or mortality to empirical data.6–10,19
Summary of inputs to the model. Sources of the input data are also indicated.
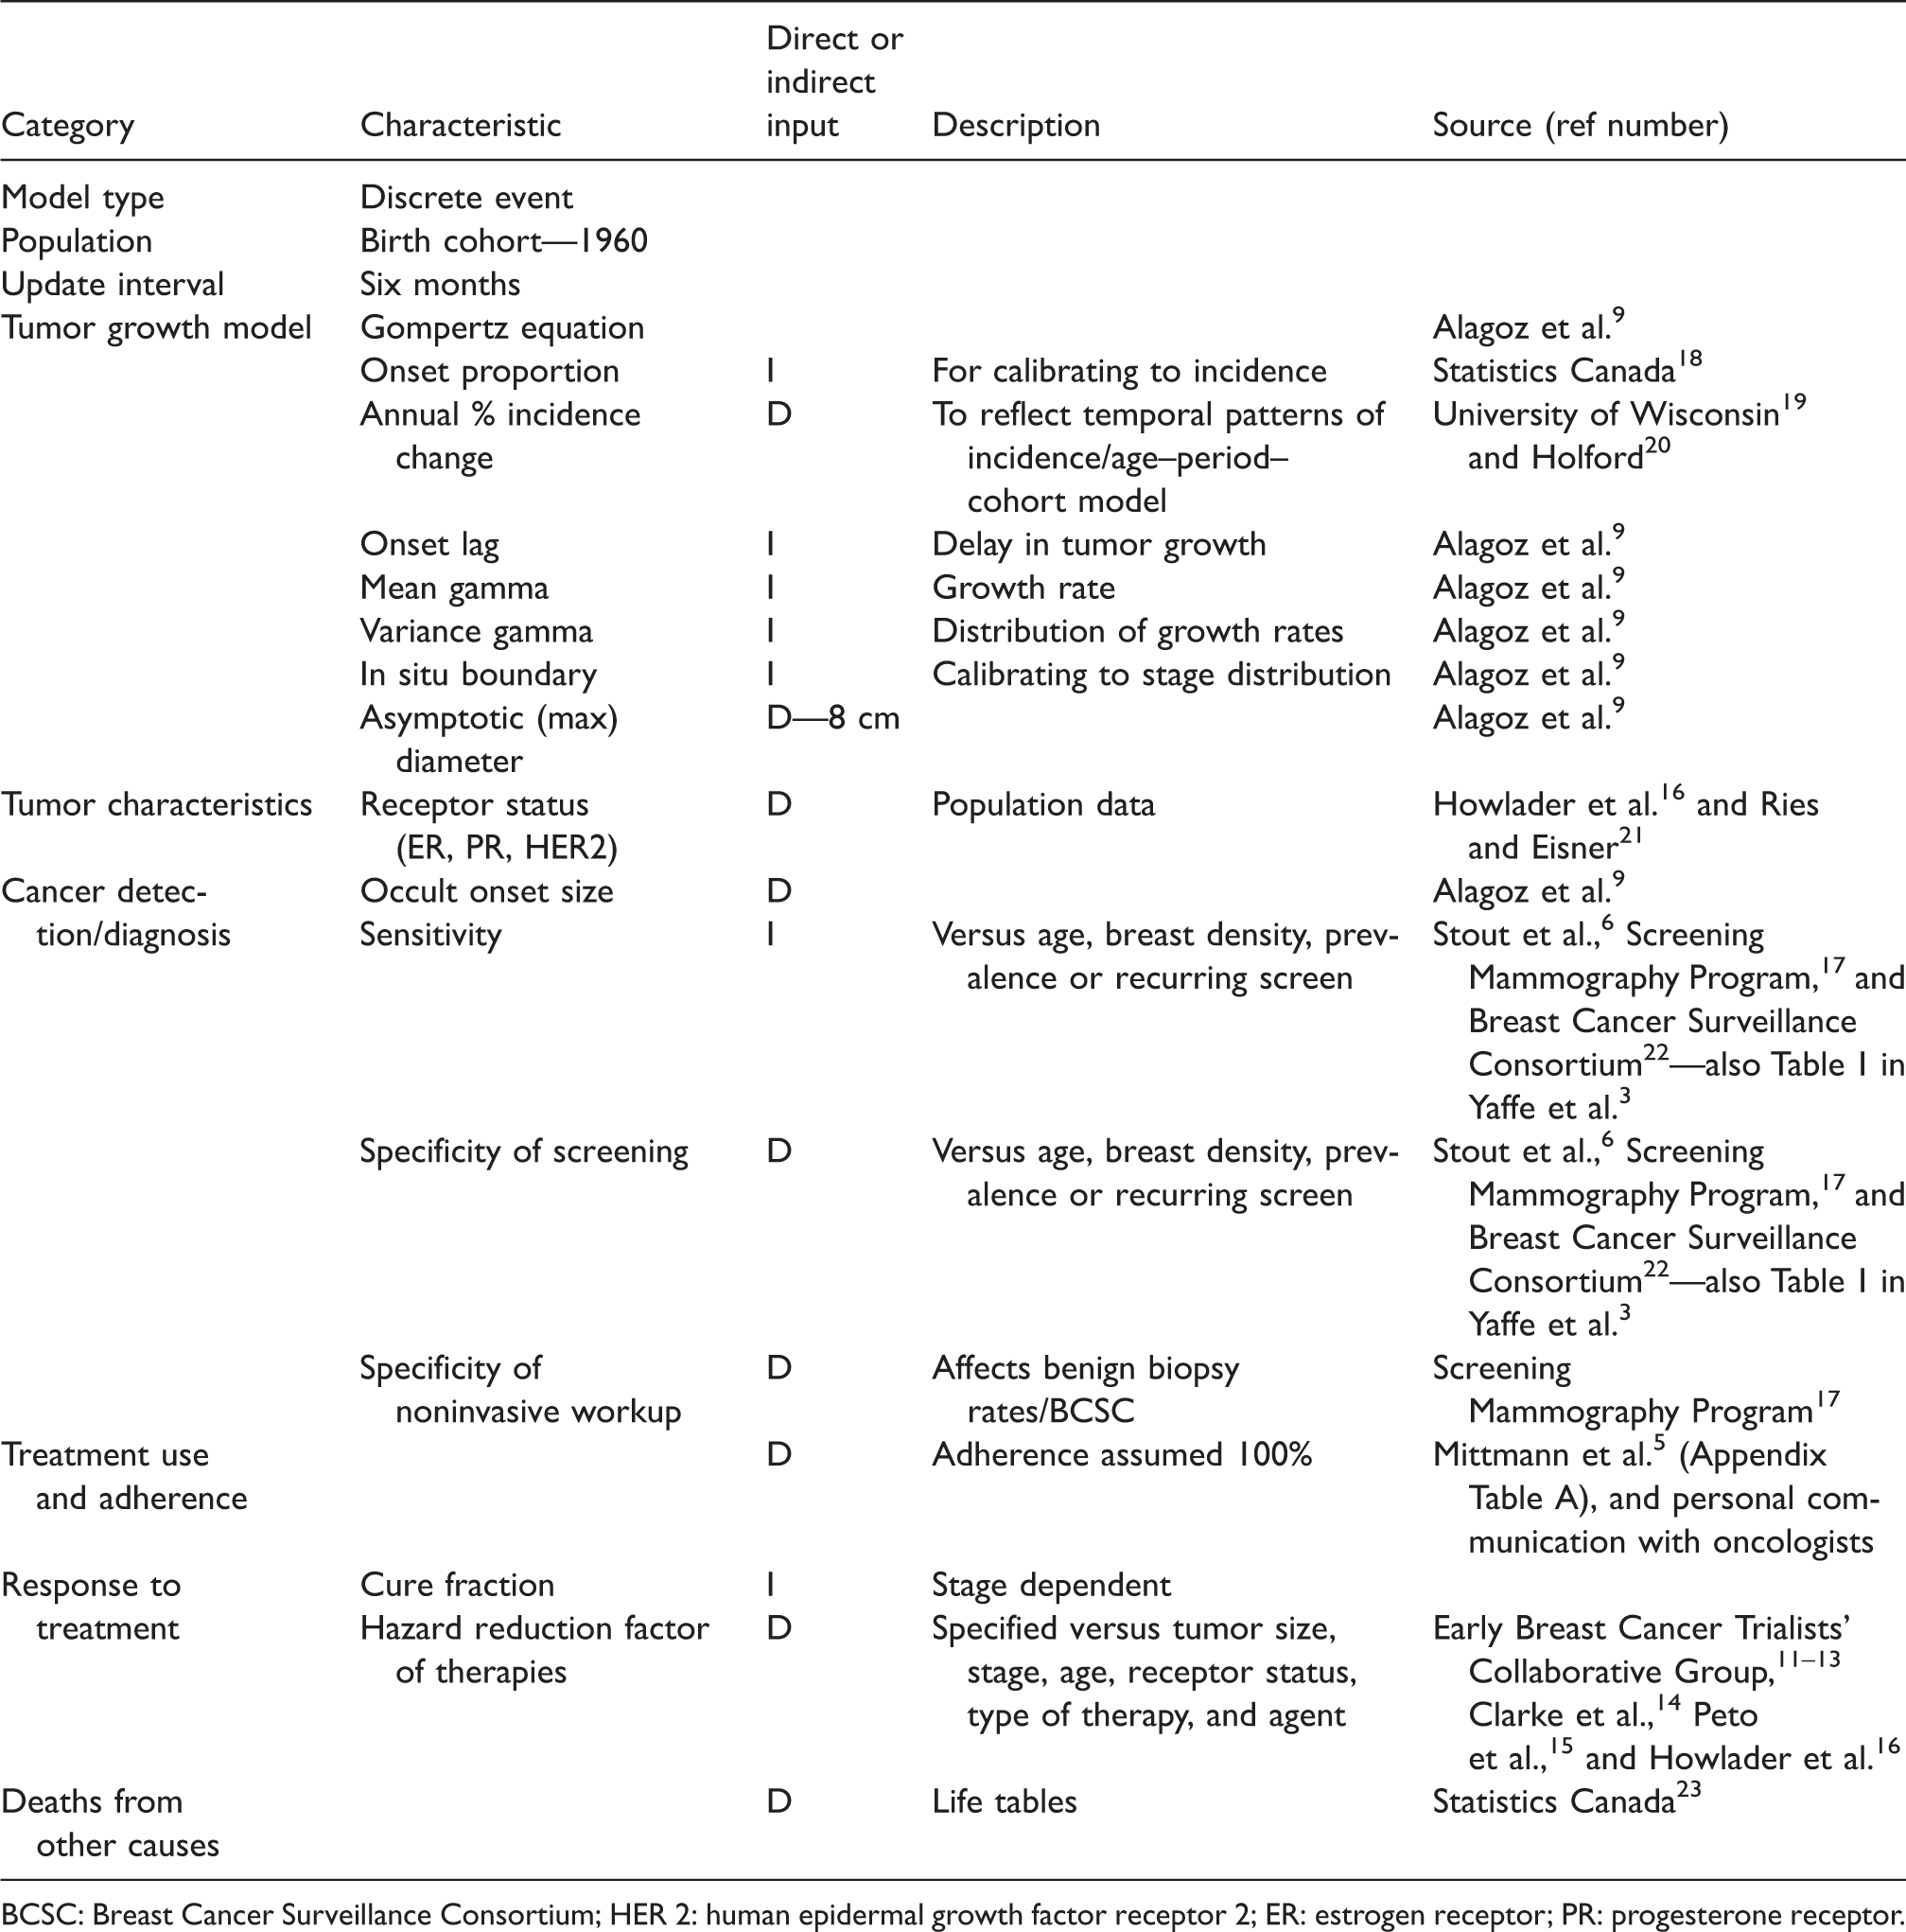
BCSC: Breast Cancer Surveillance Consortium; HER 2: human epidermal growth factor receptor 2; ER: estrogen receptor; PR: progesterone receptor.
We validated the model’s fit to the Canadian population in three ways. First, we demonstrated the ability of the modified model to predict age-specific breast cancer incidence in Canada in the absence of screening. Second, we estimated the ratios of detection of ductal carcinoma in situ (DCIS) to invasive cancer and found that these ratios are comparable with those observed in the SMPBC. 17 Finally, we compared the overall stage distribution of detected cancers predicted by the model with that observed in the SMPBC and found that the agreement was good. 3
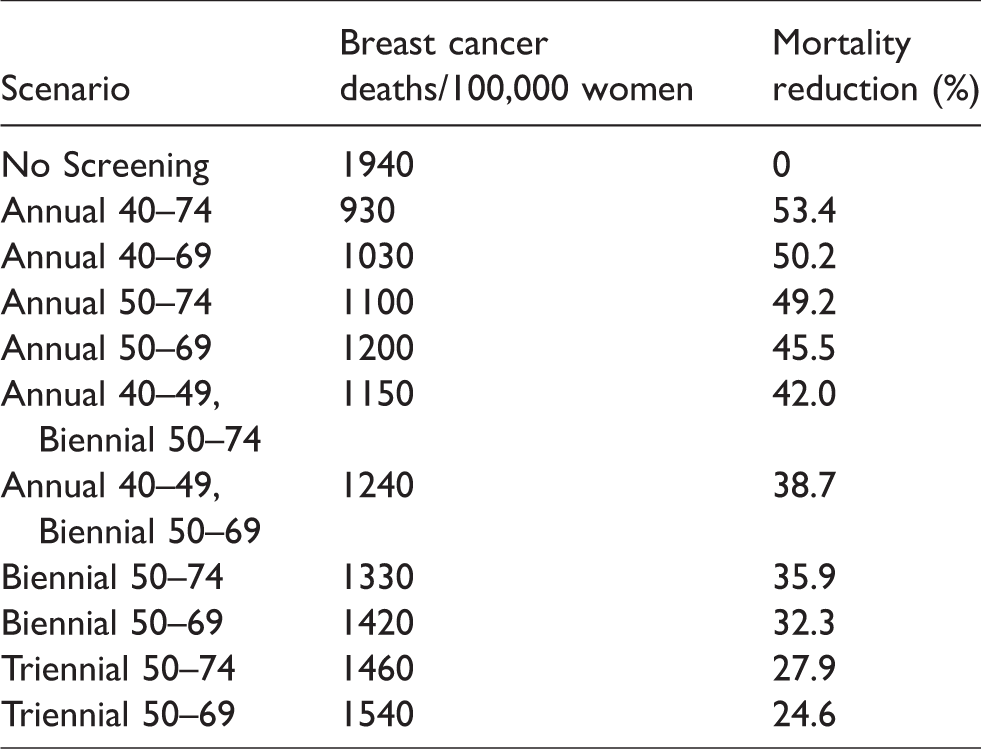
In this study, we applied the model to a hypothetical 1960 birth cohort of two million women, to estimate for each woman who will develop breast cancer the age at which the cancer will either surface clinically or be detected by screening, and the age of death if a breast cancer death ultimately occurs. Utilizing Canadian life table data, 23 we have also estimated the age at which each woman would be expected to die if she did not die of breast cancer. The difference between these ages gives the number of years lost due to premature breast cancer death and is a conventional measure of premature mortality. 24 The model was run for 10 active screening regimens and a no screening scenario (Table 2). These regimens represent screening strategies currently being used in different jurisdictions within Canada, as well as recommendations from the US Preventive Services Task Force and The Canadian Task Force on Preventive Health Care.25–27
Screening scenarios modeled, predicted breast cancer deaths per 100,000 women alive at age 40 and percent mortality reduction relative to No Screening. Full adherence with screening is assumed.
The model recorded the history of each woman by indicating the age at detection of a breast cancer if this occurred, its “stage” at diagnosis (in situ, local invasive, regional involvement, or distant metastasis), the age at death, and whether the death was attributable to breast cancer or another cause. Results were expressed as age- and stage-specific incidence and mortality per 100,000 women alive at age 40. In some examples, results were expressed per 100,000 in the initial cohort when so indicated in the text. The breast cancer mortality reductions were calculated as illustrated in Figure 1. Screened women were “followed” from the age of the first screen until 15 years after the termination of screening for each regimen. Unscreened women were followed over the same time period as for that regimen.
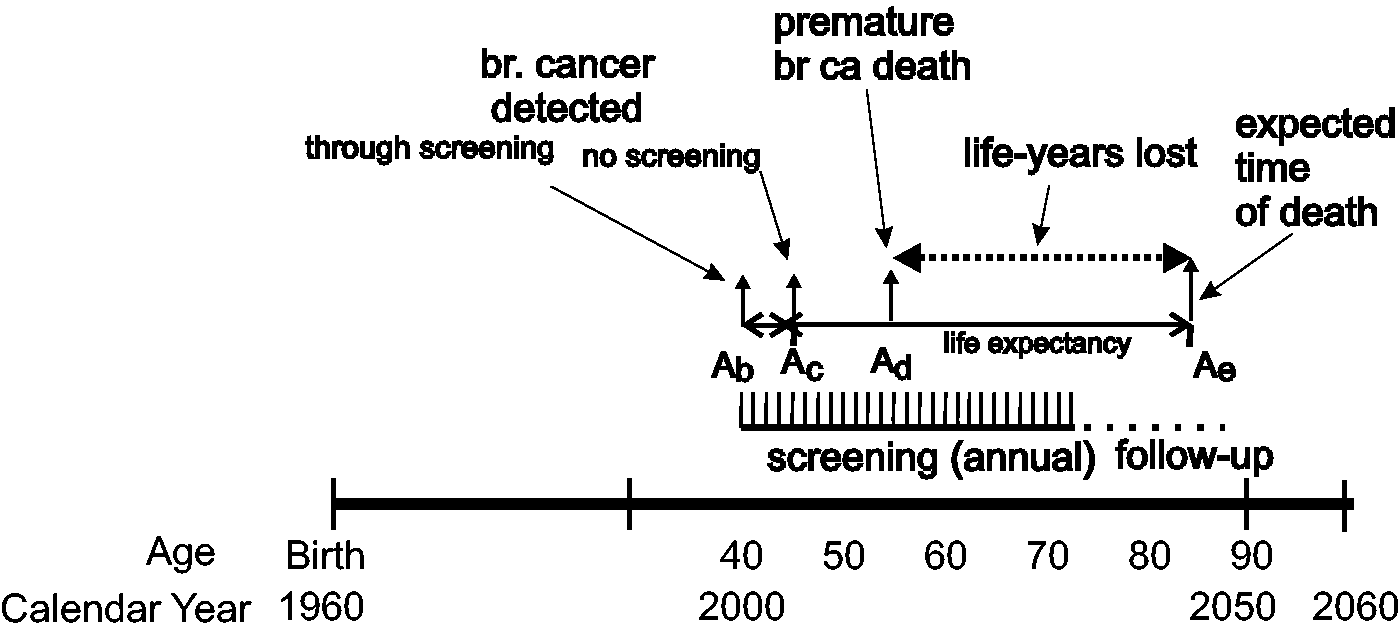
Theoretical effect of earlier detection through screening on years of life saved. In this example breast cancer is detected clinically at age Ac and breast cancer death occurs at age Ad. Screening provides earlier detection at age Ab and woman lives to her normal life expectancy at Ae with difference in life-years of Ae − Ad. In our model, effects of screening are followed to 15 years past time at which screening is terminated.
In the example in Figure 1, the arrow at left symbolizes detection of cancer at age Ab, at a screen for a group of women screened annually from age 40 to 74. In this case, the cancer was successfully treated and the woman lives to her normal life expectancy, i.e. the expected time of death from all causes other than breast cancer, at age Ae using Canadian life tables. 23 The arrow at age, Ac illustrates a more advanced cancer that surfaces clinically and results in a premature breast cancer death at age Ad. The difference between the actual and expected times of death, i.e. (Ae−Ad), provides an estimate of the life-years lost due to breast cancer. Here, follow-up on deaths is from age 40 to age 89 (i.e. 15 years after the age at which screening would end) for both the screened and unscreened women. When this difference is summed over the cohort for all ages at death in the follow-up period, the number of life-years lost to breast cancer, detectable at age Ab with screening or Ac without, can be estimated.
To quantify the limitation or harms associated with mammography screening we also estimated the number of abnormal recalls following screening, and the number of biopsy procedures that were negative for breast cancer, as well as the numbers of screens and women required to be screened per life saved and per life-year saved. These have been reported previously. 4 In the model, benefits and harms were quantified in a common “currency” by expressing both in terms of quality-adjusted years of life lost or gained. Age-specific utility and disutility weighting factors were obtained from published work,28–30 with adjustment for health states following the method of Tosteson et al. 31
It is recognized that some cancers will be overdetected, i.e. detected at screening when they otherwise would not have become clinically apparent before the individual had died due to some cause other than breast cancer. The probability of overdetection is greatest for screening of older women and for DCIS. Treatment of these overdetected (often referred to as overdiagnosed) cancers can be considered a harm. This effect will be included in future analysis because of the very large disparity in estimates of this phenomenon at this time.
Finally, because the model generates histories including cancer stages for individual women, the incidence-based paradigm can also be used to consider the characteristics and outcomes associated with cancers detected at specific times. We examined the predictions at three time points: that of the first screen, one year prior to that, and one year later.
Results
The model predicts that mortality begins to drop shortly after the onset of screening at age 40 or 50, with the number of breast cancer deaths per 100,000 women alive at age 40 dropping from 1940 for unscreened women to 1100 for a cohort screened annually between ages 50 and 74 and to 940 for annual screening from ages 40 to 74 (Table 2). Mortality increases relative to annual screening about two years after a transition from annual to biennial screening at age 50, but remains well below that for an unscreened population. 4 Presumably these fairly rapid changes are due to earlier or later treatment, respectively, of more advanced or rapidly growing cancers occurring because of changes in detectability related to screening. The mortality reduction begins to diminish shortly after the cessation of screening, but persists through the remainder of life, becoming minimal by approximately age 89, 15 years after screening has ceased. For the two screening scenarios mentioned above, the predicted mortality reductions are 49.2 and 53.4%, respectively (Table 2). It must be noted, however, that these numbers correspond to 100% of the cohort participating in screening and adhering to the regimen, and will be lower if there is only partial compliance. Partial compliance can be estimated by a weighted combination of results from women screened in a particular regimen and women who are unscreened.
When the predicted breast cancer deaths are plotted versus the age at which cancer is detected (Figure 2), the IBM demonstrates a prevalence “spike” at the first year of screening (ages 40 or 50). This phenomenon is unrelated to the time at which a woman will die of breast cancer, and reflects the fact that those deaths are attributed to the pool of cancers that had been previously undetected in the cohort, but which are found earlier due to the lead time provided by screening. This spike is followed by a sharp drop in IBM.

IBM. Number of breast cancer deaths (from initial birth cohort of 100,000) versus age at which cancer was detected for No Screening for annual screening from 40 to 74  and for annual and biennial screening from 50 to 74
  ,
,  .
.
An example of the life-years lost, versus the age at which the cancer surfaces or is detected by screening, is shown in Figure 3 for different screening regimens. For the no screening case, these curves express the burden of breast cancer in terms of loss of life. The distributions of breast cancer deaths according to the age at which cancer is detected (regardless of the age at which the death actually occurs) and life-years lost (which does depend on when death occurs) are summarized in Table 3. Also shown in Table 3 are the number of lives saved and the number of women-years of life saved versus the age of detection, which, for each screening regimen, are obtained by subtracting the curve for the deaths and years of life lost, respectively, from that for the unscreened group. While the largest percent reduction in mortality occurs in women aged 65–69, the most life-years saved is observed in women aged 55–59. Absolute and relative distributions of lives and life-years saved versus age at cancer detection are given for annual screening from age 40 to 74 in Figure 4 and the lower part of Table 3.
Number of QALYs lost due to breast cancer death (from initial birth cohort of 100,000) versus age at which cancer was detected for No Screening , for annual screening from 40 to 74 and for biennial screening from 50 to 74 . QALY: quality-adjusted life-year.
Absolute number and age distribution of eventual breast cancer deaths versus age at diagnosis. Also shown are deaths averted through screening, life-years (LY) lost and saved through screening for a birth cohort of 100,000 women. Scenarios compared are No Screening and Annual screening from ages 40 to 74.
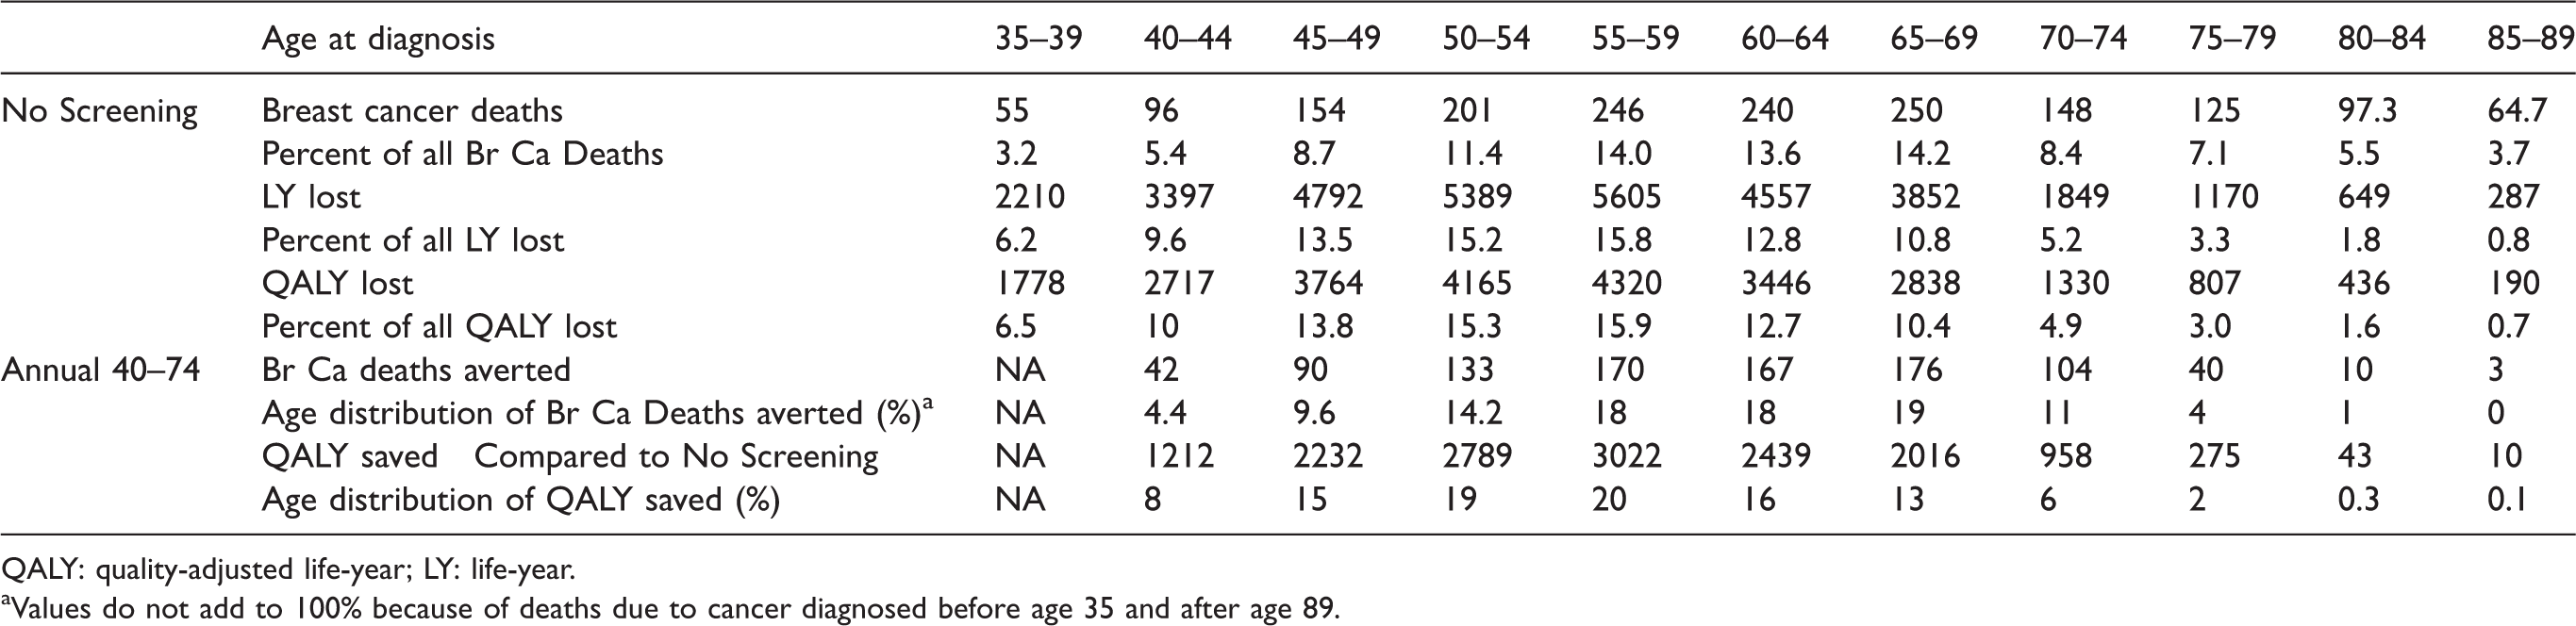
QALY: quality-adjusted life-year; LY: life-year.
aValues do not add to 100% because of deaths due to cancer diagnosed before age 35 and after age 89.
Relative number of breast cancer deaths averted and QALYs gained versus age at breast cancer detection for annual screening from 40 to 74. QALY: quality-adjusted life-year.
We also examined model predictions for the stage distribution of cancers at the time of detection for three points: the year before screening begins, the year of the prevalence screen at either age 40 or 50, and the year after (assuming annual screening). For ages 39, 40, and 41, the proportions of all detected invasive cancers that are predicted by the model to be either regional or distant are 45, 24, and 19%, respectively. For the ages 49, 50, and 51, the values are similar at 46, 24, and 16%.
For an annual screening scenario that begins at age 40, the model predicts that 7% of the women with prevalent invasive cancers detected at age 40 will die due to breast cancer, while 5.2% of those women whose cancers were detected in the next screen at age 41 will die of breast cancer. Although far fewer cancers would surface in the prescreening year at age 39, 21% of them would result in breast cancer death. Similarly, if routine screening is started at age 50, 7.1% of those with breast cancers detected in the prevalence screen at age 50 will die of breast cancer, whereas 4.2% of those with incident cancers at age 51 and 20.4% of those with cancers surfacing at age 49 are predicted to die.
Discussion
Most (70%) of the breast cancer deaths in an unscreened population arise from cancers that appear between age 45 and 74 (Figures 2 and 3). These results, in terms of the shape of the distributions, are in general agreement with those published by the American Cancer Society; 2 however, their calculations are based on SEER data, which cover an undefined mix of screened and unscreened women, while here we have considered a birth cohort with well-defined screening patterns. Additionally, the American Cancer Society data are presented in five-year age bands, which suppresses the peak that we observe at the onset of screening.
Shortly following the point at which screening begins, mortality attributable to cancers detected at that age drops, as evidenced by the difference in area under the curves for screened versus unscreened women (Figure 2). This is preceded by a pronounced spike in mortality attributable to cancers detected in this previously unscreened cohort, at the first round of screening, at ages 40 and 50 in this example. This suggests that many of the cancers detected in the prevalence screen are progressive rather than indolent cancers, and while some of the prevalent cancers are detected sufficiently early to allow successful treatment, others, having passed the period for which a lead time advantage of screening was available, are now destined to be lethal. Comparison of the curves for starting screening at ages 40 and 50 suggests that some of these deaths may be preventable if women begin screening earlier. Considering only the invasive cancers, the model shows a sharp downward stage shift from the year prior to onset of screening, presumably where the cancers detected come from a pool of cancers that have developed at different rates over time, to the initial screen, where there is a mixture of these cancers and earlier-stage or smaller lesions that, at this point in time, can be detected only by imaging. There is a further, smaller, but still marked shift between the initial and second screens, where the cancers detected are mainly those that can be found by mammography. The same phenomenon occurs both for beginning screening at age 40 or 50.
The prediction of breast cancer deaths is consistent with the staging predictions of the model shown in our previous publication. 4 Although the actual number of breast cancers detected in the year preceding screening is lower, the IBM drops dramatically from that year to the time of the prevalence screen, and then further for the second screen. These modeling results imply that the pool of more advanced cancers in the population would be cleared at the prevalence screen and, thereafter, there would be a subsequent downward stage shift (or downward shift of size within a stage) of detected cancers, and an improvement in outcome.
For all the screening strategies studied here, a mortality reduction is associated with detection occurring as early as one to two years after the onset of screening. Given the natural history of breast cancer, this suggests that there is some mortality advantage of earlier detection even for cancers that are more advanced.
The model gives a measure of premature deaths, where the mean age of detection with respect to the number of eventual breast cancer deaths in unscreened women is 61.8 years. When the mortality burden is considered in terms of life-years lost, rather than premature deaths, Table 3 and a comparison of Figures 2 and 3 show that the distribution shifts to lower ages, approximately 40–69 years, with a mean age of 55, reflecting the increased number of years lost when younger women die from breast cancer. Similarly, when the benefits attributable to screening are examined (Figure 4), it is seen that the relative benefit is shifted to earlier age of detection (mean age reduces from 60.5 to 57.3 for annual screening from 40 to 74), when life-years saved, rather than deaths averted, are considered.
We have shown in previous work 4 that more frequent screening detects more breast cancer cases than No Screening and results in fewer breast cancer deaths. In addition, more frequent screening is associated with more recalls of women, who, upon further noninvasive imaging, are found not to have cancer, and more negative biopsies as well as an increased ratio of in situ to invasive cancers detected. In prior modeling analyses, under idealized situations, it was estimated that two negative biopsies would be performed for each life-year gained due to annual screening between ages 40 and 74. 4
Our work has both strengths and limitations. The University of Wisconsin model, as modified for use in the Canadian context, performs quite well in predicting breast cancer incidence in the absence of screening. 3 The model was calibrated using modern empirical data on the sensitivity and specificity of screening mammography versus age and breast density to describe the screening process. Canadian data on utilization of therapies and their efficacy were used wherever available, and no assumptions on the mortality reduction of screening were applied explicitly in the model. In this work we found it informative to analyze birth cohorts. It is straightforward to combine calculations from multiple cohorts to make predictions on populations with arbitrary age distribution. Of necessity, there are limitations in modeling the natural history of breast cancer. Some of the sources of data on therapies are quite old. A balance must be struck between the currency of the data (over time, some therapies are being applied in different ways, and to expanded subsets of patients or a wider range of cancers) and the duration of follow-up available from the trials. Aside from application of probabilities for cancers expressing estrogen, progesterone, and HER2/neu receptors, no attempt has been made to apply further characterization, e.g. by molecular subtype. Furthermore, the progression from in situ to invasive disease has been based strictly on the modeled diameter of the tumor, and this has resulted in some discrepancies between modeled and actual ratios of DCIS and invasive cancers detected by screening. Finally, in the model, the growth rate of cancers was not treated as being age dependent, although there is some evidence that premenopausal cancers may grow more quickly. 32
Conclusion
This work illustrates how presentation of the results from simulation in an incidence-based manner can be helpful in understanding the age distribution of the disease burden of breast cancer. This approach provides insights that may be useful in optimizing the design of an intervention program aimed at reducing that burden. Consideration of the burden and benefit in terms of QALYs rather than lives lost or saved incorporates both benefits and harms into the analysis. The use of QALYs or life-years shifts both the burden of disease and the impact of screening downward markedly in terms of the age at diagnosis. The model estimates that approximately 24% of the QALYs lost to breast cancer (compared with 14% of deaths) are a result of cancers that are detectable between ages 40 and 49, and 23% of the QALYS gained by annual screening between ages 40 and 74 are attributable to cancers detected in women in their 40s. As models become more sophisticated, incorporating such features as cancer subtypes and more detailed data on response to therapy, the incidence-based approach may provide guidance for the design of stratified interventions by identifying opportunities for maximal impact.
Footnotes
Acknowledgments
We are grateful to Statistics Canada and to Dr Michael Wolfson at the University of Ottawa for supplying key incidence data. The content is solely the responsibility of the authors and does not necessarily represent the official views of Statistics Canada, the National Cancer Institute or the National Institutes of Health. We thank the participating women, mammography facilities, and radiologists for the data they have provided for this study. A list of the BCSC investigators and procedures for requesting BCSC data for research purposes are provided at: ![]() .
.
Declaration of conflicting interests
The author(s) declared no potential conflicts of interest with respect to the research, authorship, and/or publication of this article.
Funding
The author(s) disclosed receipt of the following financial support for the research, authorship and/or publication of this article: This work was supported by a contract from The Canadian Breast Cancer Foundation. The University of Wisconsin breast cancer simulation model used in this analysis was also supported by grant number U01 CA152958 from the National Cancer Institute as part of the CISNET. Model input data on the performance of screening mammography was also supported by the National Cancer Institute-funded BCSC grant number UC2CA148577 and contract number HHSN261201100031C. For a full description of U.S. data sources, please see: ![]() . To discuss use of model run data, please contact Dr Yaffe.
. To discuss use of model run data, please contact Dr Yaffe.