
Abstract
Objectives
Diabetic retinopathy screening in England involves labour intensive manual grading of digital retinal images. We present the plan for an observational retrospective study of whether automated systems could replace one or more steps of human grading.
Methods
Patients aged 12 or older who attended the Diabetes Eye Screening programme, Homerton University Hospital (London) between 1 June 2012 and 4 November 2013 had macular and disc-centred retinal images taken. All screening episodes were manually graded and will additionally be graded by three automated systems. Each system will process all screening episodes, and screening performance (sensitivity, false positive rate, likelihood ratios) and diagnostic accuracy (95% confidence intervals of screening performance measures) will be quantified. A sub-set of gradings will be validated by an approved Reading Centre. Additional analyses will explore the effect of altering thresholds for disease detection within each automated system on screening performance.
Results
2,782/20,258 diabetes patients were referred to ophthalmologists for further examination. Prevalence of maculopathy (M1), pre-proliferative retinopathy (R2), and proliferative retinopathy (R3) were 7.9%, 3.1% and 1.2%, respectively; 4749 (23%) patients were diagnosed with background retinopathy (R1); 1.5% were considered ungradable by human graders.
Conclusions
Retinopathy prevalence was similar to other English diabetic screening programmes, so findings should be generalizable. The study population size will allow the detection of differences in screening performance between the human and automated grading systems as small as 2%. The project will compare performance and economic costs of manual versus automated systems.
Introduction
Diabetic Retinopathy (DR) is a common complication of diabetes. It is no longer the leading cause of vision loss in the working age population in England and Wales 1 , probably largely due to the effectiveness of the English National Screening Committee for Diabetic Retinopathy (ENSCDR) programme 2 in identifying those requiring treatment, particularly early treatment, which is effective in preventing visual loss. 1 Over 2.5 million people aged 12 or over have diagnosed diabetes in England, of whom 2.3 million have been offered screening and 1.9 million have been screened. 3 This represents a major challenge for the NHS. Retinal screening is labour intensive, requiring trained human graders, and future numbers will escalate as the prevalence and incidence of diabetes are increasing markedly. 4
In Scotland one automated system achieved very high detection rates (100% for proliferative retinopathy and over 97% for maculopathy) in a large, unselected population attending two regional screening programmes. 5 The system differentiated between those with sight-threatening DR or other retinal abnormalities, and those at low risk. Other systems have since become available, with reported diagnostic accuracy comparable with that of experts,6–12 but these are not currently authorized for use in ENSCDR programmes and their clinical validity and applicability in routine screening remains unclear. Recent work has shown that Optical Coherence Tomography (OCT) imaging is a useful adjunct to colour fundus photography in screening for referable diabetic maculopathy, with the potential to significantly reduce over-referral of cases of macula oedema compared with human assessment of colour fundus images. 13 Some Hospital Services are already incorporating OCT assessment within their NHS Diabetic Eye Screening Programmes (DESP). 14
This paper presents the research methods and analysis plan for a study to quantify the screening performance and diagnostic accuracy of three commercially available automated grading systems, compared with ENSCDR manual grading in diabetic patients undergoing diabetic retinopathy screening in a large sample of real life screening episodes. A sub-set will be validated by an approved Reading Centre. The health economics of automated versus manual grading will provide a key decision-making tool to determine whether and how automated screening should take place for diabetic retinopathy in the future. We will also evaluate the health economics of including OCT pathways within the DESP, which may further improve screening performance.
Study Design and Methods
Study population
This observational retrospective study is based on data from 20,258 consecutive diabetes patients aged 12 or older who attended the annual DESP of the Homerton University Hospital in London between 1 June 2012 and 4 November 2013. Following ENSCDR guidelines, 142,018 images from 28,079 screening episodes (repeat episodes are available for 7,821 patients) have been graded manually.15,16 All manual grades were stored and accessed using the Digital Health Care system version 3.6. Patients with no perception of light were excluded from the study.
Clinical practice
The NHS diabetic retinopathy screening protocol is followed at the time of screening has been published elsewhere. 17 Four images are required per patient, for each eye one image centred on the optic disc, and one centred on the macula. Additional images are often taken to ensure sufficient quality and to document other pathology (eg. cararact). Gradings for ‘eye for which action is most urgently required’ in order of increasing severity are no retinopathy (R0), background retinopathy (R1), ungradable images (U), maculopathy (M1), pre-proliferative retinopathy (R2) and proliferative retinopathy (R3).15,16 Up to three human graders who meet ENSCDR quality assurance standards assess images. Level 2 grading of images is carried out by senior graders. Disagreements between level 1 and level 2 graders for episodes that are potentially M1 or R2 are sent for arbitration to a third grader, whose assessment is final. Patients with grades U, M1, R2, and R3 are referred to hospital ophthalmologists, and those with grades R0 and R1 are invited for re-screening in 12 months. In the screening service for much of the period during which images were retrieved, patients known to be photographically ungradable were technically failed at the photography level and underwent slit lamp biomicroscopy in clinic. These patients have been omitted from the dataset (since they have no gradable images). This has reduced the percentage of ungradable images in the set analysed.
Automated grading systems
Automated DR grading systems with a CE mark obtained or applied for up to 6 months after July 2013 were eligible for evaluation. From a literature search and discussions with experts, three software systems were selected and all three agreed to participate in the study: iGrading (version 1.1 by Medalytix),18,19 Retmarker (version 0.8.2. 2014/02/10 by Critical-Health), 20 IDx-DR (by IDx).21,22 For commercial reasons, IDx withdrew from the study before the analysis, and in 2013 another company, Eyenuk Inc, (software EyeArt 23 ) asked to join the study, confirming that it would meet the CE mark eligibility criteria. Three systems (iGrading, Retmarker and EyeArt) will therefore process all 28,079 screening episodes with 142,018 images. Permission to extract pseudoanonymized images and process these using automated systems has been obtained from the Caldicott Guardian. No formal ethics approval was required, as all extracted images were anonymized, and no change in clinical pathway will occur.
All automated systems are designed to identify DR cases of R1 or above. EyeArt is additionally designed to identify cases requiring referral to ophthalmology (U, M1, R2 or R3). Retmarker and EyeArt process all the images associated with a screening episode and provide a classification per episode. The iGrading system provides an outcome classification for each image.
To compare screening performance across the automated systems with the reference standard, episodes must be classified as (i) Disease present or technical failure or (ii) Disease absent. Retmarker automatically classifies screening episodes in this way. For EyeArt, episodes classified as Disease, Definite disease, and Ungradable will form group (i) and those classified as ‘Definite no disease’ and ‘No disease’ will form group (ii). For iGrading, screening episodes group (i) will include episodes classified as ‘Disease present’ or ‘Ungradable’, using the following approach:
If the outcome of at least one image in a screening episode is classified as ‘Disease’, then the outcome classification for the episode will be ‘Disease present’. If the outcome of at least one image in a screening episode is classified as ‘Ungradable’ and ‘No Disease’ is detected in all the other images of the screening episode, then the outcome classification for the episode will be ‘Ungradable’. If the outcome of all images in a screening episode is ‘No disease’, then the outcome classification for the episode will be ‘Disease absent’.
All automated systems also report a numerical value for a decision statistic; values above a certain threshold imply that DR is present.
Reference standards
Final human grade
The study is not designed to establish the performance of human graders but to compare the automated systems with outcomes from clinical practice. Screening performance of each automated system will be assessed using the final human grade as the reference standard, as well as that modified by arbitration.
Final human grade modified by arbitration
Process of selection of discrepancies between human grade and automated systems for external arbitration
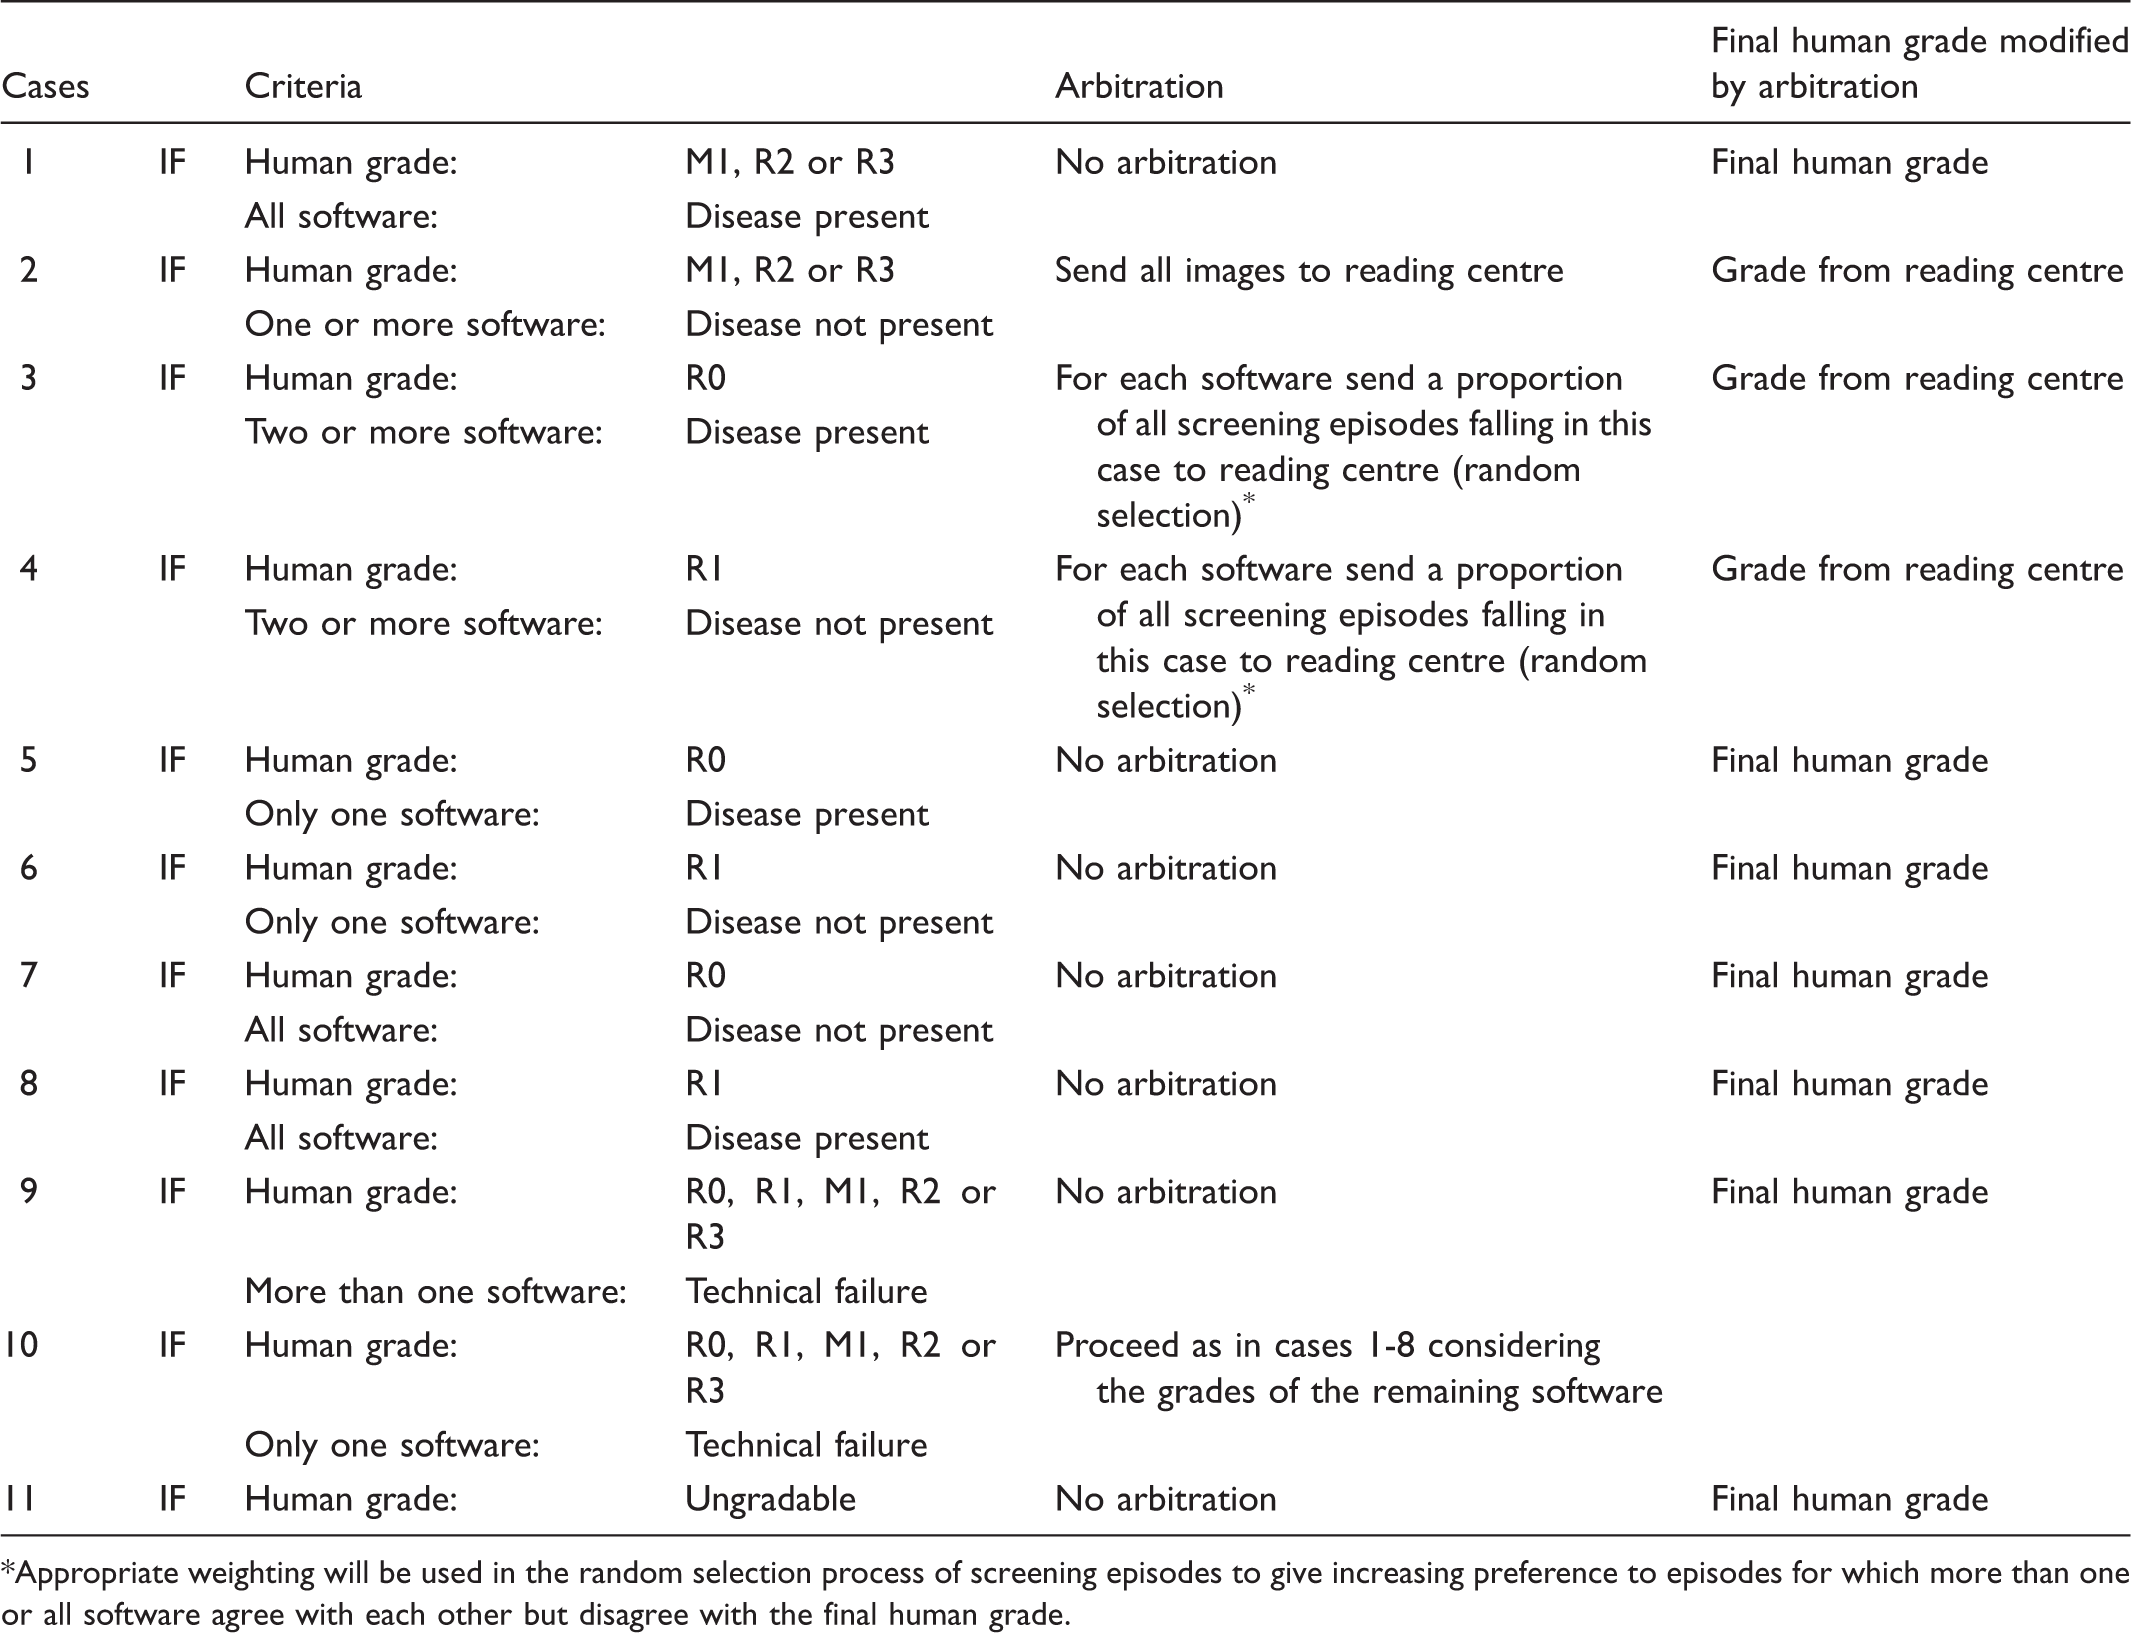
Appropriate weighting will be used in the random selection process of screening episodes to give increasing preference to episodes for which more than one or all software agree with each other but disagree with the final human grade.
Consensus grade
For automated systems achieving at least 80% sensitivity in identifying cases of DR of R1 or above and 100% sensitivity for R3, two approaches to define a “consensus grade” will be used:
A majority classification based on using data from the final human grade and the automated system classifications (disease absent/disease present or technical failure) A majority classification based on the automated system classification only (disease absent/disease present or technical failure)
The change in screening performance for each system will be compared with the consensus grade. Currently there is no recommended level for the false positive rate (i.e. 1-specificity); we will explore the influence this may have on the consensus grade.
Statistical methods
Primary analyses
Screening performance of the automated systems v final human grades in current screening practice:
The sensitivity, false positive rate, and likelihood ratios of each automated grading system will be determined using the final human grade (with and without reading centre arbitration) as the reference standard for (i) any retinopathy or ungradable episodes (final human grades R1, U, M1, R2, or R3 v R0); (ii) episodes with final human grades U, M1, R2, or R3 v final human grades R1 or R0; and (iii) for each grade of retinopathy separately (R0, R1, M1, R2, R3, and U), using data from all 28,079 screening episodes. As 7,821 of the 20,258 patients were screened twice (in total 28,079 screening episodes), screening performance for each automated system will be estimated using mixed-effects logistic regression models including the final human grade (with and without reader centre adjustment) as the explanatory variable and a random effect for each participant to take account of repeated measurements. Hence, for each system the model will estimate the probability of an automated system suggesting that retinopathy is present, conditional on human grading. The sensitivity and false positive rate will be presented for each final human grade (all outcome classifications reported by each automated system). Diagnostic accuracy of sensitivity, false positive rate and likelihood ratios will be defined by 95% confidence intervals (CI) obtained using bootstrapping. Clinical interpretation of these measures will focus on the lower limit of the 95% CI for the detection of R3, R2, and M1 grades. This will give an indication of the number of screening episodes requiring clinical intervention that could be missed by the automated systems. The upper confidence limit for false positive rates for retinopathy grades R1 and R0 will be important in assessing the additional number of screening episodes requiring further investigation. The level of uncertainty around these estimated lower and upper limits will also be investigated using bootstrapping. Sensitivity analyses will examine the influence of excluding episodes classified as technical failures by an automated system.
Assessing the predictive value of the automated grading systems:
The positive predictive value of the automated grading systems will be evaluated using data from the 21,929 independent screening episodes by fitting multinomial logistic regression models with the final human grade as outcome (with and without reader centre arbitration) and the outcome classification of each automated system as an explanatory variable.
Comparing technical failure rate between manual and automated grading systems:
The rate of technical failure for automated and manual grading will be compared. The proportion (with 95% CI) of screening episodes identified by each automated system as disease-negative offset against technical failures will be estimated as this measure could be used to quantify the potential saving (in terms of both money and time) in the number of screening episodes requiring manual grading.
Secondary analyses
Alternative reference standard:
Sensitivity and false positive rates will be estimated using the consensus grade on all 28,079 screening episodes to quantify the bias in the measures of screening performance compared with that from the primary analysis.
Influence of potential confounders in screening performance measures:
Multiple variable mixed-effects logistic regression models, including patients’ ethnicity (South Asians, black African-Caribbean and white Europeans), age, and duration of diabetes as explanatory variables, will be used to examine the effect of potential confounders on the screening performance of each automated system. Multiple variable logistic regression will be used to explore the influence of these patient factors on the frequency of grade of retinopathy and technical failure. The study was not specifically powered to examine these individual factors, but may suggest hypotheses requiring further investigation.
Health-Economic Analyses
Health-economic analyses will investigate the implications (i) if an automated system were to replace level 1 human graders, (ii) if the automated system were to be used as a filter prior to level 1 graders. This investigation will also (i) determine the optimal operating threshold for the detection of DR for each software using Receiver Operating Characteristics analysis, (ii) quantify the rate of disease progression from the literature and the data, and (iii) examine whether OCT should be incorporated into the primary screening programmes for diabetic retinopathy and maculopathy. The health economic model will take into account the screening performance of automated systems, efficacy of manual screening, likelihood and timing of re-screening, referral rates to ophthalmologists, prevalence of different levels of retinopathy in the study population, and rates of progression of disease. Cost data will come from Personal Social Services Research Unit 26 unit costs, hospital cost data, the existing literature and expert opinion. More information is available online (See Appendix).
Results
Prevalence of retinopathy grades and associated 95% confidence intervals for detection rates ranging from 80% to 95%.
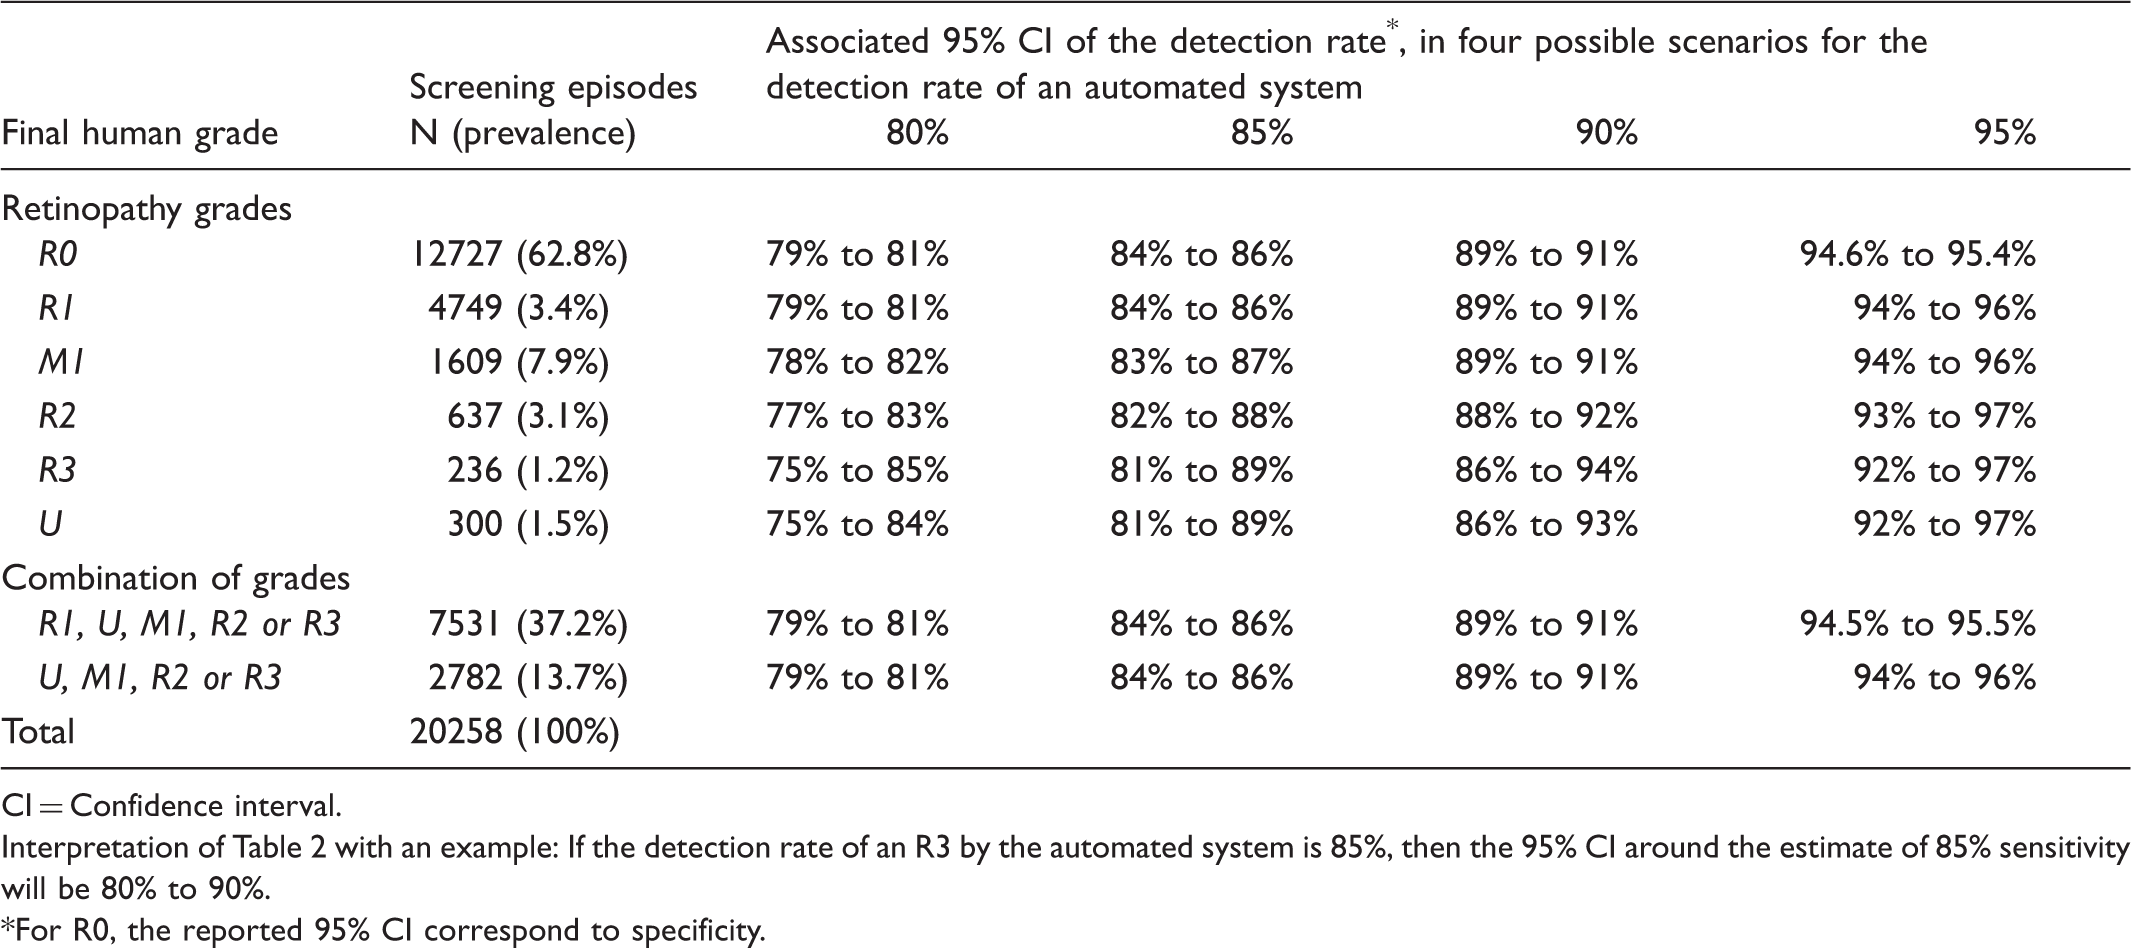
CI = Confidence interval.
Interpretation of Table 2 with an example: If the detection rate of an R3 by the automated system is 85%, then the 95% CI around the estimate of 85% sensitivity will be 80% to 90%.
For R0, the reported 95% CI correspond to specificity.
Discussion
While the performance of automated grading systems is comparable to that of trained graders in ideal circumstances (published sensitivities over 97%, and false positive rates of 37% or less6–12), this study in a ‘real life’ setting should provide robust evidence on whether these systems might efficaciously and cost effectively replace one or more steps of current DESPs. In Scotland, macular centred images are already automatically processed, but this study will include newer systems that process both macula and disc centred images. The three systems (RetMarker, iGrading, and EyeArt) will use the same dataset of images collected from the same screening programme. The programme conforms to ENSCDR guidelines, and the ongoing performance of manual grading is maintained by regular external auditing and continually grading a test dataset to nationally agreed standards. Prevalences of retinopathy grades in the 20,258 screening episodes to date are similar to published ENSCDR data.18,27 To further validate the quality of human grading, a subset of images (including all images considered higher grades of retinopathy, ie. R2 and R3) will be sent to an US Reading Centre compliant with all federal and FDA regulations, including FDA 21 CFR Part 11, for masked assessment, primarily graded using the ENSCDR system, but also according to the Early Treatment of Diabetic Retinopathy Scale used in FDA studies. While this validation process will ensure that the programme is as close to a ‘gold standard’ as possible, the study is not designed to compare the automated systems, but to see if software performance is the same or potentially better than that of a human grader. We aim to ensure that findings are generalizable and directly relevant to other DESPs with similar methodologies.
The large number of episodes will allow screening performance and diagnostic accuracy to be determined with a high level of precision for each grade of retinopathy. This is particularly important at more severe grades, because of the potential sight threatening consequences of missing retinopathy. Previous Diabetes UK recommendations suggest that the sensitivity of a screening programme should be at least 80% 25 , but controversy exists over whether this is adequate for potentially sight threatening retinopathy grades. Recommendations for acceptable false positives rates and other screening performance measures do not exist. 25 False positives cause patient anxiety, and have cost implications due to unnecessary referrals to ophthalmologists. Given the large number of episodes in the dataset, this study will be well placed to examine the economic impact and other consequences for different levels of sensitivity and false positive rates.
Sub-group analysis will examine the effect of age, gender, and ethnicity on screening performance. Examining ethnic differences in screening performance is novel. Including a DESP in an ethnically diverse population (East London), with large representations of Black African and mixed ethnic groups 28 will allow the study to examine screening performance in non-white ethnic groups, where higher levels of retinal pigmentation may affect system performance.
While all three automated systems are compatible with the same image management system (Digital Health Care system V3.6), they report different outcomes. This paper outlines the methodology used to homogenize output across systems, to allow comparison of performance with human grades. The unifying approach requires little or no change for some systems (eg. Retmarker), but loss of detail for some (eg. EyeArt). Because in ‘real life’, some screening systems may be unable to cope with unfiltered images or images of insufficient quality, the software companies will each receive an identical test set of undedited images with which to develop and test algorithms for image selection and processing.
Human grading can use information from past image sets or patients’ history to facilitate more accurate grading. For example, yellow/white well demarcated lesions in the macular area which look like exudates but have been present unchanged on 15 sets of prior images with normal visual acuity are unlikely to be M1 even if they have that appearance. Image reading centre analysis and most automated systems cannot do this, although one system has developed an algorithm to detect retinal changes over time (ie. formation and disappearance of microaneurysms).
The cost of diabetes to the NHS is estimated at £24 billion (10% of current NHS expenditure) and is set to rise. 29 Complications of diabetes account for a substantial proportion of direct health costs, and strategies to prevent unnecessary complications, such as diabetic retinopathy, are key. 29 Human graders are expensive to train, incur on-going costs and are difficult to retain, so if low risk patients could be identified automatically, limited human resources could be concentrated on high risk groups with more severe retinopathy. This study will also allow the health economic assessment of the potential inclusion of OCT in screening pathways, as is already being done in some Hospital Eye Services. 14 The research findings will be published and disseminated to inform policy, and the image dataset collected will provide an important resource to compare performance of future systems.
Footnotes
Funding
This project was funded by the National Institute for Health Research HTA programme (project no. 11/21/02); a Fight For Sight Grant (Hirsch grant award); and the Department of Health's NIHR Biomedical Research Centre for Ophthalmology at Moorfields Eye Hospital and UCL Institute of Ophthalmology. The views expressed are those of the authors, not necessarily those of the Department of Health.
Conflict of interest
All investigators are independent of commercial software development and have no commercial interest or intellectual property in automated diabetic retinopathy screening.
References
Supplementary Material
Please find the following supplemental material available below.
For Open Access articles published under a Creative Commons License, all supplemental material carries the same license as the article it is associated with.
For non-Open Access articles published, all supplemental material carries a non-exclusive license, and permission requests for re-use of supplemental material or any part of supplemental material shall be sent directly to the copyright owner as specified in the copyright notice associated with the article.