
Abstract
Objectives
Mammography screening programme sensitivity is evaluated by comparing the interval cancer rate (ICR) with the expected breast cancer incidence without screening, ie. the proportional interval cancer rate (PICR). The PICR is usually found by extrapolating pre-screening incidence rates, whereas ICR is calculated from data available in the screening programmes. As there is no consensus regarding estimation of background incidence, we seek to validate the ICR measure against the PICR.
Methods
Screening data from the three mammography screening programmes of Stockholm, Copenhagen, and Funen in the period 1989-2011 provided data to calculate the ICR. The most commonly described methods of extrapolating pre-screening incidence rates to calculate the PICR were illustrated and PICRs were calculated by year and programme using these different methods and compared with the ICRs.
Results
PICRs varied greatly, reaching a difference of 32–34% in Stockholm, 79% in Copenhagen, and 100–106% in Funen between the highest and the lowest value, depending on which method was applied. PICRs exhibited large variations yearly and from programme to programme. ICRs did not vary to the same extent, ranging on average from 0.100 to 0.136 in the first 12-months and between 0.201 and 0.225 in the last 12-months of the two-year period after a negative screen across the three programmes.
Conclusion
The value of the PICR is hugely influenced by which method is applied, whereas the ICR is calculated purely on data available within programmes. We find that the PICR, the establishing indicator for sensitivity, could preferably be replaced by the ICR.
Introduction
The purpose of screening mammography is to reduce breast cancer mortality. In order to achieve this, breast cancer cases have to be detected early. In this process there are, however, inevitable side-effects; these include false-negative and false-positive screening tests. A high number of false-negative tests indicates low sensitivity, and a high number of false-positive tests indicate low specificity. It is important to balance sensitivity and specificity within a screening programme, and quality assurance guidelines are used to monitor this balance.
The sensitivity of a screening programme is:
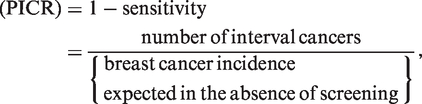
Proportionate Interval Cancer Rate (PICR)
‘Number of breast cancers in the invited population which were not declared positive by the screening programme’ is usually estimated by the number of interval cancers. ‘Number of breast cancers in the invited population is not known, but can be estimated by ‘number of breast cancers expected in the absence of screening’. One of the widely used quality assurance measures to monitor the sensitivity of a screening programme is therefore the proportionate interval cancer
However, with a longer time span since start of service screening, the breast cancer incidence prior to the start of service screening, the breast cancer incidence prior to the start of screening becomes an increasingly inaccurate estimate of the expected incidence in the absence of screening. To remedy this, extrapolations have been made and used as estimates of the background rates,9–11 but over time the actual development in breast cancer incidence can easily divert from an incidence predicted from past observations.12 This uncertainty is also reflected in several of the service screening evaluation papers, where the authors have expressed reservation about the prediction methodology.10,11
Interval Cancer Ratio (ICR)
Another way to estimate 1-sensitivity is the number of interval cancers divided by the sum of the screen detected and interval cancers. We have previously shown that the ICR correlates well with the PICR in data from early rounds of screening programmes.13 The ICR measure has the advantage of being based solely on data available in most service screening programmes.
The purpose of this study was to present the PICR and the ICR for the full available screening period of three organized screening programmes in order to evaluate the long-term association between these two indicators of sensitivity and the differences in various means of calculating the PICR. We used data from the screening mammography programmes in Stockholm (Sweden), and in Copenhagen and Funen (Denmark).
Methods
Data sources
The Stockholm population-based screening programme was initiated in August 1989, and by March 1992 all women aged 50–69 had been invited to the first of the biennial rounds. Approximately 25% of the target population had participated in a randomized trial between 1981 and 1989. 14 The Stockholm programme was later expanded to include women aged 40–49 and 70–74, but these age groups were not included in the present study. The Stockholm programme maintains a register including identification of all invited women with dates of invitation, dates of screening, and dates and outcome of all follow-up procedures. Screened women were followed-up weekly for deaths and emigrations out of Stockholm, and for interval cancers in the Swedish Cancer Register. Interval cancers were defined only in screen negative women, not including false-positives. From Stockholm we included data from 1 August 1989 to 31 December 2011.
The Copenhagen municipality population-based screening programme was initiated in April 1991, and by March 1993 all women aged 50–69 had been invited to the first of the biennial rounds. 7 From the 1st to 7th invitation round, age was defined by age at start of the invitation round; from the 8th round onwards, current age was used as the basis for invitations. The Funen county programme started in November 1993, and by December 1995 all women aged 50–69 had been invited. 8 The Funen programme used current age as the basis for invitation throughout the programme. The activity in the two programmes, including interval cancers, deaths, and emigrations, has been collected in a Mammography Screening Data Base, including data from the programmes’ administrative systems, the Danish Civil Registration System, as well as a number of other registers. 15 The definition of a primary, incident breast cancer varies slightly across Danish registers. To obtain consistent data therefore, for invasive breast cancer we used only data from the Danish Cancer Registry, and for ductal carcinoma in situ (DCIS) data only from the Danish Breast Cancer Cooperative Group. From Copenhagen we included data from 2 April 1991- 31 December 2007, and interval cancers until 30 November 2009. From Funen, we included data from 2 November 1993- 31 December 2007, and interval cancers until 30 November 2009.
Population-based breast cancer incidence rates for women aged 50-69 were retrieved for Stockholm for 1964–2011 from the Regional Cancer Registry in the municipality of Stockholm and the island of Gotland, for Copenhagen for 1966–2007, and for Funen for 1968–2007 from Nordcan. 16
Definitions
Breast cancer: For screen-detected and interval cancers we included incident, invasive breast cancer (ICD-10 code C50) and DCIS (ICD-10 code D05). Population-based breast cancer incidence rates included invasive breast cancer only.
Screen detected cancers: Breast cancer (invasive or DCIS) found at a screening examination.
Negative screening outcome: A negative screen or a negative assessment /surgery after a positive screen.
Invitation round: Defined administratively by an interval of dates of approximately two years.
Interval cancer: Breast cancer diagnosed after a negative screening outcome within two years of the date of the negative outcome, although excluding breast cancer detection at next screen if this took place earlier.
Interval cancer rate: Number of interval cancers divided by number of women with negative screen outcome within 0–11 months and 12–23 months, respectively, after the screening date.
Background incidence rate: We used pre-screening breast cancer incidence rates for women aged 50–69 as the basis for the various extrapolation methods to estimate the expected breast cancer incidence rate in absence of screening.
Proportionate interval cancer rate (PICR): Interval cancer rate divided by background incidence rate. Four different methods were used for estimating the background incidence rate.
First, linear extrapolation based on the breast cancer incidence from the 5 years prior to the start of screening. Second, the mean of these predicted rates over the entire prediction period. Third, linear extrapolation based on the breast cancer incidence from the 25 years prior to the start of screening. Fourth, the breast cancer incidence rate during the year prior to the start of screening.
Interval cancer ratio (ICR): Interval cancer as a proportion of screen detected and interval cancers.

Analysis
For each programme and year of screening, we tabulated the number of women with negative screens, number of screen detected breast cancers, number of interval cancers, ICR, and the four different estimates of PICR. For each programme and year of screening, graphical comparisons were made between the ICR and the different PICRs.
For the Stockholm data, the analysis was undertaken with STATA, and for the Danish data SAS version 9.2. This study was entirely based on data from registers. No contact has been made with patients, relatives, or their practicing doctors. In Sweden, the study was carried out in accordance with the Swedish Data Protection Law. In Denmark, the study is registered with the Danish Data Inspection Board (number 2008-41-2191).
Results
In Stockholm, the slope of the incidence curve in the last 5 years prior to the start of screening was very similar to the slope of the incidence curve during the entire 25-year period before the start of screening, making the background estimates from these two methods very similar (see Figure 1). A different pattern was seen in Copenhagen and Funen, where the slopes of the incidence curves from the 5 years prior to the start of screening were much steeper than the slopes for the incidence curves from the 25-year period before the start of screening. The mean of the 5-year linear extrapolation initially over-estimated and subsequently under-estimated the background incidence as compared with the 5-year estimate alone. In Stockholm and Copenhagen, the estimate based on the incidence during the year prior to the start of screening was lower than the other estimates almost all the time, while in Funen this was the case only at the end of the study period. In Stockholm, the population-based breast cancer incidence rate for women aged 50–69 after the start of the screening programme was higher than any of the predicted rates, and in Copenhagen and Funen it was higher than two of the four predicted rates. These differences reflect the prevalence peak as women enter screening and the artificial aging during screening
17
, and they should not be mistaken for overdiagnosis, which can be studied only in the birth cohort perspective.
18
Breast cancer incidence per 100,000 screened women aged 50–69 per year and using four different methods of extrapolating the pre-screening breast cancer incidence for the period 1964–2011 for women living in Stockholm, Copenhagen and Funen.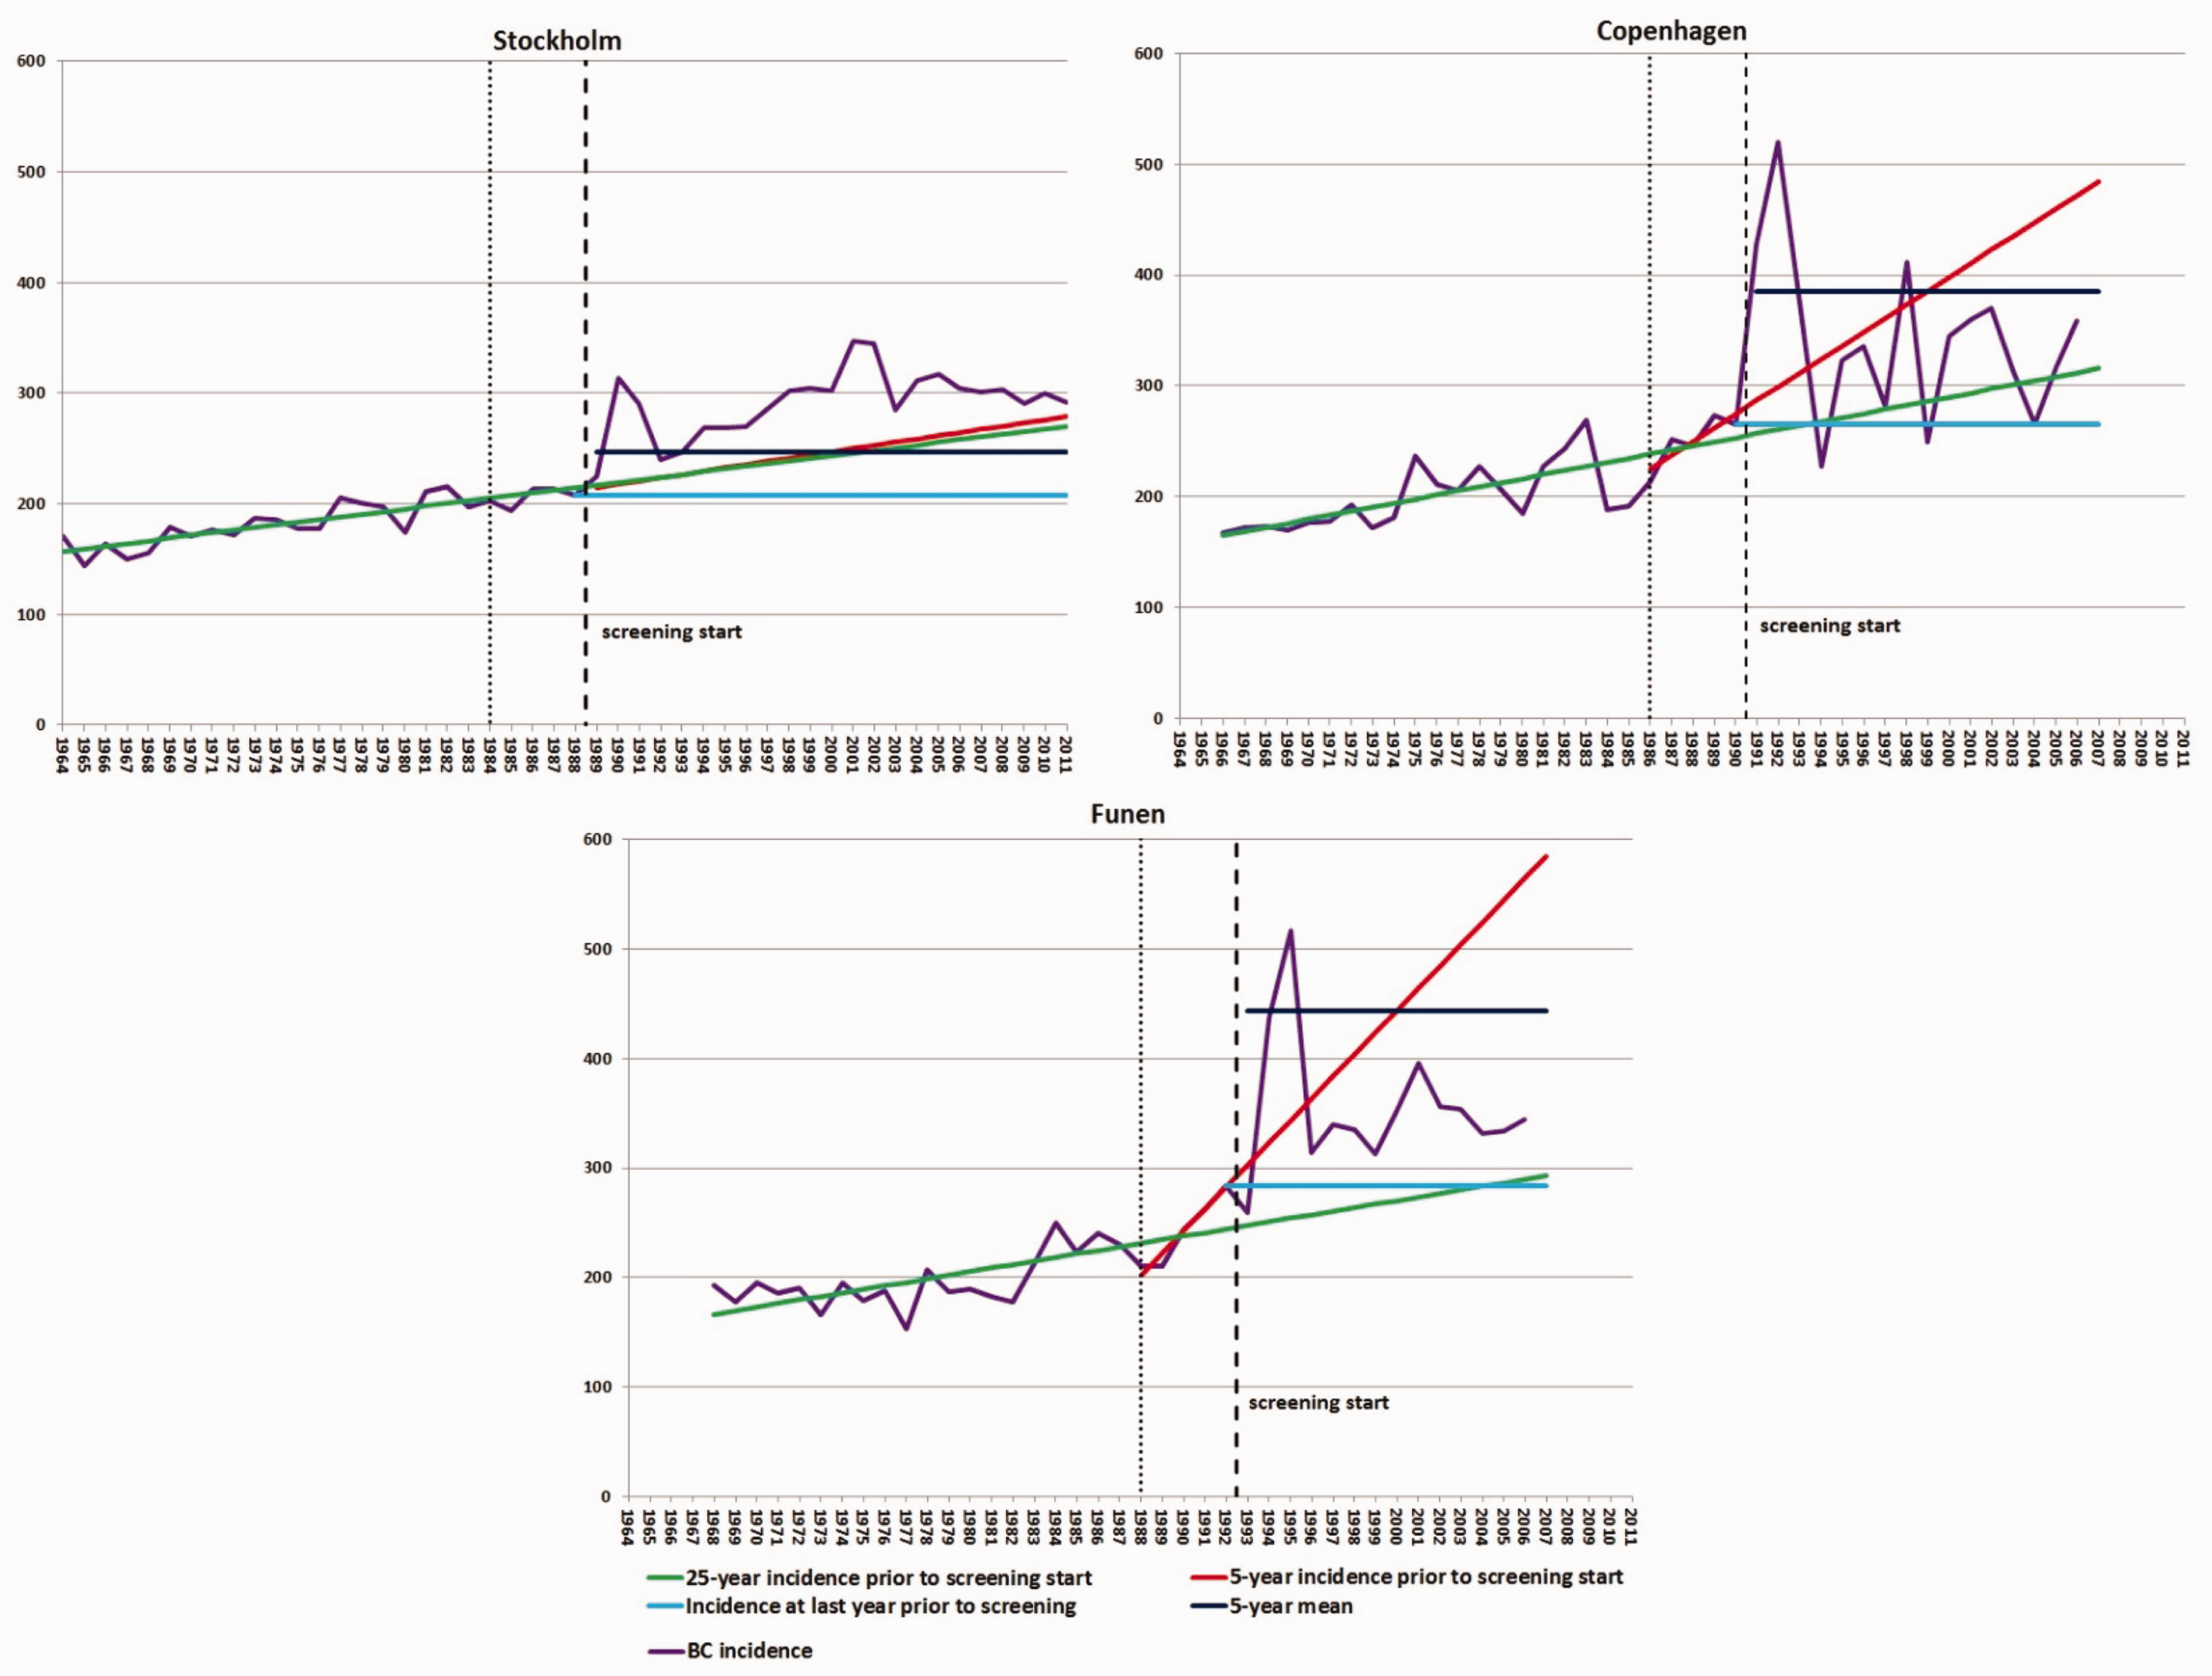
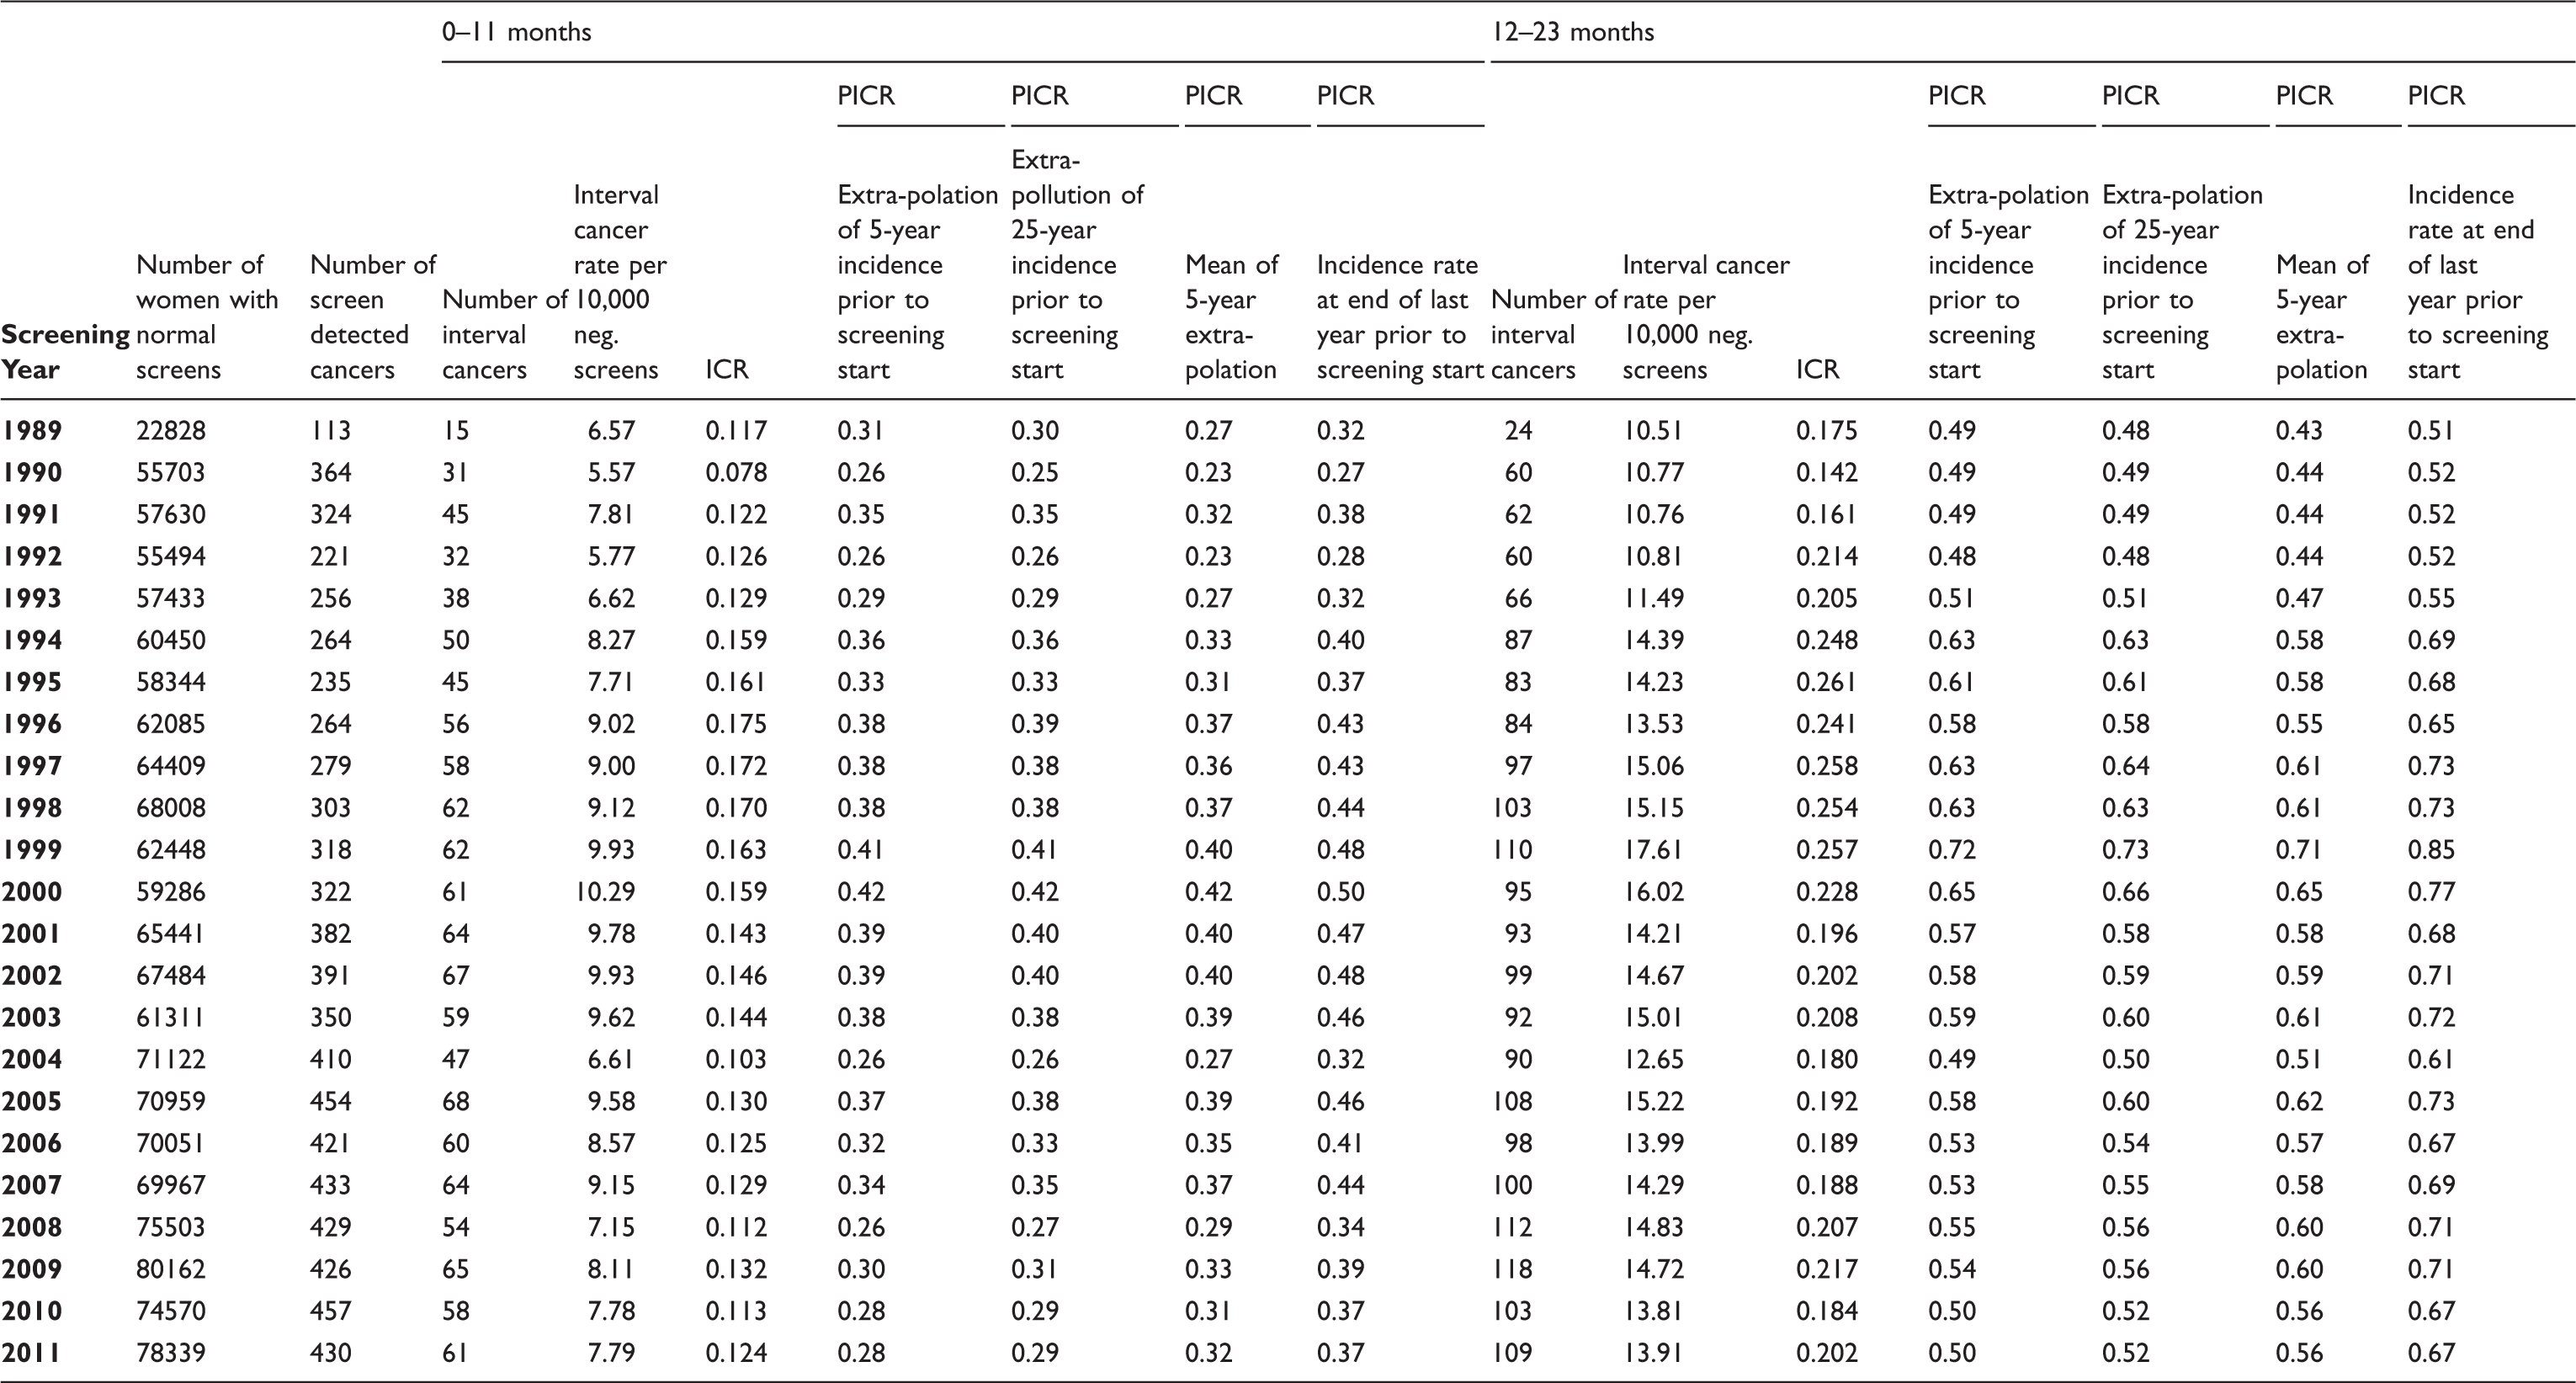
Number of women with normal screening results, number of screen detected breast cancer cases, number of interval cancers, interval cancer rate per 10,000 negative screens, proportionate interval cancer rate (PICR) by various models for the interval 0–11 months & 12–23 months after last negative screen, and interval cancer rate (ICR) by screening year in screening programme in Stockholm.
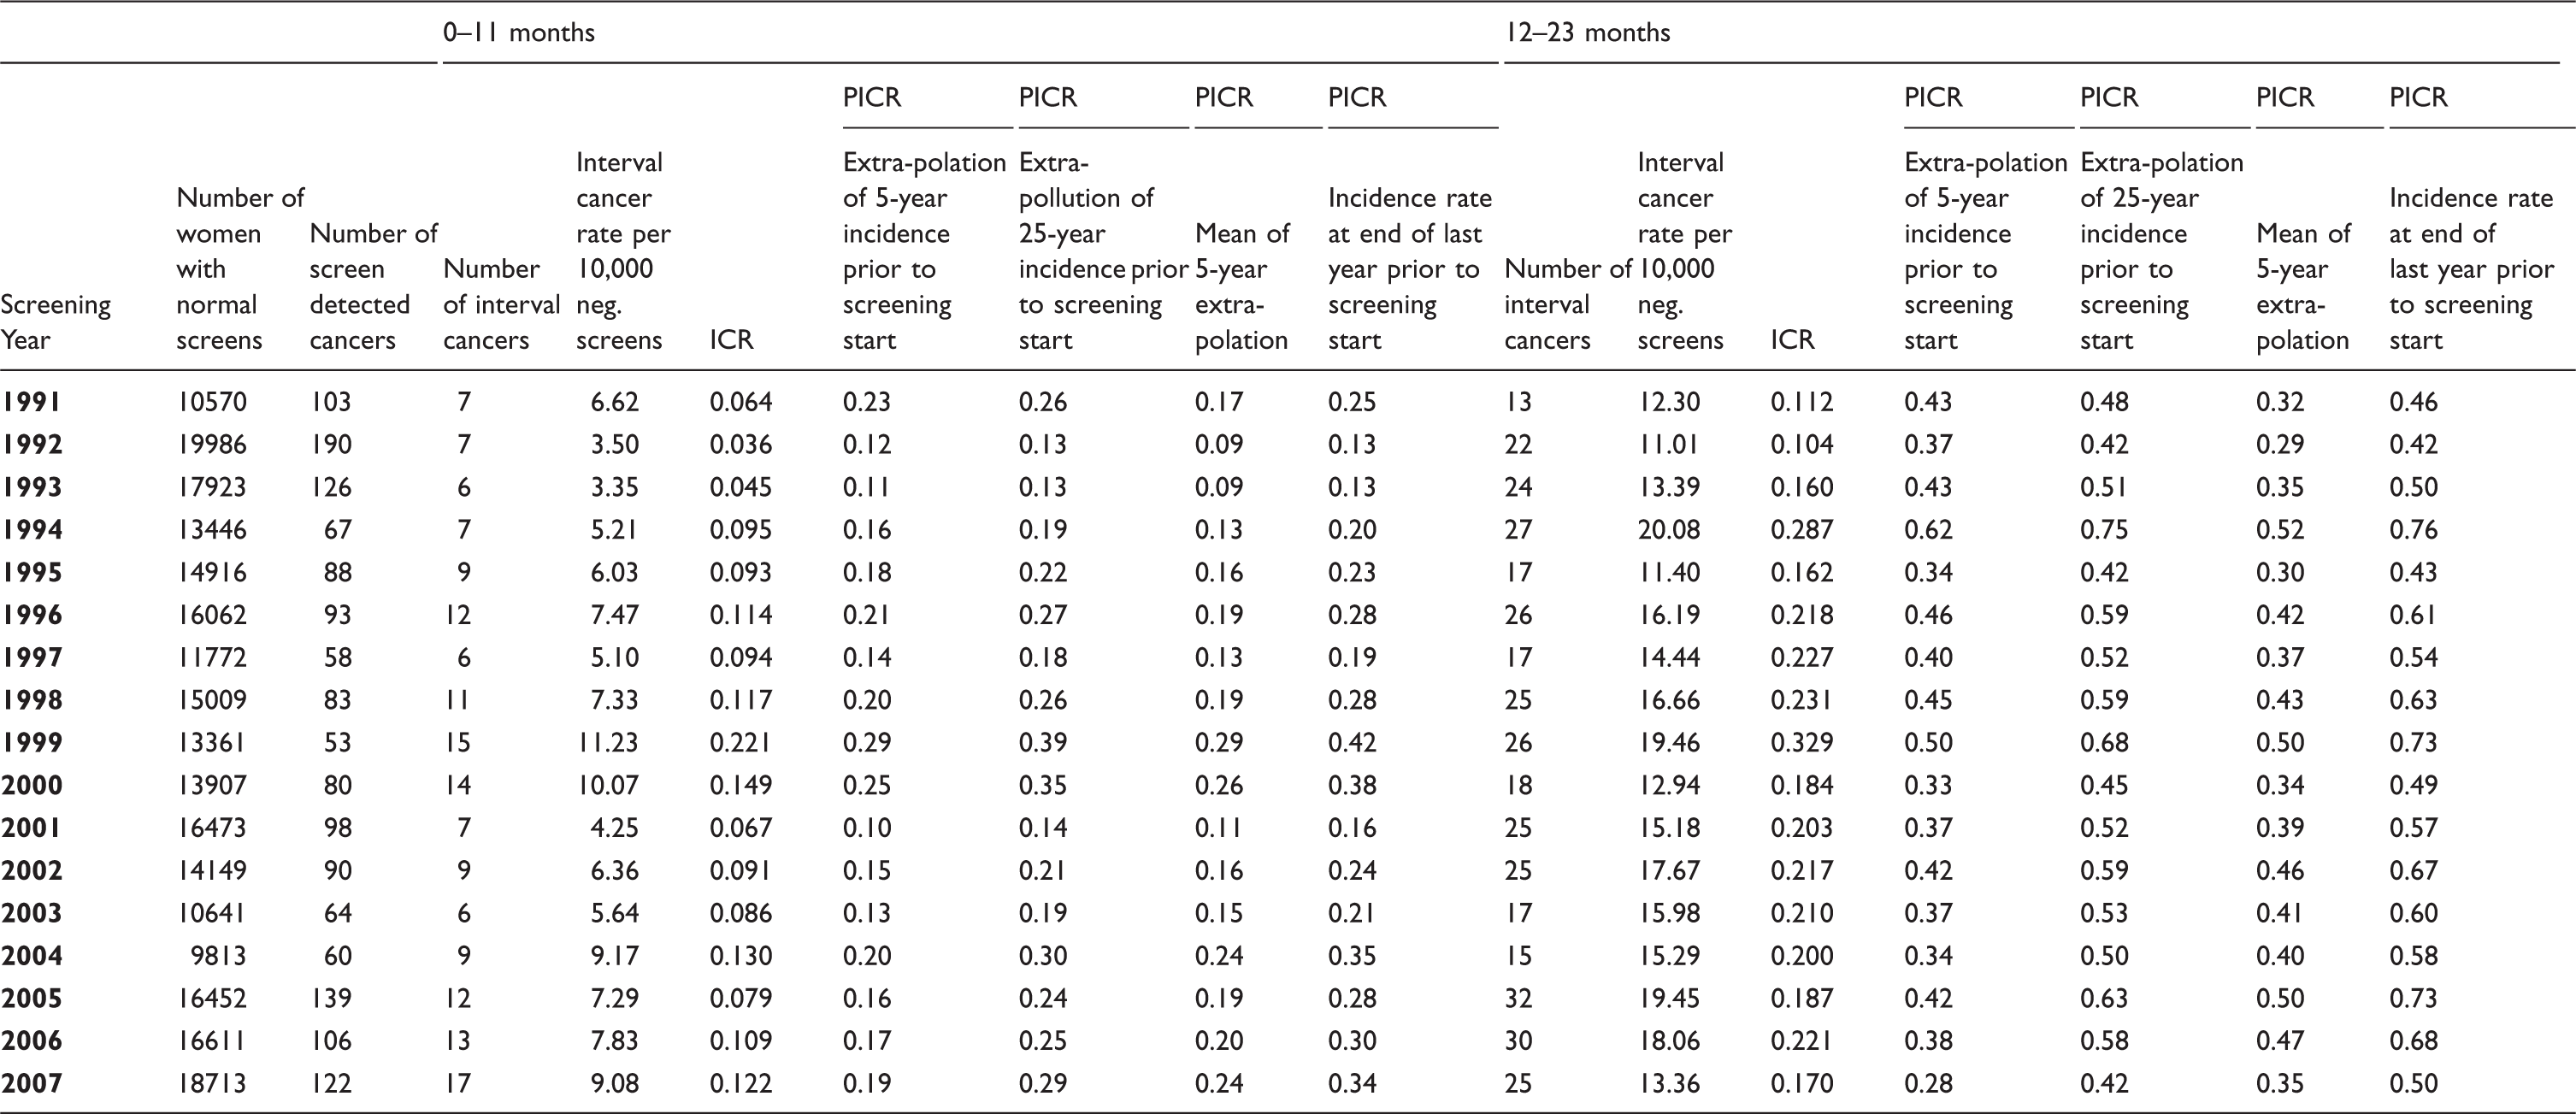
Number of women with normal screening results, number of screen detected breast cancer cases, number of interval cancers, interval cancer rate per 10,000 negative screens, proportionate interval cancer rate (PICR) by various models for the interval 0–11 months & 12–23 months after last negative screen, and interval cancer rate (ICR) by screening year in screening programme in Copenhagen.
Number of women with normal screening results, number of screen detected breast cancer cases, number of interval cancers, interval cancer rate per 10,000 negative screens, proportionate interval cancer rate (PICR) by various models for the interval 0–11 months & 12–23 months after last negative screen, and interval cancer rate (ICR) by screening year in screening programme in Funen.
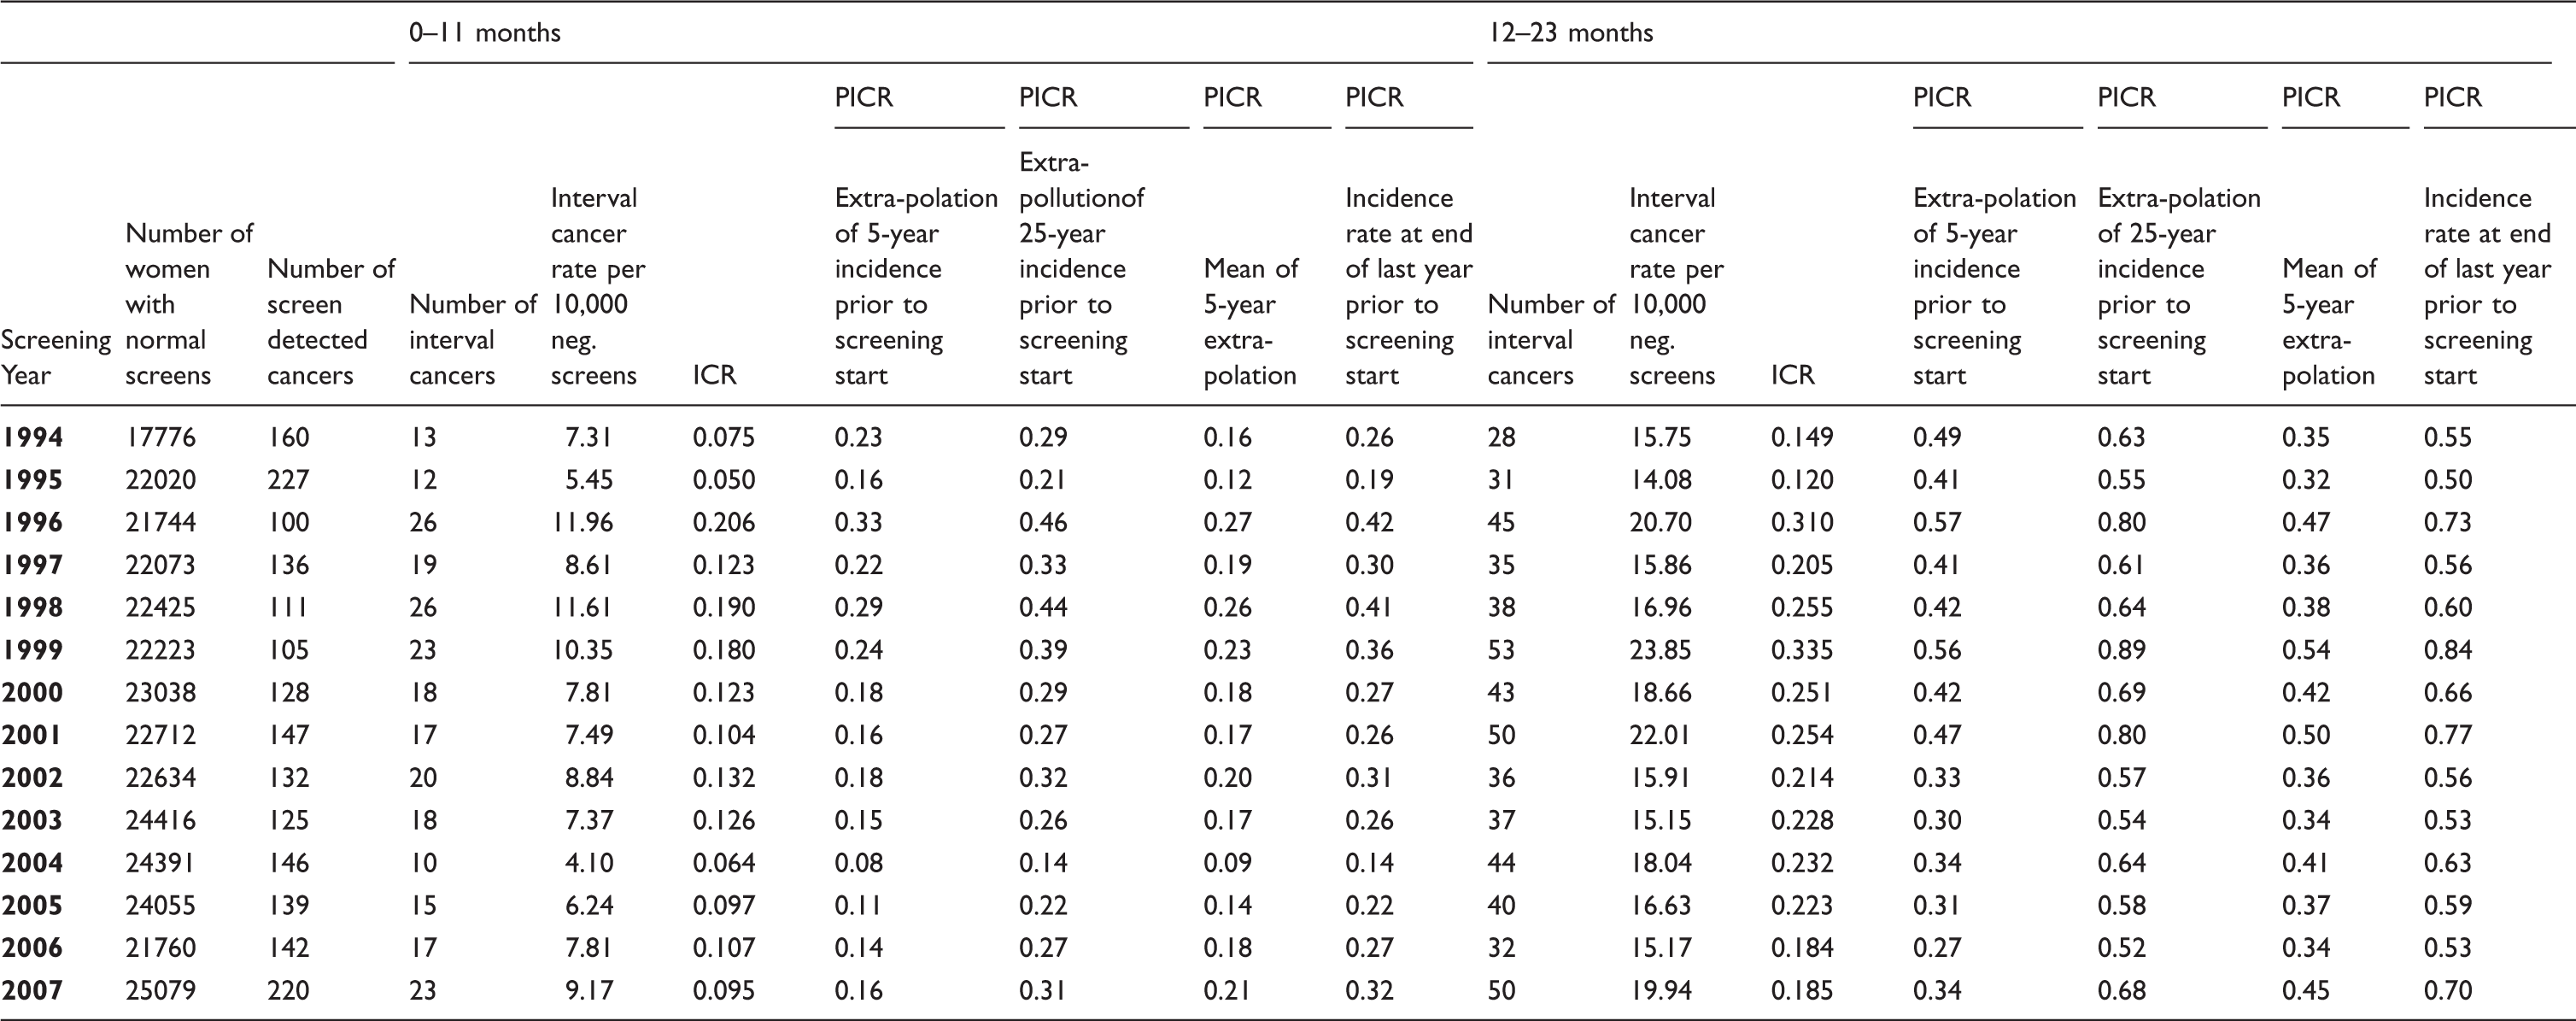
In Stockholm the interval cancer rate (per 10,000 normal screenings) varied from a low of 5.57 after screening in 1990 to 10.29 after screening in 2000 for the first 12-months (0–11 months), and from 10.51 after screening in 1989 to 17.61 after screening in 1999 for the last 12-months (12–23 months) (Table 1). In Copenhagen, the interval cancer rates varied more, ranging from a low of 3.35 after screening in 1993 to a high of 11.23 after screening in 1999 for the first 12-months, and ranging from 11.01 after screening in 1992 to 20.08 after screening in 1994 for the last 12-months (Table 2). In Funen, the interval cancer rate varied from 4.10 after screening in 2004 to 11.96 after screening in 1998 for the first 12 months, and from 14.08 after screening in 1995 to 23.85 after screening in 1999 for the last 12 months (Table 3).
The ICR in Stockholm was lowest in 1990 with a value of 0.078, and highest at 0.175 in 1996 for the first 12-months and varied from a low of 0.142 in 1990 to a high of 0.261 in 1995 for the last 12-months (Table 1). In Copenhagen, the ICR ranged from 0.036 to 0.221 in 1992 and 1999, respectively, during the first 12-months, and from 0.104 to 0.329 also in 1992 and 1999, respectively, for the last 12-months (Table 2). In Funen, in the first 12-months the ICR ranged from 0.050 to 0.206 in 1995 and 1996, respectively. In the last 12-months the ICR ranged from 0.120 in 1995 to 0.335 in 1999 (Table 3). The ICRs were fairly similar across programmes, in 2007 ranging from 0.095 to 0.129 during the first 12-months, and between 0.170 and 0.185 during the last 12 months.
Depending on the method for estimating the background rate, the PICRs in 2011 ranged from 0.28 to 0.37 in Stockholm in the first 12-months, and from 0.50 to 0.67 in Stockholm in the last 12-months, respectively (Table 1). The differences between the measures reached 32–34%. In Copenhagen in 2007, the PICRs ranged from 0.19 to 0.34 in the first 12 months, and from 0.28 to 0.50 in the last 12 months (Table 2), thus reaching a difference of 79% for both time intervals. In Funen in 2007, the PICRs varied from 0.16 to 0.32 in the first 12-months, and from 0.34 to 0.70 in the last 12-months (Table 3), thus reaching a two-fold difference in both time intervals. The PICRs furthermore varied considerably across programmes; in 2007 the highest average was 66–67% above the lowest average for both time intervals.
Figure 2 depicts the ICR and the four different PICRs. The PICRs showed that the differences between the four measures increased with time since the start of the screening programmes. In Stockholm and Copenhagen, the highest PICRs were based on the incidence in the last year prior to the start of screening, while in Funen little difference was seen between this measure and the PICR predicted based on the last 25 years. As a consequence of the close relationship between the 5-year and 25-year estimates in Stockholm, the PICRs generated from these two extrapolations were fairly similar. In all three programmes, the PICRs based on the 5-year extrapolation and based on the means thereof were fairly similar, with the expected crossing over in the middle of the period.
Comparison of ICR and four different means of calculating the PICR per screening year and by 12-month interval in Stockholm, Copenhagen and Funen.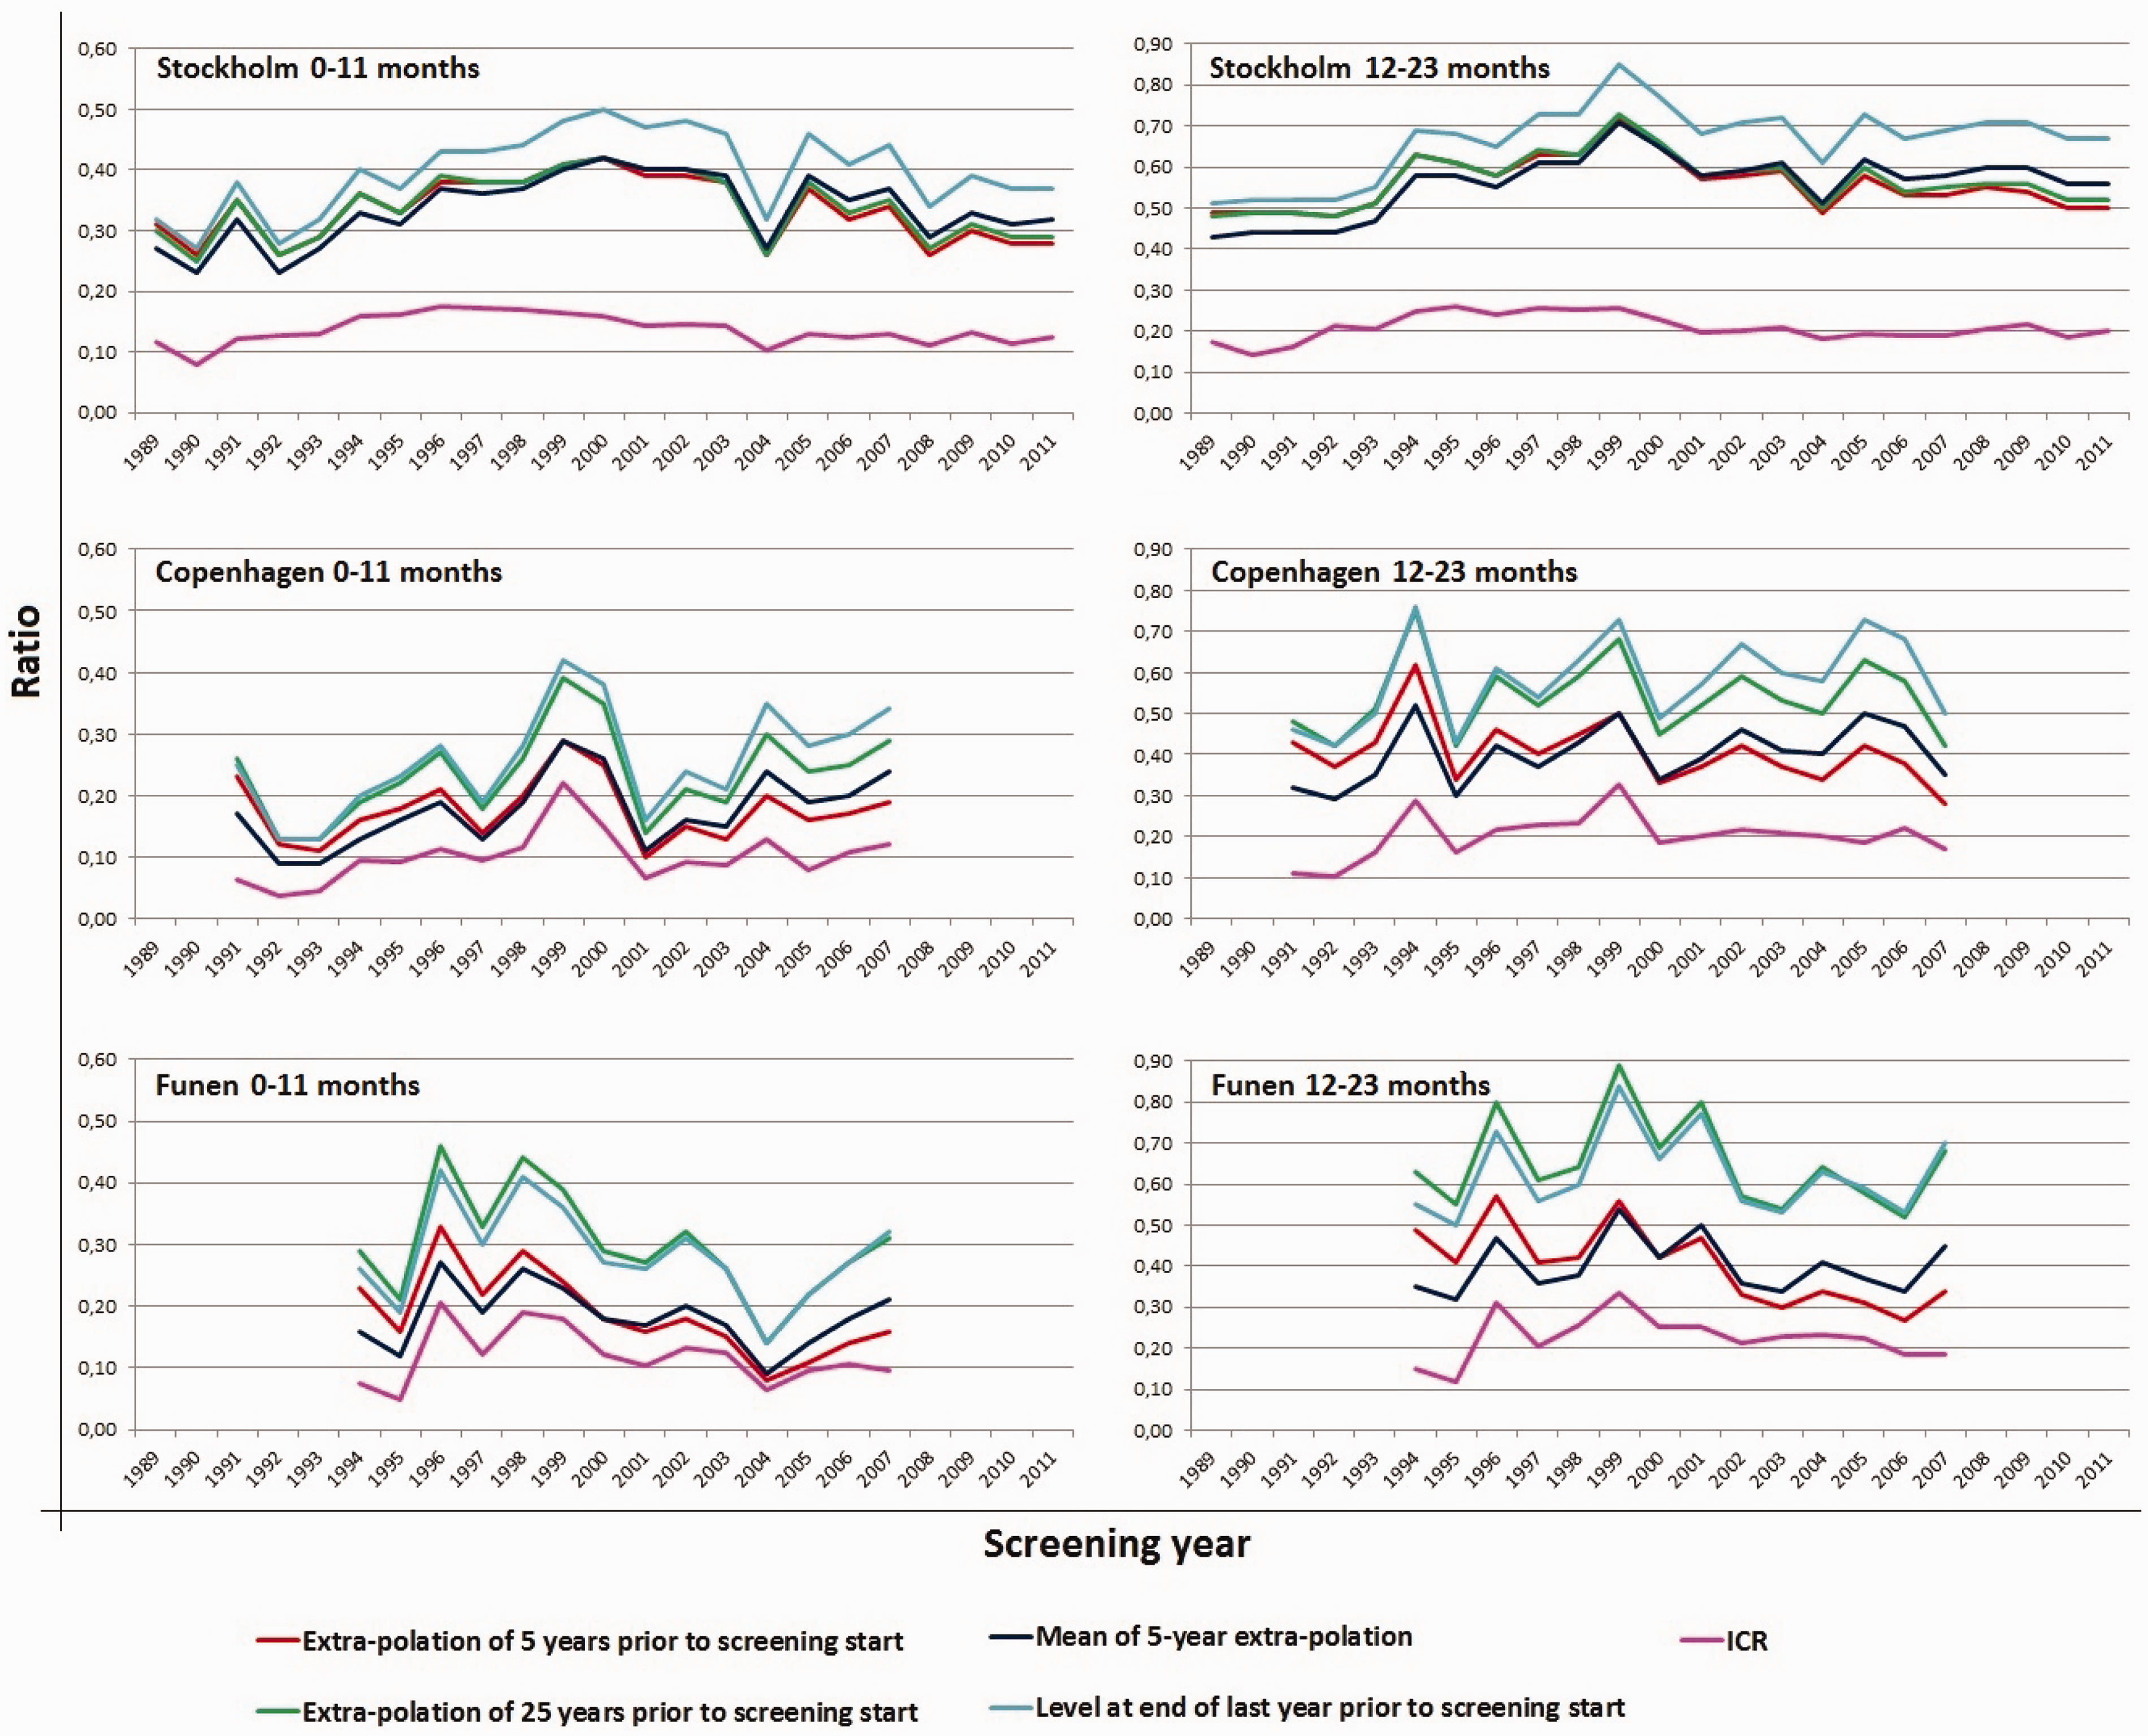
Discussion
The PICR is the recommended indicator of sensitivity in mammography screening. Our study shows that the PICRs could vary up to more than two-fold, depending on how the incidence expected in the absence of screening was estimated. This result questions the usefulness of PICR as a quality indicator.
The smallest differences between the calculation methods were found in the Stockholm programme, where the slope of the incidence rates over the 5-year period was very similar to the slope of the incidence rates over the 25-year period prior to the start of screening. In spite of this, some 20 years after the start of the screening programme there was a 32–34% difference between the highest and lowest PICRs. In the Danish programmes, where the 5-year incidence rates differed from the 25–year incidence rates, the differences in PICRs were much larger. These differences across the three programmes indicate that none of the four extrapolation methods can be recommended universally.
In the European Guidelines, it is stated that an acceptable level for PICR is <= 30% for the first 12-months and <= 50% for the second 12-months after the negative screening outcome. 1 Table 2 shows that by using different choices for estimation of the expected background incidence, all three programmes can be evaluated as reaching or not reaching an acceptable level for PICR. It therefore seems appealing to substitute ‘acceptable values’ and ‘desirable values’ for PICR with ‘acceptable values’ and ‘desirable values’ for another less fluctuating measure, for example, ICR. As the number of screen detected cases is higher in initial screens than in subsequent screens, ICR will be lower in initial screens than in subsequent screens. ‘Acceptable values’ and ‘desirable values’ for PICR would, therefore, have to distinguish between initial screenings and subsequent screenings.
We did not distinguish between initial screens and subsequent screens in this study. Because ICR will be lower in initial screens than in subsequent screens, ICRs cannot be compared across programmes without taking into account the ratio of initial screens in each programme and screening round.
The populations of Denmark and Sweden, as well as the way in which the mammography screening programmes are set up, are quite similar, and the programmes have resulted in reductions in breast cancer mortality of about 25% 19;20), similar to the mortality reduction found in other screening programmes. 21 This could indicate that the programme sensitivity was acceptable in all three programmes.
The PICR as the recommended measure of sensitivity relies on the estimated background incidence, combined with the interval cancers from the screening programme. There is, however, no consensus on how to estimate the background incidence, which hinders comparison of data across studies. Bordas et al 22 used a log linear extrapolation of the incidence rates in the 19-year period prior to the start of screening to estimate the background incidence rate. Day et al 9 used a linear extrapolation of the incidence rates in the 13-year period prior to the start of screening. Shorter periods have been used more frequently, for example Wang et al, Pellegrini et al, and Hofvind et al,23,24,6 all using the incidence rates from the 5 years prior to screening as the basis for their estimation of the background incidence rate. Periods ranging from 3 to 5 years were used by Törnberg et al, 5 and both Kavanagh et al and Woodman et al 3 used a 3-year period. Moss et al 11 used a combination of the 8-year period prior to the start of screening with results from the Swedish Two County Study to estimate the background incidence.
Incidence rates in non-screened populations from the same area covered by screening have also been used as the basis for the estimates.25,26 The differences across studies reflect differences in methods as well as differences in availability of pre-screening incidence data. We have illustrated the impact of the estimation method for the resulting PICRs. It can be argued that the PICR to a larger extent reflects the estimation method rather than the underlying sensitivity. The ICR measure, however, does not have this problem, as it is calculated from numbers directly available in most screening programmes. It would therefore be much easier for programmes to report on the ICR than the PICR. We believe that if the gold standard were to estimate ICR, the reporting of interval cancers/programme sensitivity would be much more widespread, enabling much more comparison between programmes.
Instead, the ICR relies on the number of screen-detected cancers, which is affected by length bias and overdiagnosis. In a review of studies that reported overdiagnosis estimates that were adjusted for breast cancer risk and sojourn time, Puliti et al showed that overdiagnosis ranged between 1–11%. 27 This amount of overdiagnosis will, for most programmes, not affect ICR as much as the choice of estimate for the background incidence affects PICR. If the breast cancer incidence is stable over time, and the amount of overdiagnosis is high, then PICR would be better than ICR.
Conclusion
Based on the data presented here from three independent, long-term, population-based mammography screening programmes, we find that the PICR, the establishing indicator for sensitivity, could preferably be replaced by the ICR.
Footnotes
Acknowledgement
This study was financially supported by the Nordic Cancer Union and by the PhD Programme of the University of Copenhagen.
Funding
This research received no specific grant from any funding agency in the public, commercial, or not-for-profit sectors.