
Abstract
Objective
In addition to disease-specific mortality, a randomized controlled cancer screening trial may be evaluated in terms of excess mortality, in which case no patient-specific information on causes of death is needed. We studied the effect of not accounting for attendance on the calculated excess mortality in a prostate cancer screening trial.
Methods
The numerator of the excess mortality rate related to prostate cancer diagnoses in each study arm equals the excess number of deaths observed in the cancer patients. The estimation of the expected number of deaths in the absence of the prostate cancer diagnoses has to account for the self-selection of those participating in the trial, particularly if the proportion of non-participants is substantial.
Setting
The European prostate cancer screening trial (ERSPC).
Results
In the screening arm, non-attendees had roughly twice the mortality rate of attendees. Approximately twice as many cancers were detected in the screening arm compared with the control arm, primarily in attendees. Unless attendance is properly accounted for, the expected mortality of prostate cancer patients in the screening arm is overestimated by 0.9–3.6 deaths per 1000 person-years.
Conclusions
Attendees have a lower all-cause mortality rate (are healthier) and a higher probability of a prostate cancer diagnosis than non-attendees and the men randomized to the control arm. If attendance is not accounted for, the excess mortality and the between-arm excess mortality rate ratio are underestimated and screening is considered more effective than it actually is. These effects may be sizeable, notably if non-attendance is common. Correcting for attendance status is important in the calculation of the excess mortality rate in prostate cancer patients that can be used in conjunction with a disease-specific mortality analysis in a randomized controlled cancer screening trial.
INTRODUCTION
A randomized study of screening for cancer typically focuses on the effect of screening on disease-specific mortality. To do so, the cause of death has to be determined. In the European Randomized Study of Screening for Prostate Cancer (ERSPC, an ongoing prostate cancer screening study in 8 European countries 1 ), all deaths in prostate cancer patients were reviewed by an independent committee. This committee labelled each death in cancer patients as prostate cancer death, possible prostate cancer death, intervention-related death or other cause of death. 2 The involvement of human experts at such a critical stage in the evaluation of a study and the potential for error prompted the search for alternatives. An alternative that does not require human judgement of the cause of death uses the excess mortality rate comparison between the screened and the control population. 3
The excess mortality rate in an arm of a trial is defined as the difference between the actually observed and the expected rate of death. An unbiased estimate of the expected mortality is of crucial importance in a study of excess mortality as is a correct labelling of the cause of death in a study of the disease-specific mortality.
In a previous paper 4 we used identical age-specific mortality rates for calculating the expected mortality for both the screening and the control arms. Also, within the screening arm, no distinction was made in age-specific mortality rates between men who actually attended a screening visit and men who did not.
This method of calculating the expected mortality, however, may be biased (not attending a screening visit may have a health-related reason). On the other hand, attendees may have a healthier life style (e.g. non-smokers) or have easier access to medical care. Not accounting for these facts may lead to a biased estimate of the expected mortality in the screening arm.
Studying this putative effect is the topic of this paper. We explicitly do not focus on the effectiveness of prostate cancer screening in terms of a between-arm comparison in excess mortality rate, that will be carried out and discussed in a separate paper. We used the material presented in a previous analysis augmented with material from the Finnish, 5 the Italian 6 and the Swedish 7 ERSPC centres. These centres are of special interest because the number of non-participants in the screening arm is high. They used preconsent (i.e. up-front) randomization. This means that the men were enrolled into the study on the basis of the population registry without being aware of this. This results in 100% participation in the control arm and a variable rate of non-attendance in the screen arm (effectiveness trial, focusing on the effect of screening in the underlying population). In contrast, the participants in the Dutch region of ERSPC were randomized after giving informed consent (efficacy trial, which estimates the maximal effect of screening).
MATERIALS AND METHODS
We studied 149,066 participants enrolled in the ERSPC (centres in Finland, Italy, Sweden, aged 55–69 and the Netherlands, aged 55–74 at randomization, over the period 1993–2006);1,8 66,311 men were randomized to the screening arm and 82,755 to the control arm. The randomization was 2 to 3 in the Finnish centre (more men were randomized to the control arm), and 1 to 1 in the other centres.
In a study arm, the observed mortality rate in persons without prostate cancer was used to calculate, for the prostate cancer patients, the expected number of deaths in the hypothetical absence of their prostate cancer. Subsequently, the excess number of deaths in cancer patients was calculated as the difference between the expected and observed numbers of deaths. The excess mortality in participants without prostate cancer is zero, by definition.
In order to study the dependency of the calculated excess mortality on the way to calculate the expected mortality the latter was estimated in three ways. The crudest method calculates age-specific mortality rates in all persons without prostate cancer, a more accurate method incorporates the study arm and the most precise method incorporates both the study arm and attendance status. The mathematical details on how to account for participation in calculating expected mortality are given in Appendix A.
For all centres by each attained age (accuracy one year), the excess number of deaths was calculated as the difference between the observed and expected numbers of deaths in cancer patients. The excess mortality rates were calculated by dividing the excess numbers of deaths by the numbers of person-years in all persons in the arm irrespective of disease status for that attained age. The difference between the expected mortality rate corrected for screening arm only and that corrected additionally for attendance status was used as an estimate of bias in expected mortality. The same was done for the excess mortality. The mean bias in the expected mortality was calculated for all centres as the sum of the biases in the expected number of deaths over all attained ages divided by the total number of person-years.
For each study centre, the details of the calculation of the expected mortality rate (taking and not taking attendance status into account, respectively) in prostate cancer patients with an attained age of 70 years are given, with actual data, in Appendix B. This information is supplied to support the details given.
As the persons in the control arm did not attend screening, the excess mortality rates of the prostate cancer patients in the control arm and in the arm as a whole were determined by fixing the participation proportions in Appendix A to zero. This resulted in the application of the arm-specific expected mortality also for the prostate cancer patients in the control arm.
The age-specific estimates were smoothed by fitting a Poisson regression model to the number of deaths with the attained age, centred at 65 years as the sole predictor and the logarithm of the number of person-years at risk as an offset to the model constant. 9
The crude and smoothed mortality rates were compared with the country-specific mortality rates obtained from the Human Mortality Database. 10 Men in whom prostate cancer was found at autopsy were excluded from the calculations of the excess mortality. This was not done in the previous study. 4
RESULTS
Summary of baseline data and expected and excess numbers of deaths derived from these baseline data for all study centres (age ranges at randomization given in brackets)
The left panel summarizes the data used to calculate the expected mortality in non-prostate cancer (‘healthy’) persons, the right panel lists the expected and excess mortality if the ‘healthy’ persons’ mortality rate is applied as an expected mortality to prostate cancer patients
The codes for the different subgroups are: S, screening arm; C, control arm; SC, both arms combined; A, participants (attendees); and NA non-participants. N is the number of persons in the group, C number of prostate cancer cases, nh number of person-years among the ‘healthy’ and dh number of deaths among the ‘healthy’. The quantity nc stands for number of person-years of the prostate cancer patients in the group and dc number of deaths among these prostate cancer patients
Thus, the excess numbers of deaths calculated directly, without accounting for age, from the mortality reported in Table 1 in ‘healthy’ persons (without prostate cancer) typically differed from the corresponding reported excess deaths in the table. This illustrates the importance of using attained age-specific mortality rates, e.g. for the Finnish centre, for the screening arm, the excess number of deaths derived from the deaths and person-years reported in the table equals 309–(4695/269,814) × 11,016 = 117.3 (considerably higher than the 56.9 listed).
For all centres accounting for attendance status leads to higher estimates of the excess mortality (compare the excess mortality given in row 1 with the sum of the excess mortalities in the rows labelled A and NA for each centre in Table 1).
The expected number of deaths in the row labelled SC is much higher than the sum of the expected deaths in the rows labelled A and NA in Table 1. The results labelled with SC are obtained by accounting for the study centre only (i.e. the method used in the previous paper 4 ). The difference is especially large for the Finnish and the Swedish study centres.
Accounting for attendance gives for the Finnish centre 88.3 excess deaths in the study arm, whereas not accounting for it as in the previous study 4 gives a much smaller number, 53.2 excess deaths. Both of these excess numbers are nevertheless smaller than the number of excess deaths in the control arm (132.4), but the lack of accountancy gives an overly favourable effect for the screening, by 88.3–53.2 = 35.1 excess deaths.
In the Swedish centre, not accounting for attendance gives a negative number for the excess deaths in the screening arm (−2.7 deaths). On the contrary, accounting for attendance gives 11.5 excess deaths, which is also much smaller than the 28.4 excess deaths in the control arm.
Appendix B lists the excess mortality rates for prostate cancer patients in the screening arm with an attained age of 70 for the four centres studied. The bias is largest for the Swedish centre where the ‘baseline mortalities’ ras and rns between attendees and non-attendees are quite different combined with quite different proportions of person-years in the ‘healthy attendees’ was and in cancer patients who had attended a screening visit wap (see Appendix A for further explanation).
In Figure 1 the bias that results in the expected mortality rate of the patients by not accounting for attendance status is plotted for all attained ages by study centre. The average bias in the expected mortality-rates per 1000 person-years is 3.6, 2.9, 1.1 and 0.9 for Sweden, Finland, Italy and the Netherlands, respectively.
Bias in the expected mortality rate of the prostate cancer patients in the screening arm as a function of the attained age for the four centres studied. The bias is caused by not accounting for attendance status in the calculation of the expected mortality rate. The vertical line corresponds with the data given in Appendix B. The line with the shortest age-range is for Sweden (dash-dot), the next one is for Finland (solid), then Italy (dash) and the Netherlands (dot). All rates are given per 1000 person-years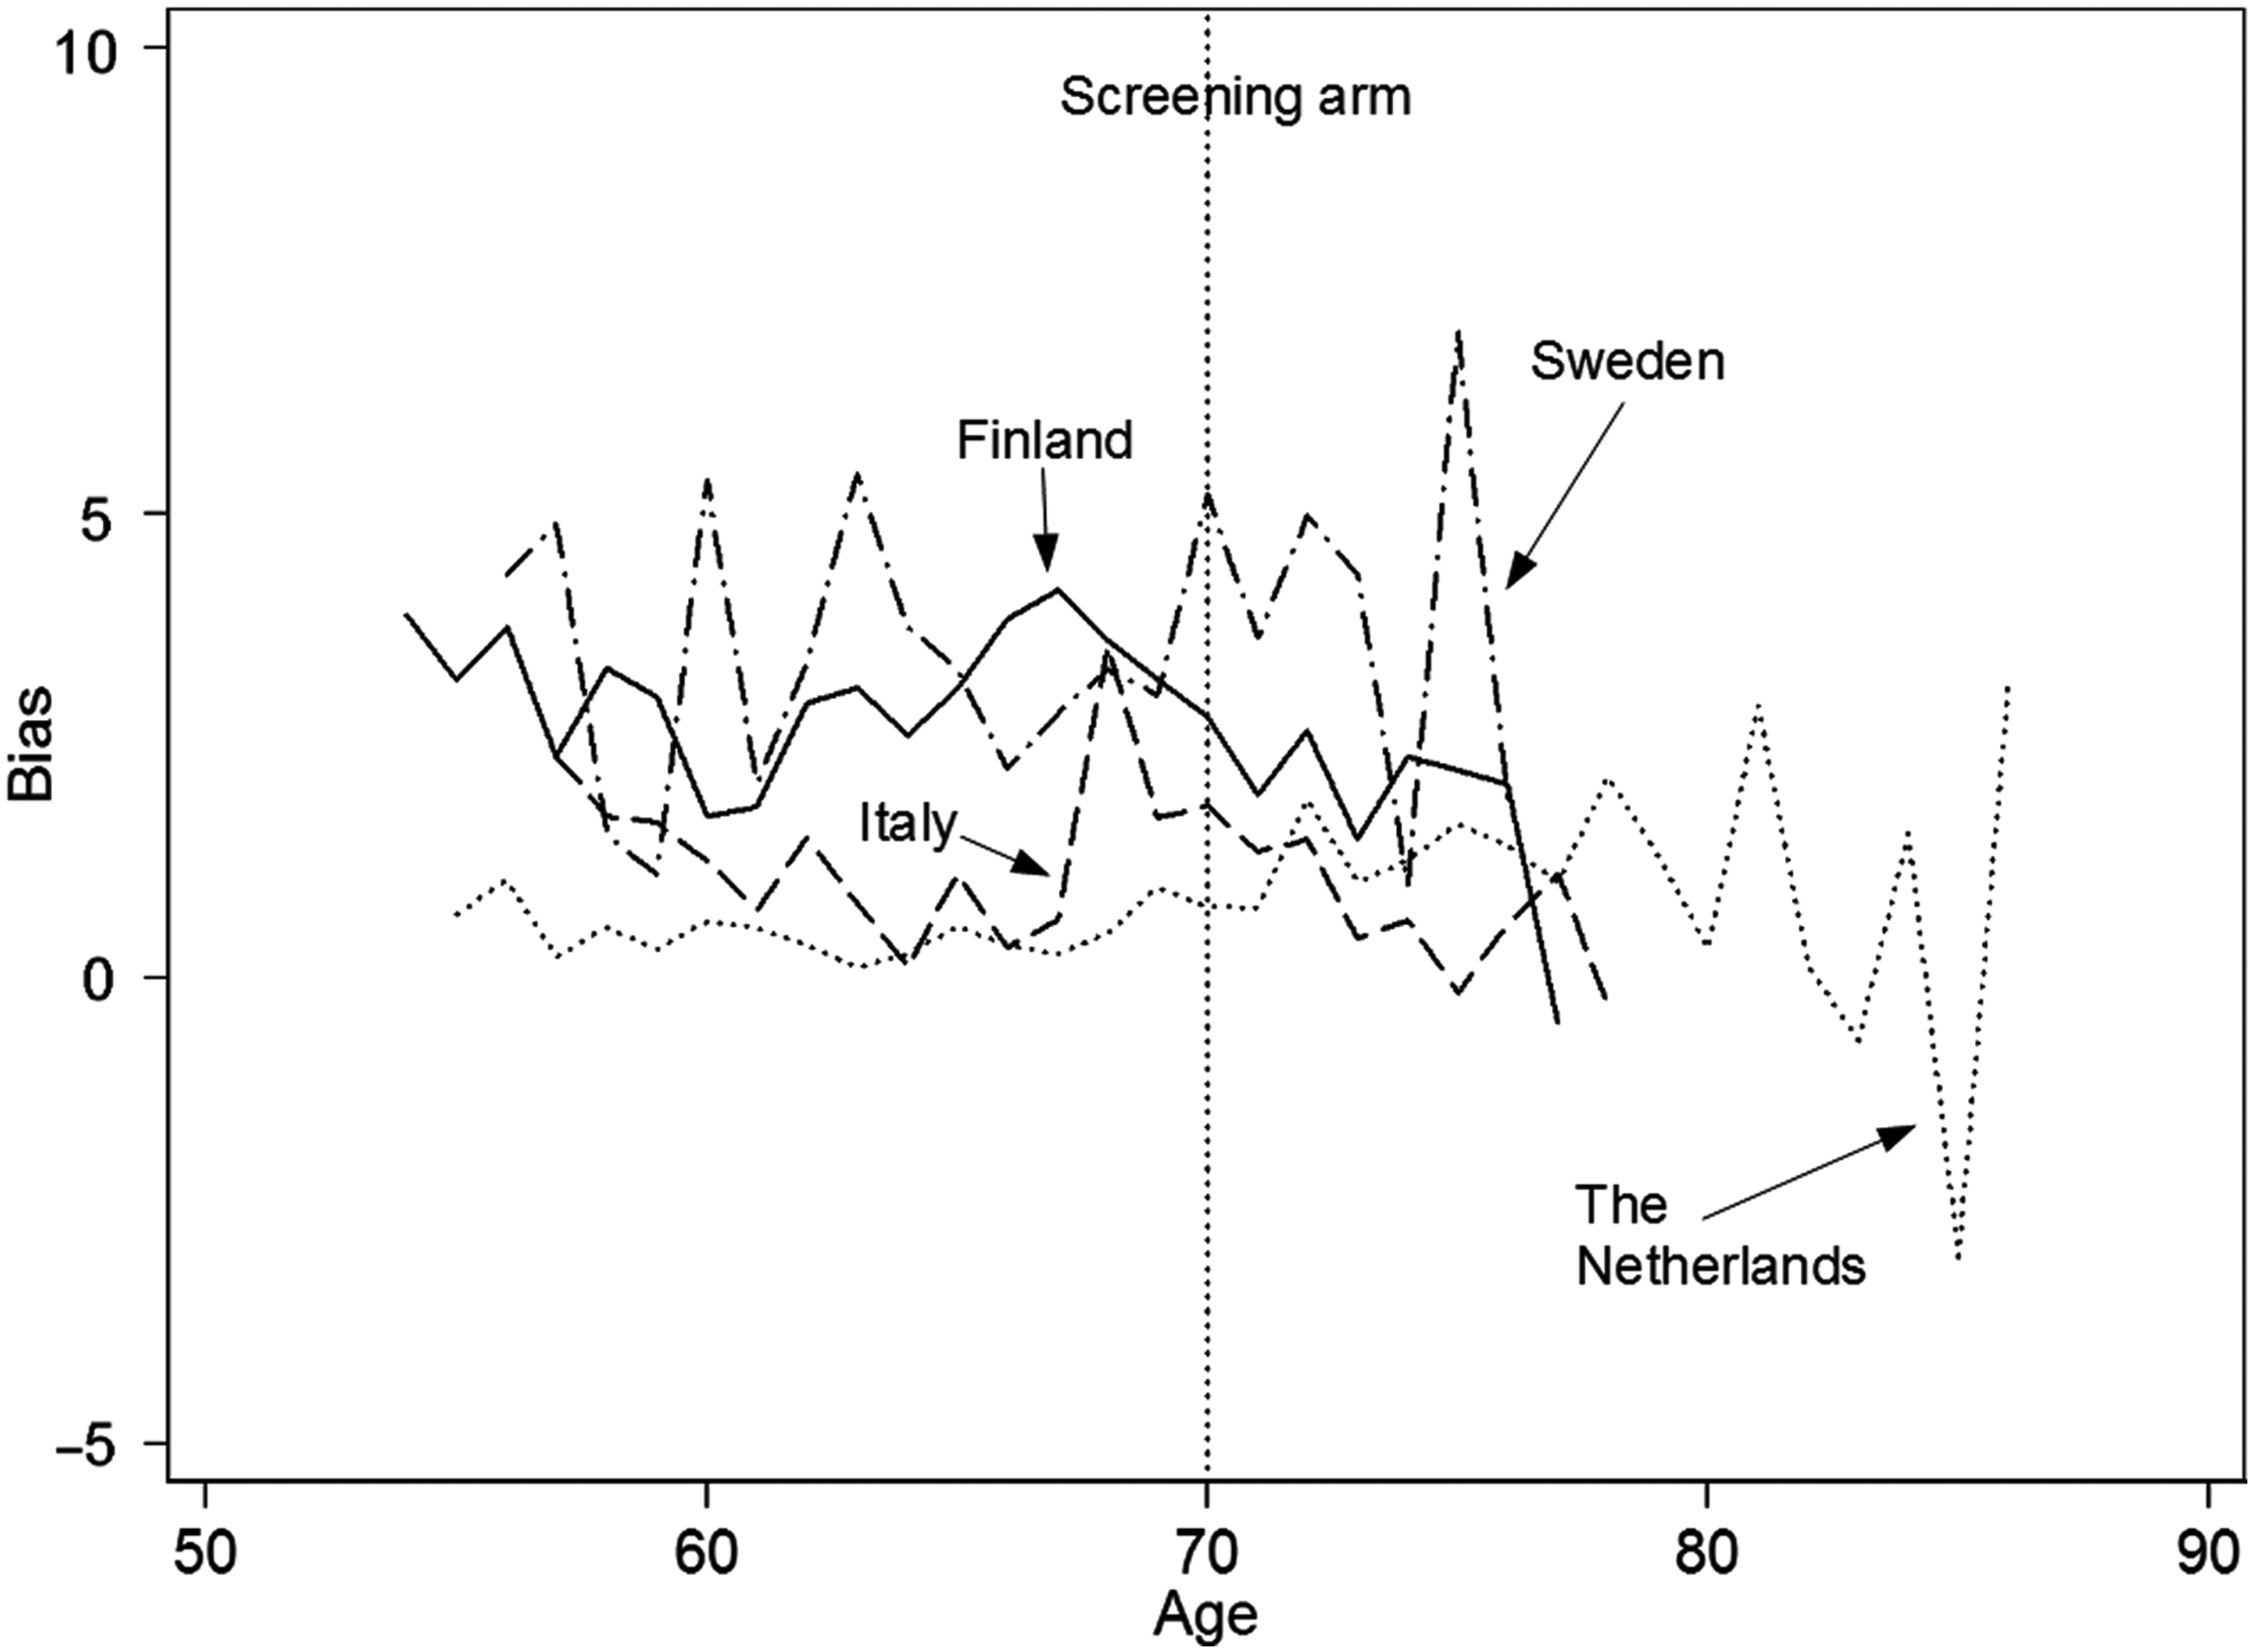
In Figure 2, the bias that results in the excess mortality rate in the screening arm by not accounting for attendance status is plotted for all attained ages, by study centre. The bias increases with increasing age.
Bias in the excess mortality rate in the screening arm as a function of the attained age for the four centres studied. The vertical line corresponds to that of Figure 1. The line with the shortest age-range is for Sweden (dash-dot), the next one is for Finland (solid), then Italy (dash) and the Netherlands (dot). All rates are given per 1000 person-years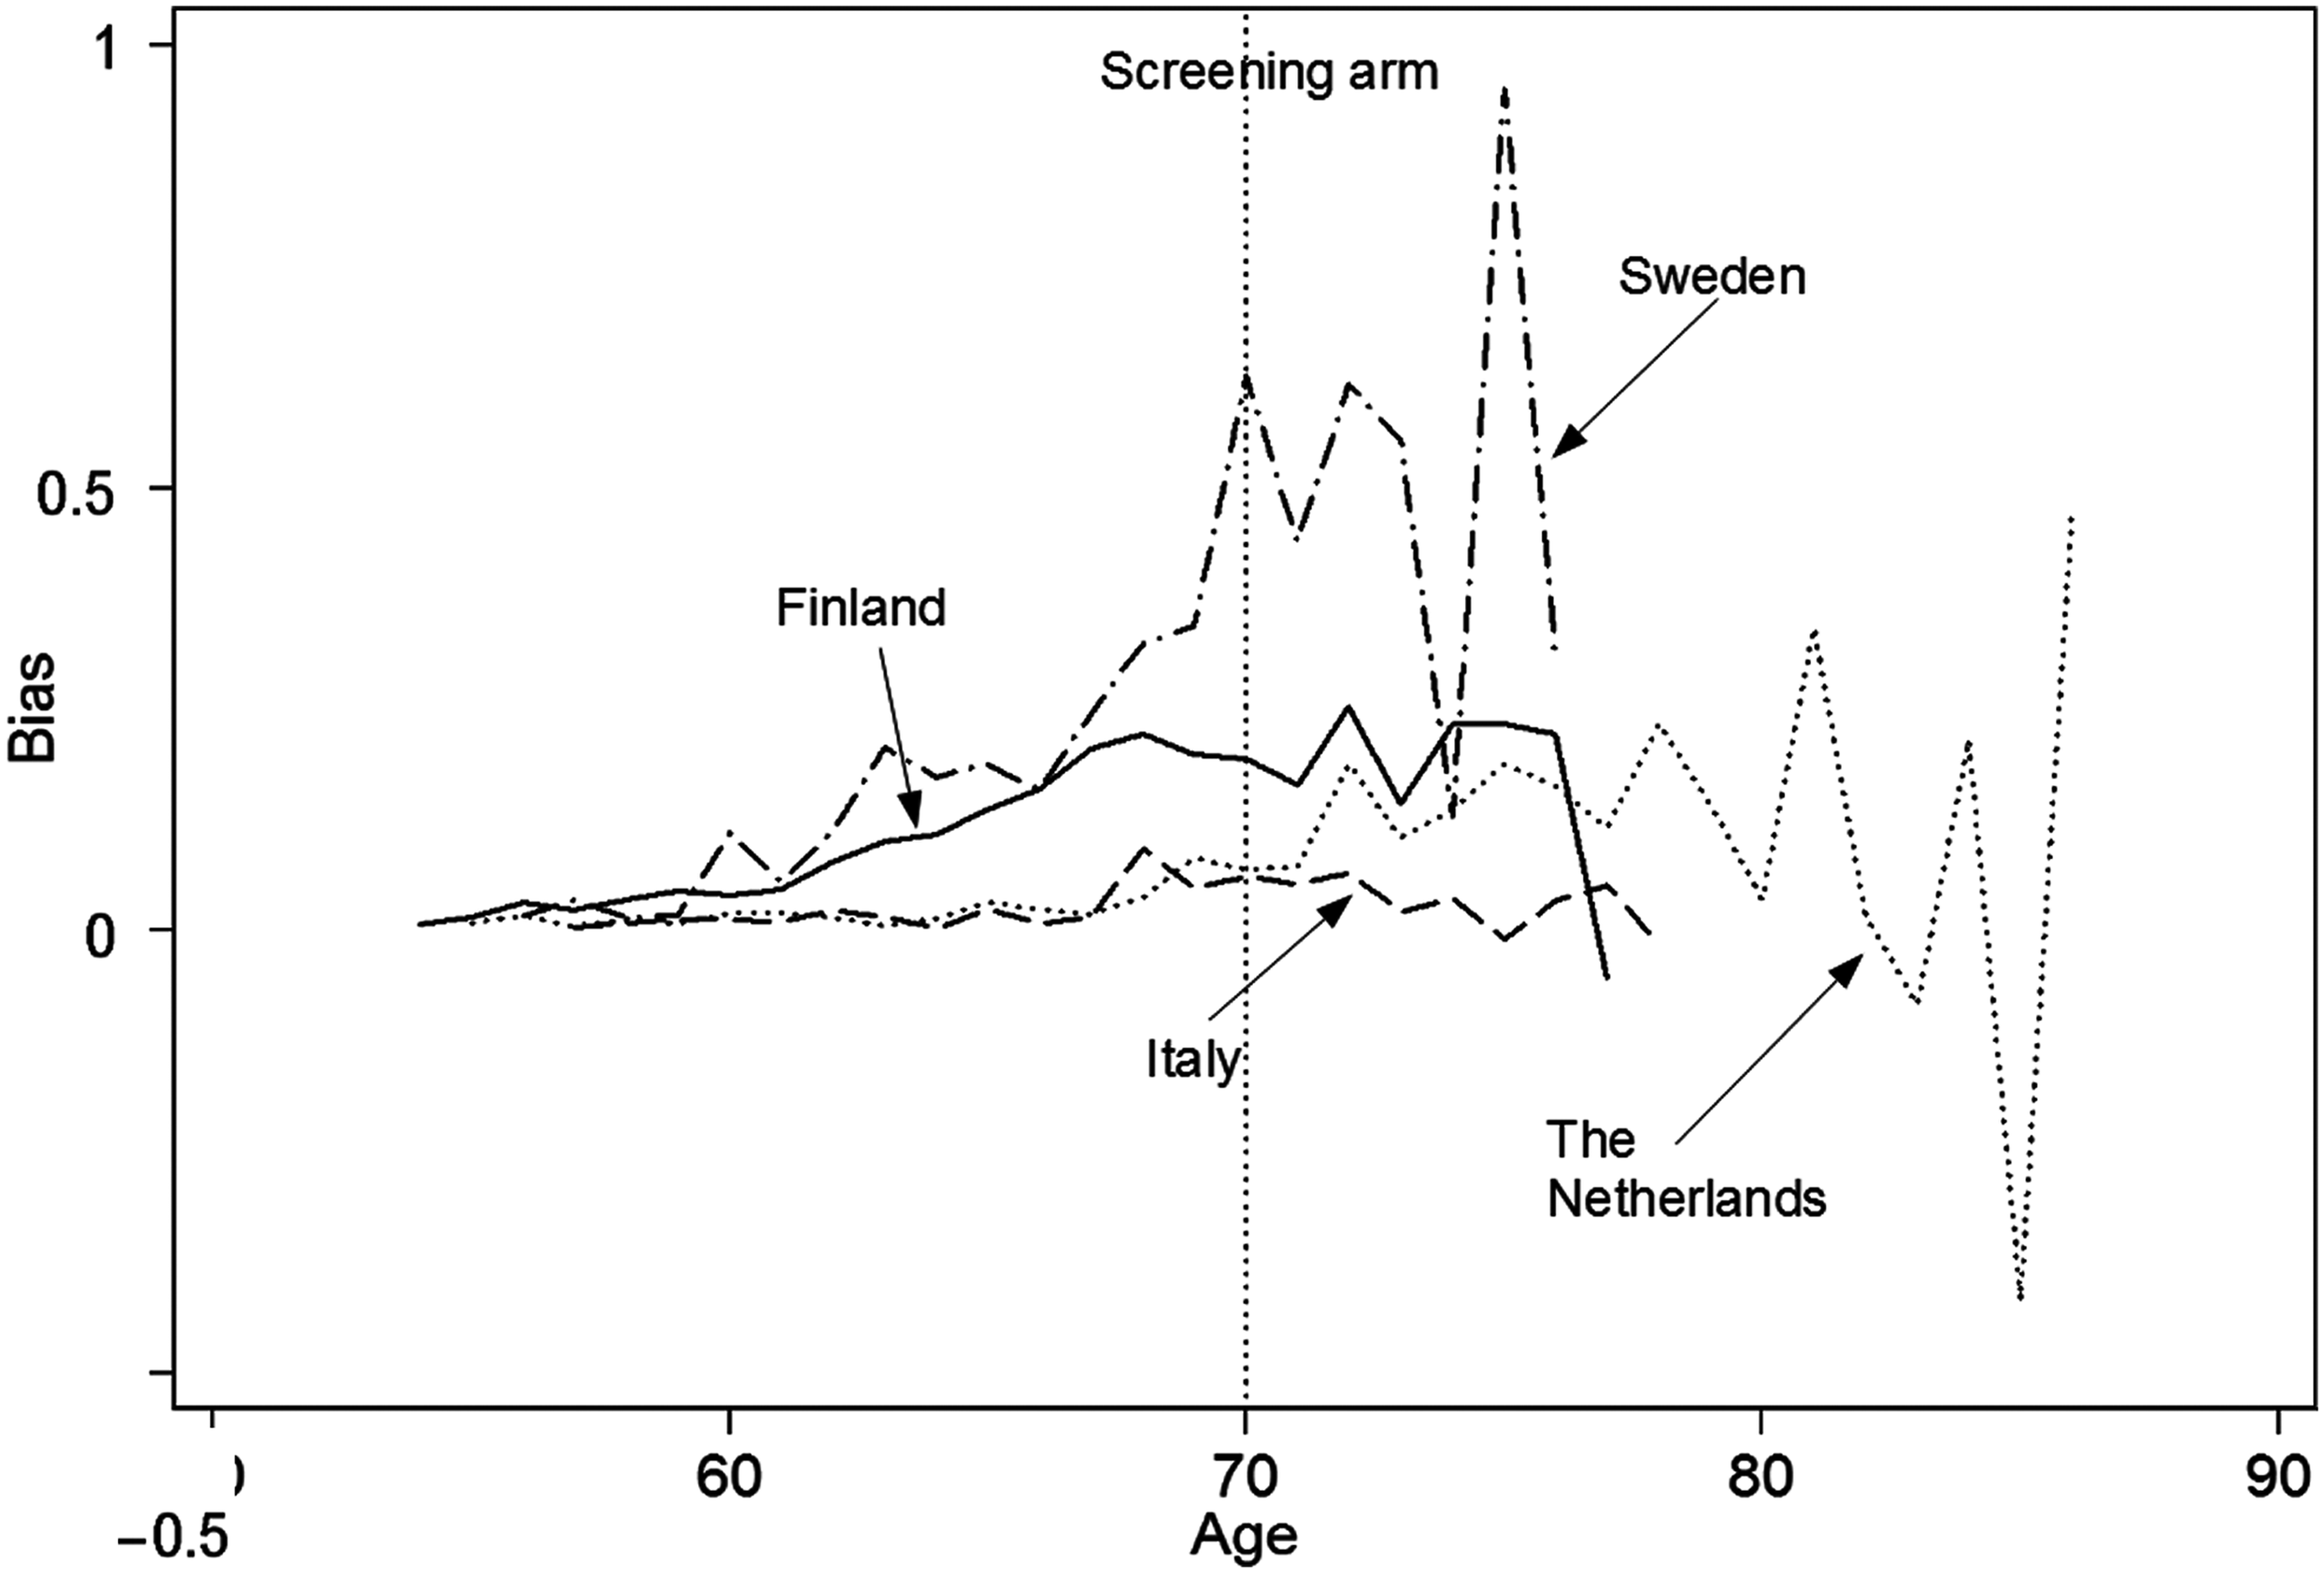
Example of the expected mortality rates per 1000 person-years by centre for the attained age of 65 for the four categories of participants discerned in this study
Subgroup code S, stands for screening arm; A for participants; NA for non-participants and C for control arm
DISCUSSION
A randomized controlled trial of screening for cancer is typically analysed in terms of the between-arm contrast in the disease-specific mortality. Thus the disease-specific mortality in the screening arm is compared with the control arm. This requires accurate information on the cause of death (involving human judgement). In addition, other effects of the screening process that affect mortality may be missed (e.g. detection of cardiovascular problems or diabetes). Both problems would be solved by carrying out an all-cause mortality analysis. 11 The reason that is mentioned in the literature for not doing precisely this is that the effect of screening on all-cause mortality is typically small, e.g. for prostate cancer, we assume that a third of the prostate cancer mortality was avoided by screening. If the lifetime risk of dying of prostate cancer were 3% (chosen for ease of computation but close to the actual numbers 12 ) the effect of screening on all-cause mortality would be 1%. This relative difference is much smaller than the assumed 33% prostate cancer specific mortality reduction. Showing a 1% effect instead of a 33% effect beyond a reasonable doubt (i.e. with reasonable accuracy or statistical significance) requires prohibitively large numbers of trial participants. The precision of a study is proportional to the square of the number of events (proportional to the number of participants). Thus a study that is twice as precise requires four times the number of participants. However, if we assume that a between-arm effect of a randomized controlled trial is confined to the patients in whom cancers are detected, an all-cause mortality analysis can be carried out without needing so many participants. 4
An excess all-cause mortality analysis in the cancer patients can be applied as an alternative but preferably, at least, as an augmentation of a disease-specific mortality analysis. Given that excess mortality is the difference between the observed and the expected mortality and the possibility to obtain the former by database linkage (i.e. in theory flawlessly), an accurate determination of the expected mortality is of critical importance.
From a comparison of the expected mortality rates with the population mortality rates in Table 2 it is obvious why the latter was not used to estimate the excess mortality. It is lower than the expected mortality rate for Sweden and higher for Italy. A plot for all ages for the Netherlands of the expected mortality rate on the basis of the trial data and the Dutch population mortality rate in men (not shown) shows considerable differences despite the reasonable agreement at age 65 (Table 2). Thus, the use in this study of population-based mortality rates will lead to a bias. Therefore we have derived the expected mortality from within the trial, based on the participants in whom no cancer was yet detected. Another reason is that none of the four centres covered a representative population of the respective country.
In screening trials such as the ERSPC, an ‘intention to screen’ analysis is used. Thus the disease-specific screening arm mortality rate is compared with the corresponding control arm mortality rate, irrespective of actual screening attendance. This approach is conservative. If an effect of screening is detected in an ‘intent to screen’ analysis, it is very likely larger in individuals who are actually screened.
Non-attendees have a relatively high mortality rate (health-related, socioeconomic status or education-related). This has been reported for the Swedish centre 13 and is corroborated by the information given in Appendix B (mortality rate in non-attendees is double the mortality rate for attendees in all four centres).
This paper shows that not accounting for attendance status in the calculation of the excess mortality may lead to a serious bias. It is affected by two factors. It increases if the ratio attendees/non-attendees in the cancer patients in the screening arm differs more strongly from the ratio attendees/non-attendees in the ‘healthy’ screening participants. Intuitively this can be understood as follows: men who attend for screening are healthier (i.e. less likely to die) than men who do not attend. Due to screening, cancers are primarily detected in these men. The bias also increases if the difference in the mortality rates between attendees and non-attendees (both without prostate cancer) increases. If attendance status is not accounted for, the expected number of deaths is overestimated and therefore the excess number of deaths is underestimated. The same holds for the expected and excess mortality rates. Therefore, because this effect occurs in the screening arm, the excess mortality rate ratio between the two arms is underestimated and the effect of screening overestimated. The screening programme appears to be more effective than it actually is.
The data presented in this paper illustrate the reality of this problem. For the Swedish study centre, the excess mortality in the screening arm is negative if attendance status is not accounted for. This is an unlikely observation because the excess mortality is determined in cancer patients. The proportion of attendance is apparently strongly related to the type of randomization. A much higher proportion (roughly 25%) of non-attendees were present in the Italian, Finnish and Swedish study centres (with up front randomization) than in the Dutch centre (5% non-attendees). On the other hand, in the Dutch centre approximately 50% of the men invited for screening did not give consent. 8 Thus, the largest bias is observed in the three centres with upfront randomization (the related high percentage of non-attendance makes a bias more likely in an intention to screen analysis).
The relation between disease-specific and excess mortality is cancer-type dependent, e.g. smoking causes both lung cancer and cardiovascular deaths. The excess mortality is related to both causes, and therefore both an excess and a disease-specific mortality analysis should be done. Furthermore, the excess incidence in the screening arm consists of two parts, early diagnosis (lead time, i.e. cancer is found sooner but would have surfaced anyway) and overdiagnosis (cancer would not have surfaced during a patient's life time).
Both add to the expected mortality bias if attendance is not properly accounted for. The amount of overdiagnosis (and thus the bias) strongly depends on the type of cancer. Correcting for attendance is likely more important in prostate cancer screening (relatively high overdiagnosis) than in breast cancer screening with the same follow-up.
There is some opportunistic screening in the control arm of the ERSPC, very likely predominantly in healthy men. Correction for this fact is impossible. It requires information about opportunistic screening at the level of the individual patient (which is not available). Thus the estimate of the expected mortality for the control arm is too high and the estimate of excess mortality too low (using the same logic as given above for the screening arm). This means that if a screening study is evaluated by a between arm study of the excess mortality rates, the outcome is conservative (at least if attendance status is accounted for in the screening arm). The actual effect of screening on the excess mortality rate is in reality very likely slightly larger than the calculated value.
Figure 1 shows that the effect of accounting for attendance status on the expected mortality of the patients in the screening arm is roughly constant at each attained age. The effect on the excess mortality rate in the screening arm as a whole, however, depends on the attained age (Figure 2) because the incidence of prostate cancer increases with age. The observed mortality is associated with this incidence. Thus the bias in the excess mortality rate increases with increasing age.
CONCLUSION
Correcting for attendance status is very important in the calculation of the excess mortality rate in prostate cancer patients that can be used in conjunction with a disease-specific mortality analysis in a randomized controlled cancer screening trial.
Footnotes
Appendix A
Appendix B
Details of the calculation of the expected mortality rate in men with an attained age of 70 in the screening arm (see Appendix A, also for the symbols used). All rates are given per 1000 person-years. The term cancer refers to prostate cancer. The term ‘healthy’ refers to persons without prostate cancer
Centre
Mortality rate
Mortality rate
Proportion of
Proportion of
Expected
Expected
Bias in
r
as
r
ns
w
as
w
ap
r
s
r
ps
rs – rps
Finland
20.04
51.03
0.75
0.84
27.75
24.96
2.8
Italy
15.61
28.09
0.74
0.89
18.85
16.97
1.9
Netherland
21.47
37.36
0.94
0.99
22.45
21.66
0.8
Sweden
20.57
51.49
0.77
0.94
27.71
22.45
5.3