
Abstract
Eco-friendly nanoparticles modified-coconut coir based capacitive sensors (C, CN, CI, CIN and I) were fabricated. Compressive pressure led to a reduction in their thickness and lowered the frequencies to 49.8∼50.7Hz. In terms of resistance-pressure change, the sensor I generally recorded the best sensitivity (S), with the highest value (0.68kPa-1, r2∼0.9) obtained within 0.26∼0.44kPa ranges. Also, sensor I exhibited an ultra-sensitive voltage detection at all pressure ranges, with the highest value (48.5kPa-1) recorded at 0∼0.17kPa with a strong linearity (r2∼0.998). In detection of capacitance, CN was very effective at lower pressure range; 0∼0.087kPa while sensor I outperformed CN as elevated pressure 0.087∼5.2kPa. Sensor I was also effective in energy harvesting analysis, especially at elevated pressures. In terms of flexibility study, the order of the absolute gage factor (GF) of the sensors was I (GF∼0.25, r2∼0.995) > CN (GF∼0.084, r2∼0.97) > C (GF∼0.082, r2∼0.91) > CI (GF∼0.061, r2∼0.94) > CIN (GF∼0.082, r2∼0.91). The sensors exhibited consistency and stability even after 2000 cycles of detections, linked to the porous nature of the coir and the suitable elastic fatigue acrylic used. Thus, coconut coir waste has been demonstrated to meet green electronics and circular economy goals by enhancing the biodegradability of capacitive sensors.
1. Introduction
Capacitive sensors are integral components in modern sensing technology due to their high sensitivity, low power consumption, and simple construction. They function by detecting changes in capacitance resulting from the presence or movement of an object or changes in the dielectric material between electrodes.1–7 To enhance its dielectric properties and sensitivity in capacitive sensing, dielectric layer can be functionalized, coated or infused with nanoparticles such as zinc oxide (ZnO), titanium dioxide (TiO2), barium titanate (BaTiO3), or carbon-based nano-materials (carbon black(C), graphene, and carbon nanotubes(N) etc.).8–13 These nanoparticles improve electrical response by increasing its polarizability and surface interaction with stimuli (e.g., pressure, humidity, or chemicals.14,15
Several capacitive pressure sensors have been developed over the years, some include; those built for on-line cure monitoring of resin matrix composite materials by Jin et al., 16 identification of generic liquids/fluids and their mixtures by Sun et al. 17 and Zhu et al., 18 robot fingers by Chiba et al. 19 and the wearable tactile pressure sensor by Hsieh et al. 8 etc. Another grade of the capacitive sensor on the rise is those with their sandwiched dielectric layers developed with hybrid nanoparticles. Example, Wang et al. 12 recently fabricated flexible capacitive pressure sensor made of a dielectric layer composed of a polydimethylsilane (PDMS)/BaTiO3/SrTiO3 composite material. This sensor obtained a sensitivity of 2.681 kPa–1 which outperformed that of polyurethane coated nanotube(N)-BaTiO3 which recorded a sensitivity of 2.51 kPa-1 under 0–100 kPa. 5
However, most of these capacitive sensors, with their dielectric layers having single or hybrid nanocomposites fillers are associated with common issues such as; small range changes (often in picofarad or femtofarad), complexity in fabrication, hysteresis, non-linearity in capacitance-pressure, mechanical fatigue, and low sensitivity etc..12,18,20 Liu et al. 21 has so far reported a superhigh sensitivity of 9280 kPa−1 based on high-porosity foam-based iontronic pressure. Such designs may not only be associated with design complexity and time consumption but may also be associated with high cost.12,18,20 Another significant issue that has received limited attention over the years is the environmental threat posed by most of these sensors, as they are predominantly composed of non-biodegradable polymeric materials (PDMS,1,19 Polyurethane4,5 and thermosets 7 etc.) while the management of waste generated at the end of their service life remains largely unaddressed.
Recent advances in materials science and technology have necessitated for the exploration of natural, biodegradable, and sustainable materials in sensor fabrication. This is to balance design, material selection and sensitivity performance while addressing environmental concerns associated with capacitive sensor designs. Coconut coir is a lignocellulosic fiber derived from coconut husk, an abundant agro-waste by-product of the coconut industry that poses a growing global environmental challenge due to improper disposal.22,23 Recently, coconut coir has attracted increasing attention as an eco-friendly and sustainable functional material owing to its inherent porosity, favorable mechanical strength, and high surface area.22,23 These intrinsic structural characteristics make coconut coir particularly suitable for sensing applications. In this work, porous coconut coir agro-waste is employed as a functional dielectric layer to develop a flexible capacitive pressure sensor with tunable sensitivity and enhanced biodegradability, achieved through the partial replacement of conventional dielectric materials. This strategy effectively converts coconut coir from an environmental liability into a value-added, eco-friendly sensing platform.
To do this, a synergistic combination of nanoparticles-coconut coir was prepared and used as a dielectric material via sonication, drying and assembling. Silver fabric was used as conductive electrodes. This approach not only supports environmental sustainability by utilizing agricultural waste but also enables the development of cost-effective sensors for applications in environmental monitoring, healthcare, and smart textiles. The results obtained are clearly presented.
2. Experimental design
2.1. Materials and devices
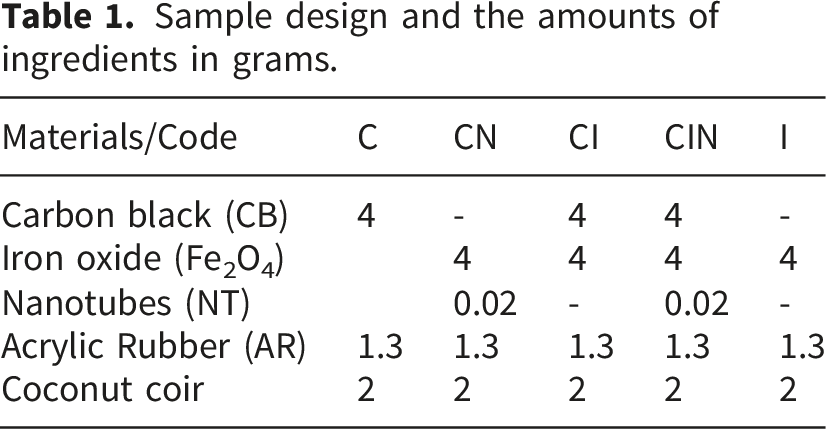
Sample design and the amounts of ingredients in grams.
2.2. Methodology: Sample preparations
To fabricate the flexible pressure sensor, the nanoparticles (Carbon black (C), nanotubes (N), carbon black-nanotubes (CN), iron oxide (I) carbon black-iron oxide (CI) and carbon black-nanotube-iron oxide (CIN)) were separately dissolved in dimethylfuran solution via ultra-sonicated for about 1h each. Later, equal amount (2∼3 g) of the spongy porous coconut coir was weighed and submerged into each of the sonicated mixtures. The mixtures were further sonicated for additional 1hr for the particles to adhere and homogeneously mix with the coir. The porous coir was removed from the solutions and oven dried for about 5hr under a temperature of 60oC. The dried coir was placed in-between two square-shaped acrylic rubbers (AR) of about 3.3 x 3.3 cm dimension with average weight of ∼1.3g. Each side of the AR was backed by conductive silver electrode fabric. Using the silver (Ag) as the conductive electrodes provides excellent conductivity, stability, and compatibility with flexible substrates. The respective dimensions of the fabricated sensors are C (3.4 cm x 3.3 cm x 0.2 cm), CN (3.5 cm x 3.4 cm x 0.26 cm), CI (3.5 cm x 3.6cm x 0.27 cm), CIN (3.5 cm x 3.4 cm x 0.26 cm) and I (3.6 cm x 3.4 cm x 0.21 cm) (Figure 1). Development process of the coco-coir based sensors (a) ultra-sonication of coir in dissolved nanoparticles (b) drying of the coir-soaked nanoparticles (c) sandwiching of coir layer in between AR and (d) backing of AR by electrically conductive silver fabric and (e) An indication of the initial thickness of the sensor when no load is applied.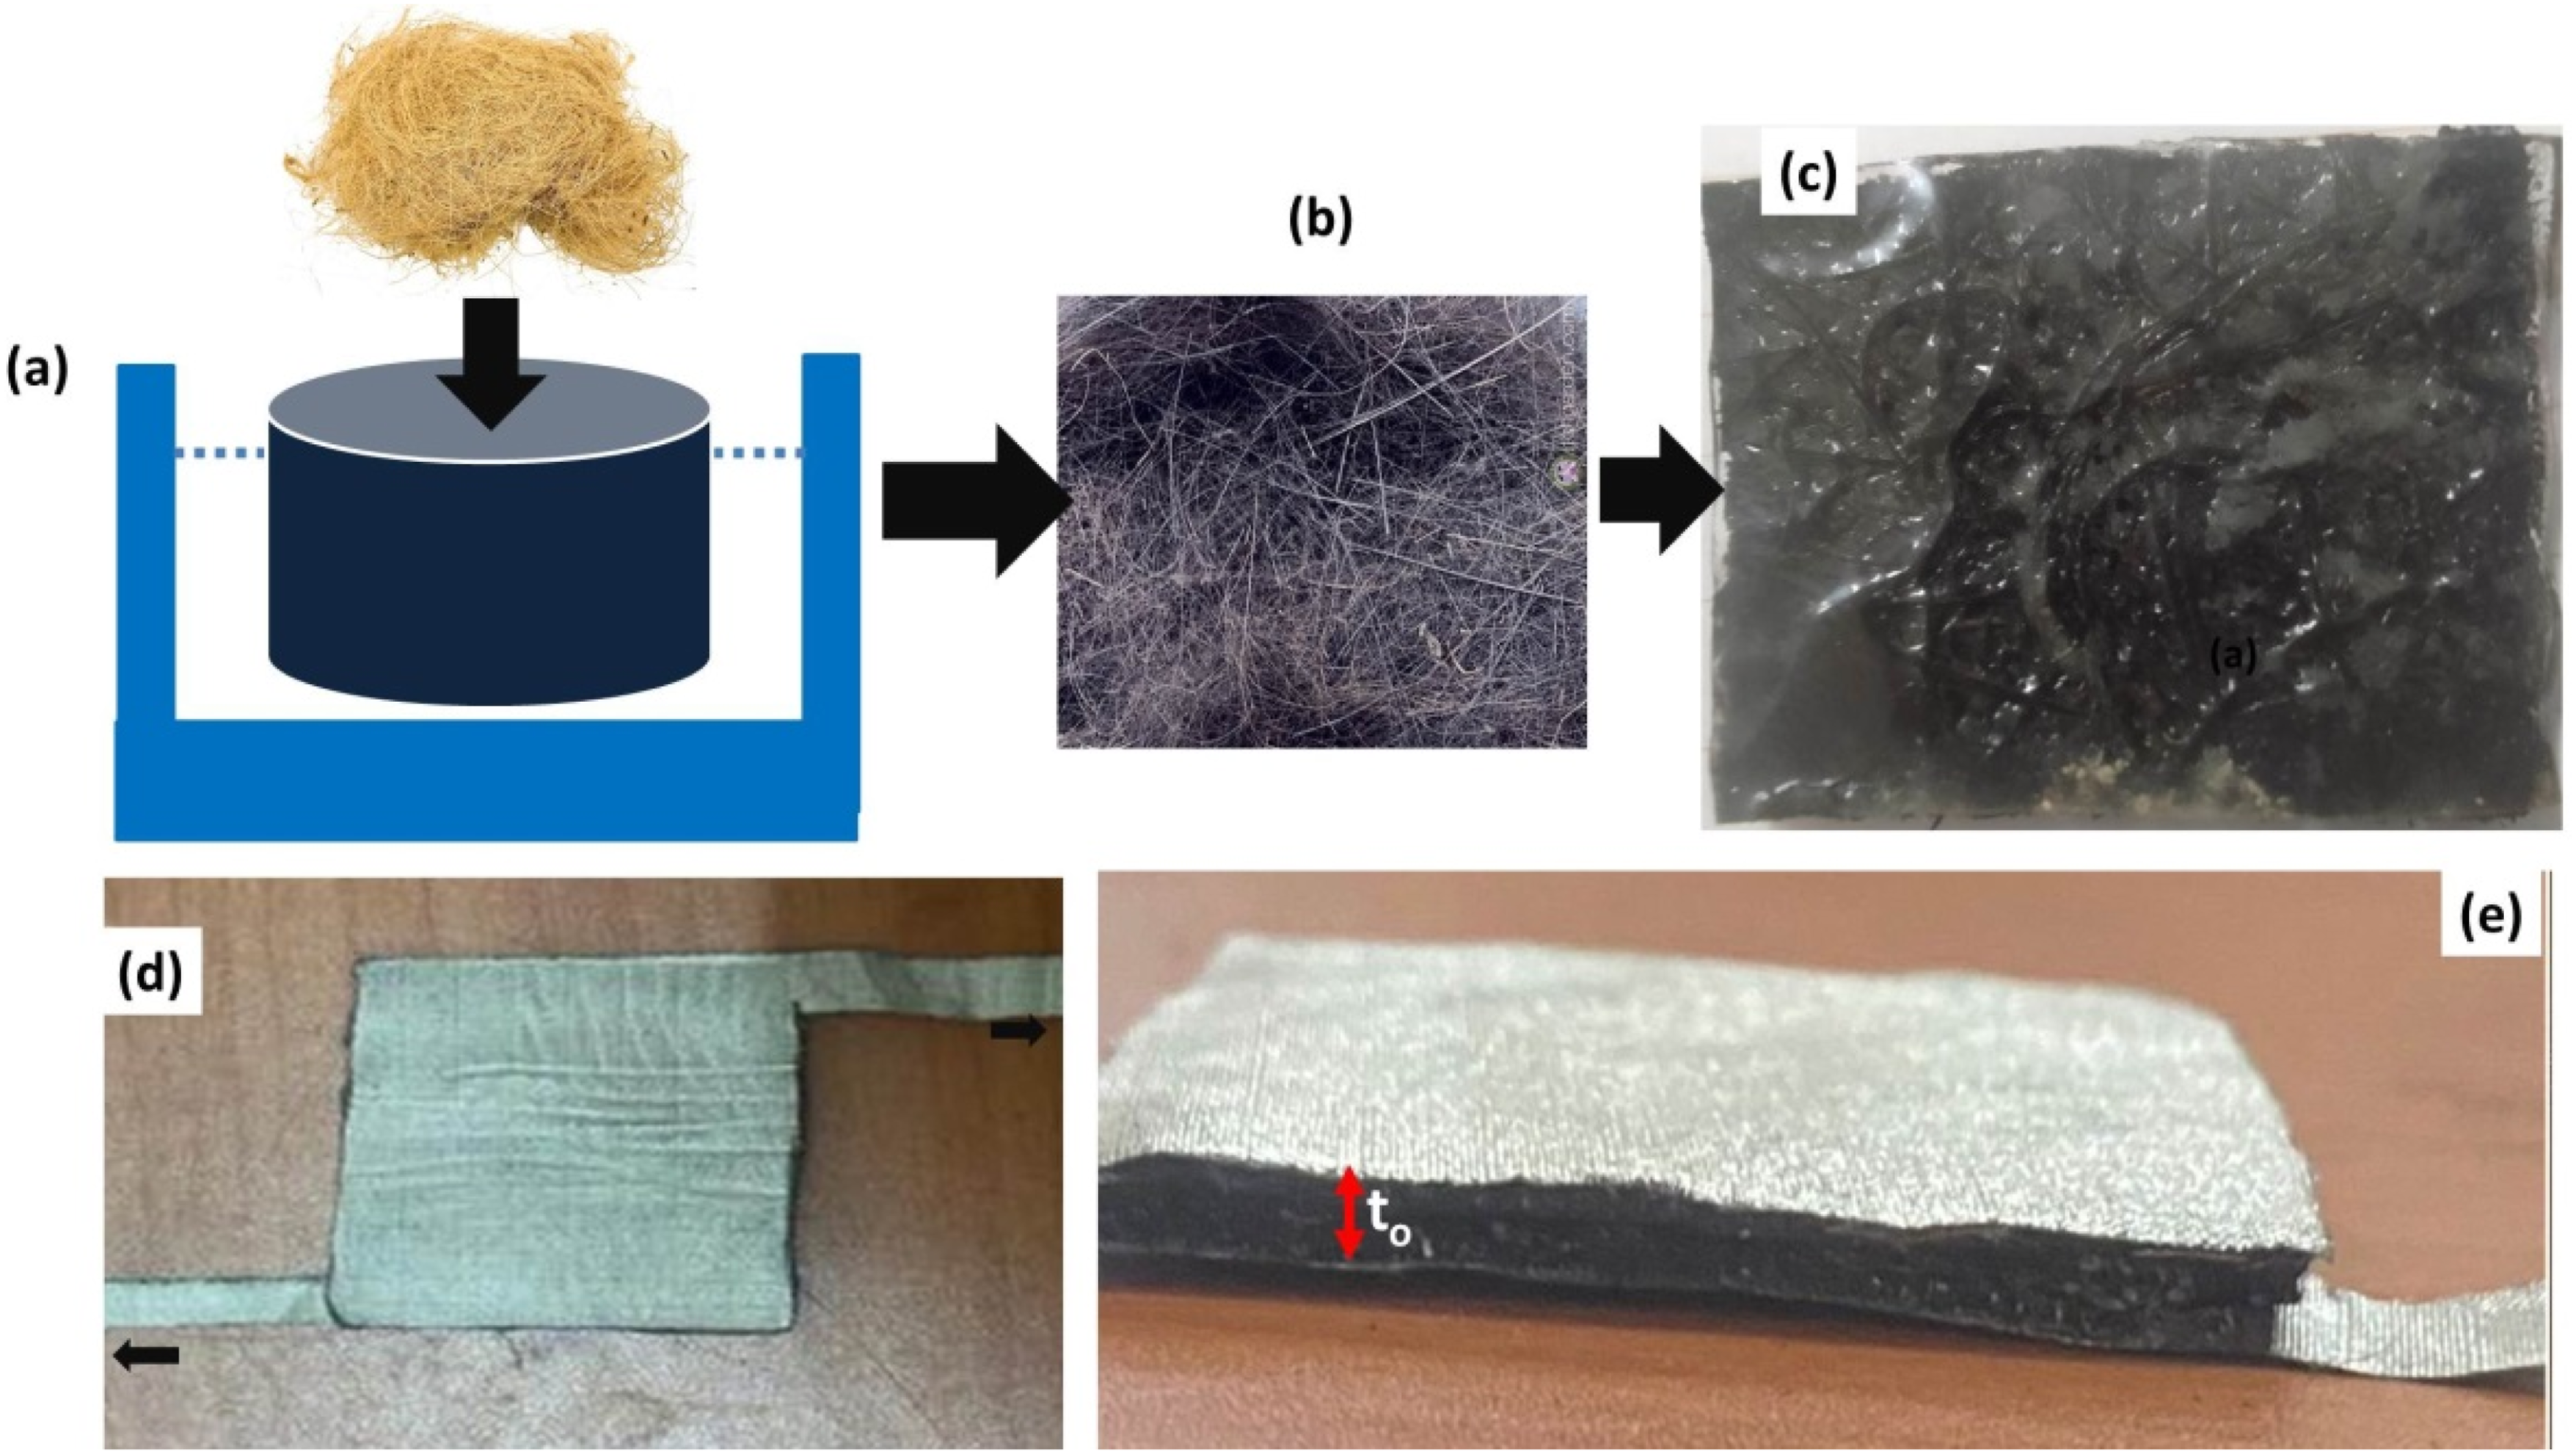
3. Characterization
3.1. Morphology and physical properties of coconut-coir
A high magnification optical microscopy (H.O.M) was used to study the porous nature of the coconut coir. Contact angle measurement was studied by dropping water onto the coir and image J software was used to measure the angle. Water absorption test was carried on the coir by completely submerging in water for 48 h. The water absorption was evaluated by (Wi-Ws)/Wi)*100 where Wi and Ws are the initial and swollen weights of the coir. Universal tensile machine (obtained from Materials Science and Engineering lab, University of Ghana) was used to study the tensile properties of the coir. A thermal gravimetric (TGA) machine was used to study the thermal stability of coir, given the following conditions: starting temperature 25 °C maximum temperature 700 °C, heating rate 10 °C/min using liquid nitrogen. A biodegradable study was carried on the coir by submerging the coir few centimeters in a soil contained in a container with pierced holes at the bottom. The coir was then watered every three days for a month. At the end of every week, the coir will be collected, washed, dried and the weight will be recorded. At least 3 samples were tested for this study. The difference in weights between the starting and final was recorded and used to evaluate its biodegradability.
3.2. Measuring capacitance under varied conditions
The electrodes terminals of the flexible coco-coir-flexible capacitive pressure sensor were connected to the multi-meter terminas. The initial capacitance (Co) of the sensor was recorded (Scheme 1(a)). A load was gently placed on the sensor and the new capacitance (Ct) was recorded (Scheme 1(b)). For each load, the tested was repeated 3 times and the average value was reported. The maximum load value reached was 600 kg. The effect of load on electrical resistance, frequency and DC voltage were all studied measured. Measuring process of the sensors (a) before pressure application (b) After pressure application.
The current flexible coco-coir-capacitive sensor obeys the standard “sandwich” dielectric structure sandwiched between two electrodes constituting a capacitor, as depicted in the Scheme 1. The sensitivity performance of the coco-coir-capacitive sensor was calculated based on equation (1)
8
;
3.3. Flexibility study via bending test
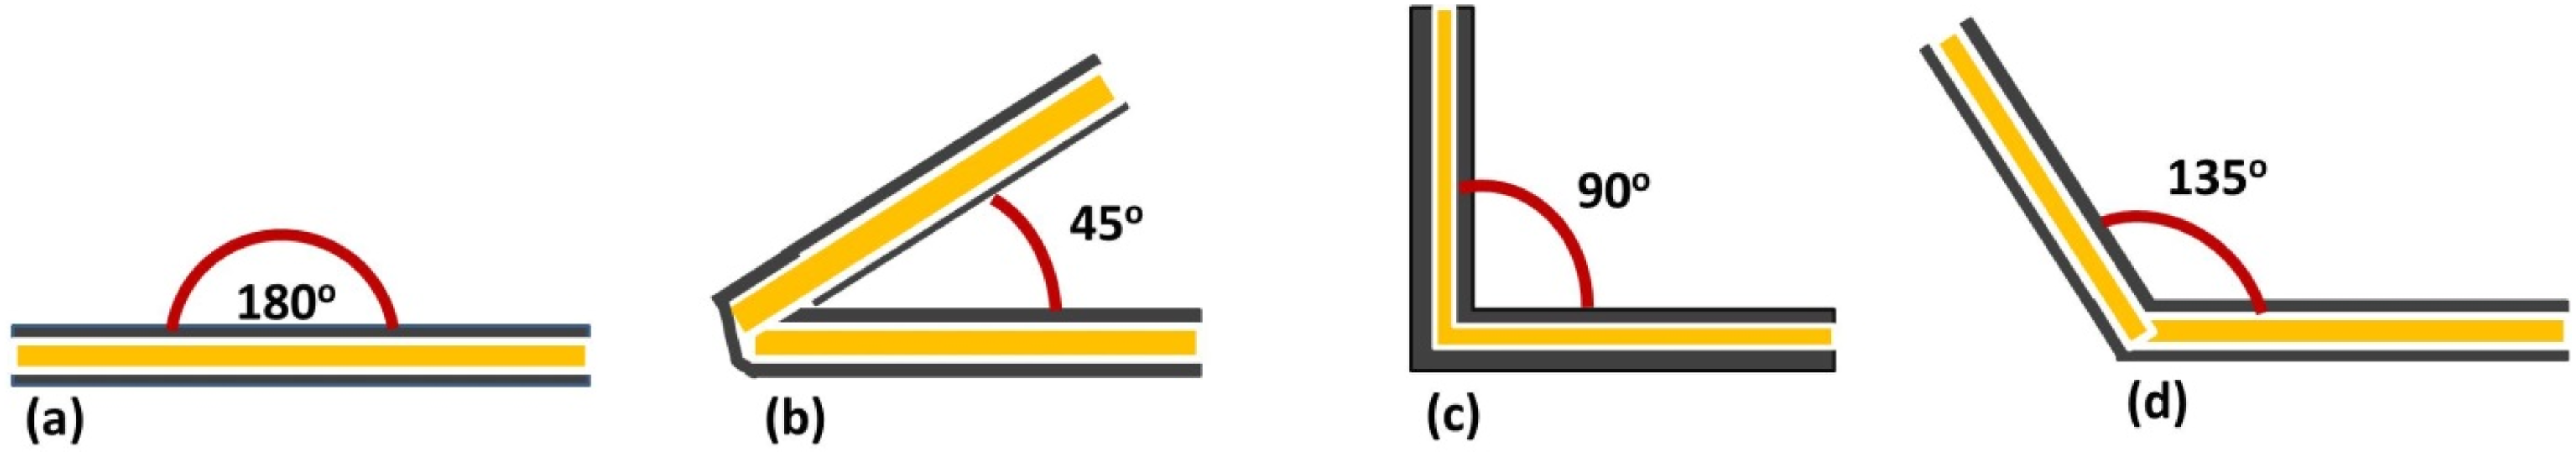
Here, the samples were bent at different angles and at each bend angle the change in capacitance was recorded 3 times and the average value recorded. the lowest bend angle was 0o (placed at 180o) where there was no bending of the samples and the highest was 135o (optimum). This is as depicted in the Scheme 2(a)–(d). By converting the bend angles into strains (%) the gage factor (GF) or sensitivity performance based on strain were estimated using equation(2);as earlier used to study the GF of high deformation elastomeric sensor by Mensah et al.
24
Illustration of the testing for bending and flexibility of sensors at different bend angles; (a) when the sensor is not deformed (b) when sensor is flexed at 45o, (c) When sensor is flexed at 90o and (d) when sensor is flexed at 135o.
4. Results and discussions
4.1. Morphology and physico-mechanical properties of coconut coir
A typical high optical microscopy image of a coir is shown in Figure Figure 2(a) with large and numerous pores. The strands of the coir were within 100∼300 μm. The presence of these pores could help in accommodating nanoparticles and deformation and recovery of the sensor applications. Figure 2(b) represents the biodegradable behavior of the coir. Clearly, a significant drop in weight could be seen as the weeks increased confirming its biodegradability. Figure 2(c) contains the tensile strength, strain, water absorption (%), contact angle and maximum degradation temperature obtained from the derivative curves of the TGA. The contact angle (o) and water absorption (%) values further confirm the super-hydrophilicity and biodegradability behavior of the coir. Thus, coco-coir can be used as partial replacements in capacitive sensors to enhance its biodegradability and still retain its thermal and mechanical integrity. (a) Morphology (b) biodegradable behavior and (c) Other physico-mechanical properties of coir.
4.2. Effect pressure on layer thickness and frequency
The effect of pressure on the thickness is depicted in Figure 3(a) and that on frequency in Figure 3(b). Clearly, increasing in the pressure exertion generally resulted in gradual lowering of the thicknesses of all the dielectric materials. If all factors are assumed to remain constant, this is expected to increase the capacitance of the corresponding materials, since capacitance varies inversely with thickness.
8
In Figure 3(a), it was observed that a sharp drop of thickness was recorded for sensor CN, especially at higher loading. In Figure 3(b) the frequency of the various sensors accumulated around 49.8∼50.7Hz. When closely observed (see insert), it can be seen that increase in the pressure caused a slight increment in the frequency of coco-coir-capacitive sensors; C, CN, while causing a slight decrease in the case of I, that of CI and CIN respectively, by altering their internal permittivity.8–11,15 The difference in stiffness could be due to the strength of the hybridization of the fillers in the dielectric layers. Hybridized fillers have been reported to form complex and interlocked networked structures, likely to increase stiffness of elastomeric materials, depending on the nature of interactions. For instance, spherical particles can roll past each other slide past tube-like or sheet-like filler particles. However, intricate filler particles like carbon black may not easily and freely slide pass themselves or tube-like, sheet-like and sphere-like particles.
24
Thus, for filler particles that strongly adhere to themselves or others during the exertion of pressure in the form straining or compression can directly increase the bulk stiffness and alter the frequency of the dielectric materials. Effect of pressure loading on (a) thickness and (b) frequency.
4.3. Effect of pressure on electrical resistance
Lower electrical resistance of the electrode of a capacitive sensor helps to improve the performance of sensor by ensures efficient charge distribution across the electrode and Improves sensitivity and accuracy of the sensor. In Figure 4(b), it was observed that increasing the pressure gradually caused an increase in the electrical resistance. High pressure could destruct the electrically conductive paths of the electrodes and cause an increase in resistance. The sensitivity (S) measured (ΔR/Ro) with respect to pressure change (ΔP) is presented in Figure 4(b). Table 2 contains the S at different ranges deducted from Figure 4(b) alongside the linearity (r2) values. Effect of load and pressure loading on (a) changes in electrical resistance and (b) fractional change in electrical resistance (ΔR/Ro). Sensitivity performance of sensors for detection of electrical resistance.

In terms measurement of resistance, the flexible coco-coir capacitive (I) generally recorded the best S in pressure ranges 0∼0.44kPa. For example, at 0∼0.02kPa, I recorded higher S values than C, CN, CI and CIN with respective values above 86, 156, 33, and 109%. At higher pressure range, 0.26∼0.44kPa, the S value of I was over 21, 19, 38, and 79% respectively than C, CN, CI and CIN. Beyond a certain pressure threshold above 0.44kPa, the linearity of sensors was observed dropping and interestingly at pressure ranges of 0.44∼0.87kPa, CN achieved the highest S with fair linearity of 0.83 followed by I (0.66kPa-1, r2∼0.90) and subsequently CI (0.52kPa-1, r2∼0.91) with C (0.31kPa-1, r2∼0.99) recording the lowest value of S. By comparison, the current samples have demonstrated higher sensitivities, especially at lower pressure 0∼0.02kPa and 0.26∼0.87kPa than that reported for wearable and sensitive graphene-cotton based pressure sensor for human physiological signals monitoring which recorded 0.21kPa-1 at a higher pressure up to 0∼2kPa by Li et al.. 25
4.4. DC voltage
Figure 5(a) depicts the measured voltage upon compressive loading of the various sensors. Generally, an increase in the load caused a corresponding increase in voltage output higher than the initial voltages. When the initial voltage (Vo) is compared with their respective voltages upon loading, a huge magnitude of voltage was recorded, especially for sensor I as seen in Figure 5(b). Effect of compressive pressure loading on (a) DC voltage output and (b) DC voltage gain in percentage.
DC Voltage detection sensitivity performance of sensors with respect to pressure.

Sensitivity performance of the sensors in detecting DC voltage under pressure changes.
4.5. Capacitance
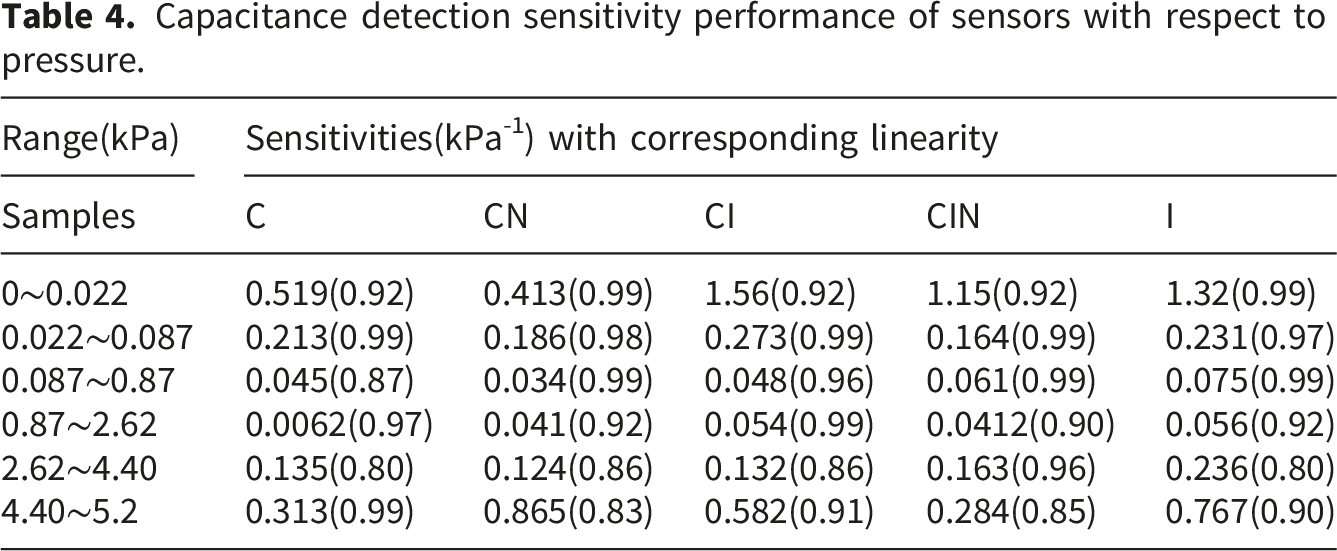
The effect of pressure loading on capacitance in real time for the various sensors (C, CN, CI, CIN and I) is as shown in Figure 7(a) while the sensitivity (S) performance deduced at different pressure ranges from Figure 7(b) is compared in Table 4 with their respective regression coefficient (r2) values. The curves in Figure 7(a) and (b) increases parabolically with pressure. Although, the S data is scattered along the pressure ranges, one obvious trend is that the S of the various sensors was very high at lower pressure ranges and on increasing the pressure, the S values decayed and thereafter rose again at higher pressures. For example, at pressures within 0∼0.022kPa, the order of decreasing S trend is CN > I > CIN > C > CI with strong linearity but the trend changed to higher pressure ranges as the S of I was seen gradually increasing, maintaining high linearity. By comparison, the current samples have exhibited extremely higher capacitance values compared to those obtained for donut-shaped generator based on dielectric elastomer by Lee et al.
26
which recorded a higher capacitance value >10nF. The current sensors also showed improved S values than a number of intricate, non-ecofriendly and expensive flexible capacitive sensors earlier reported, example of which include; Porous PU-AgNW (S=0.23kPa-1 at 0∼0.03kPa) by Hsieh et al.,
8
Porous BaTiNO3-NT-PU (S=2.51 kPa-1, at 0∼100kPa) by Ma et al.,
5
PDMS-GR(S=0.4321kPa-1 at 0∼30kPa) by Chen et al.,
20
and hierarchical core–shell structured PDMS-rGO based capacitive sensor (0.864kPa-1at 50∼275kPa) by.
27
Such sensors are not only tedious and expensive to fabricate or develop but they also require high pressure to achieve desired S. The present coco-coir capacitive sensors have exhibited a significant sensitivity performance compared to the edible, non-toxic and biodegradable wearable capacitive pressure sensors which recorded S value of 0.029kPa-1 at 100Pa∼1kPa reported recently by Basarir et al.,
28
. Effect of pressure on; (a) the capacitance of the sensors and (b) Sensitivity performance of the sensors in detecting capacitance under pressure changes. Capacitance detection sensitivity performance of sensors with respect to pressure.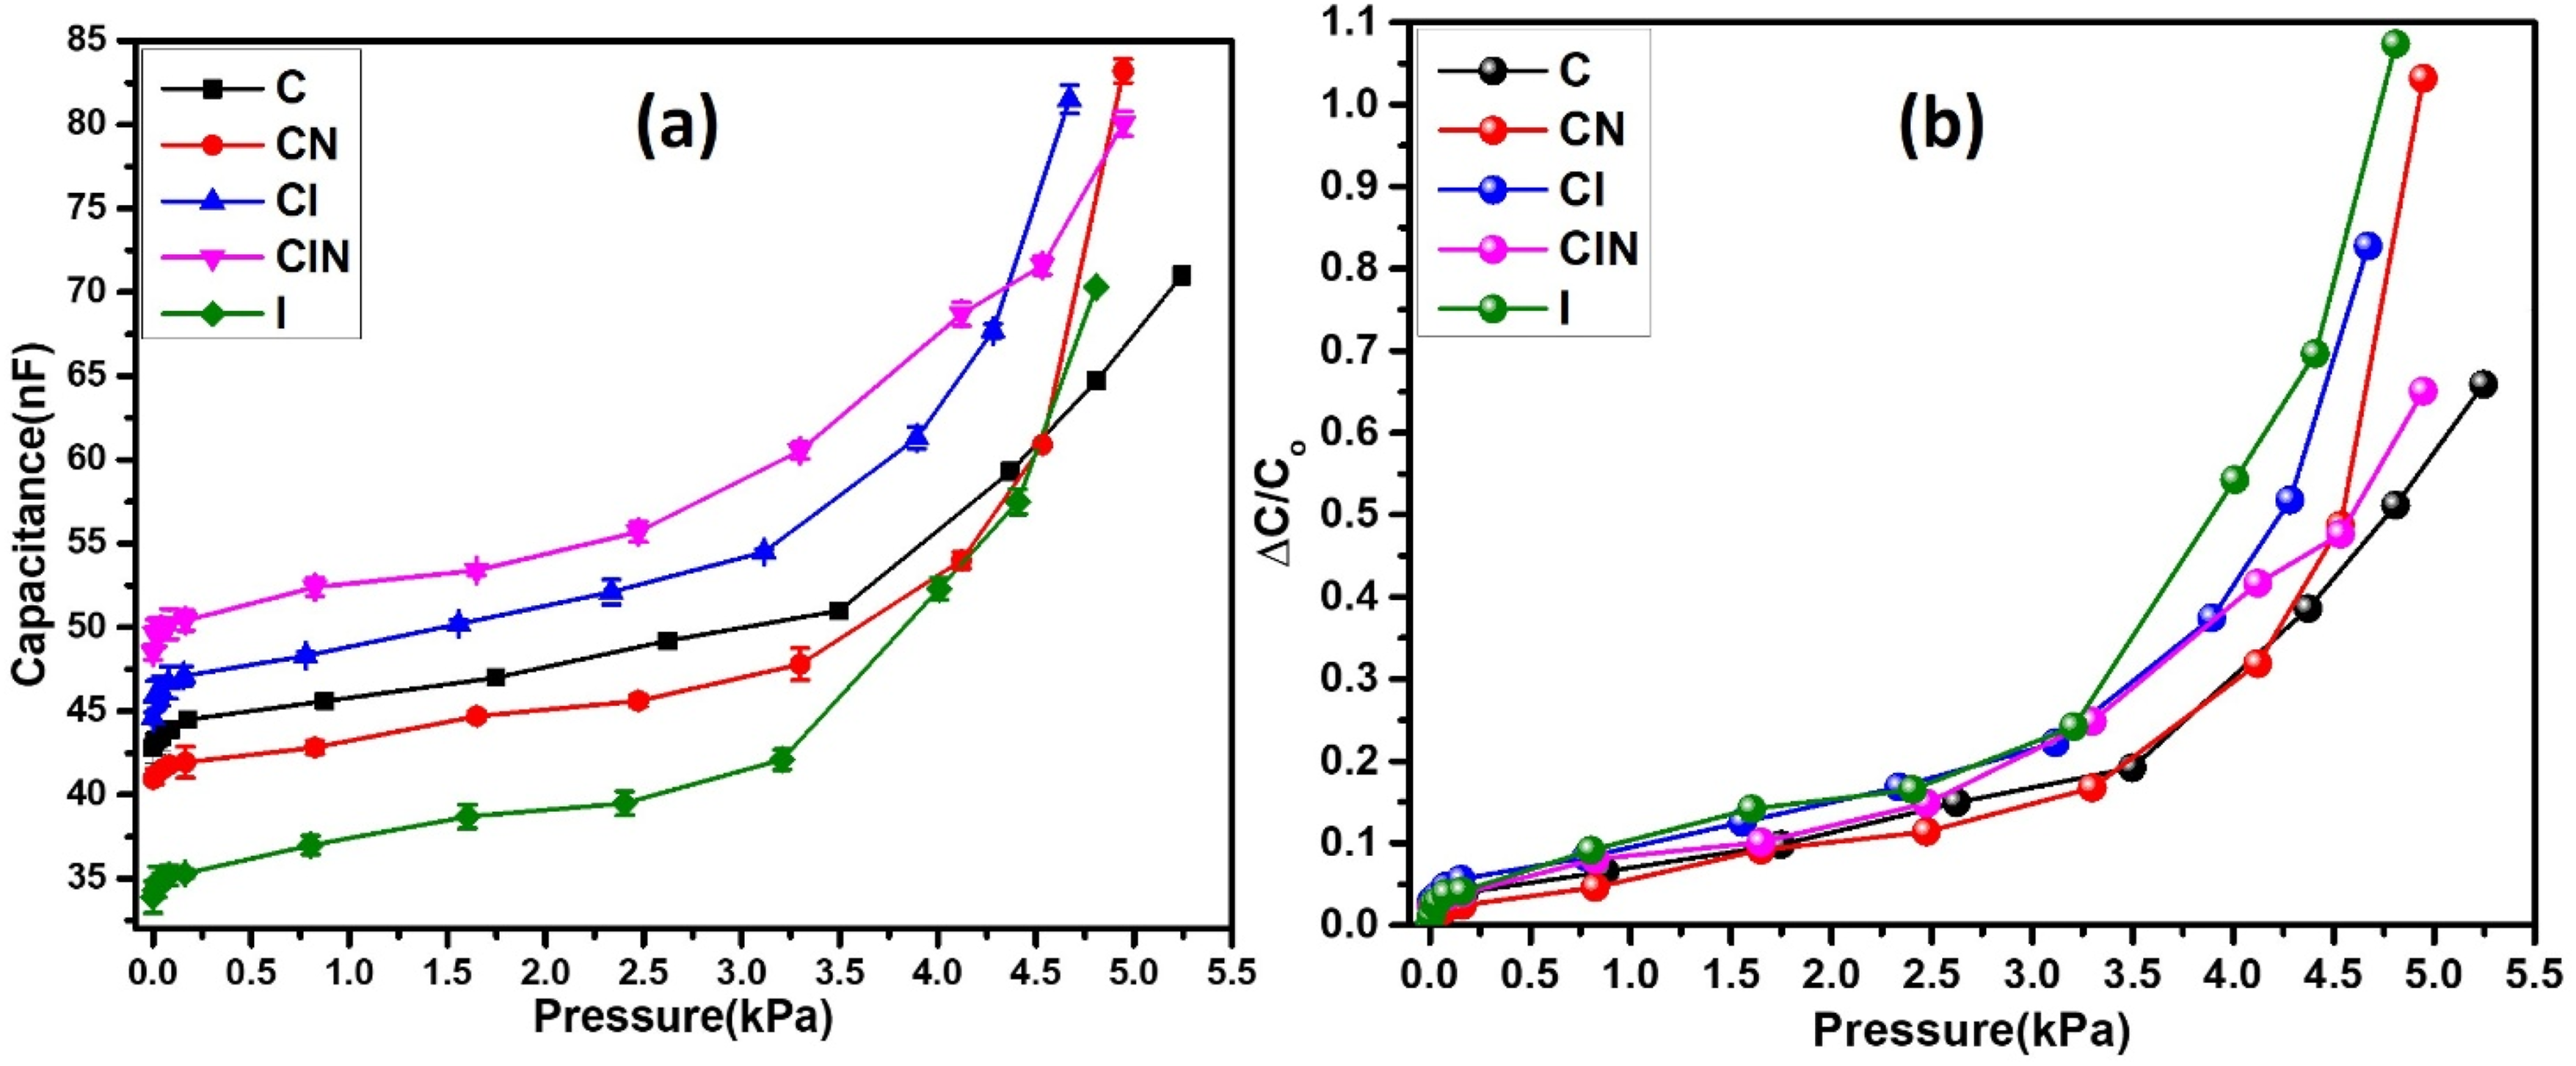
4.5.1. Energy harvested
For each deformation, an increase in voltage (Vt) was observed. The difference in voltage upon application of pressure can be likened to that of dielectric elastomer actuator reported by Chiba et al.,
29
where equation (1) was used to compute the energy harvested (Eh) for stretching and relaxed state of the sensor given by equation(3). A Plot of ratio of energy to capacitance at compressed state (Eh/Ct) vs capacitance (Ct).
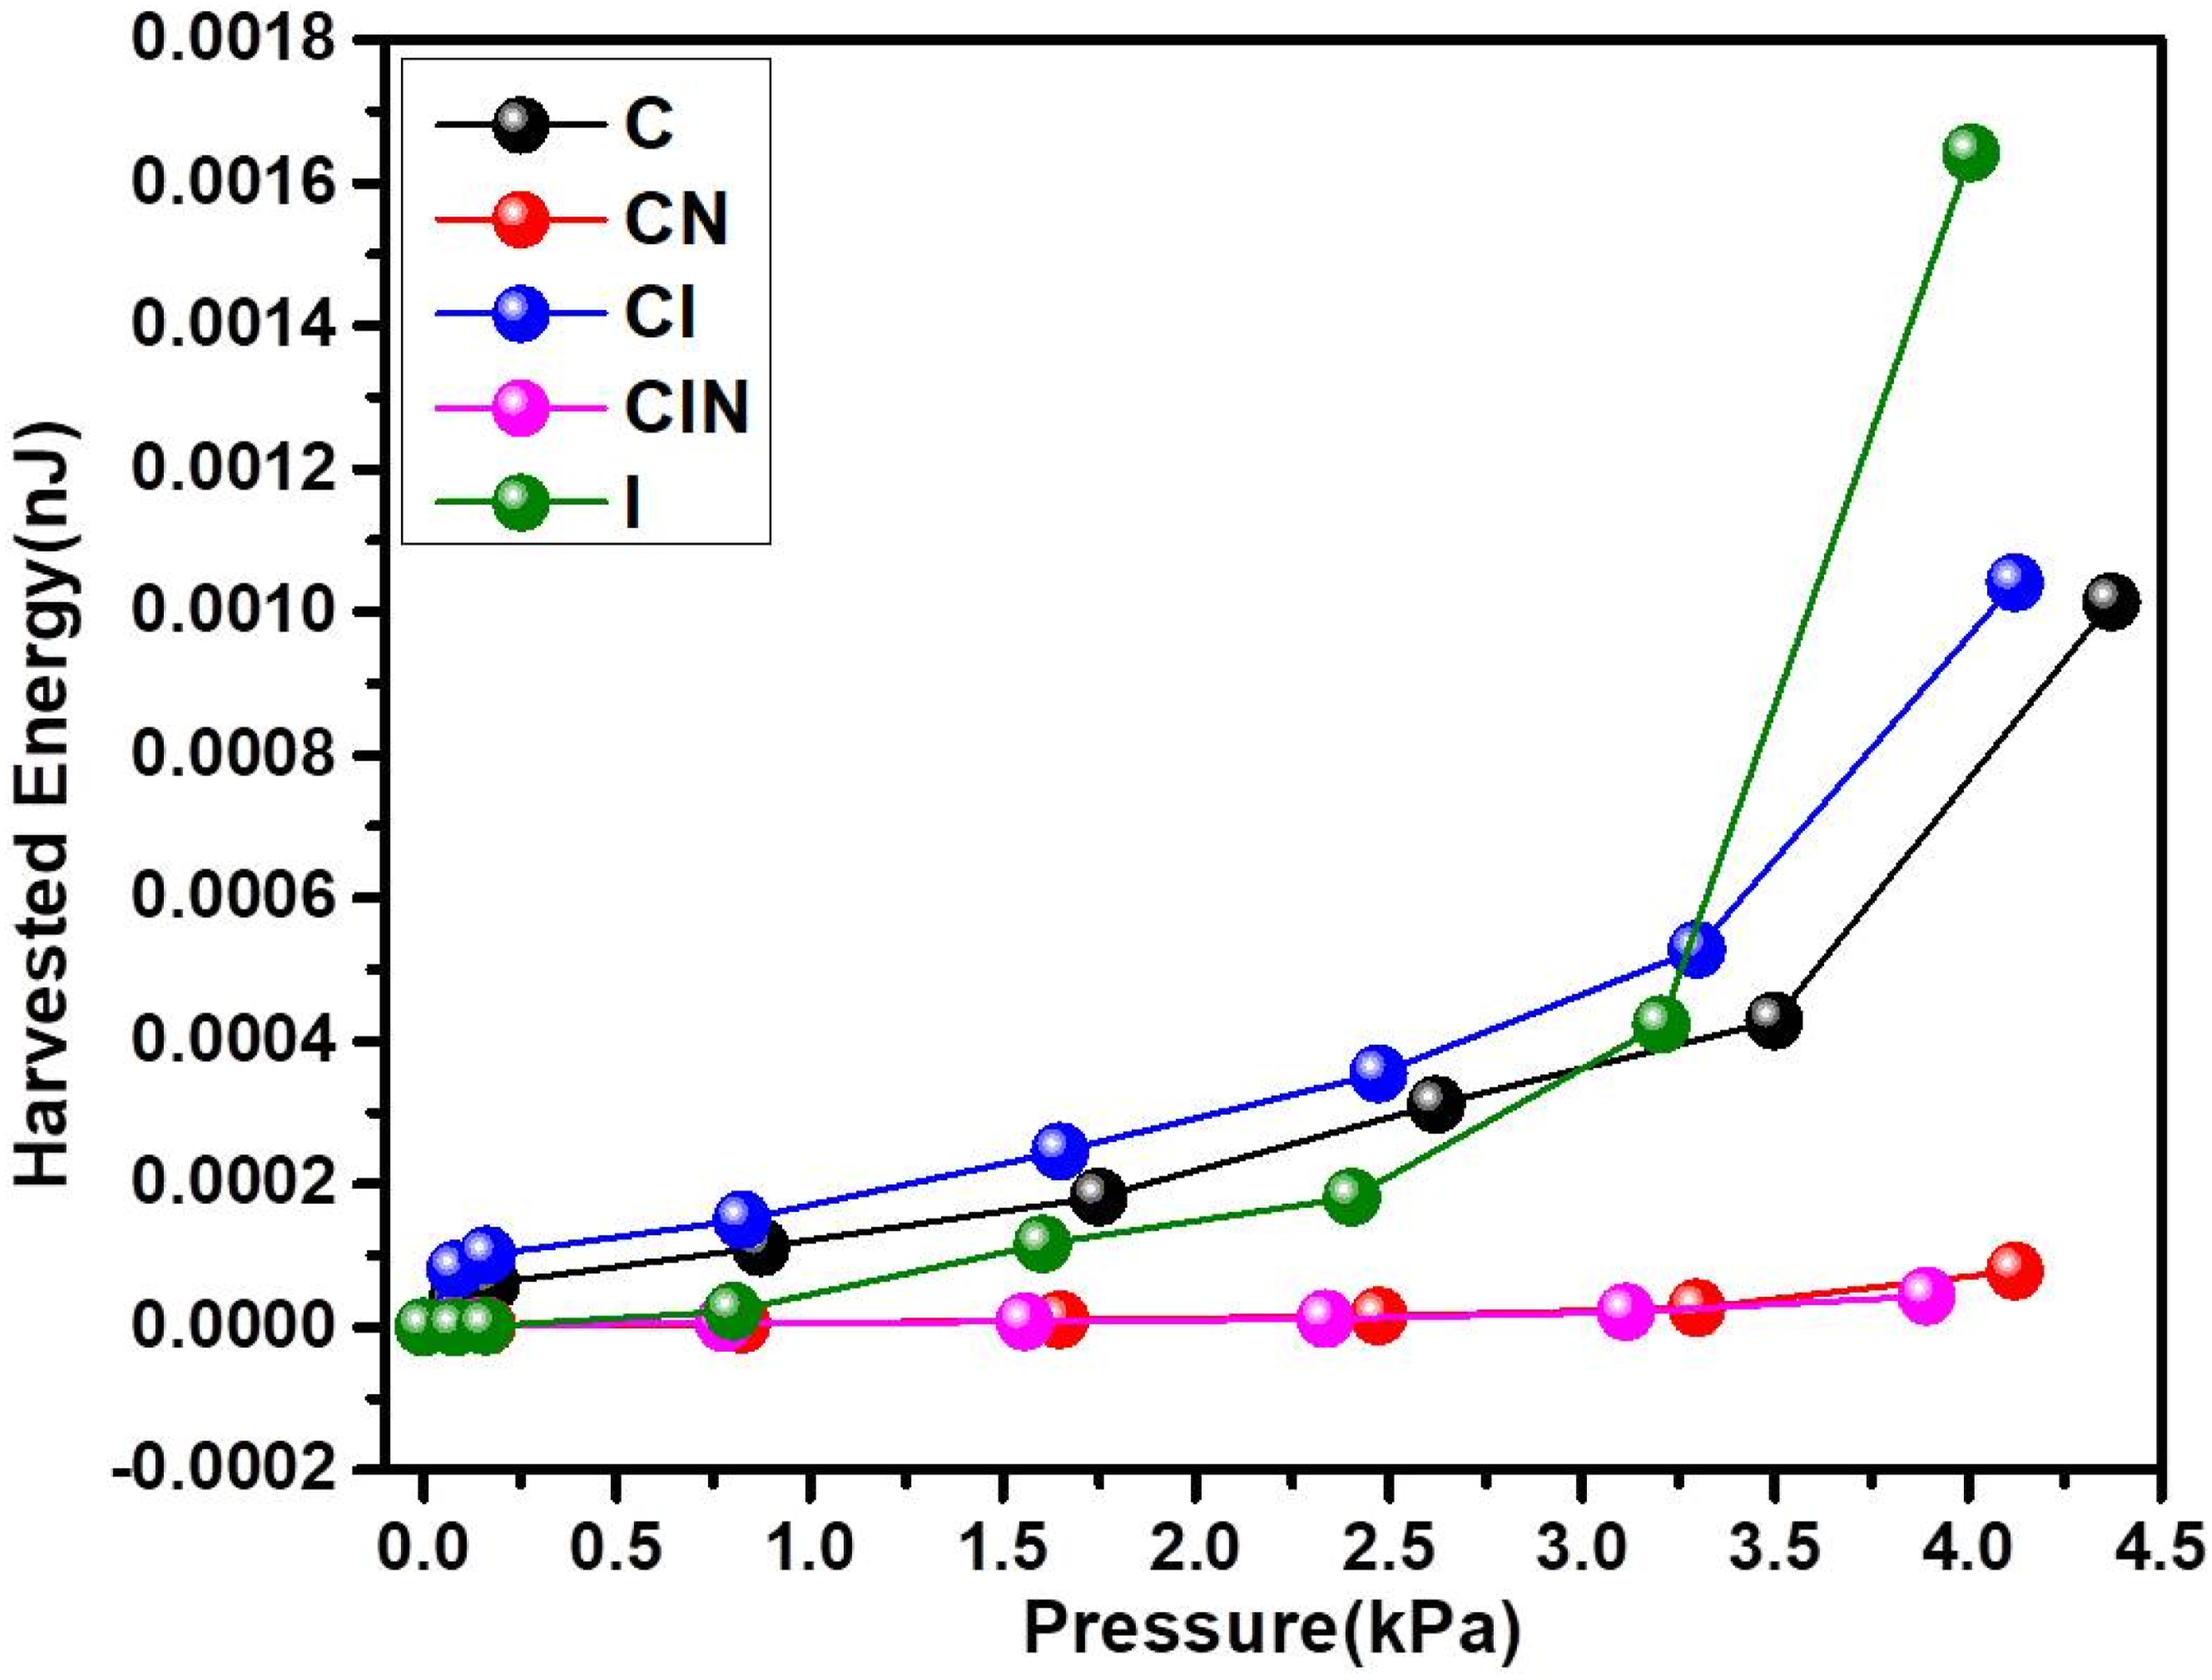
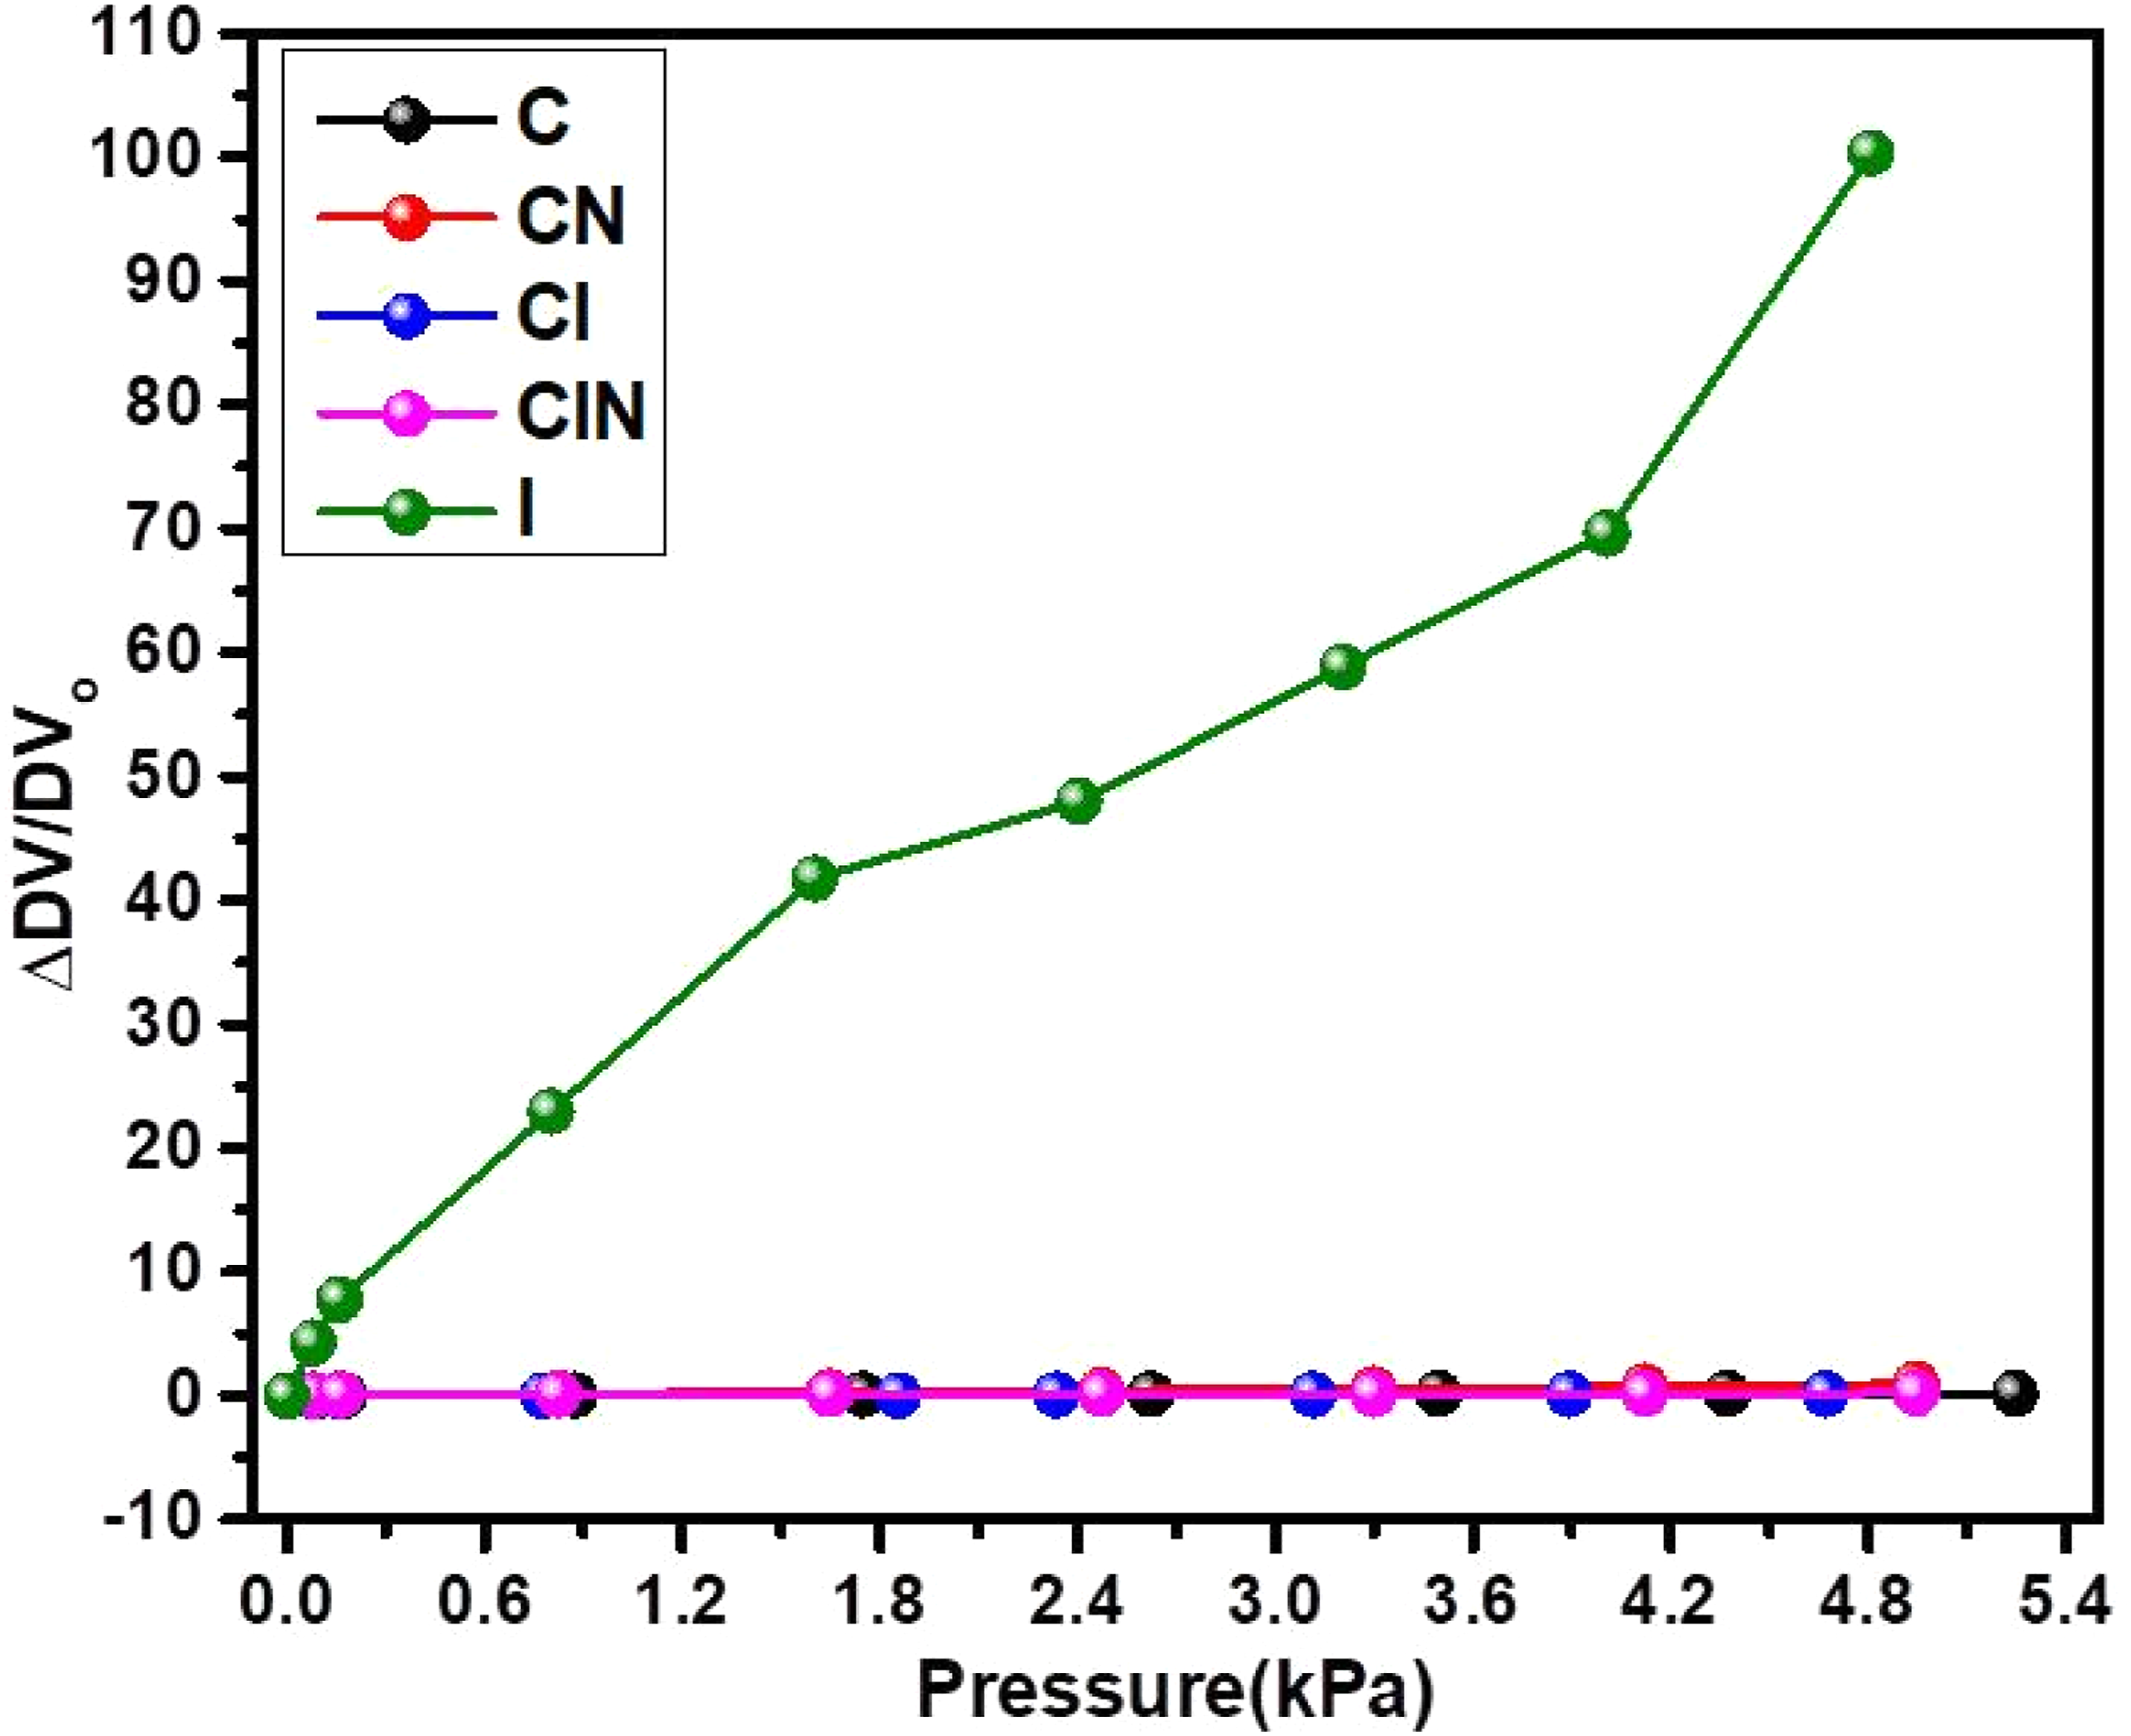
The electrical voltage and corresponding energy harvested varies parabolically as compression pressure increased. A similar parabolic behavior of energy and area expansion(%) was earlier reported for a donut-shaped generator based on dielectric elastomer by Lee et al. 26 The parabolic increase in the voltage and energy harvested may be due to the insignificant change in volume of the various sensors upon application of compressive pressure. Furthermore, the incorporation of carbon black(C), carbon nanotubes(N), iron oxide(I), and their hybrid systems into the coconut-fiber dielectric layer results in a noticeable enhancement in harvested energy compared to pristine coconut fiber, which can be attributed to improved dielectric polarization and interfacial charge accumulation, highlighting the potential of waste-derived coconut fiber–based nanocomposites for sustainable self-powered sensing applications.30,31 On the contrary, higher amounts of energy was harvested for the donut-shaped generator than the current work due to larger voltage (4.8V) generated. For example, at 4.8V, a 12μJ of energy was recorded during the area expansion above 312% Lee et al. 26 If the area differences are considered, the donut generator which is above 113cm2 is about 9 times larger than the average sensors (12.6 cm2) in this current work, hence this result is not a surprise. Interestingly, Lee et al. 26 suggested about 3.1J of energy could be harvested in a day, however in this present work; higher electrical energy ≥ 3.1J may be harvested in less than 1mins, simply by elevating the compressive pressure and by keeping all condition constant. It must be emphasized that the harvested energy values presented in Figure 8, although relatively low in magnitude, are well aligned with the functional objective of the device, which is focused on low-power energy harvesting and pressure sensing rather than high-output power generation. The microjoule-level energy output is adequate for ultra-low-power applications, including self-powered pressure and tactile sensors, wearable electronics, and smart interfaces that operate under intermittent mechanical stimuli.8,30–32
To validate the theoretical prediction of Eh, a modified version of equation (3) was adopted by keeping the initial capacitance (Co) of the sensors constant. The new equation is as shown below. A Plot of ratio of energy to capacitance at compressed state (Eh/Ct) vs capacitance (Ct):(a) C (b) CN(c) CI and (d) I

4.6. Testing for flexibility: Effect of bending on capacitance
The effect of bending angle on capacitance of the various sensors is compared in Figure 10. Generally, increasing the bending angle was observed causing a decreasing trend in the capacitance of the sensors. This could be due to factors like; altered distance between the electrodes, decreasing area, and the dielectric properties. The sensor I was observed to show a sharp decrease compared to the rest. Effect of bending angle (o) on capacitances of sensors.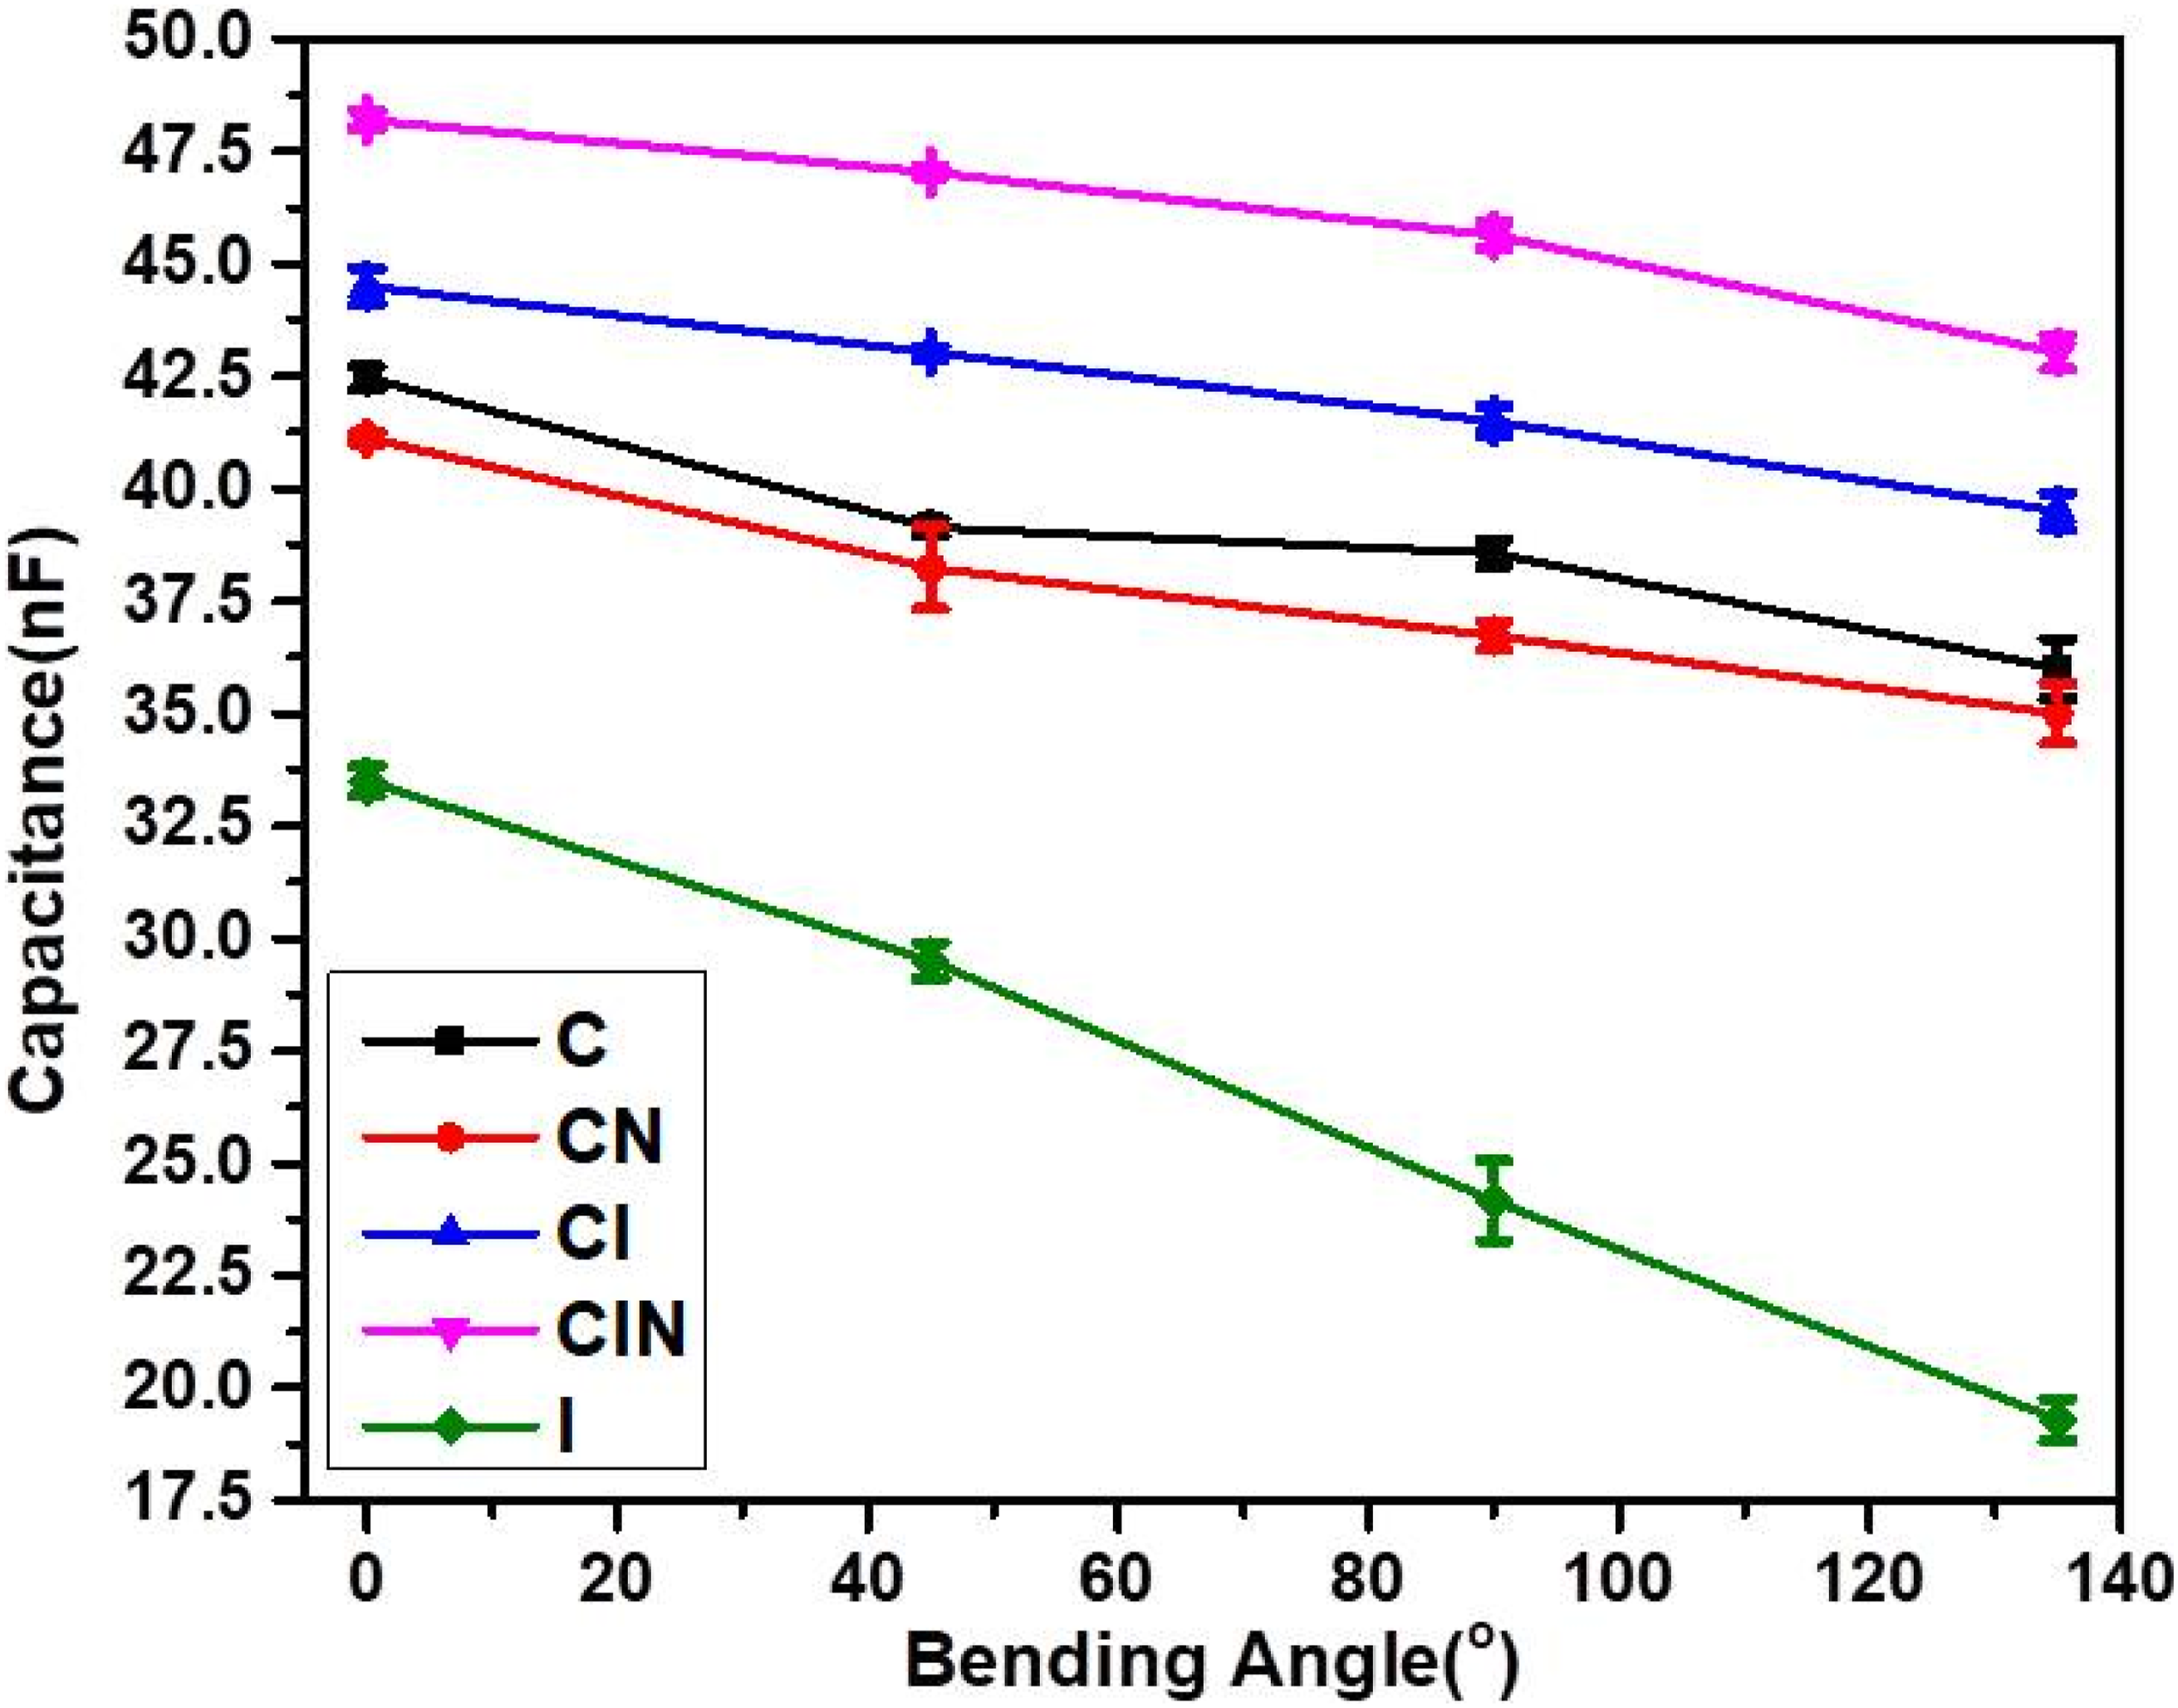
The order of the absolute GF (Figure 11(a)–(d)) of the sensors can be written as I (GF∼0.25, r2=0.995) > CN (GF∼0.084, r2=0.97) > C (GF∼0.082, r2=0.91) > CI (GF∼0.061, r2=0.94) > CIN (GF∼0.082, r2=0.91). The results indicate that capacitance of the sensor I responded rapidly to deformation with high linearity. This could be associated to the rapid increase of surface resistance of the electrodes owing to the contraction and expansion as well as the swift drop in polarization of the iron oxide (F2O3) particles.4,33 The GF of especially sensor I is higher than those reported for polymer-nanotube based capacitive sensor which recorded GF∼0.06∼0.82 at 280 strain(%) by Yamada et al.
34
and partly biodegradable PVA-PSF(poly(sodium 4-styrene-sulfonate)-nanotubes sensor which recorded GF∼0.208 by Loh et al.
35
A Plot of ratio of capacitance ratio to bending strain:(a) C, (b) CN (c) CI and (d) I
4.6. Dynamic/durability test
Besides sensitivity, response time and other factors, a key pointer which is very crucial in evaluating the performance of a capacitive pressure sensor is its dynamic/fatigue or durability behavior. The durability behavior of the various sensors was conducted, and a representative plot is shown for sensor I and CIN in Figure 12(a) and (b) respectively. Durability and dynamic sensing behavior of sensors (a) I and (b) C.
It was generally observed that both sensors exhibited relative consistency and stability with no obvious disruptions, irrespective of the numerous loading and unloading cycles conducted over a longer time. It was also interesting to observe that even after 2000 detections, the sensor maintained its tremendous capacitive sensing performance. The performance of the sensors was strongly affected by the fibrous-porous coco-nut coir as well as the suitable elastic fatigue acrylic rubber materials used for backing. A similar durability behavior was recently observed for a flexible capacitive sensor with a dielectric layer composed of a polydimethylsilane (PDMS)/BaTiO3/SrTiO3 composite material 12 and the that of the Soft capacitive pressure sensor based on a liquid dielectric layer where the repeatability reached over 1270 cycles for air, > 1800 cycles for di-ionize and salt water and slightly < 1800 cycles for alcoholic solution reported by Zhang et al. 36
5. Conclusions
Eco-friendly coconut coir, a lingo-cellulosic fiber derived from coconut husk waste was soaked with nanoparticles; nanotubes (N), carbon blacks (C) and iron oxide (I) and was used as dielectric layer sandwiched between acrylic elastomer, backed by silver fabrics electrodes. A coconut-coir based flexible capacitive sensors; C, CN, CI, CIN and I were fabricated from the dielectric layer. The effect of compressive pressure on capacitance, frequency, voltage, and electrical resistance of all the sensors was studied. To test flexibility, the sensors were bent at different angles (0, 45, 90 and 135o) and the change in angle were converted into bending strain (%) which was used to evaluate their gage factors (GF). The various sensors were also tested for their durability by subjecting them to compressive pressure above 2000cycles and the trends of capacitance were detected. It was observed that the compressive pressure led to a reduction in thickness and lowered the frequency of various sensors maintained around 49.8∼50.7Hz. In terms of change in electrical resistance with pressure, the flexible coco-coir capacitive sensor I generally recorded the best sensitivity (S), with the highest value (0.68kPa-1, r2∼0.9) obtained within pressure ranges, 0.26∼0.44kPa. Within the range 0.44∼0.87kPa, sensor CN (0.865kPa-1 r2∼0.83) took the lead followed by I (0.66kPa-1, r2∼0.90) and subsequently CI (0.52kPa-1, r2∼0.91) with C (0.31kPa-1, r2∼0.99) recording the lowest value. Also, sensor I exhibited an ultra-sensitive voltage detection performance at all pressure ranges, with the highest value of S (48.5ka-1) recorded at 0∼0.17kPa with a strong linearity (r2) value of 0.998. A competition was seen between sensors I and CN in terms of detection of capacitance, at lower pressure range; 0∼0.087kPa, CN was very effective while sensor I outperformed CN at elevated pressure 0.087∼5.2kPa. Sensor I was also effective in harvesting energy, especially at elevated pressures. It was observed that higher amount of energy could be harvested within a shorter period by increasing the pressure. In terms of flexibility study, the order of the absolute GF of the sensors was I (GF∼0.25, r2∼0.995) > CN (GF∼0.084, r2∼0.97) > C (GF∼0.082, r2∼0.91) > CI (GF∼0.061, r2∼0.94) > CIN (GF∼0.082, r2∼0.91). Lastly, the sensors generally exhibited relative consistency and stability with no obvious degradation, even after 2000 cycles of capacitance detections. This was linked to the fibrous-porous coco-nut coir nature as well as the suitable elastic fatigue acrylic rubber used as materials. Thus, coconut husk waste has demonstrated to be a multifunctional material, by acting as a component for developing flexible capacitive sensors with energy harvesting ability while it may improve the biodegradability properties of the designs. This excellent performance aligns well with green electronics and circular economy goals.
Despite these promising results, key challenges remain in achieving precise control over nanoparticle dispersion and long-term environmental stability of the coconut-coir dielectric layer, particularly under varying humidity and real-world operating conditions. Future work will therefore focus on interface engineering, biodegradability study and device integration to further enhance performance consistency, durability, and applicability of coconut-coir–based flexible sensors in next-generation green electronics and self-powered systems.
Footnotes
Author’s note
Corresponding author has consent from all co-authors.
Acknowledgement
We acknowledge Jeonbuk National University of South Korea (IPNL) for granting us the opportunity to use their facility for this work. The University of Ghana – Carnegie Next Generation of African Academics (UG-Carnegie NGAA) Project and the Office of Research Innovation and Development (ORID) at the University of Ghana for their immense guidance in completion of the manuscript.
Author contributions
Bismark Mensah (A), Elsie Effah Kaufmann (B), Isaac Adyaye Aboagye (C), Glenn M.E Kwaku (D), Isaac Kofi Boakye (E), Boniface Yeboah Antwi (F) and Tsatsu Nukunya (G).
A: Project administration, Methodology, Investigation, Formal analysis, Data curation, Conceptualization and Writing – original draft.
B, C, F and G: Resources, Support, Writing – review/editing, & Supervision
D and E: Methodology, investigation & data collection, review/editing.
Funding
The authors received no financial support for the research, authorship, and/or publication of this article.
Declaration of conflicting interests
The authors declared no potential conflicts of interest with respect to the research, authorship, and/or publication of this article.
Data Availability Statement
The data used to support the findings of this study are available from the corresponding author upon request.