
Abstract
This study focuses on alumina–silica oxide mixtures synthesised via sol–gel processing using rice husk and aluminium chloride hydroxide as precursors followed by calcination, yielding submicron particles suitable for reinforcing poly(methyl methacrylate) (PMMA). These hybrid oxide particles exhibit a well-dispersed phase composition of alumina and silica, enhancing mechanical properties when homogeneously distributed within the brittle PMMA matrix. X-ray diffraction (XRD) confirmed the crystallinity and phase structure of the particles. The PMMA composites were formulated with 1 wt.%, 3 wt.%, and 5 wt.% Al2O3/SiO2, then analysed using scanning electron microscopy (SEM), optical microscopy, and indentation testing. Vickers microhardness and tensile tests showed significant improvements in the hardness, strength, and creep resistance of the hybrid nanocomposites. The hardness increased by approximately 25.94% and creep resistance by 4.4% when 3 wt.% of Al2O3/SiO2 particles was added to PMMA, while the tensile strength increased to approximately twice that of the pure PMMA matrix. Wettability was evaluated via sessile drop measurements using water and glycerine, representing polar liquids with differing viscosities. The surface free energy and work of adhesion were calculated using the Owens–Wendt–Rabel–Kaelble (OWRK) model. The results show that even low concentrations of hydrophilic particles markedly influence the wetting behaviour, with modular surface properties emerging as a function of filler loading. Among tested compositions, the 3 wt.% oxide-reinforced composite achieved the most favourable balance of mechanical reinforcement and wettability control, identifying it as the optimal formulation for enhanced PMMA-based dental applications.
Introduction
Polymethyl methacrylate (PMMA) remains the primary acrylic polymer used in the fabrication of both partial and full dentures due to its outstanding combination of properties: low density, affordability, ease of handling, aesthetic appeal, and tuneable mechanical characteristics. 1 Despite these advantages, PMMA exhibits vulnerability to fatigue and fracture under repetitive chewing, bending, and impact loading—which limits its long-term performance in clinical applications.
To enhance PMMA’s mechanical and structural resilience, various reinforcement strategies have been explored. The addition of the small amounts of ceramic nano-particles 2 or E-glass fibres increases the durability of pure PMMA. 3 Incorporation of nano reinforcements improves key thermo-mechanical properties: the coefficient of thermal expansion, flexural strength, yield strength, impact strength, transverse strength, tensile strength, compressive strength and microhardness.1,4 In addition, the incorporation of particles such as: zirconium oxide (ZrO2), 5 aluminium oxide (Al2O3), 6 titanium-oxide (TiO2), 7 and graphene-silver nanoparticles 8 into PMMA matrix, has been investigated by various researchers. Arora et al. 9 investigated the effect of adding Al2O3 to PMMA and found that it improved the physical, mechanical and thermal properties of the acrylic resin thanks to the presence of the most stable hexagonal alpha phase as the strongest and stiffest part of the aluminium oxide particles. Aluminium oxide was added to the acrylic resin to increase the thermal conductivity of the denture and provide a more comfortable and fulfilling experience for the patient.10,11 Silica was used in the form of nano powder to improve mechanical properties such as strength, ballistic resistance and modulus. 12 The combination of silica and alumina opens up a large spectrum of properties modifications as both oxides have several crystal modifications and are suitable for adjusting specific functions such as dielectric and optical properties.13,14
Dimensional stability and wettability are critical parameters for dental materials intended for prosthetic applications. Composite systems consisting of an acrylic matrix reinforced with hard ceramic oxides exhibit enhanced mechanical performance, demonstrated by increased hardness, improved strength, and greater resistance to creep deformation.15,16 Wettability describes the extent to which a liquid can spread on a solid surface and is typically quantified by the contact angle. Polymethyl methacrylate (PMMA), being a weakly polar polymer due to the presence of functional groups such as –CH3, –CO, and –OCH3, enables liquid–solid interactions primarily through adsorption mechanisms.17,18 Studies on the wettability of PMMA-based composites in dental applications have highlighted a critical issue: their propensity for bacterial adhesion on material surfaces. 19 The evaluation of the surface free energy of the solid can be done by using different approaches such as Zisman, Saito, Fowkes, acid–base approaches, etc. 20 All these methods are based on contact angle measurements, but variations in the results are to be expected due to several factors—including external influences, the quality and compactness of the samples, and differences in the measuring equipment.
Neat PMMA exhibits a combination of viscous and elastic characteristics, resulting in pronounced viscoelastic behaviour across a wide range of mechanical loads and temperatures. As demonstrated by Kurkin et al., these properties allow PMMA to deform and recover in time-dependent ways, making it suitable for applications that demand both flexibility and dimensional stability. 21 To mathematically treat this behaviour Kurkin et al. developed an equation of state for PMMA creep under various loads and temperatures (0–50°C), showing power-law dependence of strain on time. Christman et al. 22 reported on the viscoelastic response of PMMA under uniaxial stress and shock loading, taking into account strain rate and temperature dependence. The mode of failure is affected by the sensitivity of poly(methyl methacrylate) to the deformation rate. 23 Enhancing resistance to viscoelastic deformation through reinforcement can be crucial for composite processing. 24
Understanding the structure and behaviour of composite materials at the micro and nano scale is essential for optimizing their performance across various engineering applications. Conventional methods for quantifying microstructural complexity often fall short when it comes to describing irregular, fractal-like shapes that form when fillers are dispersed in a matrix. In this context, the Hausdorff dimension serves as a powerful mathematical tool for characterizing the “roughness” and geometric complexity of such structures. Within the field of composite materials, it enables precise quantification of nanoparticle agglomeration, fracture surfaces, and texture roughness—all of which have a direct impact on mechanical properties such as strength, fracture resistance, and impact energy absorption. 25 A particularly notable application was observed in recent research on PMMA-based dental composites reinforced with SrTiO3 and MnO2 nanoparticles. A strong correlation was found between the Hausdorff dimension of the agglomerates and the ability of the material to absorb impact energy. 26 The results indicated that lower Hausdorff dimensions, reflecting smoother and less complex agglomerates, correspond to enhanced mechanical performance, including greater energy absorption and crack resistance. These findings pave the way for composite material optimization through fractal analysis, offering engineers refined control over microstructure and improved functionality across domains such as biomedical engineering, dentistry, aerospace, and automotive industries.
This study investigates whether incorporating sol-gel-derived alumina/silica nanoparticles enhances the mechanical properties and structural integrity of denture base materials. To investigate the structural characteristics of the particle-reinforced PMMA matrix, scanning electron microscopy (SEM) was conducted following tensile testing. Fracture surfaces were further analysed using fractal geometry and Hausdorff dimension calculations to characterize crack propagation, surface roughness, and fracture morphology. Comprehensive material characterization included tensile testing, Vickers microhardness measurements, SEM imaging, fractal analysis, and sessile drop contact angle measurements, aimed at evaluating porosity, fracture behaviour, and microstructural effects. The central hypothesis posited that the mechanical properties—namely strength, hardness, toughness, and creep resistance—as well as wettability of PMMA/SiO2/Al2O3 composites, are modulated by the filler content expressed as weight percentage.
Materials and methods
Materials
For the preparation of the composite, an acrylic polymer ORTO poli (Polydent, Slovenia), which cures at room temperature, was used as matrix. The reinforcements in the composites were particles prepared by the sol-gel method. Silica was extracted from rice waste. The rice husks were treated with sulfuric acid (10% at 80°C, 3 h), rinsed with water, neutralised, dried (50°C) and heat treated at 800°C for 4 h to obtain the white powder. 27 The aluminium oxide precursor aluminium chloride hydroxide - Locron powder (Degussa, Germany) was dissolved in demineralised water and silica powder was added in the desired amount. A precisely defined ratio was selected to achieve the desired oxide composition (Al2O3: SiO2 = 3:2). The mixture was gelled, then dried, ground, and finally calcined at 1000°C for 4 h. Most of the particles had a diameter distribution between 20 and 60 nm, as shown in previous publication. 28
The polymer consisted of a liquid part containing the monomer and a powder of PMMA containing the initiator. The powder-to-liquid volume ratio was 2.5:1. During composite preparation, the particles were first dispersed in the liquid monomer using an ultrasonic bath (BANDELIN SONOREX-35 kHz). This mixture was then combined with the PMMA powder containing the initiator and allowed to polymerise in the mould. The size of the Teflon mould was 6 cm × 0.8 cm, and the depth was 0.3 cm (see Schematic 1). The PMMA was prepared via cold-cure polymerization at the curing time of 2 h. After 2 days, the samples were removed from the mould and prepared for characterization. The composites were prepared with different particle contents (1%, 3%, and 5% by weight) to examine the influence on the surface and mechanical properties of the material. The aim was to achieve the best possible balance between improved mechanical behaviour, maintaining good processing properties and achieving good surface properties which are important for use. The composites were compared to the pure PMMA material and are designated in the text according to the filler content: PMMA + (1 wt.%, 3 wt.%, or 5 wt.%) SiO2/Al2O3. A schematic representation of the composite preparation is given in Scheme 1. Steps in composite preparation.
Material characterization and methods
The structural analysis of mixture of SiO2/Al2O3 nanoparticles was done using X-ray diffraction-XRD testing. The Ultima IV Rigaku (Tokyo, Japan) diffractometer implements the Bragg–Brentano geometry and uses CuKα radiation (λ = 1.5418 A) with a generator voltage of 40.0 kV and a current of 40.0 mA. 28 The crystalline phase of SiO2/Al2O3 powder was evaluated using continuous scan mode with a step size of 0.02° and a scan rate of 10°/min, encompassing a range of 10–80° 2θ.
The tensile strength, elongation, modulus of elasticity, and toughness of PMMA/SiO2/Al2O3 during the uniaxial stretching were measured according to the standard technique ASTM D882.
29
Instron dynamometer (model 1185) testing machine, equipped with a 10 kN load cell with crosshead speed of 1 mm/min at room temperature (23 ± 1°C) and 51 ± 3% relative humidity was used for tensile testing. All tests were performed at room conditions (at temperature 23 ± 5°C, relative humidity at 50%) with a stretching rate of 1.0 mm min−1. For every composition five specimens were tested. The mean values of tensile strength, deformation, and modulus of elasticity were obtained. The stress-strain curve (σ - ε) was produced based on the data collected before the test tube fracture, and the longitudinal modulus of elasticity E was determined based on the straight part of the curve. Toughness, T in MPa of the PMMA matrix and their hybrid composite was calculated below the tensile curves, as a surface of absorbed energy per unit volume without failure, using equation (1)30,31:

After tensile test, the cross-section analysis was conducted in order to investigate the fracture type of the matrix and hybrid composites. Fractal analysis was performed on the cross-section of the neck of the test specimen after fracture. The morphology of the cross-section was visualized using FESEM (Field Emission Scanning Electron Microscopy) technique (Mira3 Tescan, Oxford, UK, at 3 kV). Before analysing the cross-sections, gold plating was necessary because the samples are not conductive.
The Hausdorff dimension (HD) was employed as a quantitative indicator of the complexity of the material’s porous network, focussing on the pore size and distribution. The analysis was conducted using MATLAB software (R2015) on binary images obtained through segmentation of SEM micrographs based on grey scale intensity. The main objective was to create a calibration curve that allow the estimation of the pore diameter in a way that accurately reflects the actual microstructure of the material, especially the polymer network. 32
The composite hardness, creep resistance, tensile (Ts) and yield strengths (Ys) of PMMA and PMMA/SiO2/Al2O3 were calculated based on microhardness models developed for the Vickers indentation technique. The Vickers testing machine (model “Leitz Kleinert Prufer DURIMET I”, Oberkochen, Germany) was used to determine the microhardness of the PMMA hybrid composite. The applied force was constant (0.98 N) and holding times were varied. For microhardness and indentation strength calculation, applied load and dwell time were 0.98 N and 25 s, respectively. Creep indentation resistance test requires variation in load time and a range of 5–30 s was chosen. Three indents were made on each sample (six diagonals), and the samples were recorded on an optical microscope (Olympus CKS41, Hachioji, Tokyo). The diagonals were measured using the Image Pro Plus 6.0 (Media Cybernetics, Rockville, Maryland, USA). The microhardness of the materials was then calculated using the standard and equation (2):

Tensile (Ts), yield strengths (Ys), and sensitivity coefficient (C) for microhardness data were computed using following relations adapted for PMMA matrix (equations (3)–(5))36–38:


According to the Sargent-Ashby (S-A) model (equation (6)), the creep parameter, known as the stress exponent μ, of the PMMA matrix and PMMA/SiO2/Al2O3 hybrid composite with varying weight percentages of SiO2/Al2O3 powder (1–5 wt.%) was calculated using the findings of hardness studies to specify the creep mechanism. The relationship between the time-dependent composite hardness H
c
and the stress exponent μ is provided by equation (6) as follows:

The Evaluation of the wetting properties of PMMA-based composites was investigated using the sessile drop method.
43
An optical microscope with a high-resolution camera (Delta Optical Smart 5.0 MP Pro, Minsk Mazowiecki, Poland) was used to take pictures 3 seconds after the placement of the drops. Image-Pro Plus 6.0 was used to measure the contact angles (θ). The surface free energy (polar and dispersion fractions), and work of adhesion for water and glycerine were calculated according to OWRK (Owens–Wendt–Rabel–Kaelble) method
44
as an improved Fowkes method.
45
Equation (7) was used for the calculation of the free surface energy, and equation (8) for the calculation of the work of adhesion
36
:


Results and discussion
XRD-structural characterization of synthesized SiO2/Al2O3 powder
The crystallographic analysis of the material, performed using XRD, revealed that the main phase present was α-alumina (corundum), which is the most stable form of alumina. This phase formed during the calcination of sol-gel synthesis product obtained from aluminium chloride hydroxide and was confirmed by sharp and narrow diffraction peaks, suggesting that the method promotes α-alumina (Card No. 01-076-7777) formation even at relatively moderate temperatures like 1000°C.
The silica used in the study, originating from plant-based material, initially showed a mostly amorphous structure after being calcined at 800°C.
46
When further heated to 1000°C, it underwent crystallization, forming the β-cristobalite phase.
47
In the analysed sample, the presence of α-cristobalite was identified. This phase typically forms from β-cristobalite as it cools below approximately 270°C, resulting in a metastable structure. α-cristobalite (Card No. 01-077-1317) is considered advantageous for reinforcing composites because of its negative Poisson’s ratio,
48
which allows for better stress distribution when the material is under load.
49
Obtained product consist of a mixture of two oxides opening the possibility for their synergistic action in composite, α-alumina being a stiff component and cristobalite enabling the load transfer due to special physical properties. Even if both components for mullite formation were present in good molar ratio, the obtained product showed no traces of mullite. The possible reason for this is the form in which the silica was introduced into the process – in form of already formed particles, and other reason is the temperature that was too low for mullite formation (Figure 1). XRD spectrum of SiO2/Al2O3 mixture powder obtained from the sol–gel method.
Tensile test and toughness
Tensile properties of specimens.

The primary reason for adding reinforcement particles is to improve the elastic modulus and strength. The addition of 1 wt.% of particles enhances both the modulus and strength, but does not significantly improve the deformation capacity, resulting in only a limited increase in toughness. When 3 wt.% of particles are added, all mechanical properties—strength, modulus, and deformation ability—are improved. This indicates that the combined effect of silica and alumina particles has a positive influence on the performance of the material. However, further increasing the particle content to 5 wt.% does not lead to additional improvements; in fact, both strength and deformability decrease.
A one-way ANOVA confirmed that the observed differences were statistically significant (F ≈ 109.4, p < 0.0001). The most pronounced enhancement occurred at 3 wt.%, yielding nearly a 2× increase in tensile strength compared to the neat matrix. The marginal gain at 1 wt.% suggests partial load transfer via well-dispersed filler, while the drop at 5 wt.% implies possible particle agglomeration or matrix disruption beyond the optimal reinforcement threshold. The elongation at break mirrored the strength behaviour, increasing from 3.63 ± 0.5% for PMMA to 6.71 ± 2.0% at 3 wt.%—indicating a notable enhancement in ductility. The ANOVA results for strain data also revealed significant group differences (F ≈ 6.86, p = 0.0024), supporting a composition-dependent evolution of fracture behaviour. The moderate rise at 1 wt.% suggests minimal toughening, while the reduction at 5 wt.% reflects a complex balance between interfacial bonding and filler over-saturation, likely impacting polymer chain mobility and crack propagation pathways. Approximated toughness values—calculated as the area under the stress–strain curve revealed further insights into composite resilience. Neat PMMA displayed a low toughness of 34.29 MPa, while the 3 wt.% composite peaked at 126.22 MPa, more than triple the baseline. This surge highlights the composite’s enhanced capacity for energy dissipation under tensile load. The 5 wt.% formulation retained moderate toughness (77.40 MPa), though below the optimum. This supports the hypothesis that the 3 wt.% concentration achieves a critical balance between filler reinforcement and matrix integrity, maximising both strength and ductility.
Fractographic analysis
Fractographic analysis by FESEM (Figure 2) shows a smooth fracture surface for the unmodified polymer matrix (Figure 2(a)), typical of brittle failure in glassy polymers. Adding 1 wt.%, 3 wt.%, and 5 wt.% of reinforcing particles increases surface roughness, resulting in progressively coarser fracture morphologies. Cross-section analysis of composite materials after tensile test and FFT transformation of the fracture surface: (a) PMMA, (b) 1 wt.% SiO2/Al2O3, (c) 3 wt.% SiO2/Al2O3, and (d) 5 wt.% SiO2/Al2O3.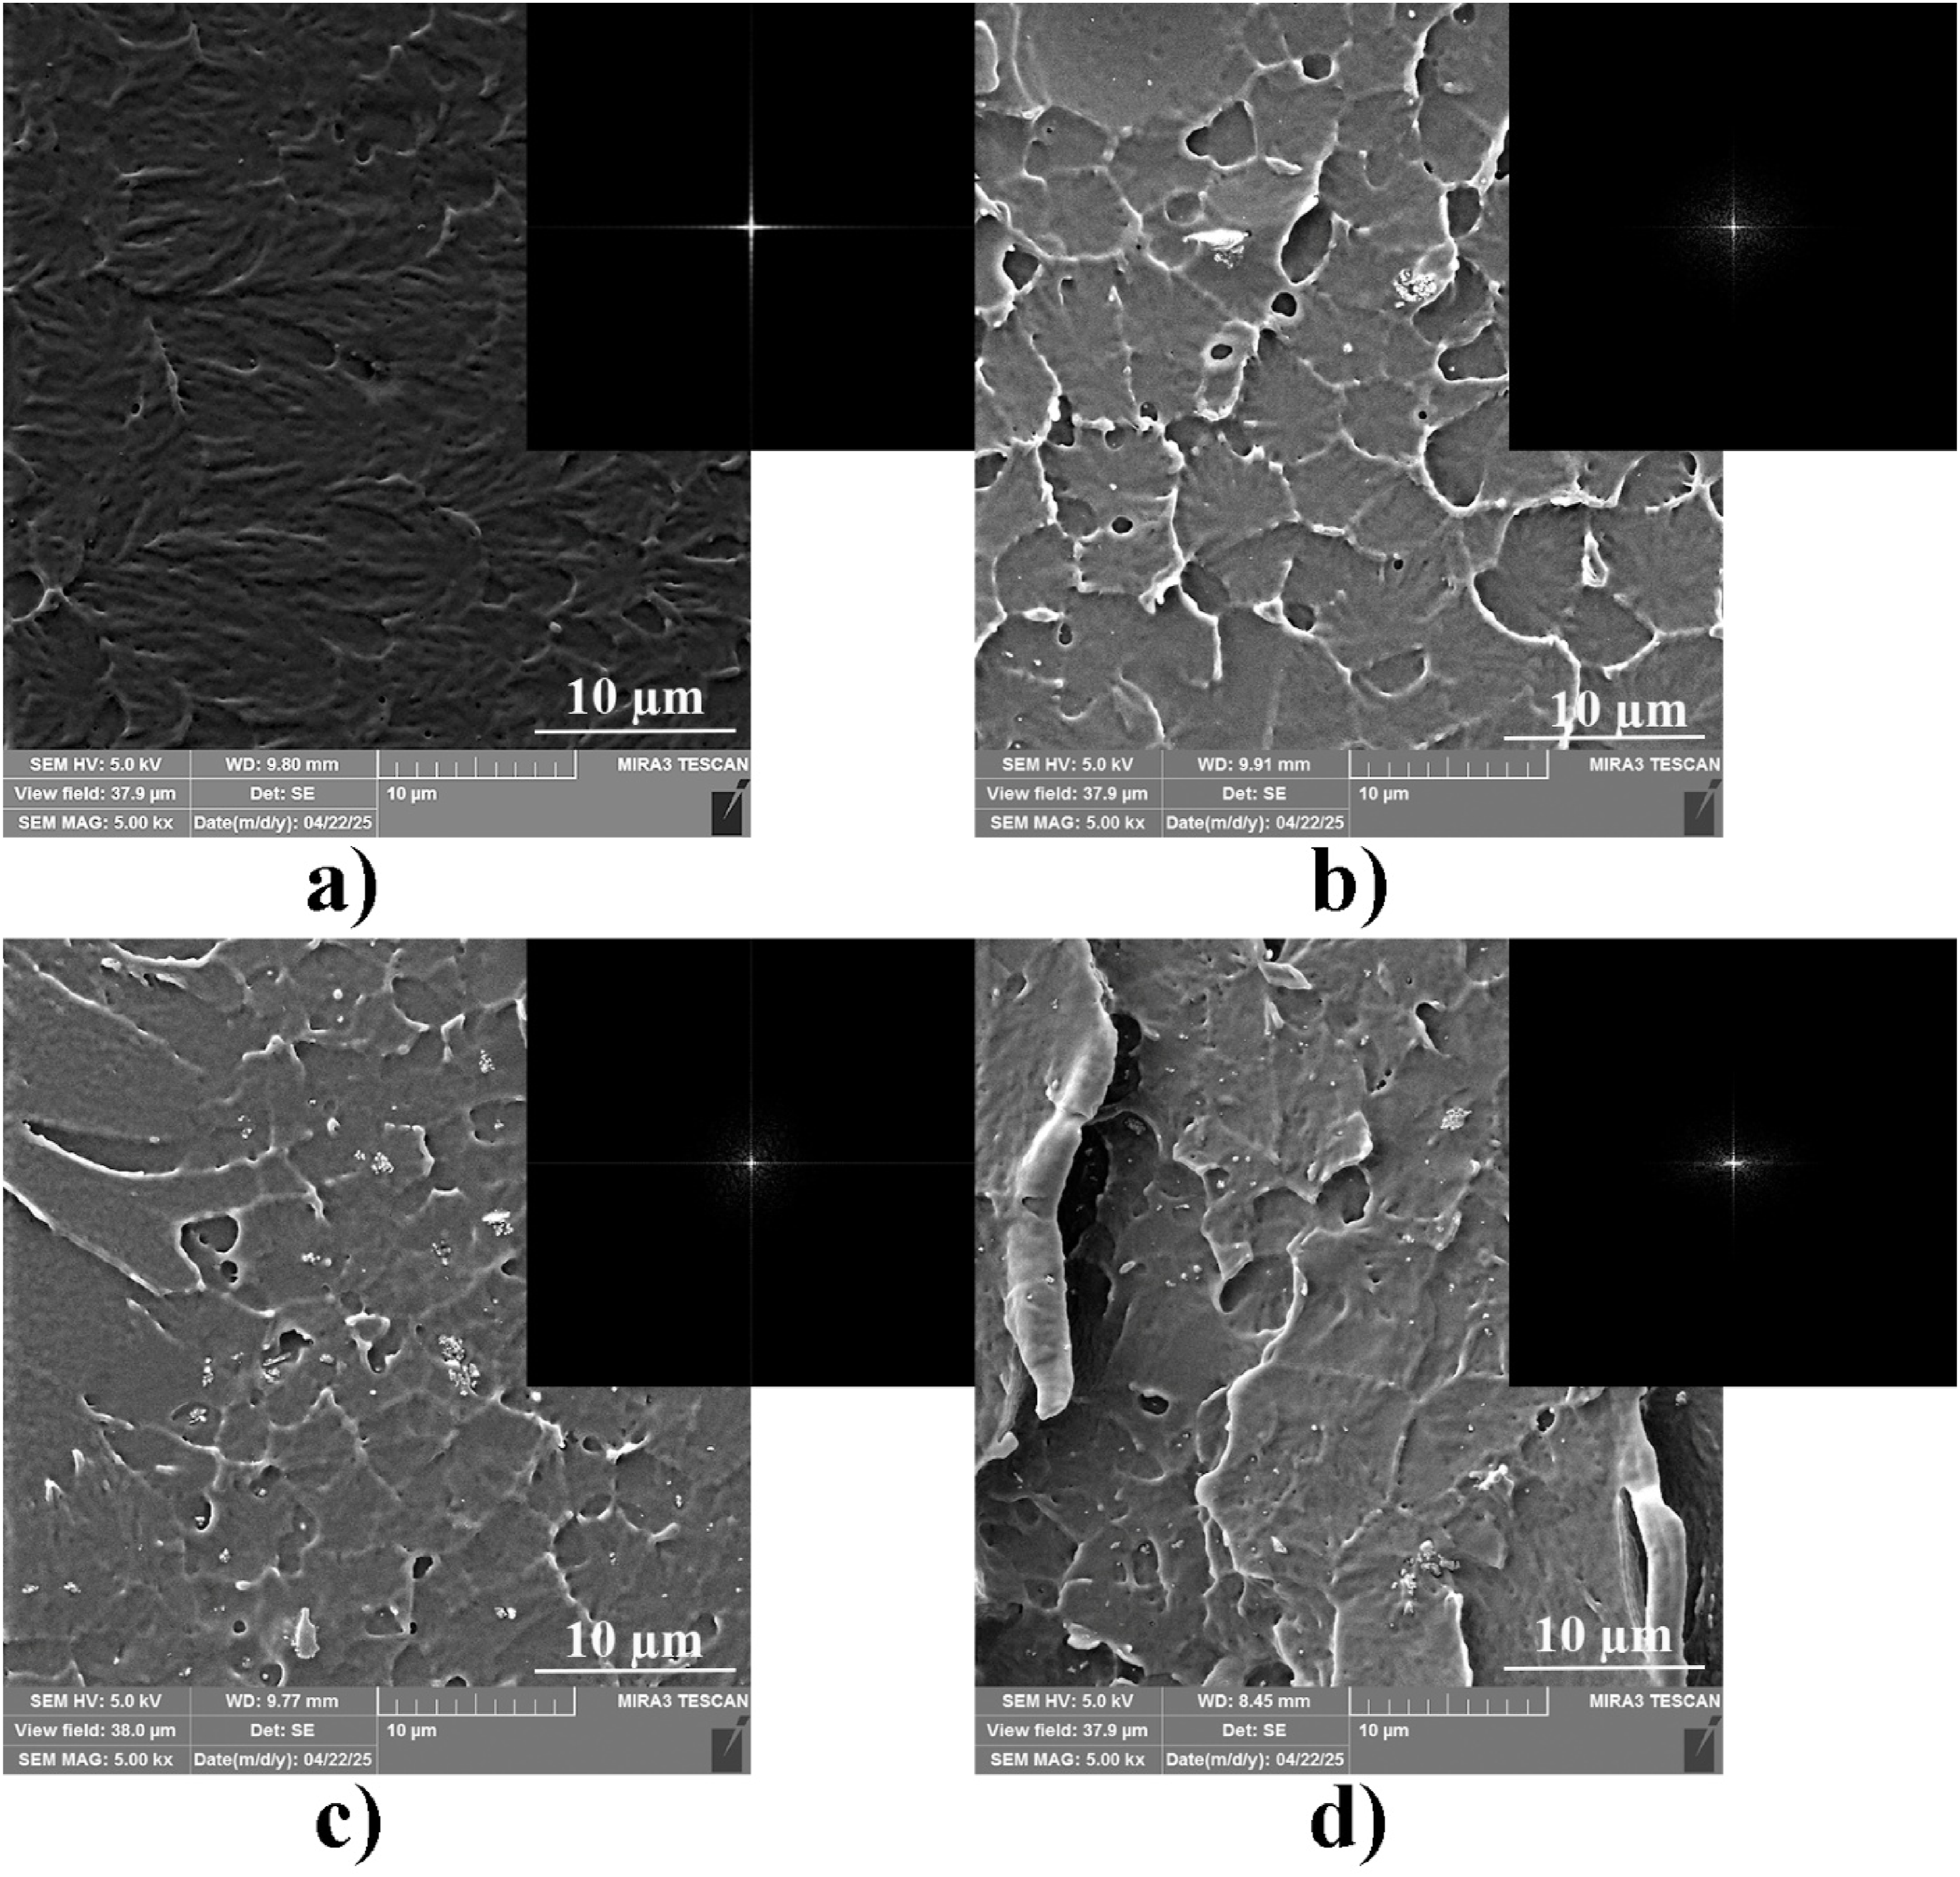
The FFT analysis of features in FE-SEM images were obtained from the Image Pro Plus 6.0 programme. The option in the program is meant to serve for eliminating the periodic noise from the image, but on the other hand, the spectrum gives the information about the periodicity of the features in the image. 51 The analysis is oriented to extract the frequency of relief seen at the surface image and to analyse if there is a pattern present. For example, the FFT image of a flat black surface is the simple cross and the regular pattern like that on the chess board has defined points we provided description in supplementary material. The image results of FFT analysis are given in Figure 2 together with the FE-SEM images. Data driven from this image processing tool can serve to find possible numerical data driven from the image and to link them to observations that are made in the FE-SEM images. The FFT analysis of the matrix fracture surface is dominated by the strong cross structure suggesting that the features of this surface are highly symmetric and that the imperfections are resulting from the unidirectional stress orientation to which the specimen was subjected. The structure has very few irregularities. The FFT of the fracture surface of the composite having 1 wt.% reinforcement has a softened cross and more peripheral structure indicating that the reinforcement begins to disrupt matrix regularity. Crack paths show early deflection and micro-interactions, but matrix still dominates fracture behaviour as particles remain to be well dispersed. The specimen with 3 wt.% reinforcement has a sharpened cross and balanced contrast and symmetry. This specimen has optimal reinforcement level when the toughness is considered as well as the specimen’s strength. Crack deflection and energy dissipation are maximized. FFT shows structured anisotropy without over-constraining fracture paths — correlates with peak toughness. The specimen with 5 wt.% reinforcements exhibit highly crisp cross with minimal peripheral features in the FFT transformed image. FFT suggests brittle, directional fracture with reduced variability. Likely due to particle agglomeration or saturation of interfacial bonding — matches observed drop in toughness. The pattern suggests the over-reinforced structure where agglomerates could limit the benefit of added particles. FFT suggests brittle, directional fracture with reduced variability. Likely due to particle agglomeration or saturation of interfacial bonding and matches observed drop in toughness.
SEM cross-sectional analysis of the polymer composites indicated the occurrence of surface protrusions, which can be related to the way how material breaks and describe the contribution to the material’s mechanical strength. Images were thresholder to create binary images, and the box-counting method was used to calculate the Hausdorff dimension. The threshold images are given in Figure 3 together with the results of calculation carried out in MATLAB tool. The Hausdorff dimension (HD) was computed for features with regular shapes, based on their minimum, mean, and maximum diameters observed in the PMMA-based composites (Figure 3). This diameter range was found to be effective for estimating a characteristic feature size that corresponds to the HD values for irregularly shaped pores. Hausforff dimension is a powerful tool to characterize the structure complexity.32,52 The Hausdorff dimension is a mathematical method for assessing how irregular or “fractal-like” a shape is. The Hausdorff dimension of a straight, smooth crack is close to 1, while that of a pointed, branching crack is closer to 2. In practical terms, this means that cracks with higher HD values propagate more slowly because they expend more energy navigating microstructural barriers, whereas cracks with lower HD values grow more directly and quickly. Hausdorff dimension of FE-SEM images of composite materials: (a) PMMA, (b) 1 wt.% SiO2/Al2O3, (c) 3 wt.% SiO2/Al2O3, and (d) 5 wt.% SiO2/Al2O3 and the Hausdorff dimension transformation image of the fracture.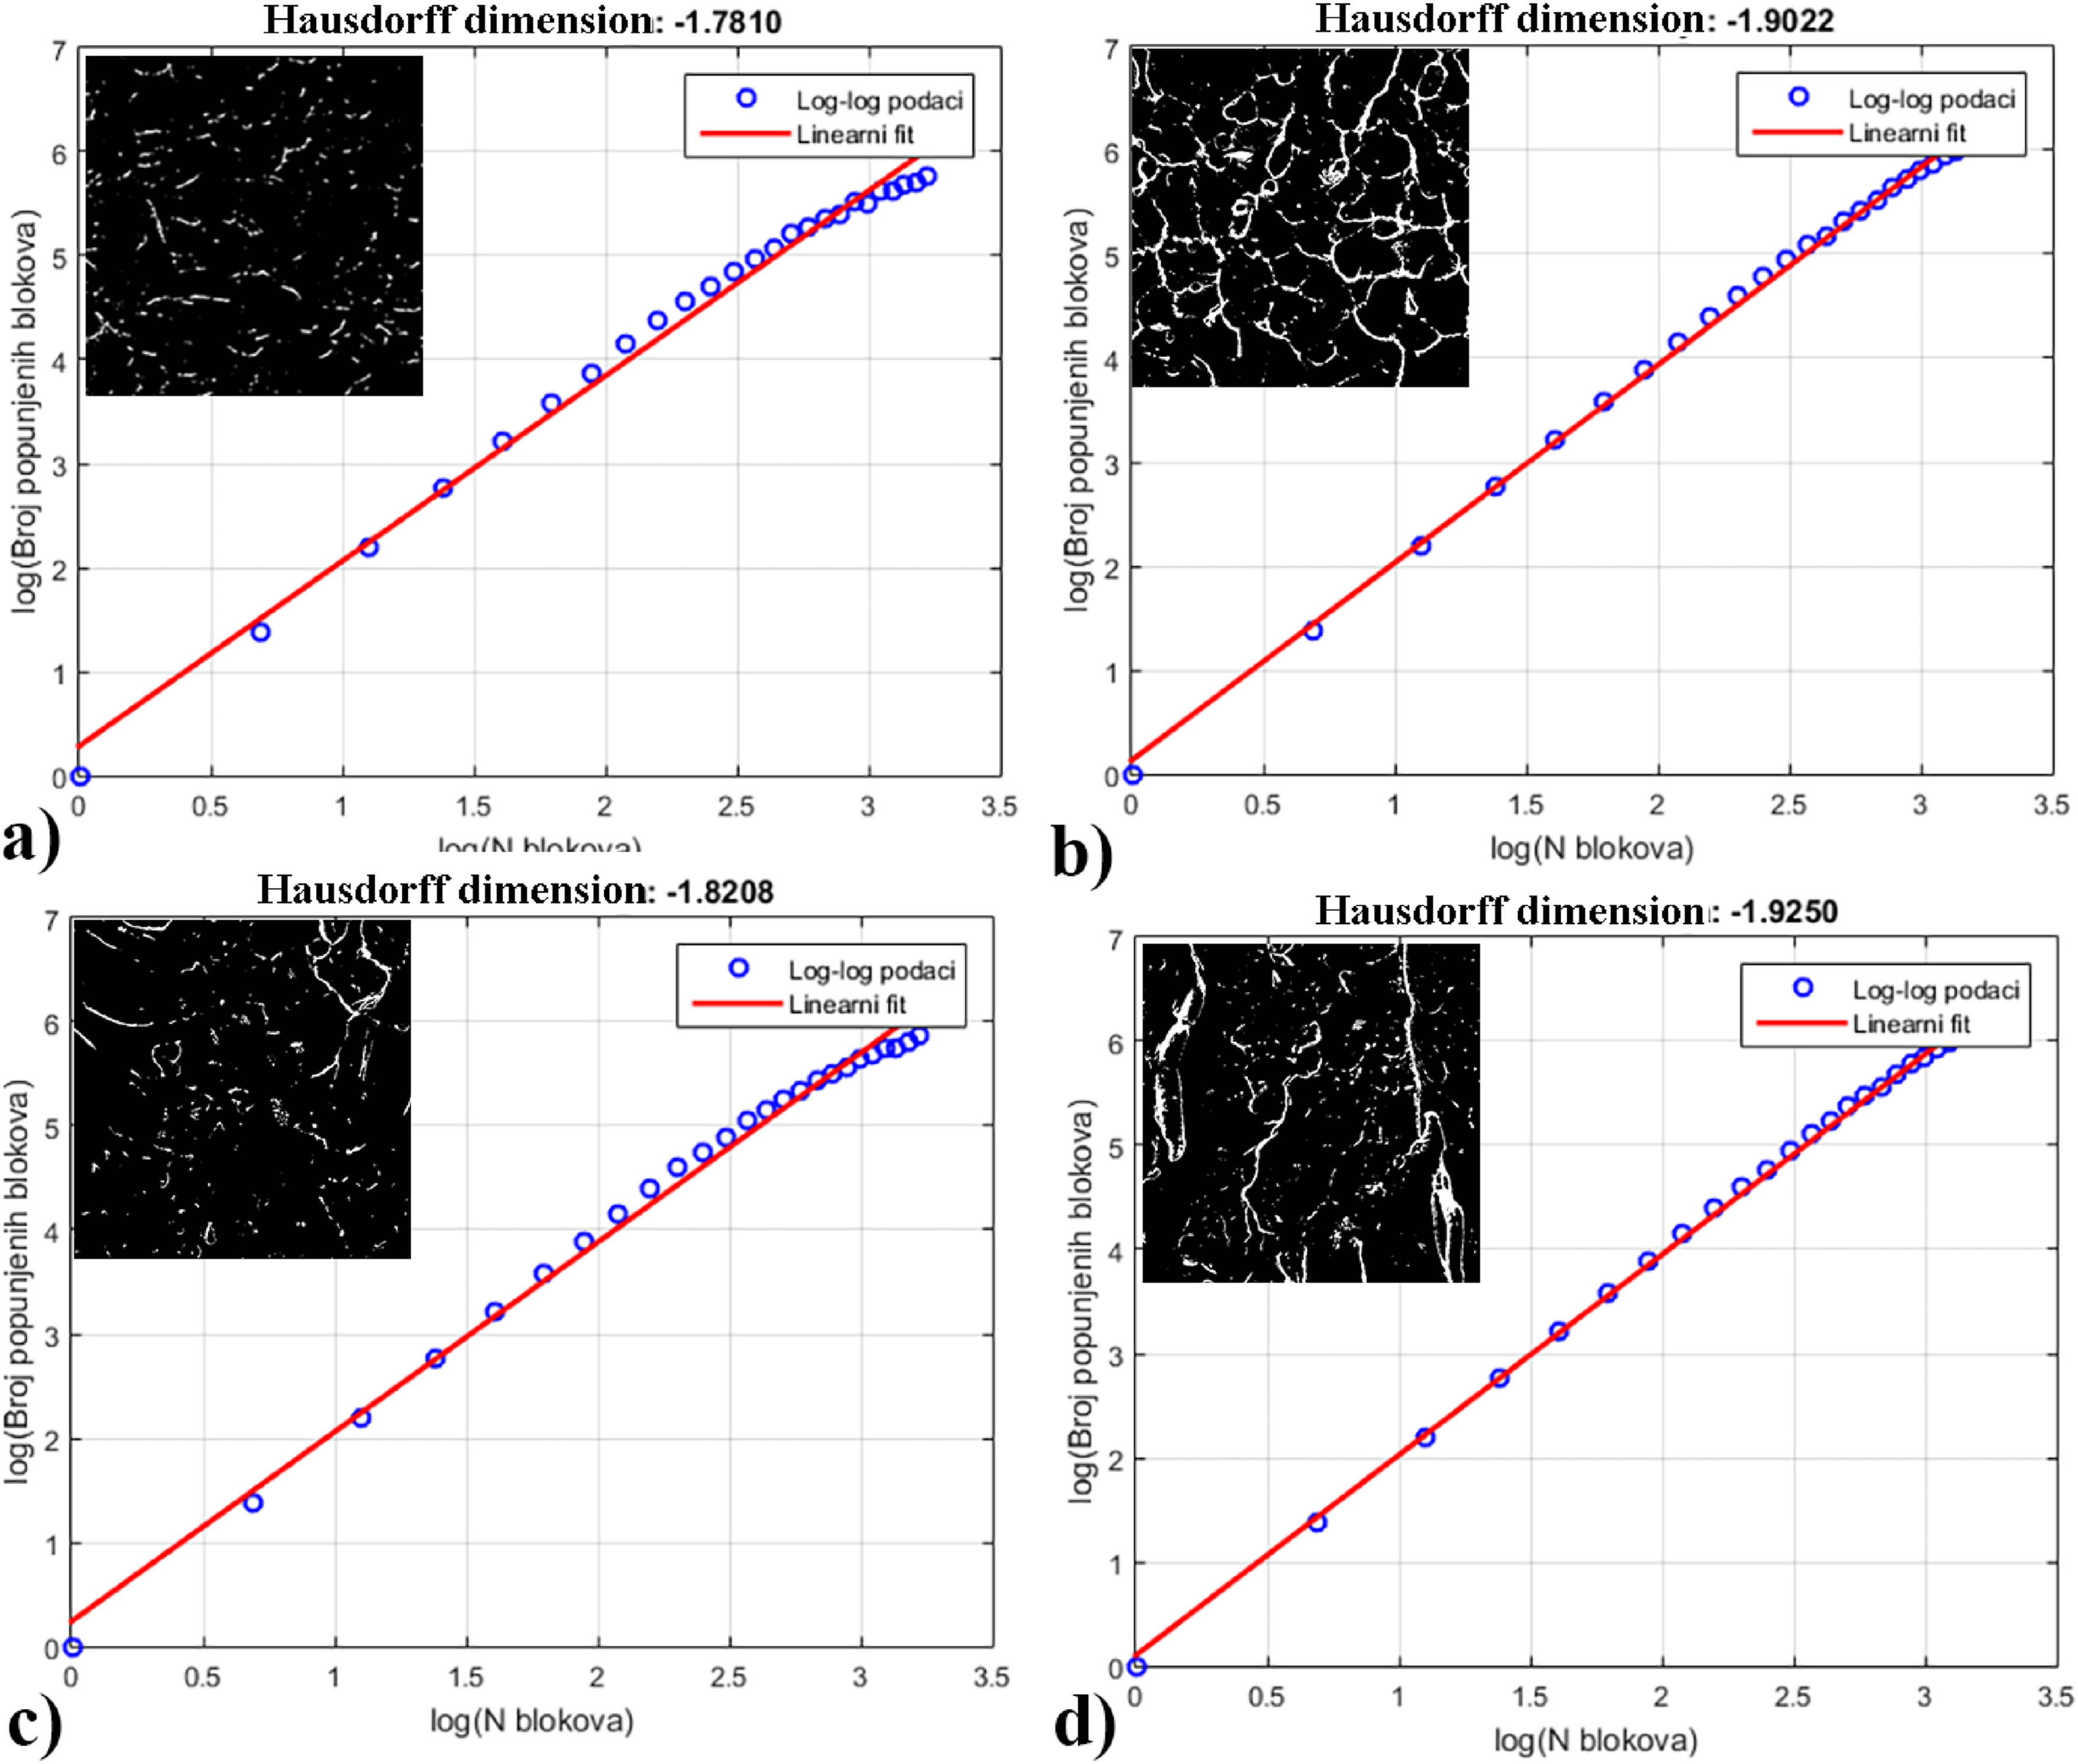
The Hausdorff dimension (HD) for the PMMA matrix, is 1.78, which indicates moderate complexity and “roughness” of the contours in the image. The value of HD of 1.90 for PMMA + 1 wt.% SiO2/Al2O3 indicates a high complexity and fragmentation of contours in the image. In the composite PMMA + 3 wt.% SiO2/Al2O3, the HD is 1.82, indicating slightly lower complexity and granulation of the contours compared to the pure PMMA matrix, which may be a consequence of less fragmentation or smoother edges. The value of 1.93 for PMMA + 5 wt.% SiO2/Al2O3 indicates a very high complexity and fragmentation of the contours in the image — which is typical for structures with irregular granulation or microcracks.
Microhardness
The results of the microhardness data of PMMA and its hybrid composite reinforced with SiO2/Al2O3 particles were calculated based on equation (2) and are presented as a bar chart in Figure 4. Effect of the wt.% of SiO2/Al2O3 nanoparticles (NPs) on the microhardness of PMMA composite samples for different series. Data are expressed as mean ± SD (standard deviation) (nmeasured diagonals = 6). Applied load and dwell time were 0.98 N and 25 s, respectively. The filler concentrations were: 1, 3, and 5 wt.%.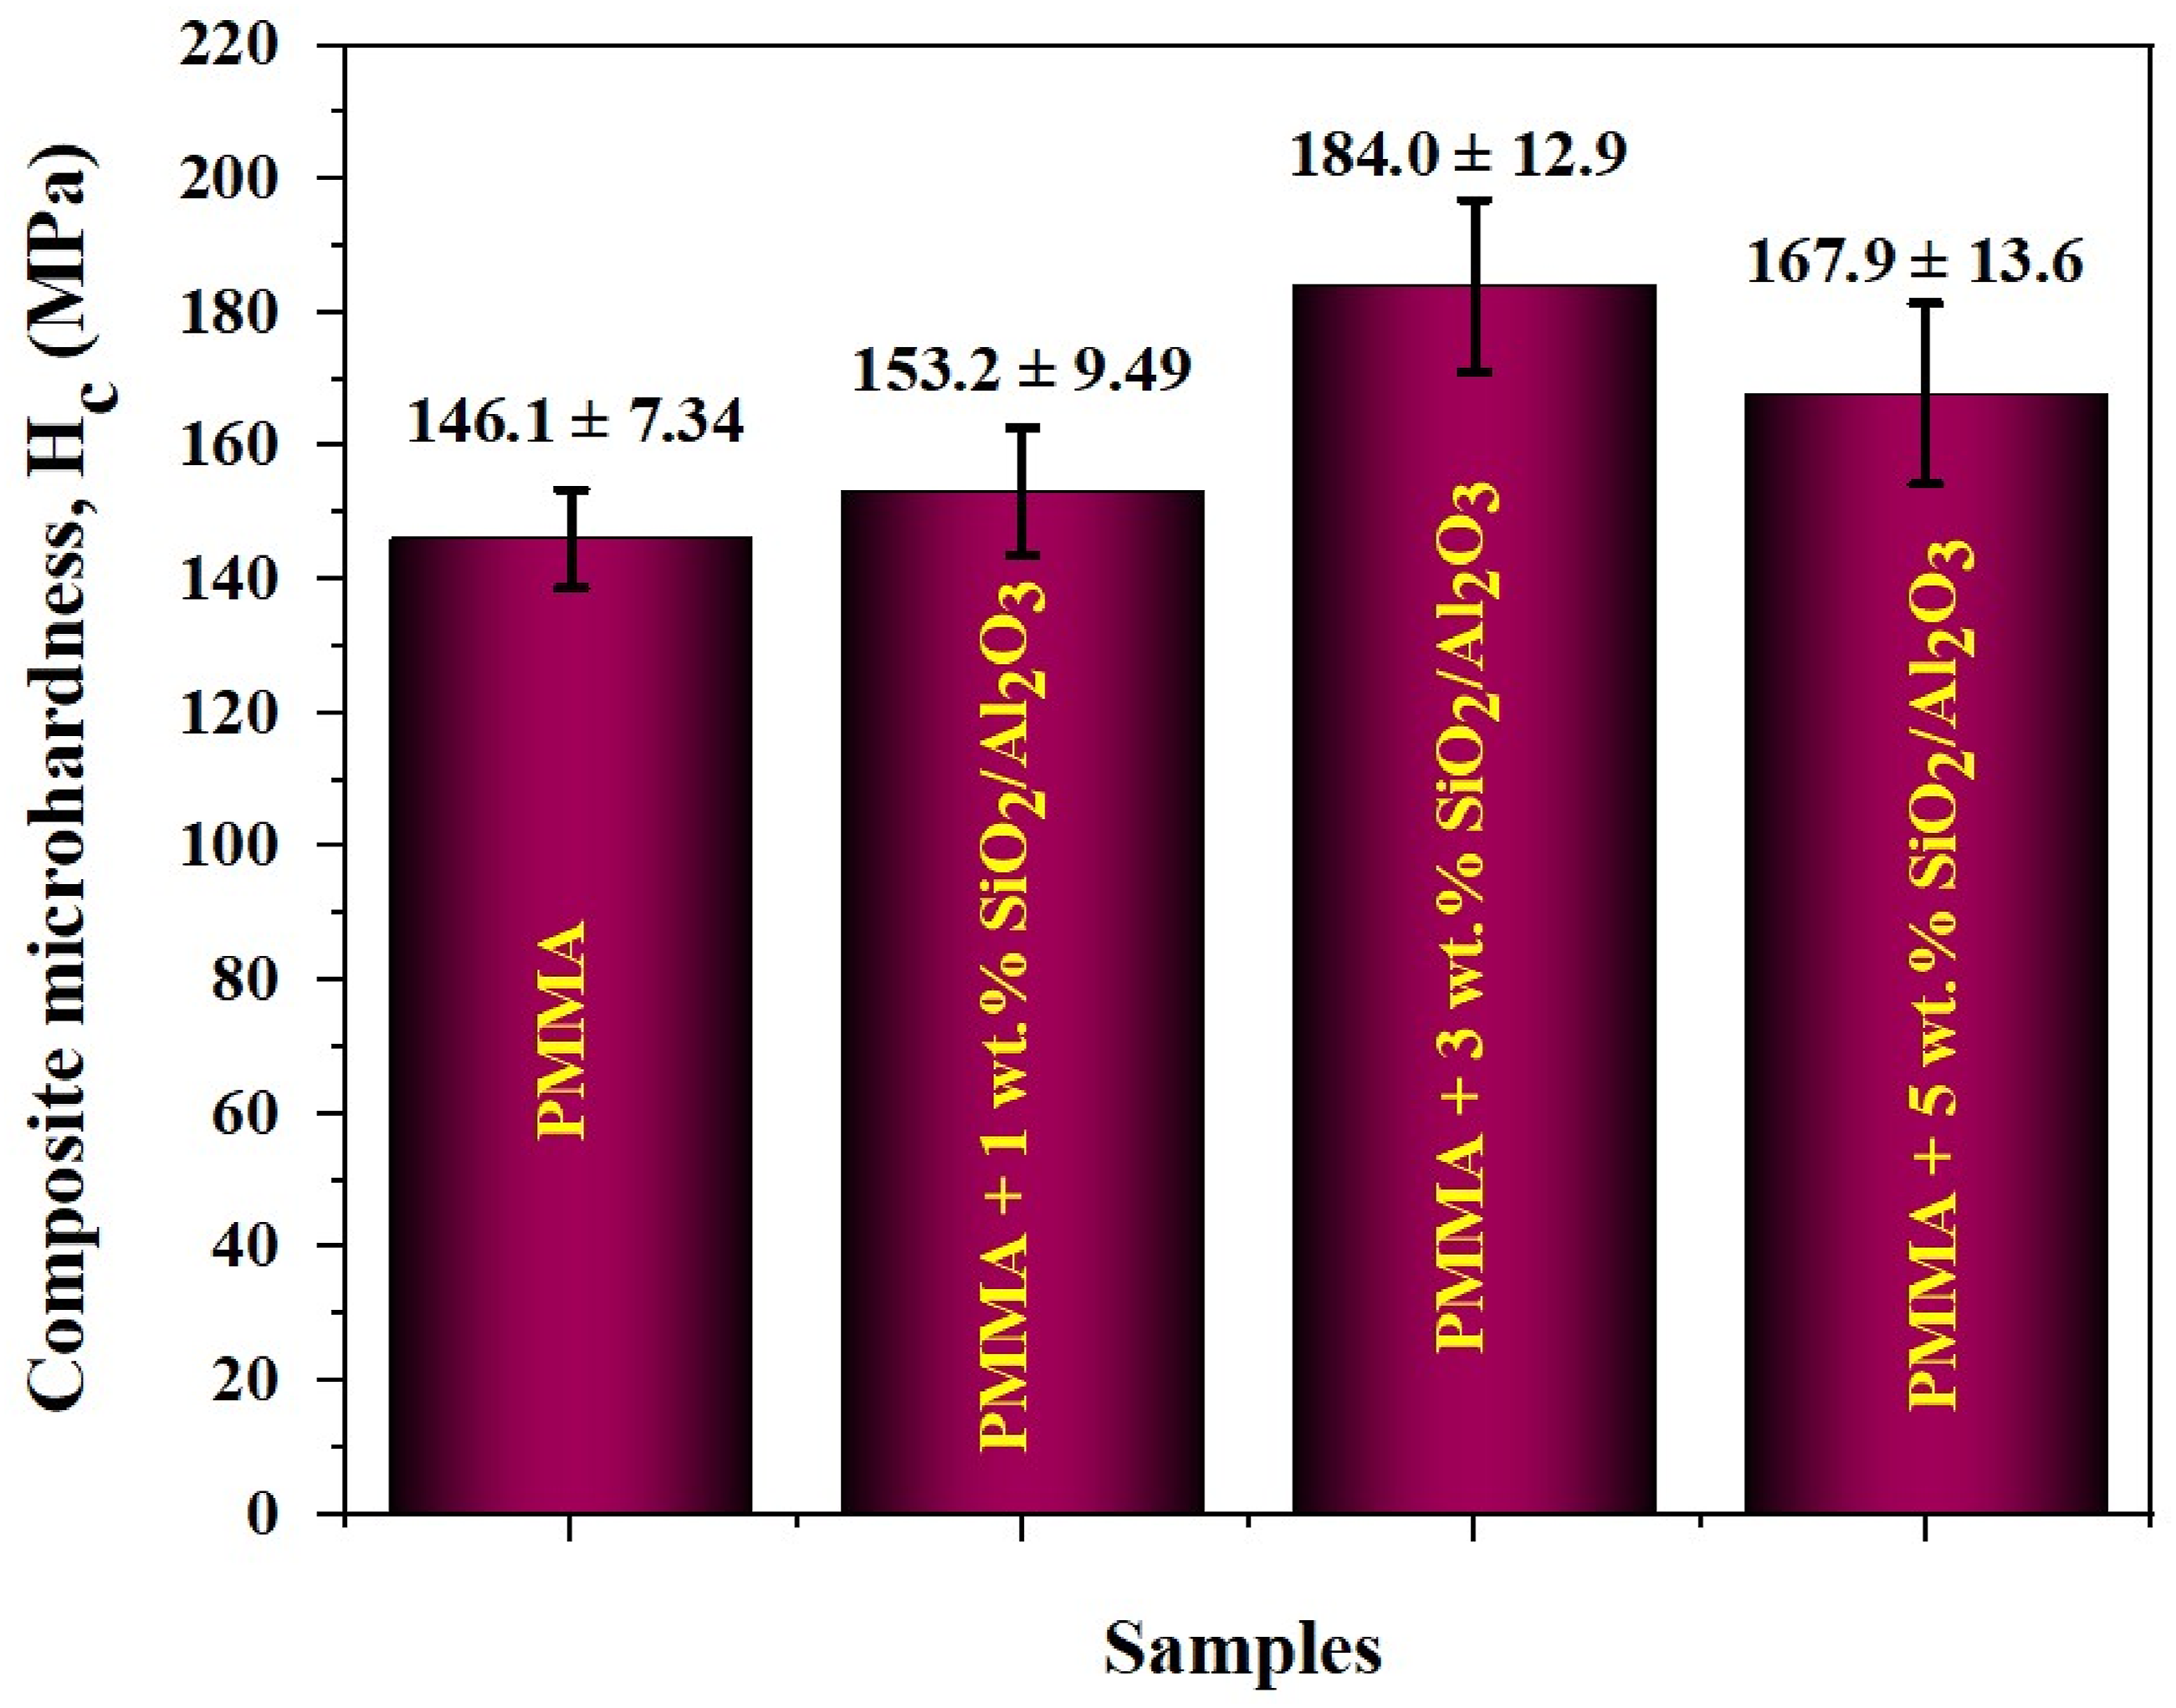
Figure 4 shows that the PMMA matrix has a microhardness of 146.1 ± 7.34 MPa. The surface composite microhardness of the samples is increased as the loading of SiO2/Al2O3 particles, and the composite microhardness is increased to 153.2 ± 9.49 MPa for PMMA + 1 wt.%SiO2/Al2O3, 184.0 ± 12.9 MPa for PMMA + 3 wt.%SiO2/Al2O3, and then slowly decreases to 167.9 ± 13.6 MPa for PMMA + 5 wt.% SiO2/Al2O3 composite. When comparing similar results from the literature, it is observed that the pure PMMA matrix has lower values than those found in the literature. Cao et al. 53 measured the hardness value of a pure PMMA matrix of 236.4 MPa and up to 491.2 MPa for PMMA/SiO2 composites using a nanoindentation test. In our previous publication, 28 using the Shore method t, that the hardness on the Shore scale D was found to be in the range of 60–80, with the same trend obtained using the Vickers method.
The maximum mean value for the micro indentation test was observed in the PMMA composite group with the addition of 3 wt.% SiO2/Al2O3 NPs, followed by the group with 5 wt.% SiO2/Al2O3 NPs, and finally the group with 1 wt.% PMMA of SiO2/Al2O3 NPs group. The lowest mean microhardness value was recorded for the control sample (neat PMMA). The microhardness of polymer nanocomposites depends on the nature of the polymer-nanofiller interface. The results also indicate that microhardness and Young’s modulus of PMMA increased by addition of filler in the form of SiO2/Al2O3 NPs. The microhardness increases when the nanoparticles are concentrated at the interface due to good interfacial adhesion, while the microhardness decreases due to poor interfacial adhesion. 54 This claim will be discussed through the surface energy of the composite in the following text. The decrease in microhardness in hybrid PMMA-based nanocomposite samples with SiO2/Al2O3 particles (with 5.0 wt.%) is probably due to the uniaxial orientation of the particles or the agglomeration of the particles in the PMMA matrix, because agglomerates act as stress concentrators rather than reinforcers 55 and reduced toughness, also. The agglomeration of reinforcement particles is confirmed in the FE/SEM study; therefore, the uniaxial orientation of the particles is not the reason for the decrease in microhardness with 5 wt.%, see Figure 2(g).
Strength and sensitivity
The mechanical properties of PMMA/SiO2/Al2O3 hybrid composite.

The various parameters such as the applied load, the sample thickness, the dwell time, and the penetration depth influence the microhardness value. 57 They are also responsible for the measurement uncertainty. The uncertainty in measurement is given by Sensitivity coefficient, C, and calculated according to equation (5). For sensitivity analysis, we observed that the sensitivity of the PMMA (75.4%) is more than PMMA/SiO2/Al2O3 (53.1%) sample. This implies that neat PMMA’s microhardness response is more sensitive to input variations (e.g., dwell time), possibly due to its homogeneous structure and absence of nanoparticle reinforcement. When comparing the sensitivity coefficient of composites as a function of the filler concentration, variations are possible. In this case the sensitivity coefficient increased with increasing concentration of fillers in the PMMA matrix. The lower sensitivity of the PMMA/SiO2/Al2O3 nanocomposites was demonstrated for nanoindentation results as lower variability in reinforced samples.14,58
Tensile testing captures the bulk behaviour of the material, allowing for viscoelastic deformation, strain localization, and the manifestation of microstructural imperfections such as agglomerates or chain misalignment. This method is highly sensitive to defects and reflects the overall mechanical performance of the sample under uniaxial stress. In contrast, indentation techniques probe localized deformation beneath the indenter, with less influence from viscoelasticity and fewer contributions from bulk defects. The results are dominated by surface micromechanics and more accurately represent particle reinforcement interactions in idealized conditions. Consequently, hardness-derived yield strength reflects a more isolated view of material resistance, while tensile values encompass the full complexity of the composite structure. This conclusion is in accordance with the observations made for metals testing when this method was introduced as the approximation for yield strength. 37
Indentation creep
The creep resistance curves for neat PMMA and PMMA-based hybrid composite samples synthesised by mixing varying weight percentages of SiO2/Al2O3 NPs are shown in Figure 5(a) and (b). The indentation findings are expressed as a variation of the composite hardness values, Hc, with a dwell time (t) at the applied load of 0.98 N and dwell time in the regime of 5 to 30 s with 5 s step (Figure 5(a)). The experimental data of the composite hardness varying with dwell time variation is shown in Figure 5(b), calculated according to S-A model. The creep parameter is calculated by fitting the data using the Sargent-Ashby model. The results are given in Table 3. As a result of a change in the composite’s structure, stress exponent values should show how the creep behaviour depends on the percentage of SiO2/Al2O3 NPs in the PMMA matrix. Variation of the composite hardness of the PMMA/SiO2/Al2O3 composite as a function of dwell time during micro indentation Vickers testing at constant load 0.98 N a) and fitting experimental data of indentation according to Sargent-Ashby model b). Fitting results obtained according to data in Figure 5(b). The values of stress exponents for the PMMA/mullite composite obtained with various weight % of SiO2/Al2O3 NPs in PMMA matrix, at a constant indentation load 0.98 N, are given.

For PMMA composite obtained by mixing varying weight percentages of SiO2/Al2O3 NPs, indentation findings are expressed as variation of the composite hardness values, Hc, with a dwell time (t) at the applied load of 0.98 N (Figure 5(a)). As a result of a change in the composite’s structure, stress exponent values should show how the creep behaviour depends on the percentage of SiO2/Al2O3 NPs in the PMMA matrix. The PMMA sample without reinforcement phase exhibits the lowest creep resistance (µ = 4.21,763), whereas the sample containing 3% of SiO2/Al2O3 NPs exhibits the highest (µ = 5.99,880). Generally, the addition of ceramic nanoparticles in PMMA significantly improves structural-mechanical properties59,60 and creep resistance properties.27,61 The authors believe that the sliding process explains this composite’s behaviour; during the polymer creep of the PMMA matrix during indentation, the boundaries of the SiO2/Al2O3 NPs serve as little barriers. The slight decrease in creep resistance of the sample with 5% compared to 3% silica-alumina particles can be explained by the presence of agglomerates and an increase in brittleness. 62 At higher concentrations, SiO2 and Al2O3 nanoparticles tend to cluster, forming agglomerates. These agglomerates, can reduce the effective surface area for load transfer and the brittleness reduces the material’s ability to dissipate energy over time, which is critical for resistance to creep.63–65 A possible reason for the different creep rate could also be the sensitivity to hygrothermal conditions when compared to neat PMMA and its composite with SiO2/Al2O3 NPs. 65
In this study, the values of the stress exponent, μ, obtained at the load 0.98 N, ranging from 4.21 to 6. The most resistant to creep is the composite sample with the optimal content of SiO2/Al2O3 NPs (3 wt.%). This observation reinforces the observation that the addition of reinforcement is stabilizing the movement of polymer chains and that addition of reinforcement is stabilizing the movement of the material on the macroscale.
Improved creep resistance with 3 wt.% of SiO2/Al2O3 NPs in the PMMA matrix is clinically beneficial because denture-bases are subjected to sustained stresses during chewing and continuous wear. Materials with higher creep resistance maintain dimensional stability, preserve good adhesion, and enhance long-term fit and comfort, thus extending the functional lifespan of the prosthesis. On the other hand, patient comfort, the speed of working with this self-polymerising material, and the duration of the prosthesis in its given form in real clinical cases are of key importance.
Wettability, free surface energy and adhesion
In prosthetic applications, surface free energy can influence the balance between polar and dispersive interactions at the denture–saliva interface. High values of the polar component indicate that saliva will wet the prosthesis more effectively, and good saliva spreading improves adhesion through capillary forces.
Values of contact angles for water and glycerine (WCA and GCA), work of adhesion (WA) and surface energy (γs) of PMMA-based composites.

As shown in Table 4, the water contact angle (WCA) increasing with SiO2/Al2O3 NP concentration. The opposite trend was observed for the glycerine contact angle (GCA). This result indicates that the hydrophilicity of PMMA decreases with increasing SiO2/Al2O3 NPs content towards water. If the molecular structure of glycerine (which has three hydroxyl groups) is considered, both dispersive and polar interactions are possible. However, the dominant interaction is with dispersive components, in contrast to water, which has very polar structure and a relatively small molecule. Inorganic fillers such as SiO2 and Al2O3 disrupt hydrogen bonding and polar interactions at the PMMA polymer surface, shifting the energy profile towards dispersion dominance (see Table 4). The fillers make the surface less polar (decrease Contact angles for composites: (a) PMMA - water; (b) PMMA + 3 wt.% SiO2/Al2O3 -water, (c) PMMA – glycerine, and (d) PMMA + 3 wt.% SiO2/Al2O3 – glycerine.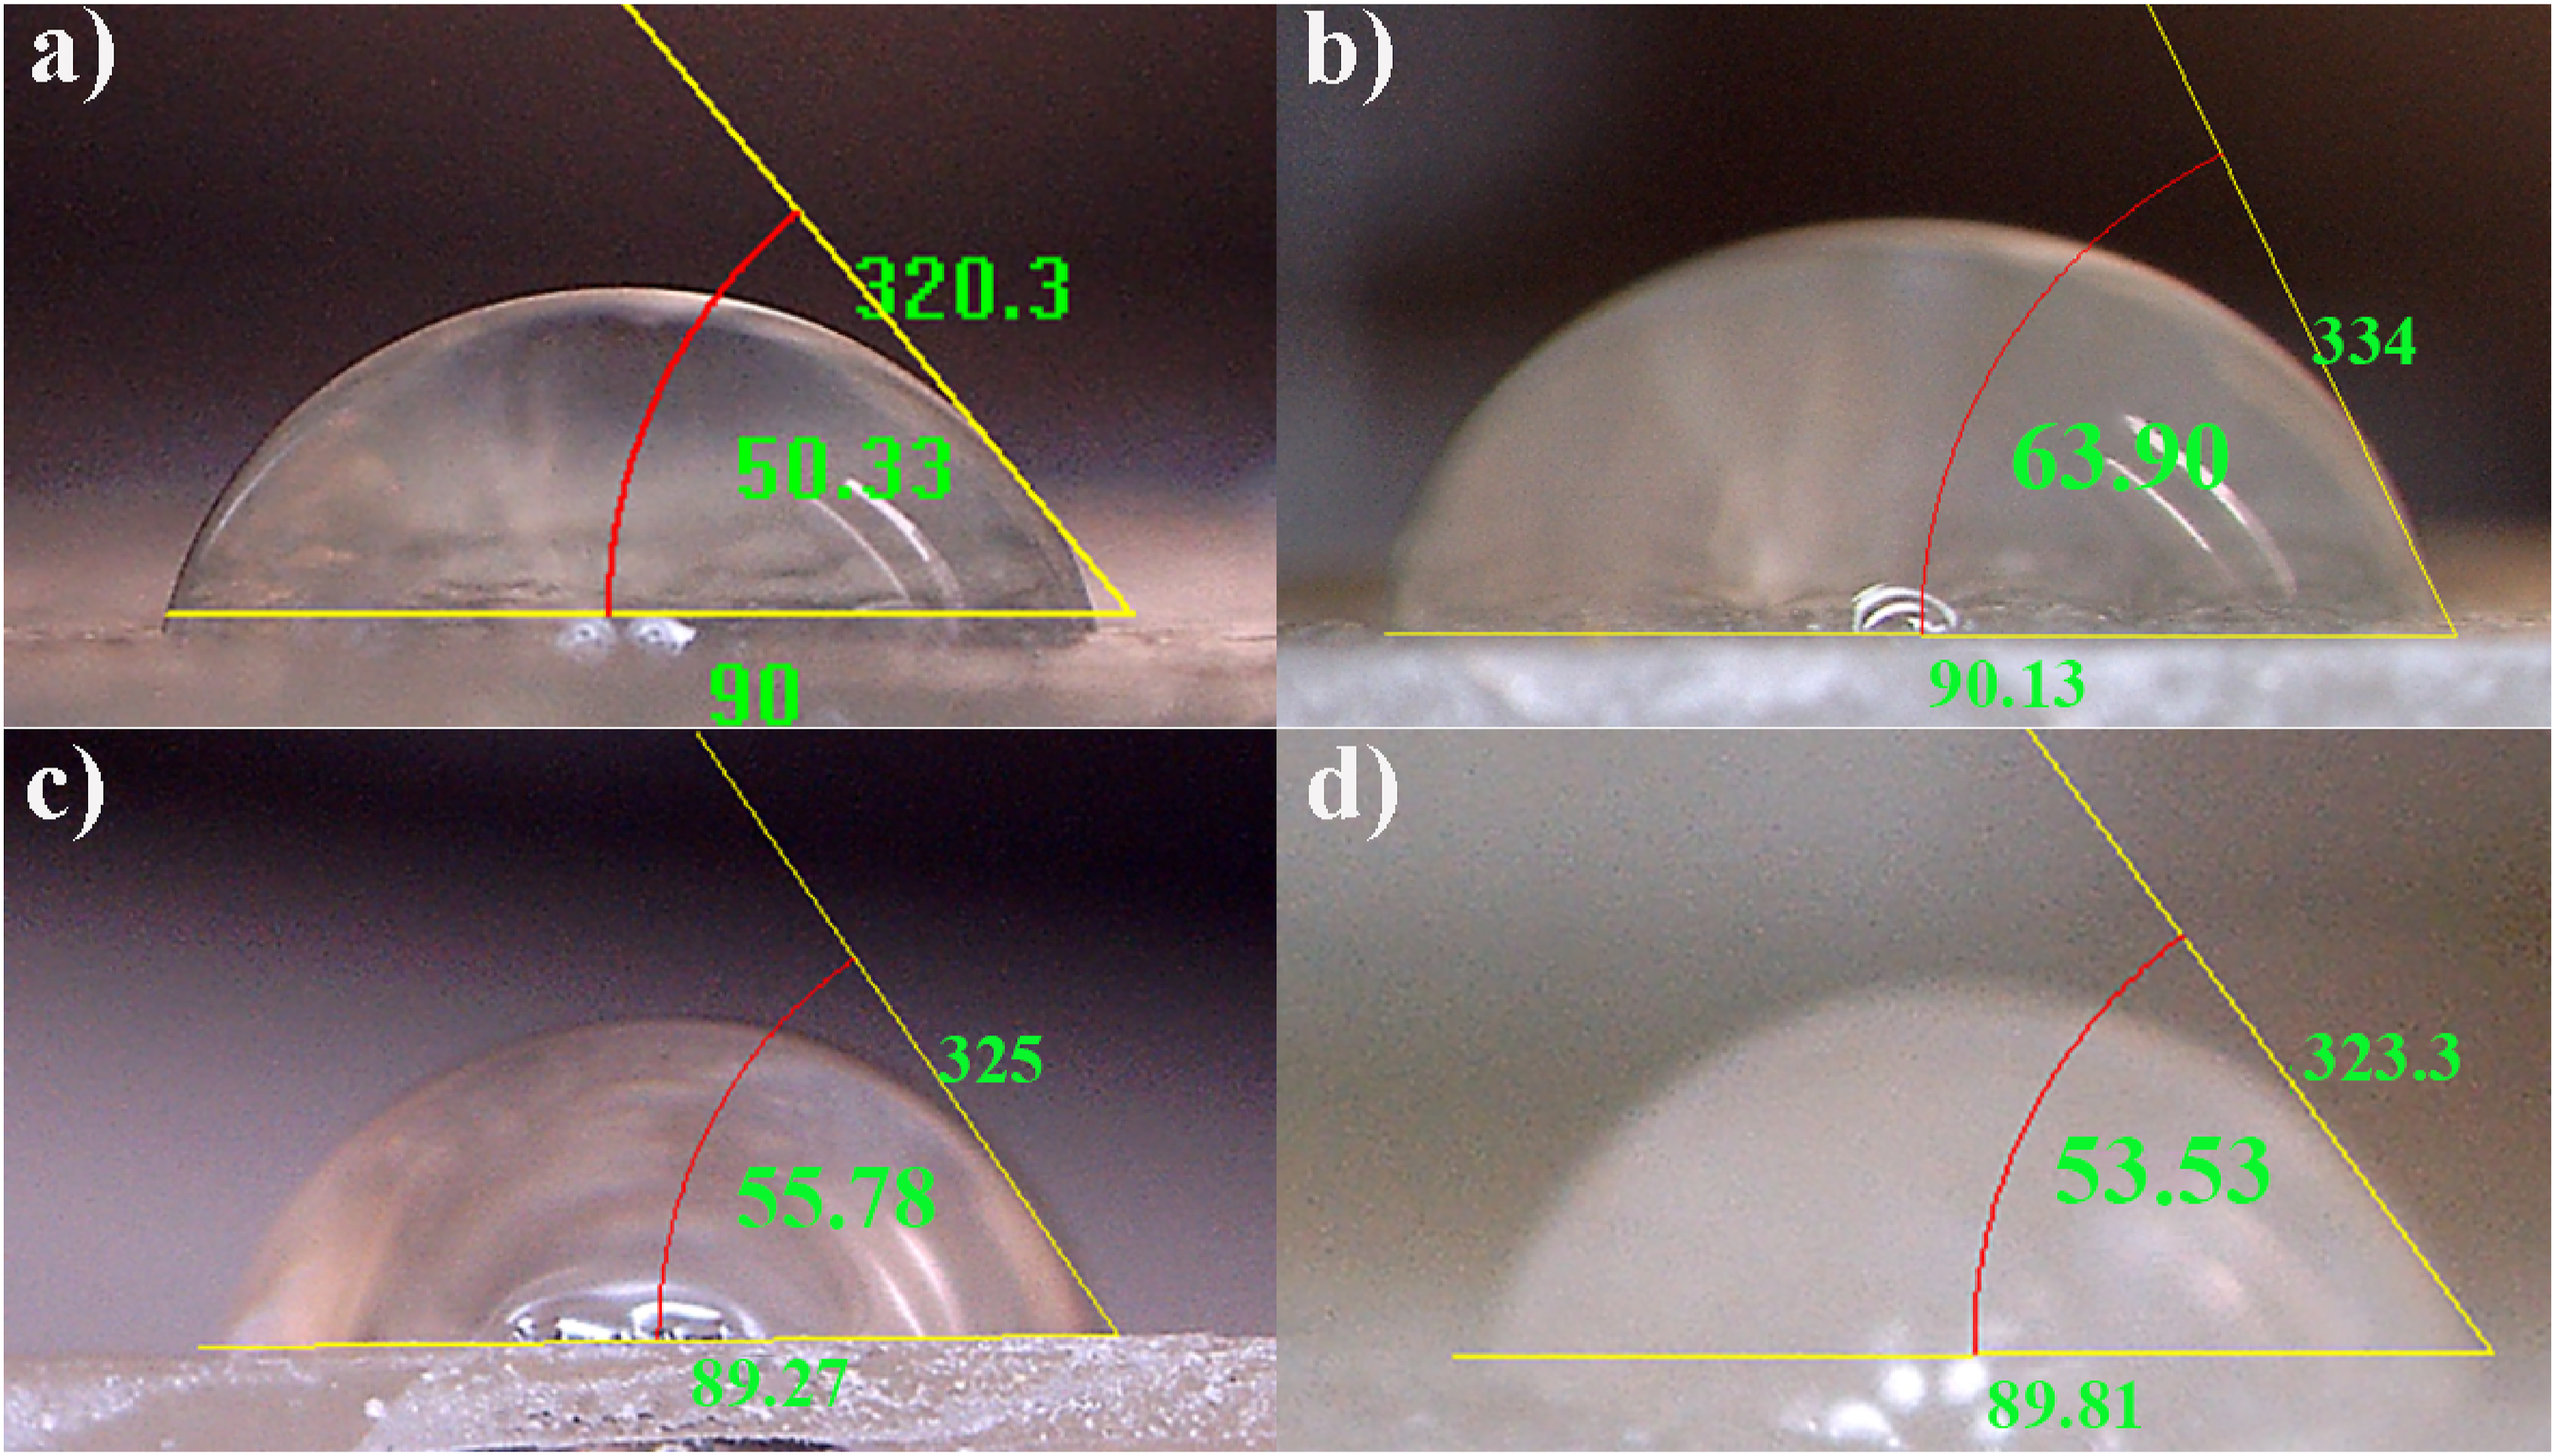
Neat PMMA matrix has a dominant polar part of the surface energy (49.7 mN/m2) which originates from the rich carbonyl structure. The addition of particles causes a reduction in the polar component of the surface energy of the composite in favour of the dispersion component-
Figure 7 shows a summary comparison of all properties of the composites that were observed. Figure 7(a) is summary of surface properties, and Figure 7(b) is summary of mechanical properties of the composites based on PMMA and SiO2/Al2O3 particles. Figure 7(a) shows that, in addition to the influence of surface chemistry, the surface topography of the sample also has an influence on the wetting of the material, and the synergistic influence of these two key factors will be discussed in future work using the example of extremely polar and extremely non-polar liquids. However, in terms of mechanical properties, it is clear that the addition of oxide particles synthesised from sol-gel has a favourable effect on the weak PMMA matrix, which was the aim of the research and proof of the working hypothesis. Comparison of surface and bulk properties of examined samples (a) surface energy of samples, (b) bulk mechanical properties of composites and matrix compared to hardness following the same pattern.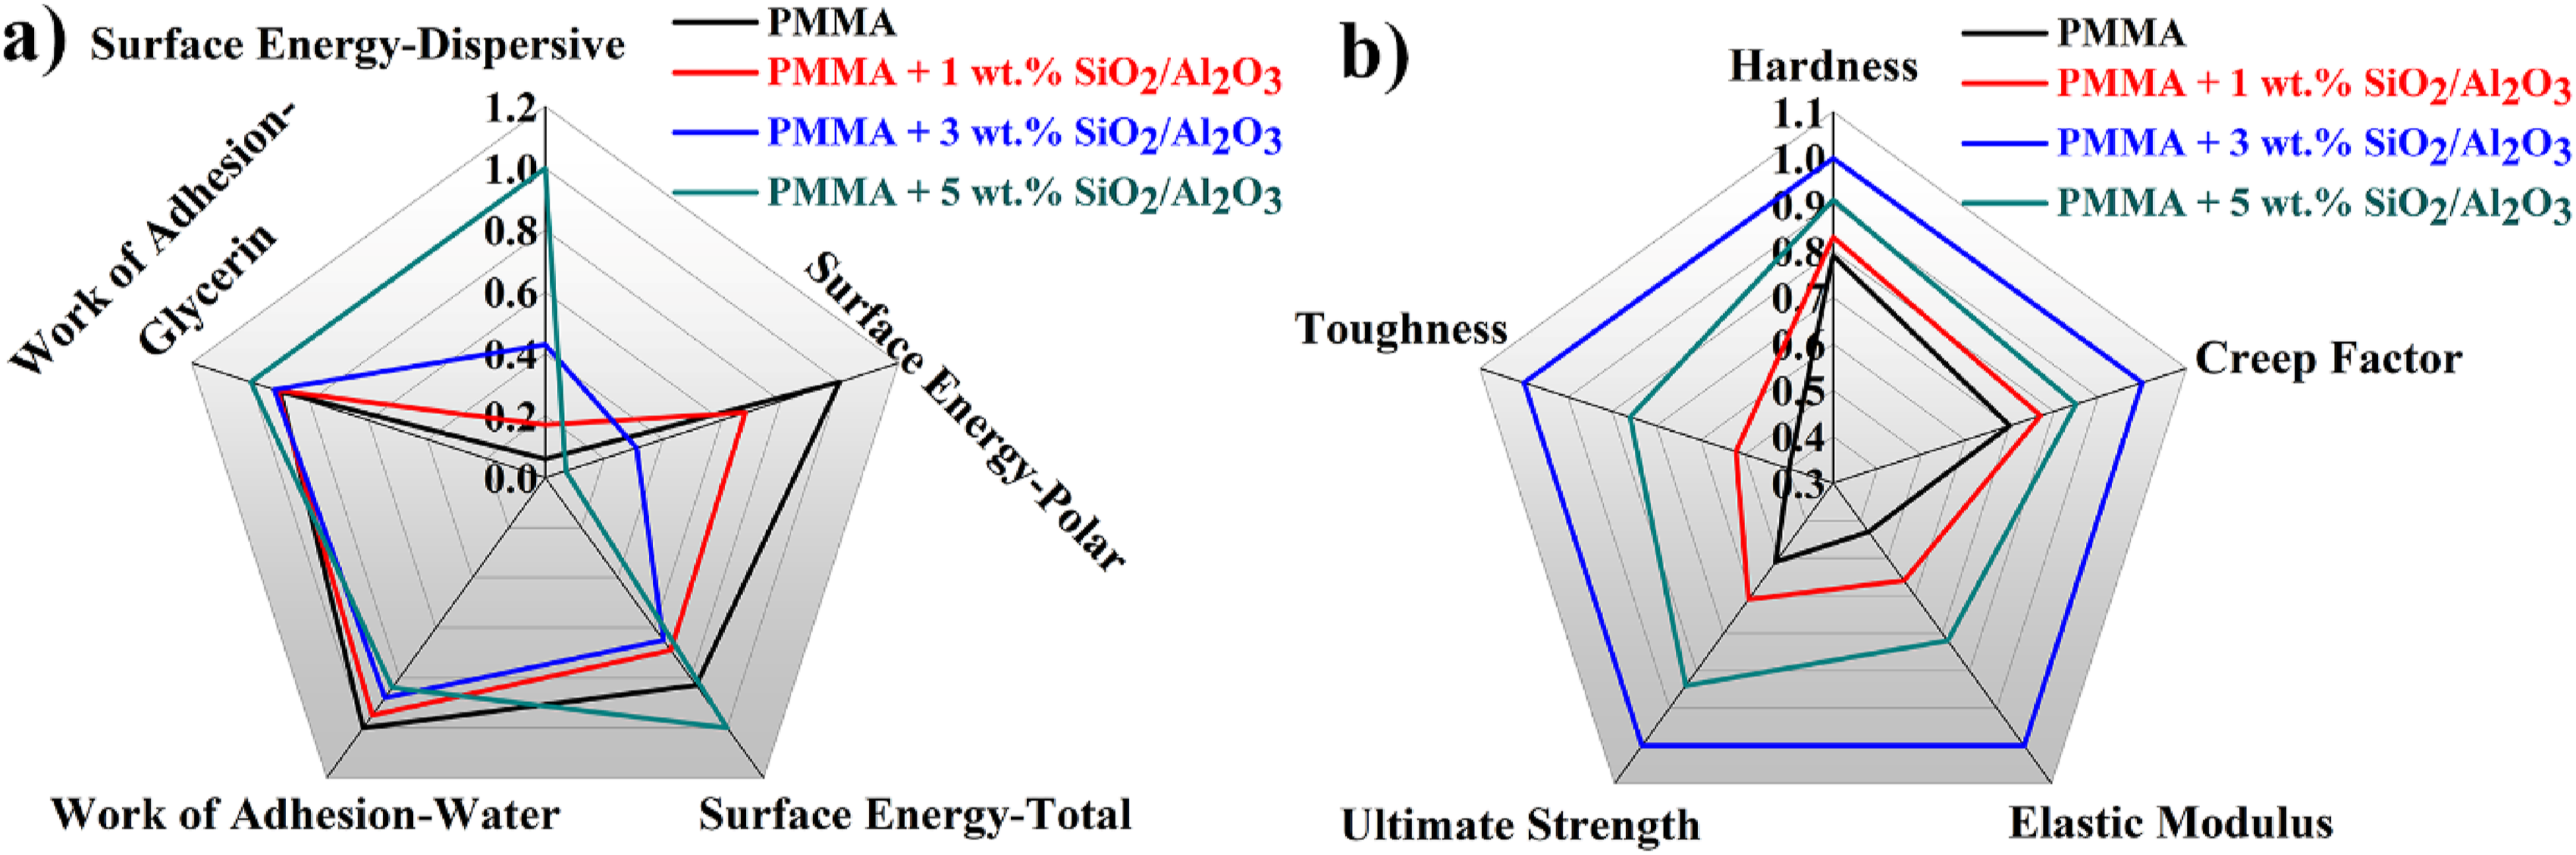
When the overall properties are compared the optimal properties of the sample having 3 wt.% addition of reinforcement show the best performing material compared to all materials studied it exhibits the best performance due to optimal stress distribution in the composite and the lack of agglomeration. Even if the sample with 5 wt.% of particles has properties that are close to those of the optimal sample the presence of agglomeration is diminishing the possibility of the material to use all the reinforcement capacity. The surface properties shown together are more difficult to see directly, but it is clear that a material such as PMMA, which is influenced by a small addition of particles with a polar character, still favours the dispersion component of the surface energy of the composite, even though PMMA is present in excess.
Conclusion
The PMMA matrix samples were compared with the PMMA matrix composites reinforced with 1 wt.%, 3 wt.% and 5 wt.% of the reinforcing particles. The reinforcement particles were cristobalite/corundum composite particles synthesised using the sol/gel technique and using the rice husks as the source of the silica particles. This study represents a significant advance towards sustainable innovation in dental materials. By utilising rice husks and sol-gel technique a bio-derived composite was produced that not only meets but exceeds performance expectations.
The composites and the polymer specimens were tensile tested, and the best performing is the composite having 3 wt.% of reinforcement in terms of best toughness and strengths. At this concentration, the particles were well-dispersed, avoiding agglomeration and enabling a synergy between the matrix and the reinforcement. The bulk results were then compared to those obtained by testing the surface properties of the specimen. The microhardness was used to evaluate the Vickers microhardness values and to extract the modulus value from it. The trends in those values were in accordance with those measured using the tensile test. The strength values estimated from micro indentation test was useful for comparative purpose but cannot be directly equated with standard tensile test results. The indentation technique was also used to observe the viscoelastic properties of the composites and to compare them to the matrix material. The comparison was made using the creep factor which showed that the specimen with 3 wt.% having the best resistance to creep due to good distribution of particles in the matrix. The wettability was observed via the contact of the specimen’s surface with water and glycerol, and the wettability decreased with the addition of particles to the composite. Even as wettability decreased – a natural consequence of reduced surface polarity – the composite remained hydrophilic, making it suitable for biomedical applications. In summary, the 3 wt.% formulation not only performed well but also demonstrated how thoughtful material design can unlock the full potential of bio-derived reinforcements. Generally: • The hardness increased by approximately 25.94% and creep resistance by 4.4% with the incorporation of 3 wt.% Al2O3/SiO2 particles into PMMA, while the tensile strength nearly doubled compared to the pure PMMA matrix • Neat PMMA exhibited a low toughness of 34.29 MPa, while the 3 wt.% composite reached a maximum of 126.22 MPa, exceeding the benchmark by more than three times. • All synthesized samples exhibit hydrophilic properties, with water contact angles ranging from 50.6° to 68.1°, and glycerine contact angles decreasing from 55.7° to 41.7°.
Supplemental material
Supplemental material - Development of PMMA–silica–alumina nanocomposites for enhanced performance
Supplemental material for Development of PMMA–silica–alumina nanocomposites for enhanced performance by Khaled Altwair, Marija M. Vuksanović, Ivana O. Mladenović, Radmila Jančić Heinemann in Polymers and Polymer Composites
Footnotes
Funding
The authors disclosed receipt of the following financial support for the research, authorship, and/or publication of this article: This research was funded by the Ministry of Science, Technological Development, and Innovation of the Republic of Serbia (Contracts Nos. 451-03-136/2025-03/200135, 451-03-136/2025-03/200017, and 451-03-136/2025-03/200026).
Declaration of conflicting interests
The authors declared no potential conflicts of interest with respect to the research, authorship, and/or publication of this article.
Supplemental material
Supplemental material for this article is available online.
References
Supplementary Material
Please find the following supplemental material available below.
For Open Access articles published under a Creative Commons License, all supplemental material carries the same license as the article it is associated with.
For non-Open Access articles published, all supplemental material carries a non-exclusive license, and permission requests for re-use of supplemental material or any part of supplemental material shall be sent directly to the copyright owner as specified in the copyright notice associated with the article.