
Abstract
This article suggests an engineering design for developing the probabilistic Wöhler diagram of rubber parts. The presented methodology includes multiaxial fatigue study as well as probabilistic fatigue calculation based on Wöhler diagrams. This approach is basically built on the Cracking Energy Density (CED) criterion. This is achieved by combining sophisticated Finite Element Analysis (FEA) with Monte Carlo simulation (MCS). To this end, a 3D-FEA numerical model is produced for several loading cases by means of the commercial software ABAQUS.
Keywords
Introduction
Thanks to their exceptional capacity to resist to support large deformation without undergoing any permanent deformations, the use of rubber materials is common in various industries such as pneumatics, isolation systems, gaskets, medical instruments and devices, etc. During use rubber components are usually subjected to cyclic and monotonic loading resulting in a fatigue failure. Understanding the mechanical degradation phenomena that affect rubber parts under these loads is essential to prevent mechanical fatigue.
For elastomer rupture for cyclic loading, two major approaches have been evolved: (1) the crack nucleation approach, that defines the fatigue life as the required cycles to generate a crack of a specific dimension, and (2) the crack growth approach, that identifies the fatigue life as the cycles needed for a pre-existing crack to increase until rupture. The work of Griffith 1 was carried forward by Rivlin and Thomas 2 with the application of tear energy. Numerous renowned researchers have conducted several studies and researches focusing on the rubber's fatigue life. In their studies, an assortment of damage parameters have been investigated in both uniaxial3–9 and multiaxial loadings9–44 to study the rubber fatigue behavior.
Shanguann and Coworkers, 4 Belkhiria et al., 7 Zarrin-Ghalami and Fatemi8,19 and Luo et al.17,18 employed strain-based fatigue criteria to assess fatigue damage. The Researchers in 4 and 7 found out that Green-Lagrange was the most appropriate parameter to evaluate fatigue time of rubber. In addition, authors in5,6 used the maximum principal Cauchy stress as a strong predictive parameter for the fatigue life of rubber. Moreover, Brunac et al. 30 put forward a predictive model relying on the Dang Van’s stress. Bourchak and Aid 31 utilized the peak stress and strain energy density as fatigue parameters to compute the fatigue of polymer pipes. Furthermore, Verron 33 used the minimum configurational stress, used by le Cam et al. 33 to evaluate fatigue damage. Elsewhere, energy-based criteria were also utilized2,11,12,14–16,23–28,3437–44 to judge elastomeric fatigue life. Energy parameters may be Strain Energy Density (SED)2,15,34 cracking energy density,11,12,14,16,19,21,23–28,37,38 and dissipation energy density.39–44
The main objective of the current work consists in developing a generalized methodology to calculate the reliability of a predictive fatigue model considering the cracking energy density as a damage parameter. The suggested method is realized by combining finite element analysis and the Monte Carlo reliability method. The initiation of multi-axial failure in SBR rubber under finite deformation is explored by considering tensile, torsional and tensile-torsional loads of a Diabolo specimen. Then a 3D FE-analysis for an SBR material considering the non-linear hyperelastic Ogden model is established, in order to determine the CED parameter. Afterwards, the reliability of the predictive model is calculated for various material dispersion level.
Theoretical background
Cracking energy density
The Strain Energy Density (SED) represents the energy stored in the material due to its elastic response to deformation. Under multiaxial fatigue loading, not the total SED is used to create a crack in a given plane, the part of the available SED used to initiate the crack is CED.
This parameter under small strain, is set up incrementally as the product scalar of stress vector CED description for plane stress cases.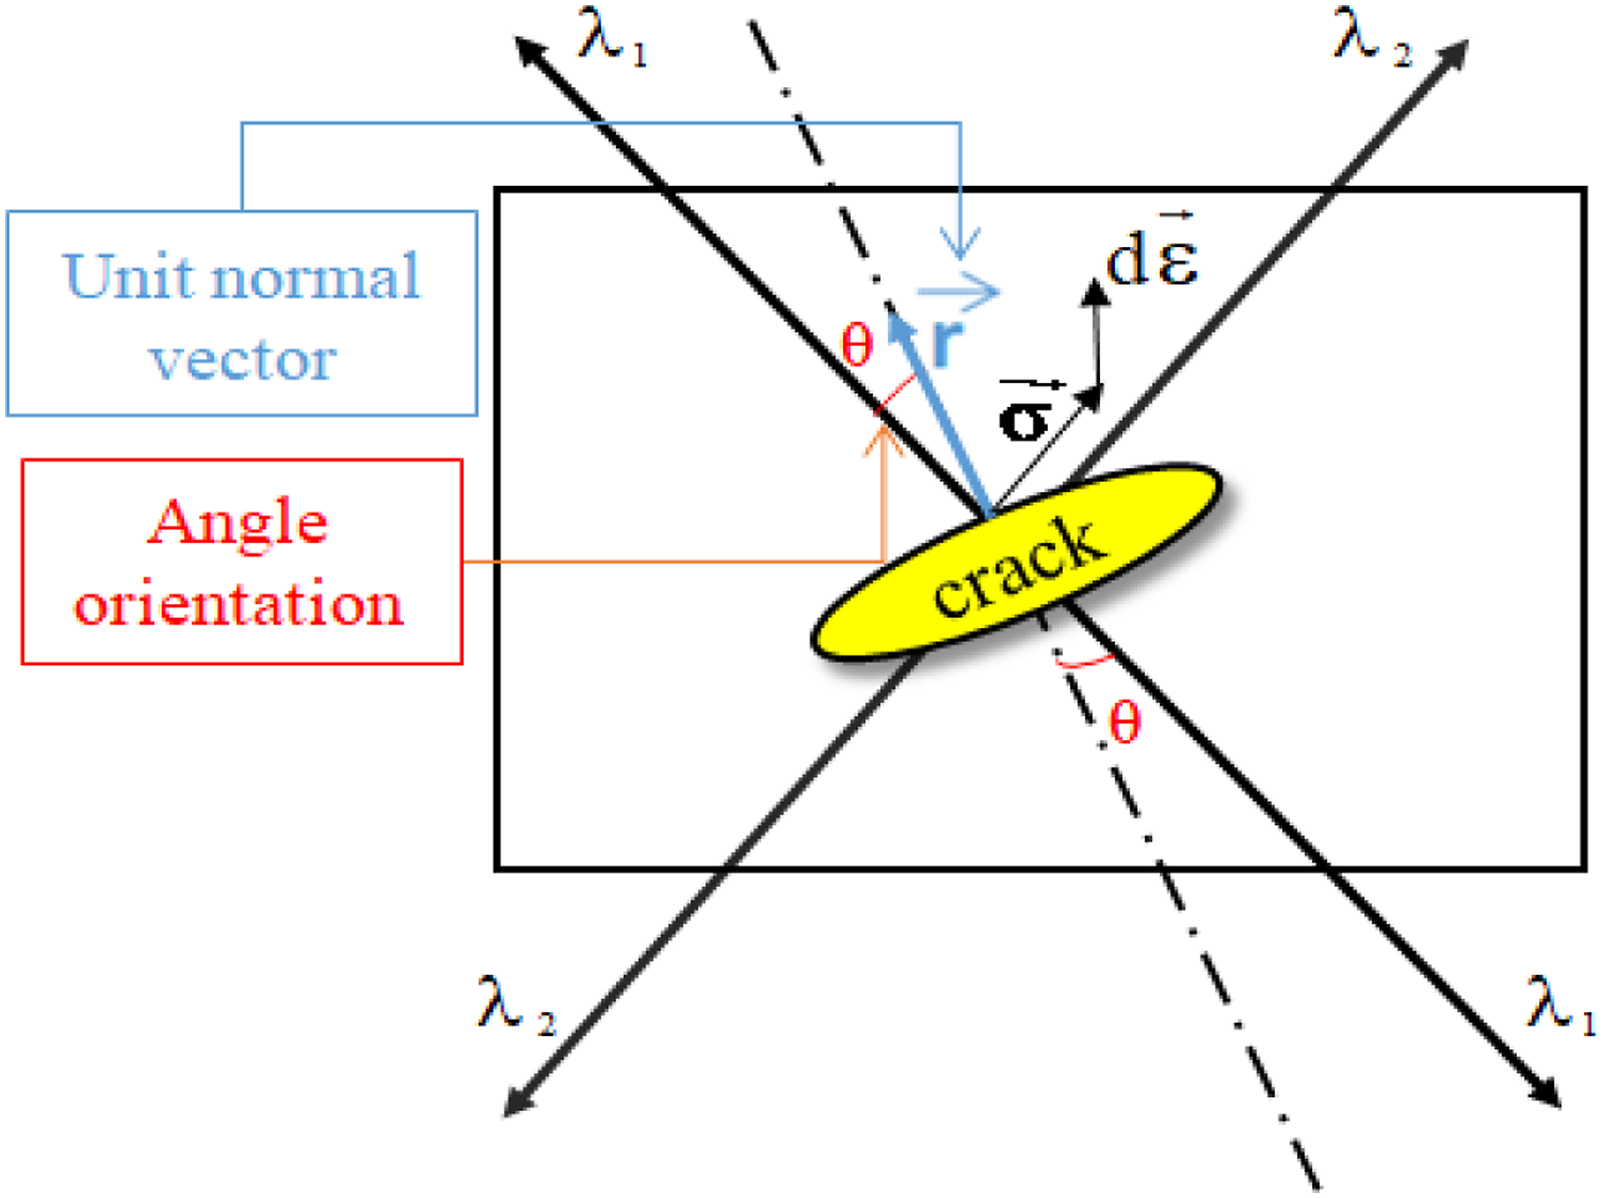

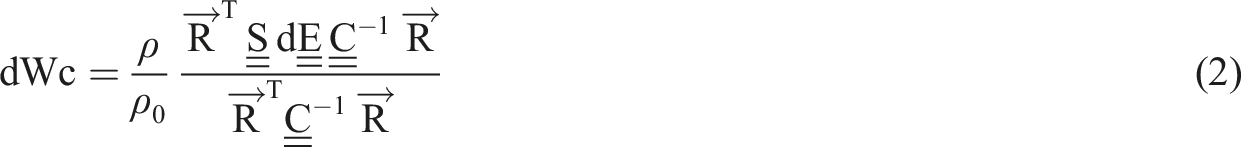
In finite deformation condition, the increment of the CED is obtained according to the following equation:
Monte carlo simulation method
The MCS is regarded as an extremely useful computational device for uncertainty assessment and statistical investigation. This method is generally adopted throughout a broad range of engineering practices to determine the probability affected by multiple uncertainties and multiple random variables.
In order to determine the reliability, considering {X} a vector of random variables in which xi is one of its elements.
The performance function, G, which divides the safety and failure areas, is given as follows (equation (3)):


Depending on the G function value, three cases can be considered:
(i)
By using multiple random sampling events, the MCS approach seeks to simulate a large number of load and resistance values based on their PDF, not necessarily normally distributed. The total number of simulation events is defined as Nmc. For the resulting Nmc value of

Reliability, calculated by dividing up the number of safe events by those of total simulations, is provided by the following formula (equation (6)):

Generating N samples of each entry parameter involves the following steps (i) Mean value of each variable. (ii) Variation coefficient (Cov) of each variable. (iii) Total number of simulation N (in this study (iv) Probability density function (here we suppose a normal distribution).
Finite element analysis
Materials and loading conditions
In this section, we propose to investigate a database documented by Ayoub et al.
24
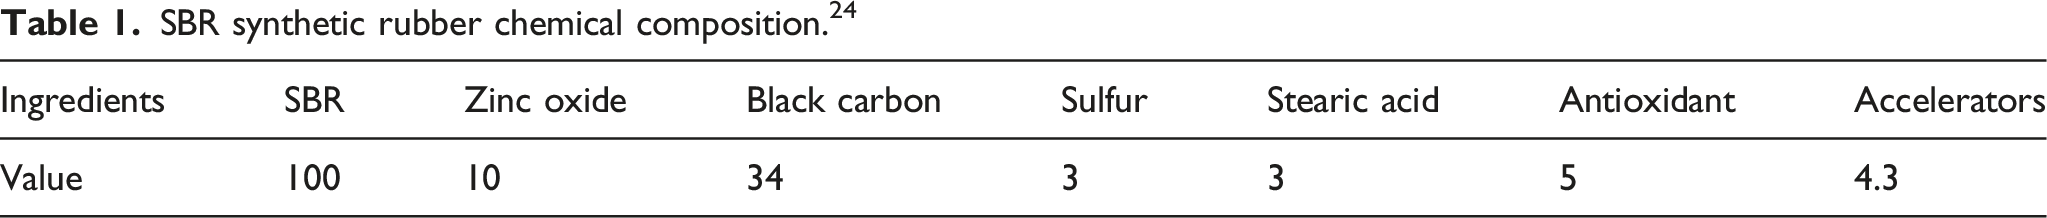
A diabolo specimen (AE42), its shape and its dimensions are presented in Figure 2. The studied material composition is reported in Table 1 and the load conditions are listed in Table 2. Specimen dimensions. SBR synthetic rubber chemical composition.
24
Constant amplitude test parameters and fatigue life results for SBR rubber.
24


Finite element model
For this AE42 specimen, in the reference,
24
, the two-term Ogden model (N = 2) was chosen as the most suitable model that can adequately fit the mechanical response of the investigated material for the tensile-compression and torsion tests, whose corresponding four material parameters are:
The mesh is refined in the central zone of the specimen (stress concentration zone) with the aim to find a better compromise between the quality results and the computing time. 8-node linear brick, incompatible modes, hybrid with linear pressure elements, C3D8IH, are utilized. Therefore, it is not necessary to have a uniform mesh, neither a mesh with the same precision for the entire specimen. In fact, several computations have been carried out to verify the meshing finesse required (to optimize the size of the element). Note that we try to have just a size of element that allows us to have a stable result without weighing down the FE calculations. The boundary conditions applied to the bottom and top surfaces of the specimen are described in Figure 3. The underside of the specimen is totally embedded, while the sinusoidal load, detailed in Table 2, is applied to the reference point on the upper surface along the Y axis. The reference point is linked to the top surface by a kinetic coupling. Meshing, loading and boundary conditions of the Diabolo specimen.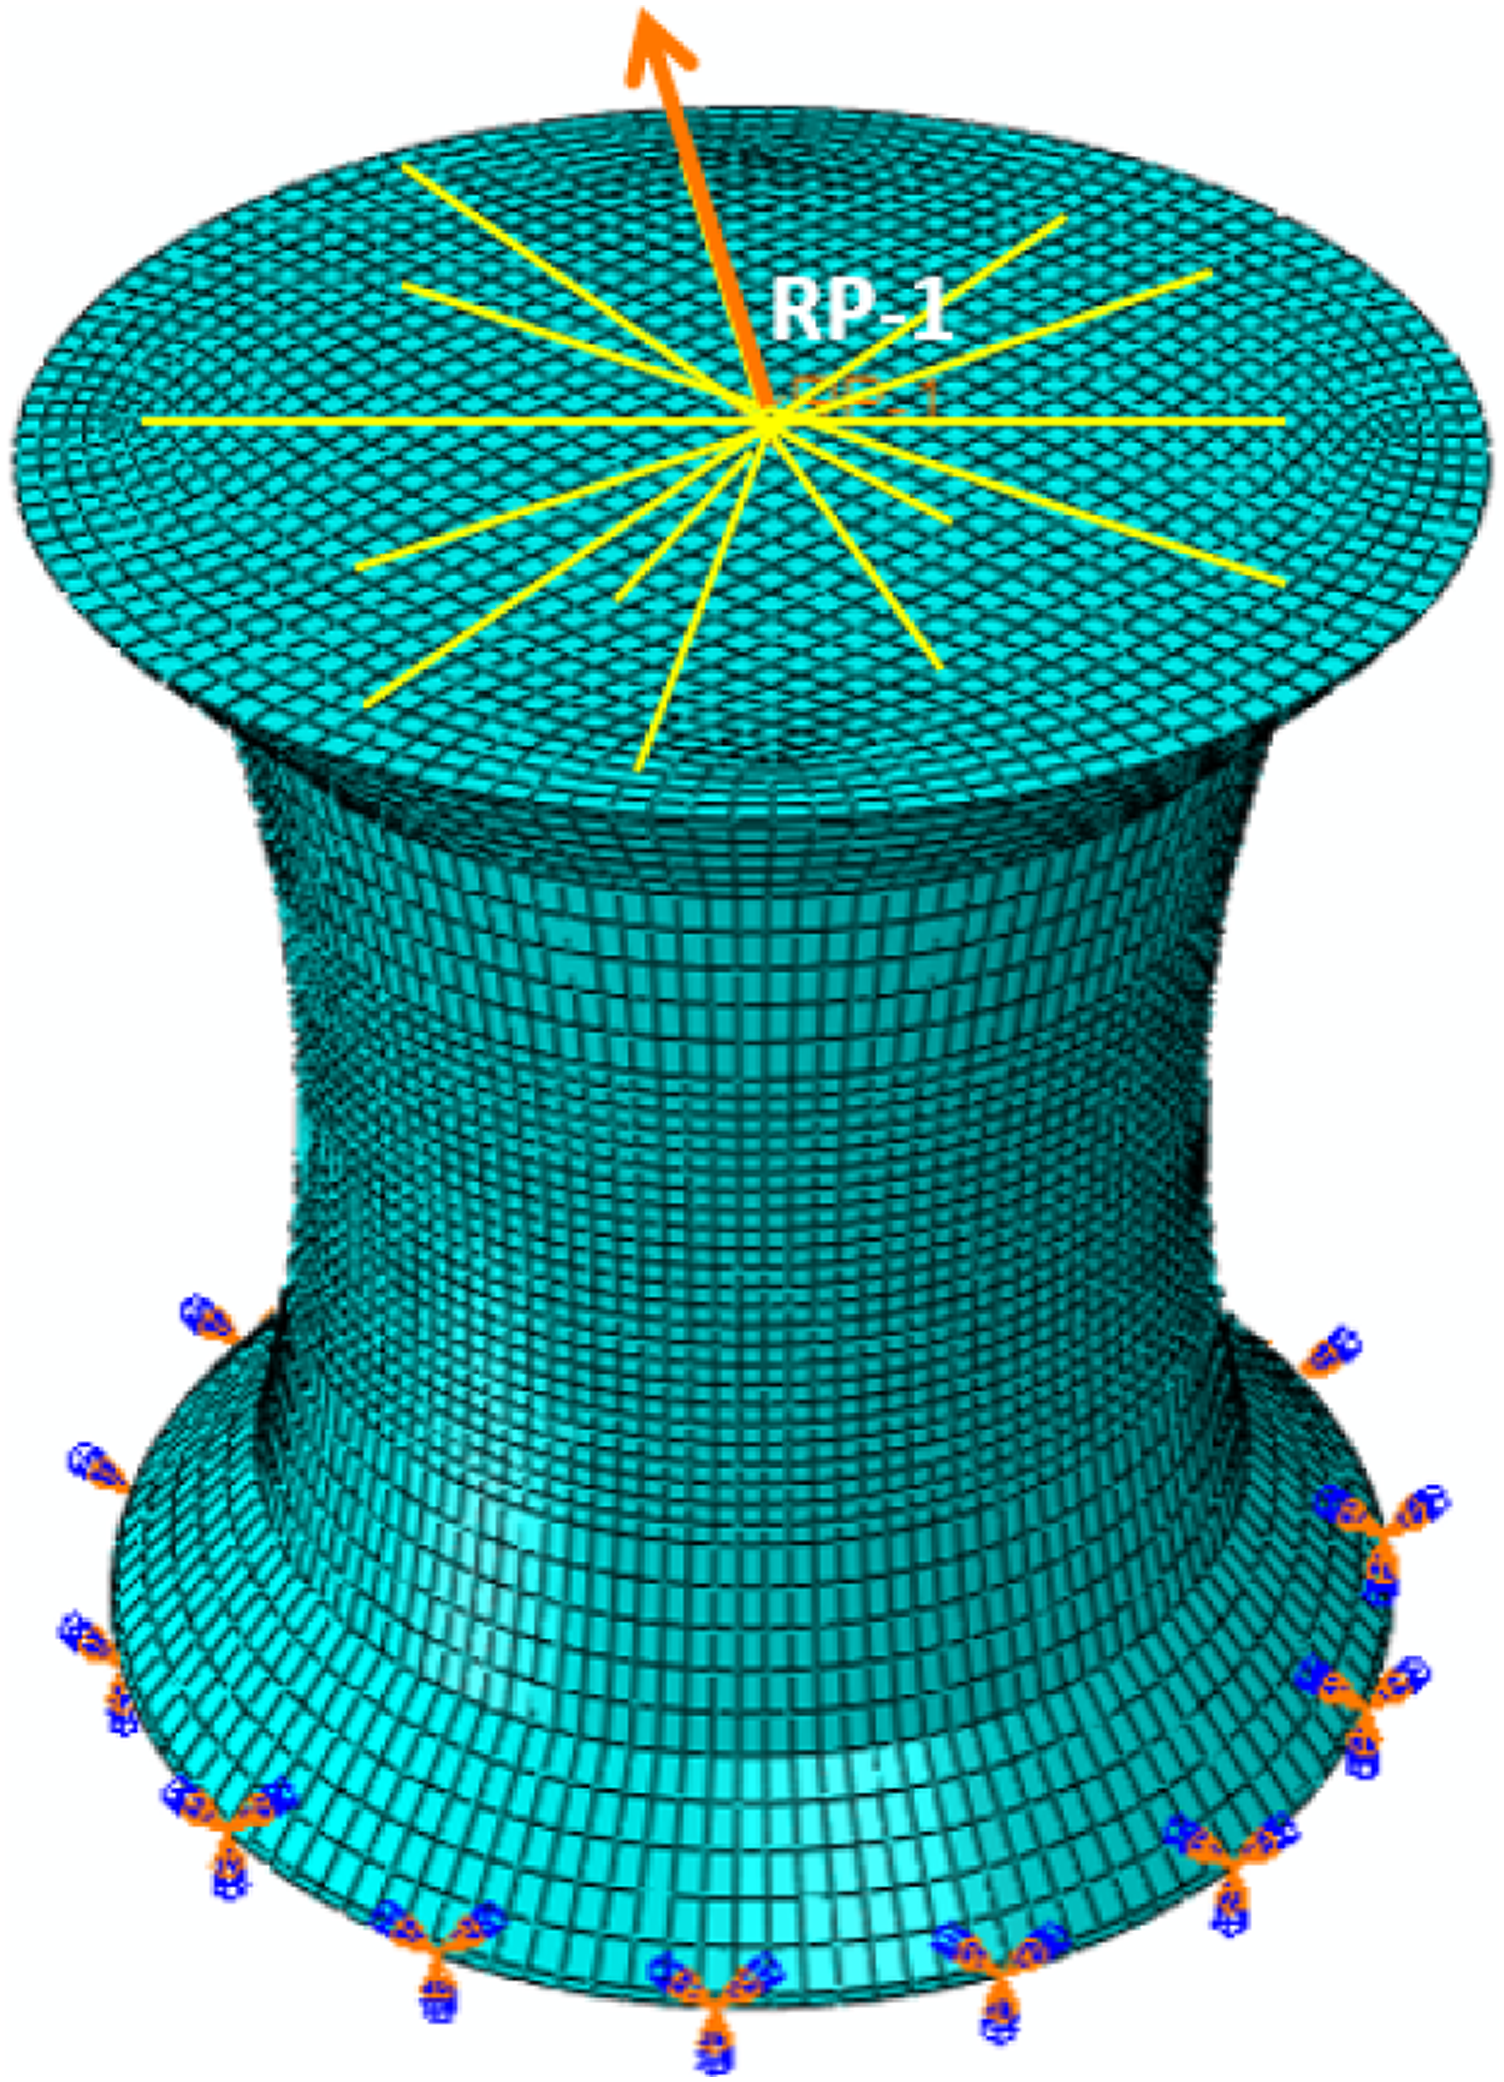
CED determination and fatigue life prediction
Stress as well as strain values cannot be evaluated under complex (multiaxial) loads. Basically, there are two different test methods to produce complex strain and stress states: either a simple load for a complex geometry or a complex load using a simple geometry. Under such condition, a generalized FE model is required. The determination of the cracking energy density is done according to the algorithm in Figure 7.
The first step is to determine the appropriate behavior law of the material under study. Then, after the specimen simulation under the prescribed loading, the strain and stress fields are numerically determined. These quantities measured in the critical part are entered into a MATLAB program as inputs to determine the value of CED.
Figure 4 shows the correlation between the fatigue life time results and the maximum CED criterion. Here, the Wöhler curve is presented in a semi logarithmic scale and defined as follows: Correlation of the fatigue life with the maximum cracking energy density.

Reliability computation
Figure 5 shows simulated strain and stress curves during one loading cycle for each load case shown in Table 2, simulated with ABAQUS software. This cycle is equal to 0.2 s respectively for tensile and tensile-torsion, and equals to 0.33 s for torsion. The magnitude respectively in stress and strain is proportional to the amplitude of the applied loading. Variation over time of logarithmic strain and 2nd Piola Kirchhoff stress for several multiaxial loading cases. (a) variation over time of logarithmic strain for several uniaxial tensile tests (b) variation over time of 2nd Piola Kirchhoff stress for several uniaxial tensile tests. (c) variation over time of logarithmic strain across various twisting cases. (d) variation over time of 2nd Piola Kirchhoff stress across various twisting cases. (e) variation over time of logarithmic strain under various uniaxial-torsion loads. (f) variation over time of 2nd Piola Kirchhoff stress under various uniaxial-torsion loads.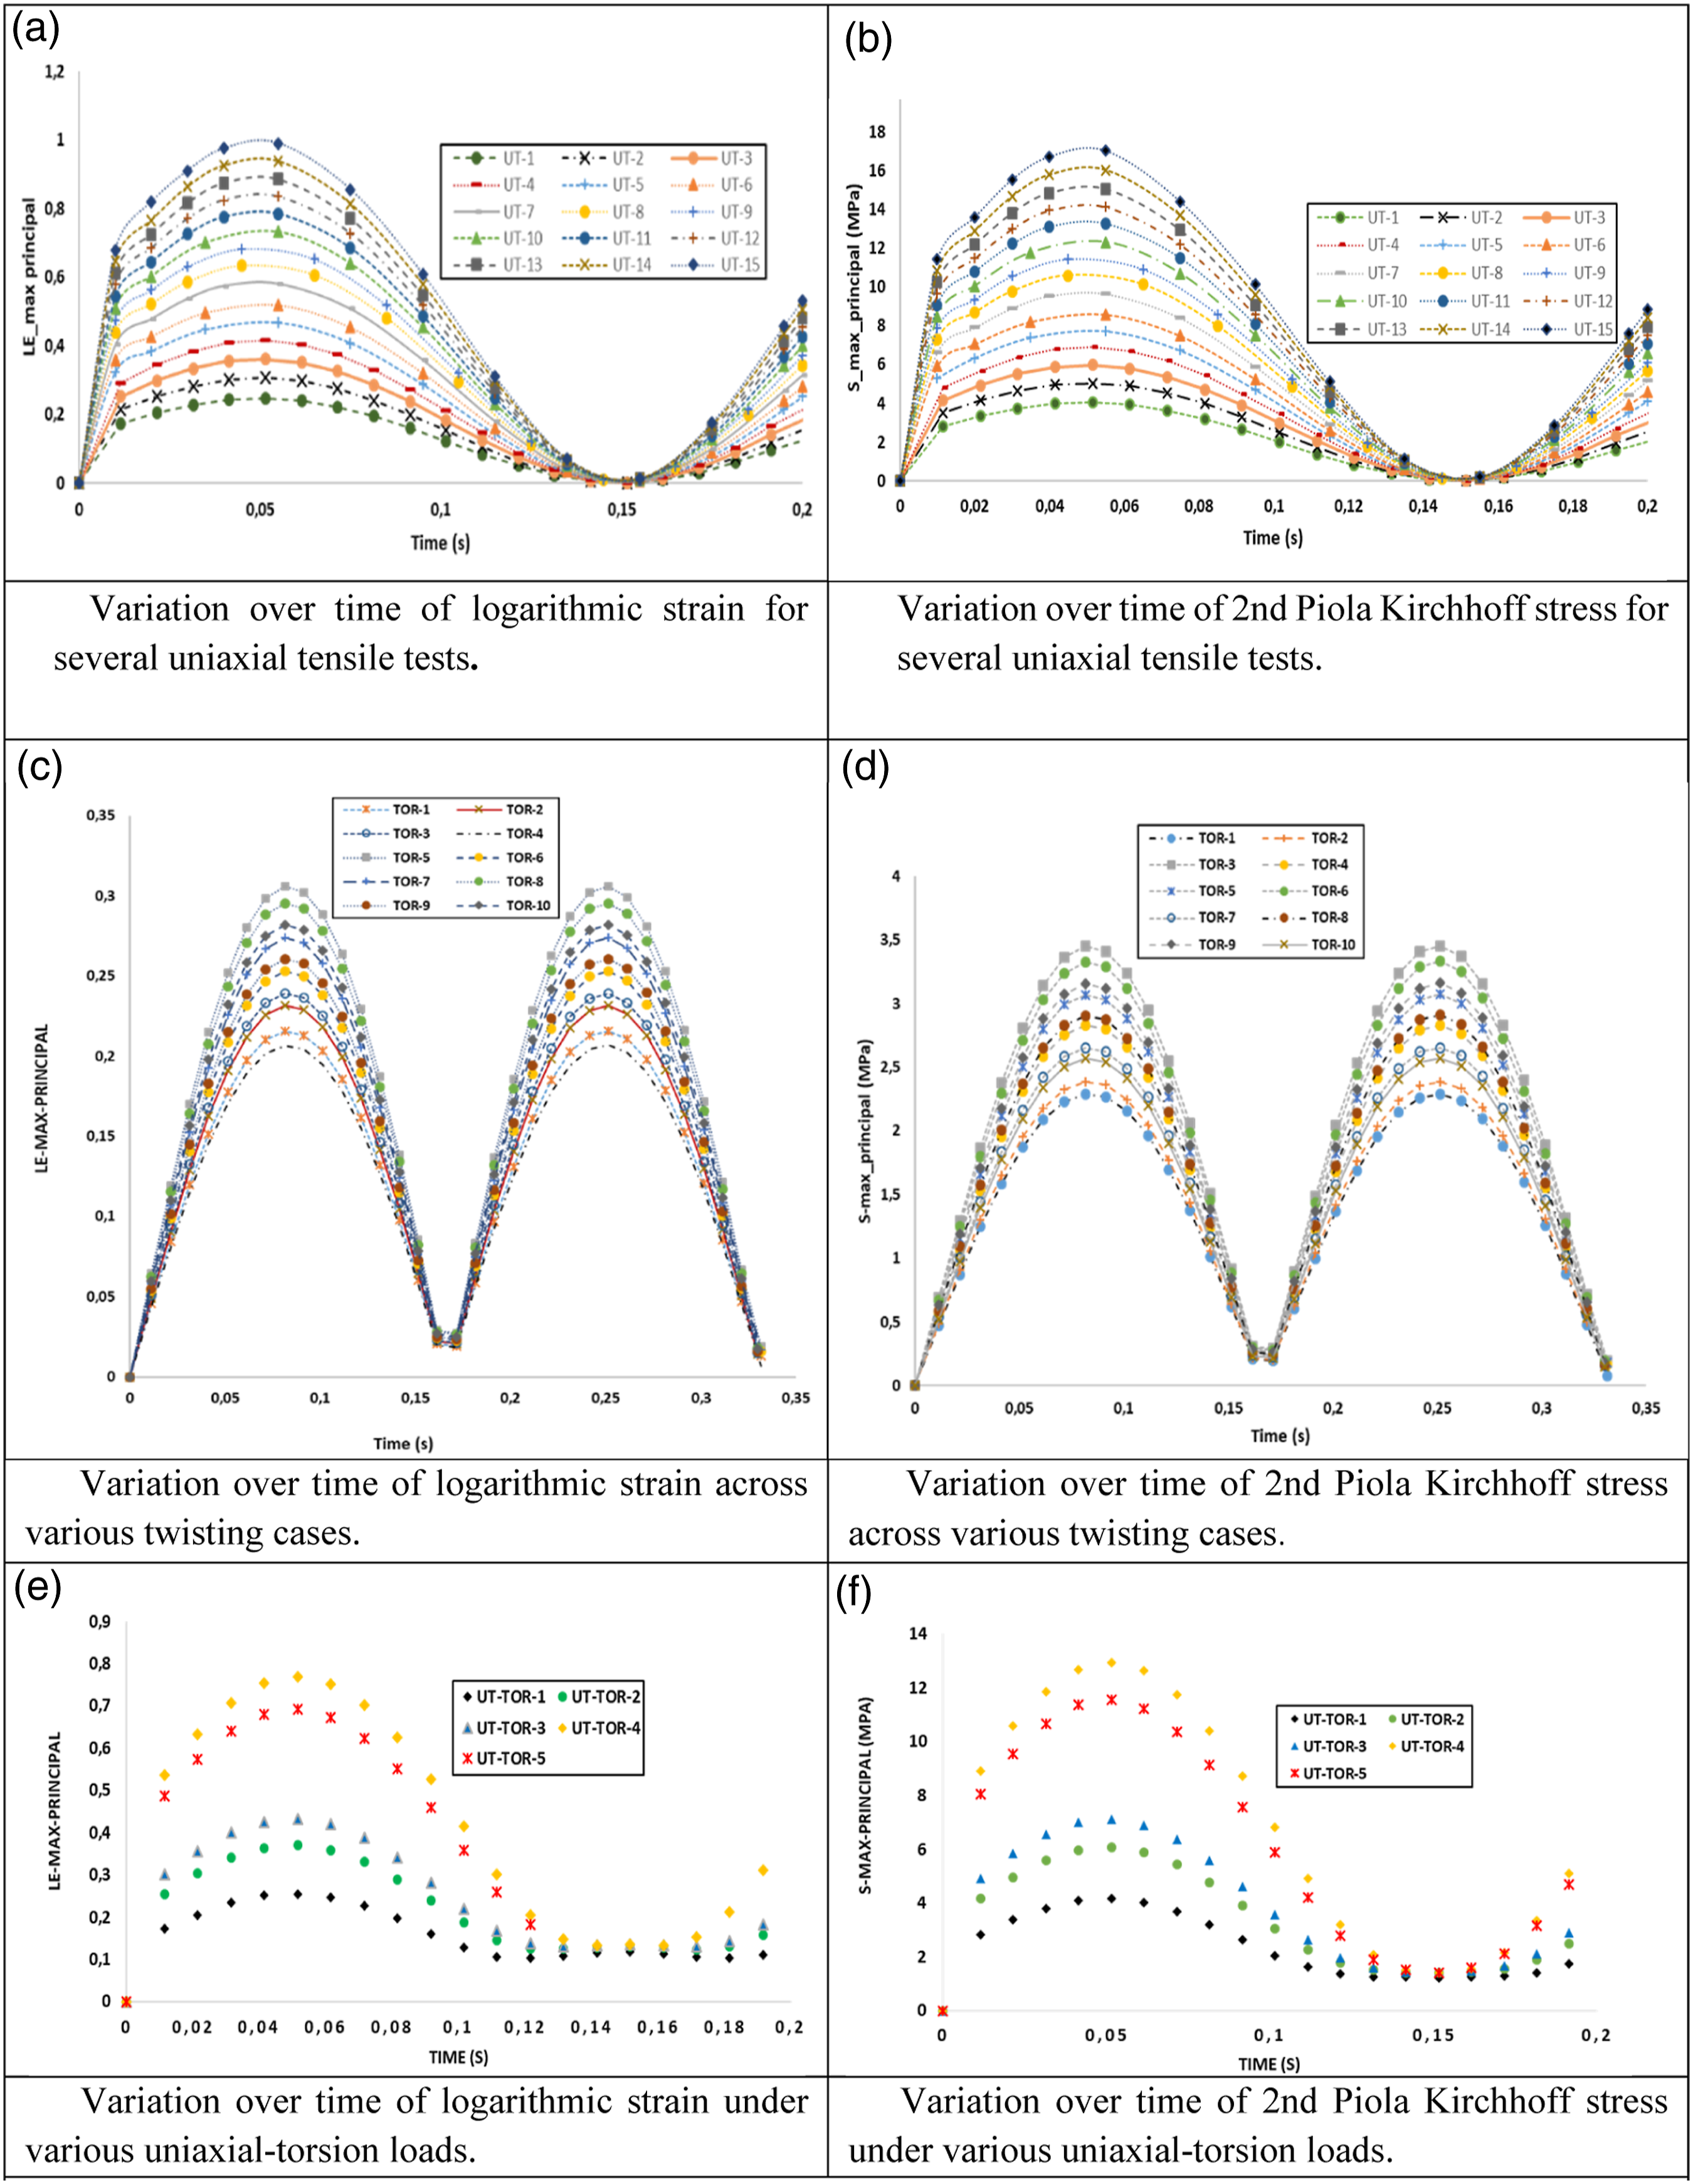
Figure 6 sums up all the ABAQUS simulations generated by the various constant-amplitude load cases, and provides stress-strain behavior of the material in uniaxial, torsional and torsion-tension conditions. Stress-strain response for various load cases.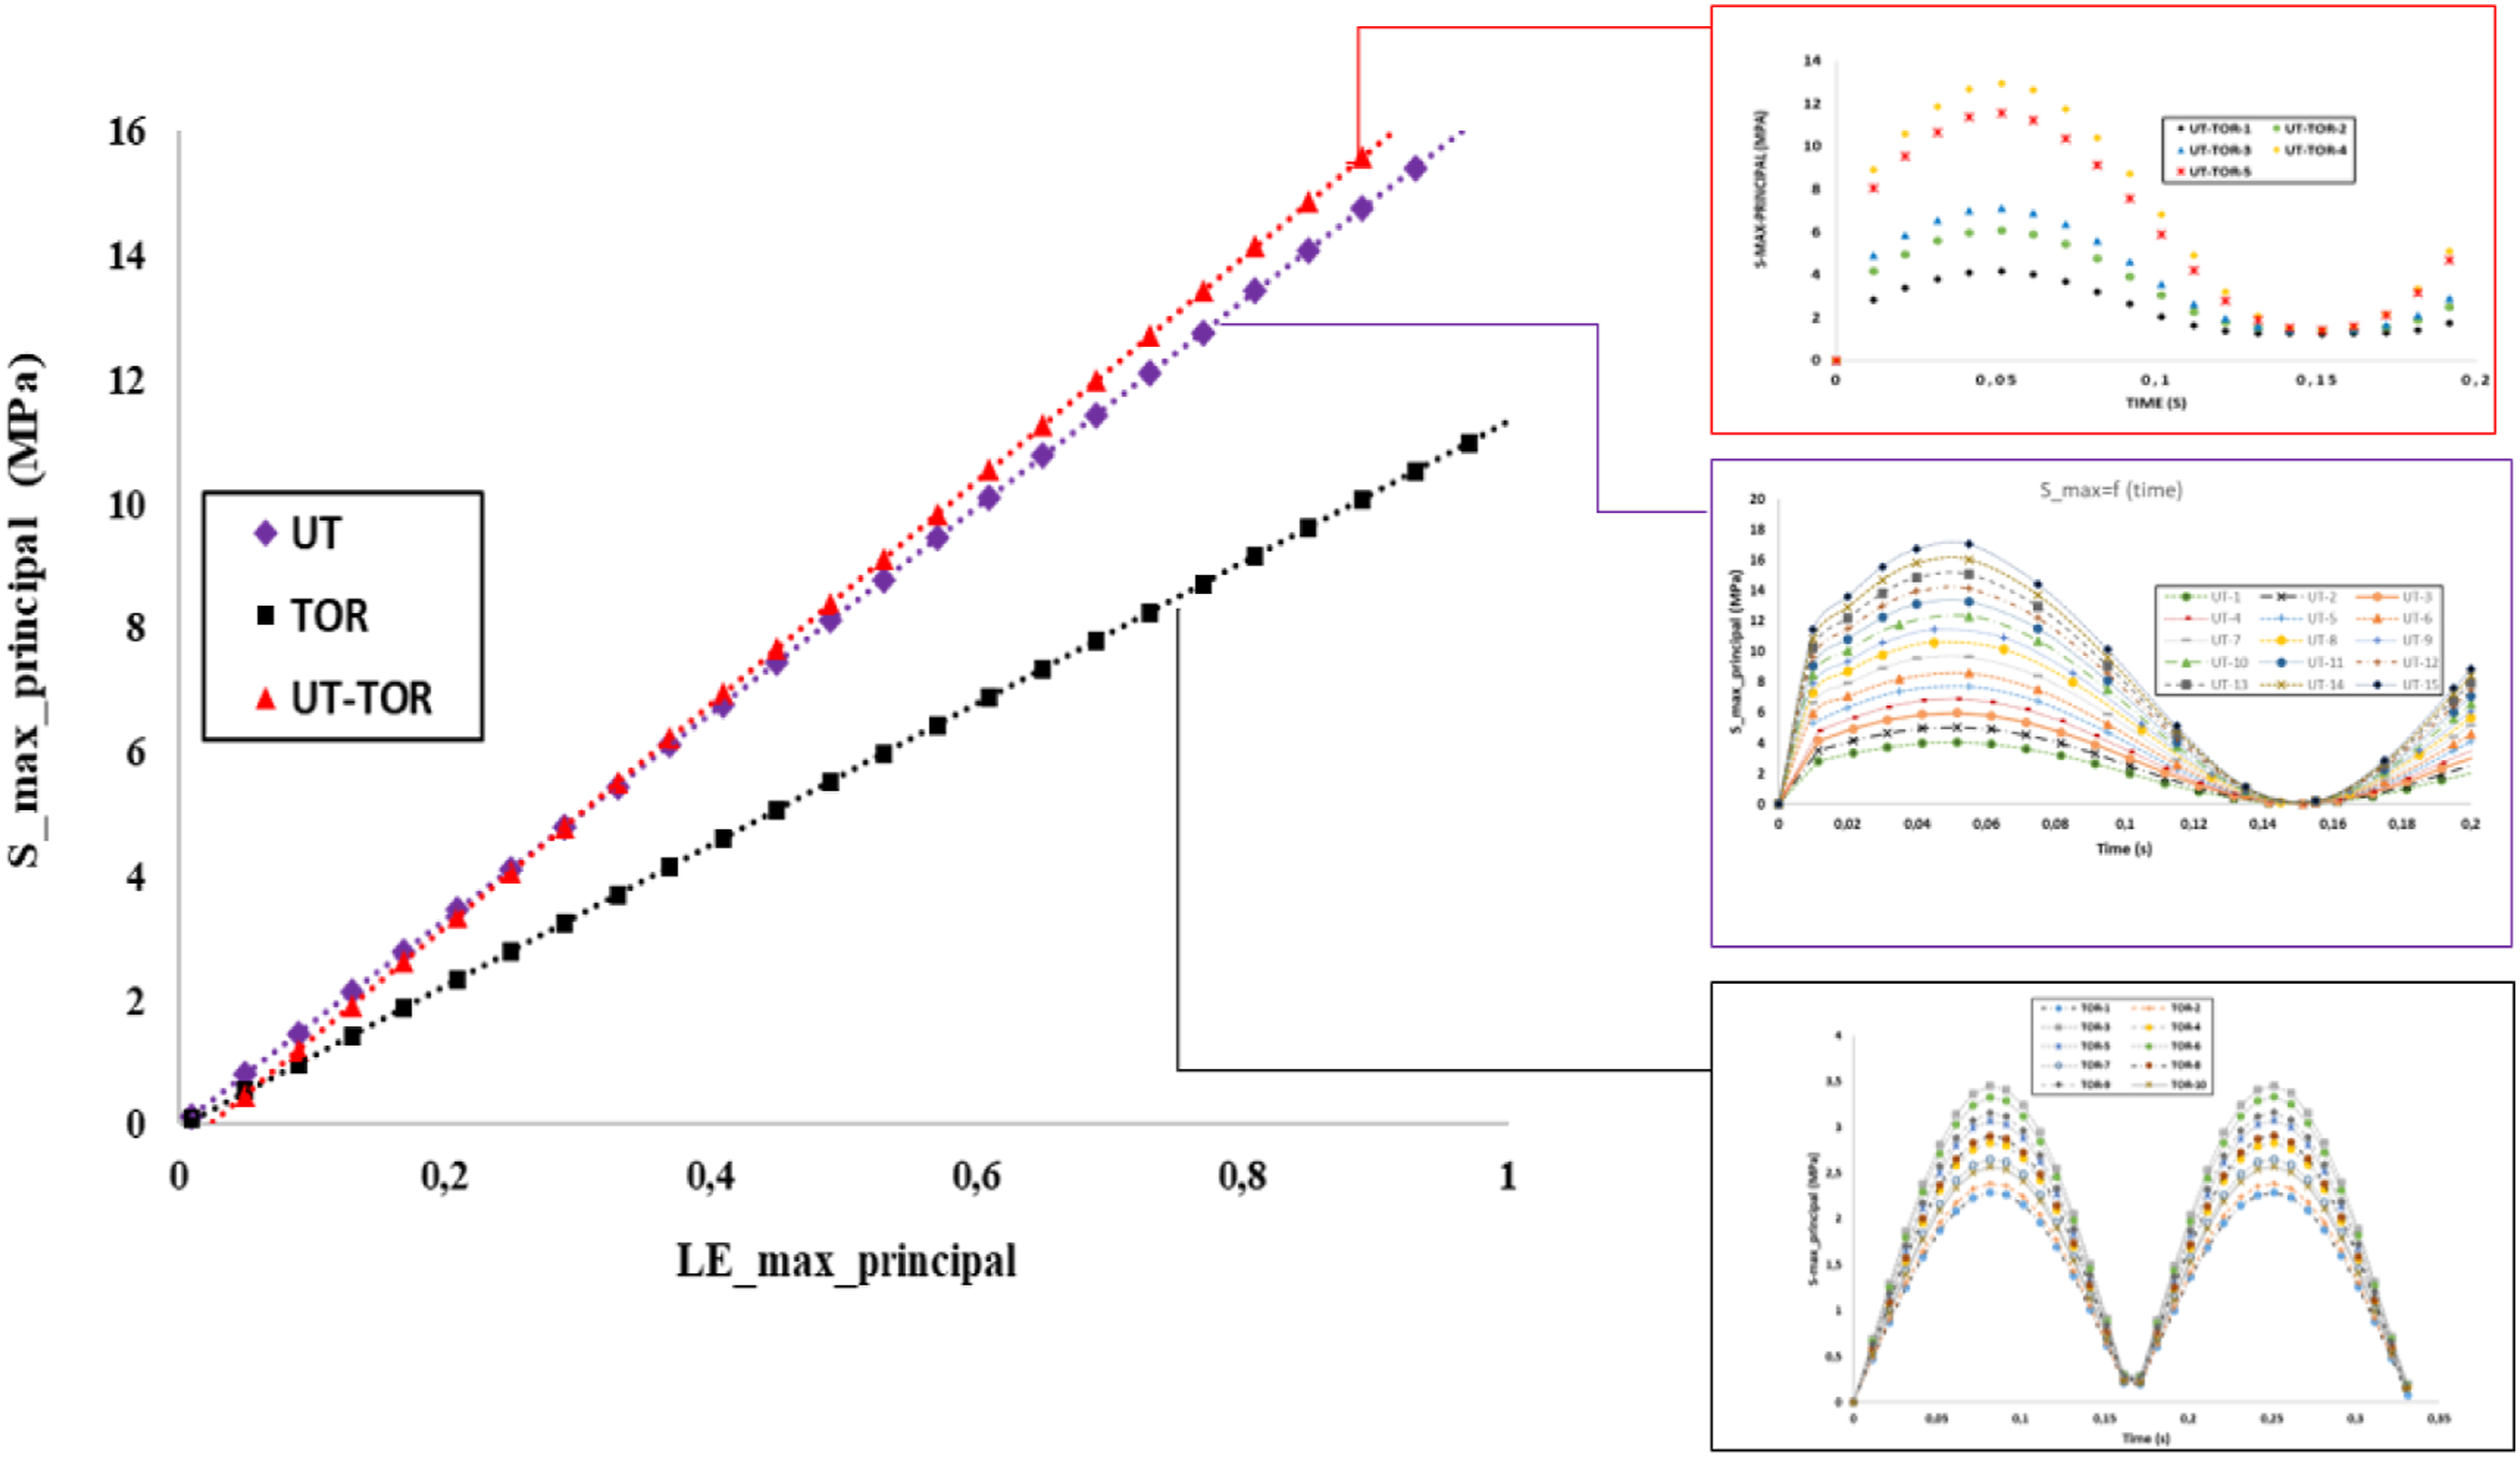
A probabilistic predictive fatigue model of SBR rubber specimen is put forward in this section. This probabilistic model is performed through FE and Monte Carlo simulation methods. The main process flow used for developing that model is summarized as shown on Figure 7. An hyperelastic analysis using the Non Linear Ogden model embedded in ABAQUS is carried out to simulate specimens under prescribed loading and compute strain and stress across critical areas. Flowchart adopted for determining the probabilistic model based on CED criterion.
The CED is then determined using equation (2). However, due to the significant fatigue data scatter, the proposed approach takes into account the material property dispersion, assumed to be normally distributed, with different dispersion levels that can be applied. Finally, the reliability is computed for each material parameter for different case loading using the Monte Carlo simulation (Strength-Load method).
The normal scattering of material parameters leads to the Wöhler curve showing three areas as illustrated in Figure 8: a sure safety area where the reliability R=100% and a sure failure area where R = 0%, separated by a probabilistic failure area. The corresponding areas of a probabilistic Wöhler curve.
Figure 9 depicts reliability against fatigue life for three values of cracking energy density which are respectively, Wc = 2 MPa, 1.5 MPa and 1 MPa. The Coefficients of variation (Cov) of Wöhler's curve are maintained equal to 1% (Cov α = Cov γ = 1%). The corresponding areas of a probabilistic Wöhler curve.
Reliability for a given Wc varies between 0% and 100% and it decreases in function of Nf . For example, for Wc = 2 MPa, for N < 250 cycles, R = 100% and N > 650 cycles, R = 0%, for Wc = 1.5 MPa, N < 1000 cycles, R = 100% and N > 4000 cycles, R = 0% and for Wc = 1 MPa, N < 8000 cycles, R = 100% and N > 100000 cycles.
Figure 10 illustrates how fatigue reliability evolved for a given value of Wc: 2 MPa (Figure 10(a)), 1.5 MPa (Figure 10(b)) and 1 MPa (Figure 10(c)) and for three supposed Cov values (1%, 3% and 5%). Evolution of reliability versus lifetime for several COV values.
It is noted that the variation in Cov values has a remarkable influence on the fatigue results. Owing to these statistical material parameter distributions, the obtained reliability-life curves are very interesting for the engineering applications to predict more efficiently and reliably the improvement of the fatigue life of rubber structures.
Figure 11 shows the iso-probabilistic Wöhler curves obtained for specific reliabilities (1%, 55%, 99%) under tensile, torsional and tension-torsional loads. It is observed that these results agree very well with experimental data.
18
The safety zone is remarkably reduced as the reliability values increase. Iso probabilistic Wöhler curve.
Conclusion
The purpose of the current paper is to suggest a full reliabilistic method for fatigue life prediction of elastomeric materials based on the CED criterion. From this work, it can be concluded that the suggested method enables the reliability calculations by combining the FE analysis with MC simulation methods. Also, the iso-probabilistic Wöhler curves corresponding to 5, 55, and 99% fatigue reliability under diverse loading conditions has been performed. This methodology enables engineers solve the practical problems to predict the fatigue limit more effectively and confidently. Finally, the suggested approach considers the scatter in the experimental fatigue life results by taking into account the dispersion in the Wöhler material parameters.
Footnotes
Declaration of conflicting interests
The author(s) declared no potential conflicts of interest with respect to the research, authorship, and/or publication of this article.
Funding
The author(s) received no financial support for the research, authorship, and/or publication of this article.