
Abstract
Flexible polyurethane foams (FPUFs) are versatile materials used in various applications due to their unique properties. Understanding the phase separation behavior in FPUFs is crucial for tailoring their properties to specific applications. In this study, we investigated FPUFs with varying levels of urea phase connectivity using small-angle X-ray scattering (SAXS), Fourier transform infrared spectroscopy (FTIR), and wide-angle X-ray scattering (WAXS). We explored the effect of water, lithium chloride, and isocyanate structures on the phase separation behavior by employing these methods. An increase in water content in the FPUF formulation resulted in a higher amount of formed urea and larger globular size of urea aggregates. Incorporating LiCl into FPUF formulations demonstrated its ability to prevent hydrogen bond formation, leading to alterations in the urea phase. Moreover, we found that foams prepared with asymmetric diisocyanates showed difficulty in forming the urea phase, while foams prepared with symmetric and aliphatic diisocyanates readily formed the urea phase. Our study sheds light on the morphology of the urea phase, the packaging nature of the hard segment, and the hydrogen bonding behavior of the FPUFs. These findings contribute to a better understanding of phase separation in FPUFs and offer insights into tailoring their properties for specific applications.
Keywords
Introduction
Flexible polyurethane foam (FPUF) is a highly adaptable material that is commonly found in a range of products, such as furniture, bedding, packaging, and automotive components.1,2 The low-density cellular composition of FPUF makes it well-suited for cushioning purposes, and its flexibility allows for diverse applications. The production of FPUF is a continuous process, involving the pouring of a reactive foam chemical mixture onto a moving conveyor.
The synthesis of FPUF depends on managing equilibrium between two key chemical reactions.1–3 The first reaction involves an isocyanate group (-N=C=O) reacting with water (H2O) to generate an amine functionality (-NH2) and carbon dioxide (CO2). The amine that is produced then interacts with a second isocyanate group, forming urea hard segments (-NH-CO-NH-). The CO2 produced in this process plays a crucial role in expanding the bubbles in the reacting mixture, leading to foam cell formation. The second reaction occurs when an isocyanate group (-N=C=O) reacts with a hydroxyl group (-OH) derived from a polyol, resulting in the formation of a urethane bond (-O-CO-NH-).
A crucial aspect of FPUFs is microphase separation, 4 has a major impact a unique morphology that significantly affects the material's overall characteristics such as Young’s modulus 5 and compression. 6 This separation is a result of the incompatible nature of the soft segments (SS) derived from aliphatic polyethers and the hard segments (HS) from aromatic isocyanates.7,8 As the urea hard segment concentration exceeds a specific solubility threshold, urea microdomains form. These microdomains maintain their adhesive strength through potent interactions of hydrogen bonds and contribute to the foam’s rigidity by acting as physical interlinking sites and providing a stabilizing effect. 9
Several studies have utilized small-angle X-ray scattering (SAXS) to investigate phase separation in polyurethane foams.10–13 Researchers found that during the formation of flexible polyurethane foam, urea hard segments undergo microphase separation, leading to the formation of microdomains with spacings of approximately 5–10 nm. 10 Additionally, in formulations with higher water content, urea aggregates were identified using transmission electron microscopy (TEM) 10 and X-ray microscopy (XRM), 14 with their sizes estimated to be around 0.3 µm; this observation was also supported by the research conducted by Neef et al. 15 These aggregates, referred to as “urea balls,” bear resemblance to hard segment globules found in previous studies on block-segmented polyurethanes.16,17 Hydrogen bonding interactions between these microdomains and urea aggregates were examined using FTIR analysis to evaluate the degree of microphase separation,18–22 especially bidentate urea, with an infrared absorbance band at approximately 1640 cm−1. 23
Based on the evidence from studies,7,9,24–26 it has been observed that the incorporation of Lithium Chloride (LiCl) into polyurethane foams and plaques results in a systematic decrease in urea aggregation, modifications in phase-separated morphologies, and the disruption of hydrogen bonding within the hard domains. These changes significantly influence the urea phase connectivity, as well as the mechanical and viscoelastic properties of the materials. The interaction between LiCl and urea hard segments has been shown to contribute to the development of softer, flexible polyurethane foams without the need for environmentally damaging physical blowing agents. Moreover, LiCl has been employed as a molecular probe, improving our comprehension of how hydrogen bonding influences the extensive interconnectivity and distribution of hard domains within the soft polyether matrix.
A study by Aneja et al. 8 explored the morphology of three foam types, which were based on different proportions of 2.4–2.6 toluene diisocyanate (TDI). The results of the study suggested that an increased presence of symmetric 2,6 TDI isomer led to higher hydrogen bonding levels within the hard segments, as evidenced by FTIR spectroscopy. Furthermore, SAXS analysis revealed that all the investigated foams displayed microphase separation while maintaining consistent interdomain spacings. The research also emphasized the critical role of urea phase interconnections at the micron scale in determining the mechanical properties of foams. Enhanced intersegmental connectivity and urea aggregate connectivity were found to contribute to a higher rubbery modulus in the foam composed of a 65:35 TDI isomer mixture.
Baghban et al. conducted a series of interrelated studies focusing on understanding various aspects of FPUFs and their soundproofing behavior. The effect of different synthesized linear saturated aliphatic polyesters (LSAPs) on micro-phase separation and acoustic damping behavior was examined, revealing that FPUFs prepared with nonpolar LSAPs exhibited higher micro-phase separation, leading to improved sound absorption efficiency. 27 Additionally, The impact of the isocyanate index and water content on micro-phase separation within FPUFs was explored, revealing that increasing the isocyanate index and water content led to higher micro-phase separation, resulting in improved sound absorption coefficient (α) and sound absorption performance (Υ) within the frequency range of 1500–4000 Hz. 28 Furthermore, the influence of various chain extenders on micro-phase separation and acoustic damping properties was investigated, demonstrating that FPUFs containing amine-rich chain extenders exhibited increased micro-phase separation and enhanced sound absorption efficiency. 29 Lastly, the relationship between the acoustic damping behavior of FPUFs and their fractal dimension (Df) was investigated, showing that an increase in the fractal dimension significantly enhanced the overall sound absorption efficiency of the FPUFs. 30
This study aims to compare the morphologies of FPUFs produced using different systems. To examine the impact of key factors on the FPUFs morphologies, we first systematically varied the water content during the foam synthesis process. Water is known to act as a urea producer in FPUF reactions, and altering its amount can significantly influence the formation of urea domains, subsequently affecting the overall morphology of the FPUFs. Additionally, we incorporated LiCl into specific foam formulations as a disrupting agent, which can destabilize the hydrogen bond in urea domains. By investigating the impact of hydrogen bonding on the foam's morphology and phase separation, we gain valuable insights into the role of intermolecular interactions within the FPUFs. Furthermore, we prepared foams using distinct isocyanates, including 2,4 TDI as an asymmetric isocyanate, pPDI as a symmetric isocyanate, and HDI as an aliphatic isocyanate. This deliberate choice enables us to explore and compare the influence of different molecular structures on the morphology and phase separation behavior of the FPUFs. Using a combination of characterization techniques, including SAXS, FTIR, and WAXS, our objective is to conduct a comprehensive analysis of the microstructure and chemical bonding present within the FPUFs. This thorough investigation will significantly contribute to a deeper understanding of polyurethane foam chemistry and open avenues for developing customized foam formulations with enhanced properties.
Experimental
Materials
Formulations used for the preparation of foams with various quantities of water and various types of isocyanates.


Chemical structure of diisocyanates used.
Formulations used for the preparation of foams with LiCl.

Process
The production of foams at room temperature was conducted using a specific process. Firstly, the polyol was mechanically agitated with water, silicone, catalyst, and stannous octoate at 2000 r/min for 2 minutes. Then, diisocyanate was added to the polyol mixture and stirred for about 20 s. Finally, the mixture was immediately poured into a mold, where it expanded. For foams incorporating lithium chloride, the salts were dissolved in water and added to the polyol, followed by mechanical agitation of the mixture for 1 minute, and then the same procedure described above was followed.
Characterization
Fourier transform infrared analysis
FTIR Spectroscopy was utilized to analyze the behavior of the urethane-urea region of the materials studied. A Bruker model Vertex 70 Fourier Transform Infrared Spectrophotometer was employed. The spectra were obtained by accumulating 16 scans with a resolution of 4 cm−1 over a wavelength range of 400 to 4000 cm−1, employing the Attenuated Total Reflectance (ATR) mode.
Small angle X-ray analysis
SAXS was employed to evaluate the phase separation behavior of the examined foams. The X-ray source was Bruker D8 advance equipped with a monochromatic Cu-Kα source, wavelength λ = 1.54 Å, operating at a voltage of 40 kV and a filament current of 20 mA. The samples used in this test are prepared by pressing the foams after the foaming process is complete to make a film with a thickness of ca. 2 mm.
The SAXS profiles of the foams are presented with the log [I(q)] is plotted as a function of the scattering vector “q” equation (1) and the Kratky plot “I(q) × q2 versus q”. The characteristic length is represented by “D” equation (2).

Though SAXS does not directly describe the morphology of the material, however it does provide information about the structure from a range of scales from ∼20 Å (q ∼ 0.3 Å−1) and 628 Å (q ∼ 0.01 Å−1) obtained from the scattering curve. 31 In this investigation, the focus is on two distinct sections of the scattering curve, the low region (q < 0.02 Å−1) was used to evaluate the urea aggregates using the Kratky plot (q2I vs q), which provides a qualitative assessment of the degree of flexibility of the tested foam. 32 The second region (0.02 Å−1 < q < 0.08 Å−1) is used to study the inter-microdomain spacing, which is typically in the range of 80–120 Å.10,15
Wide-angle X-ray analysis
In order to explore the crystalline state of hard segments, WAXD was employed using a Panalytical X'Pert Pro X-ray diffractometer equipped with a monochromatic Cu-Kα source, a wavelength of λ = 1.54 Å, a voltage of 40 kV and a filament current of 40 mA. The samples examined in this experiment were prepared by pressing the foams after the foaming process was completed to make a film with a thickness of ca. 2 mm.
Additionally, we employed SAXS to examine the effects of water, LiCl, and diisocyanates structure on urea aggregation and to evaluate microphase separation behavior. A log I(q) versus q plot was used to investigate the average spacing between microdomains. A Kratky plot (q2I vs q) was utilized to measure the flexibility of a polymer chain and its consistency with the Gaussian chain model 32 in the region (q < 0.02 Å−1). Examining the shape of the Kratky plot can provide information about the form of the urea aggregates.32–34 FTIR and WAXS are two complementary techniques employed to gain insight into the structure and ordering of the hard segments within FPUFs. The FTIR method has been found successful in determining the level of hydrogen bonding in these materials. WAXS studies have indicated that FPUFs are an amorphous material; however, a distinct diffraction peak at approximately 4.7 Å has been observed. 35 It is generally assumed that this peak is caused by the organization of urea hard domains or aggregates, 36 yet the exact source of this reflection is still not fully understood.
Results and discussions
Water effect
Figure 2 shows the SAXS scattering and Kratky plot profiles of the foams with different water contents (F2.0, F3.6, and F7.0). In the lower region of the Kratky plot (q < 0.02 Å−1), all three foams exhibit parabolic Kratky curves, indicating the presence of globular urea aggregates. It is important to note that the order of the properties probed in the Kratky plot is not determined by the intensity of the curve, rather by the position of the maximum. In this context, the position of the maximum indicates the degree of urea aggregation, with F7.0 showing the highest degree of aggregation, followed by F3.6, and F2.0 exhibiting the lowest level of urea aggregates. The second region of the scattering intensity plots (0.02 Å−1 < q < 0.08 Å−1) shows that the scattering intensities decrease as the water content increases. This could be explained by the fact that F7.0 contains more hard segments, which could lead to a reduction in the spacing between urea microdomains compared to F2.0 and F3.6, due to their greater amount in the polyol matrix. By examining the curves of the inter-microdomain spacing in F2.0 and F3.6, the spacing in F2.0 is about 105 Å, while it is 93 Å in F3.6, indicating that the urea microdomains in F2.0 are farther apart than in F3.6. The flatness of the F7.0 curve observed suggests that the urea microdomains are densely packed and have minimal interstitial space. This implies that the urea microdomains are closely associated, forming a compact, tight structure. Experimental SAXS curves (a) scattering curves for F2.0, F3.6 and F7.0 (b) Kratky plot curves for F2.0, F3.6 and F7.0.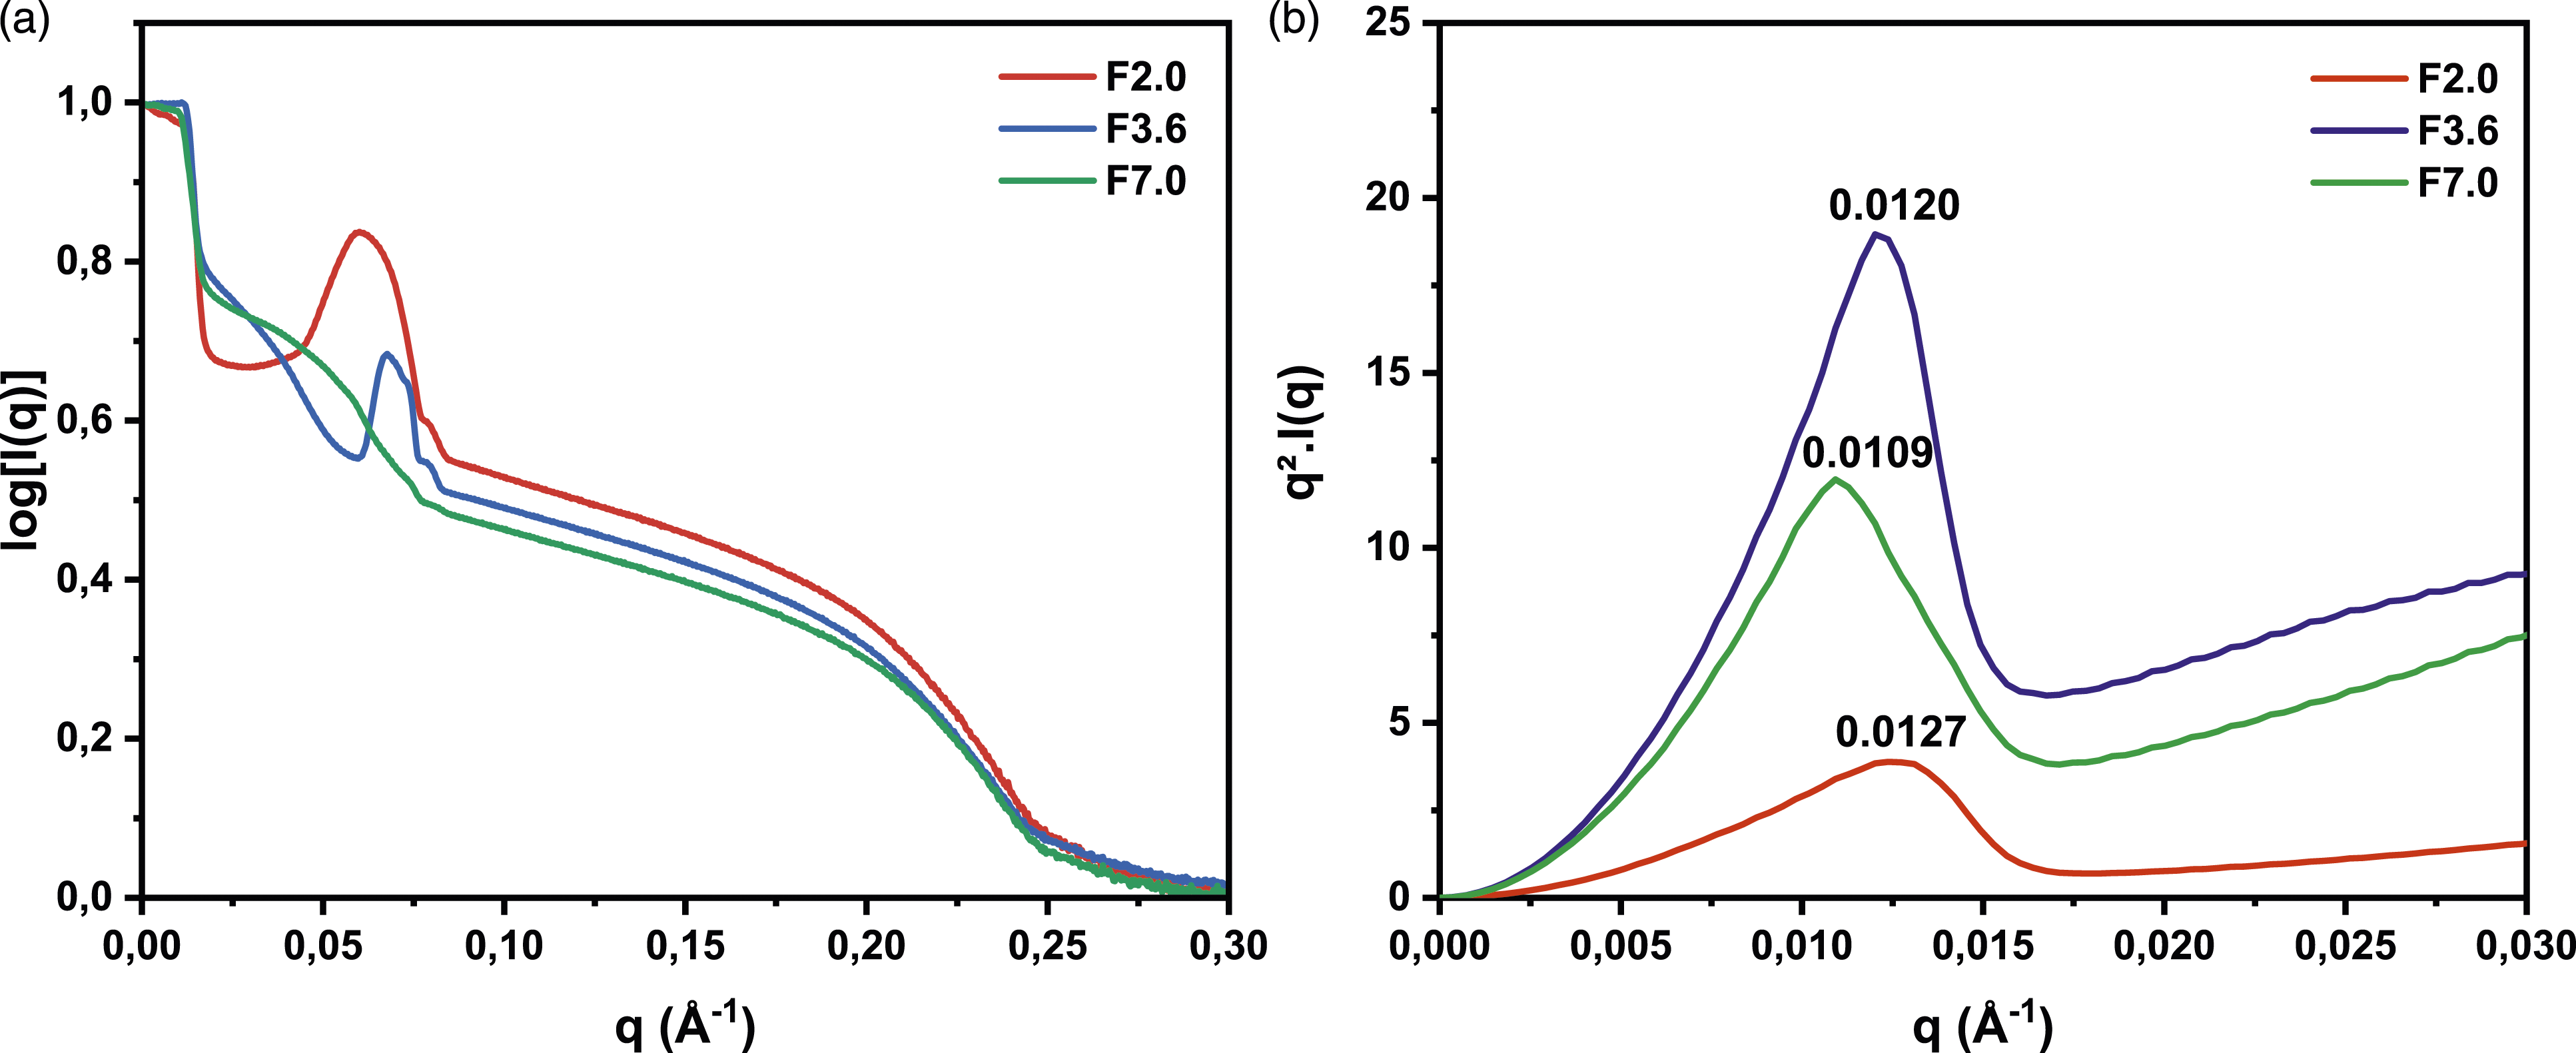
As previously mentioned, FTIR spectroscopy serves as a valuable tool for investigating the chemical structures of flexible polyurethane foams. The carbonyl region of FTIR spectroscopy is particularly important for examining the extent of phase separation in these foams, especially in relation to urea groups such as free urea, monodentate urea, and bidentate urea.19,20,26 Figure 3 displays the normalized FTIR spectra expanded to include the carbonyl regions of urethane and urea for F0.0, F2.0, F3.6, and F7.0. Variations in water content result in noticeable changes in the order of urea segments, ultimately determining the degree of microphase separation. Based on the results for the four foams, as water content increases at a TDI index of 100, the peak intensities corresponding to free, monodentate, and bidentate urea groups exhibit a significant increase. F7.0 demonstrates the highest peak intensities for all urea groups, which explains the reduction in urea microdomain spacing (as mentioned in the SAXS analysis) due to the presence of hard segments dispersed within the polyol matrix. FTIR spectra for F0.0, F2.0, F3.6 and F7.0.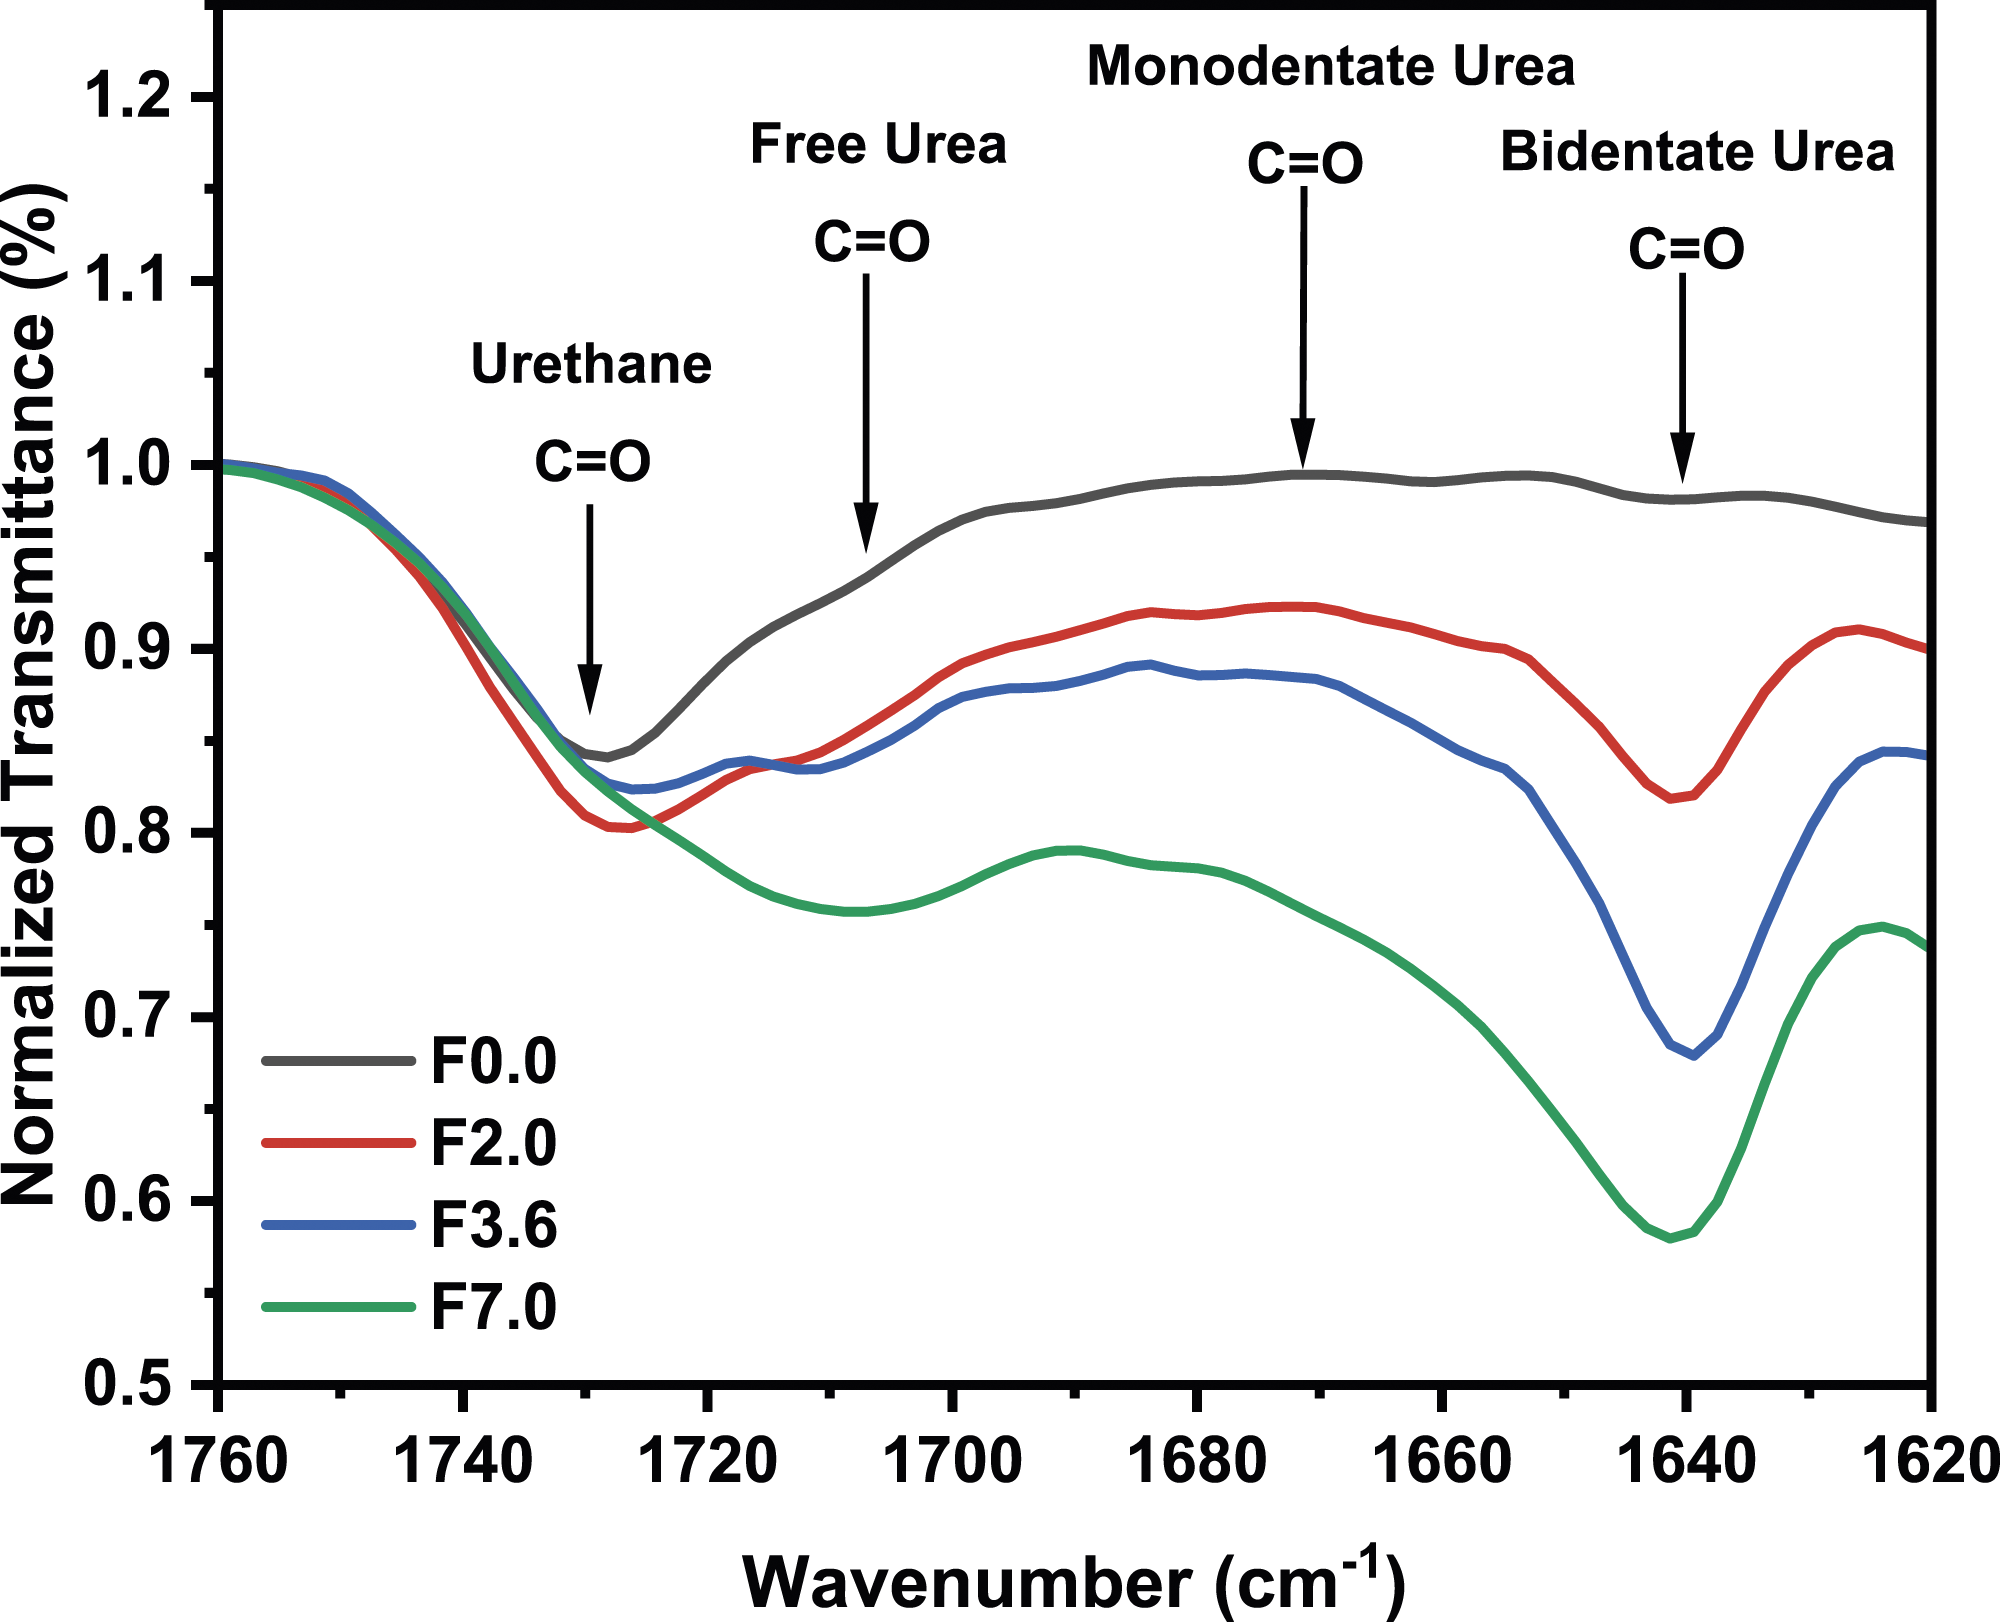
WAXS profiles for the foams F0.0, F3.6, and F7.0 are displayed in Figure 4. Each sample exhibits a diffraction peak that corresponds to a spacing of approximately 4.4 Å. F3.6 and F7.0 both present an additional peak at 5.5 Å. Furthermore, the peaks become sharper as the content of the hard segment in the system grows. The amorphous region observed in all foams may result from the random distribution of hard segments, and the peak that appears at 5.5 Å represents a relative increase in the order of hard segments.
10
WAXS scattering for F0.0, F3.6 and F7.0.
Lithium chloride effect
In Figure 5, the SAXS scattering and Kratky plot profiles compare the F3.6 foam to the LiCl-containing foams F3.6-LC1.0, F3.6-LC2.0, and F3.6-LC3.0. The Kratky plot profiles in the lower region (q < 0.02 Å−1) show that all foams have parabolic Kratky curves, except for the F3.6-LC3.0 foam. Examining the Kratky profiles of the foams containing LiCl, it can be seen that F3.6-LC1.0 and F3.6-LC2.0 resulted in a systematic decrease of the globular size of the urea aggregates. However, it is suggested that the shape of the urea aggregates in F3.6-LC3.0 has changed, becoming more rod-shaped than globular. This phenomenon was explained by the ability of LiCl to alter the micro-connectivity between hard segments.
7
In the second region (0.02 Å−1 < q < 0.08 Å−1), the SAXS profiles of F3.6-LC1.0 and F3.6-LC2.0 show a partial disappearance of the urea microdomains spacing, supposedly due to the dispersion of the altered hard segment in the polyol matrix. In contrast, F3.6-LC3.0 displays the presence of large peak representing the spacing of urea microdomains that are thought to result from the dissociation of urea microdomains from urea aggregates. Experimental SAXS curves (a) scattering curves for F3.6, F3.6-LC1.0, F3.6-LC2.0 and F3.6-LC3.0 (b) Kratky plot curves for F3.6, F3.6-LC1.0, F3.6-LC2.0 and F3.6-LC3.0.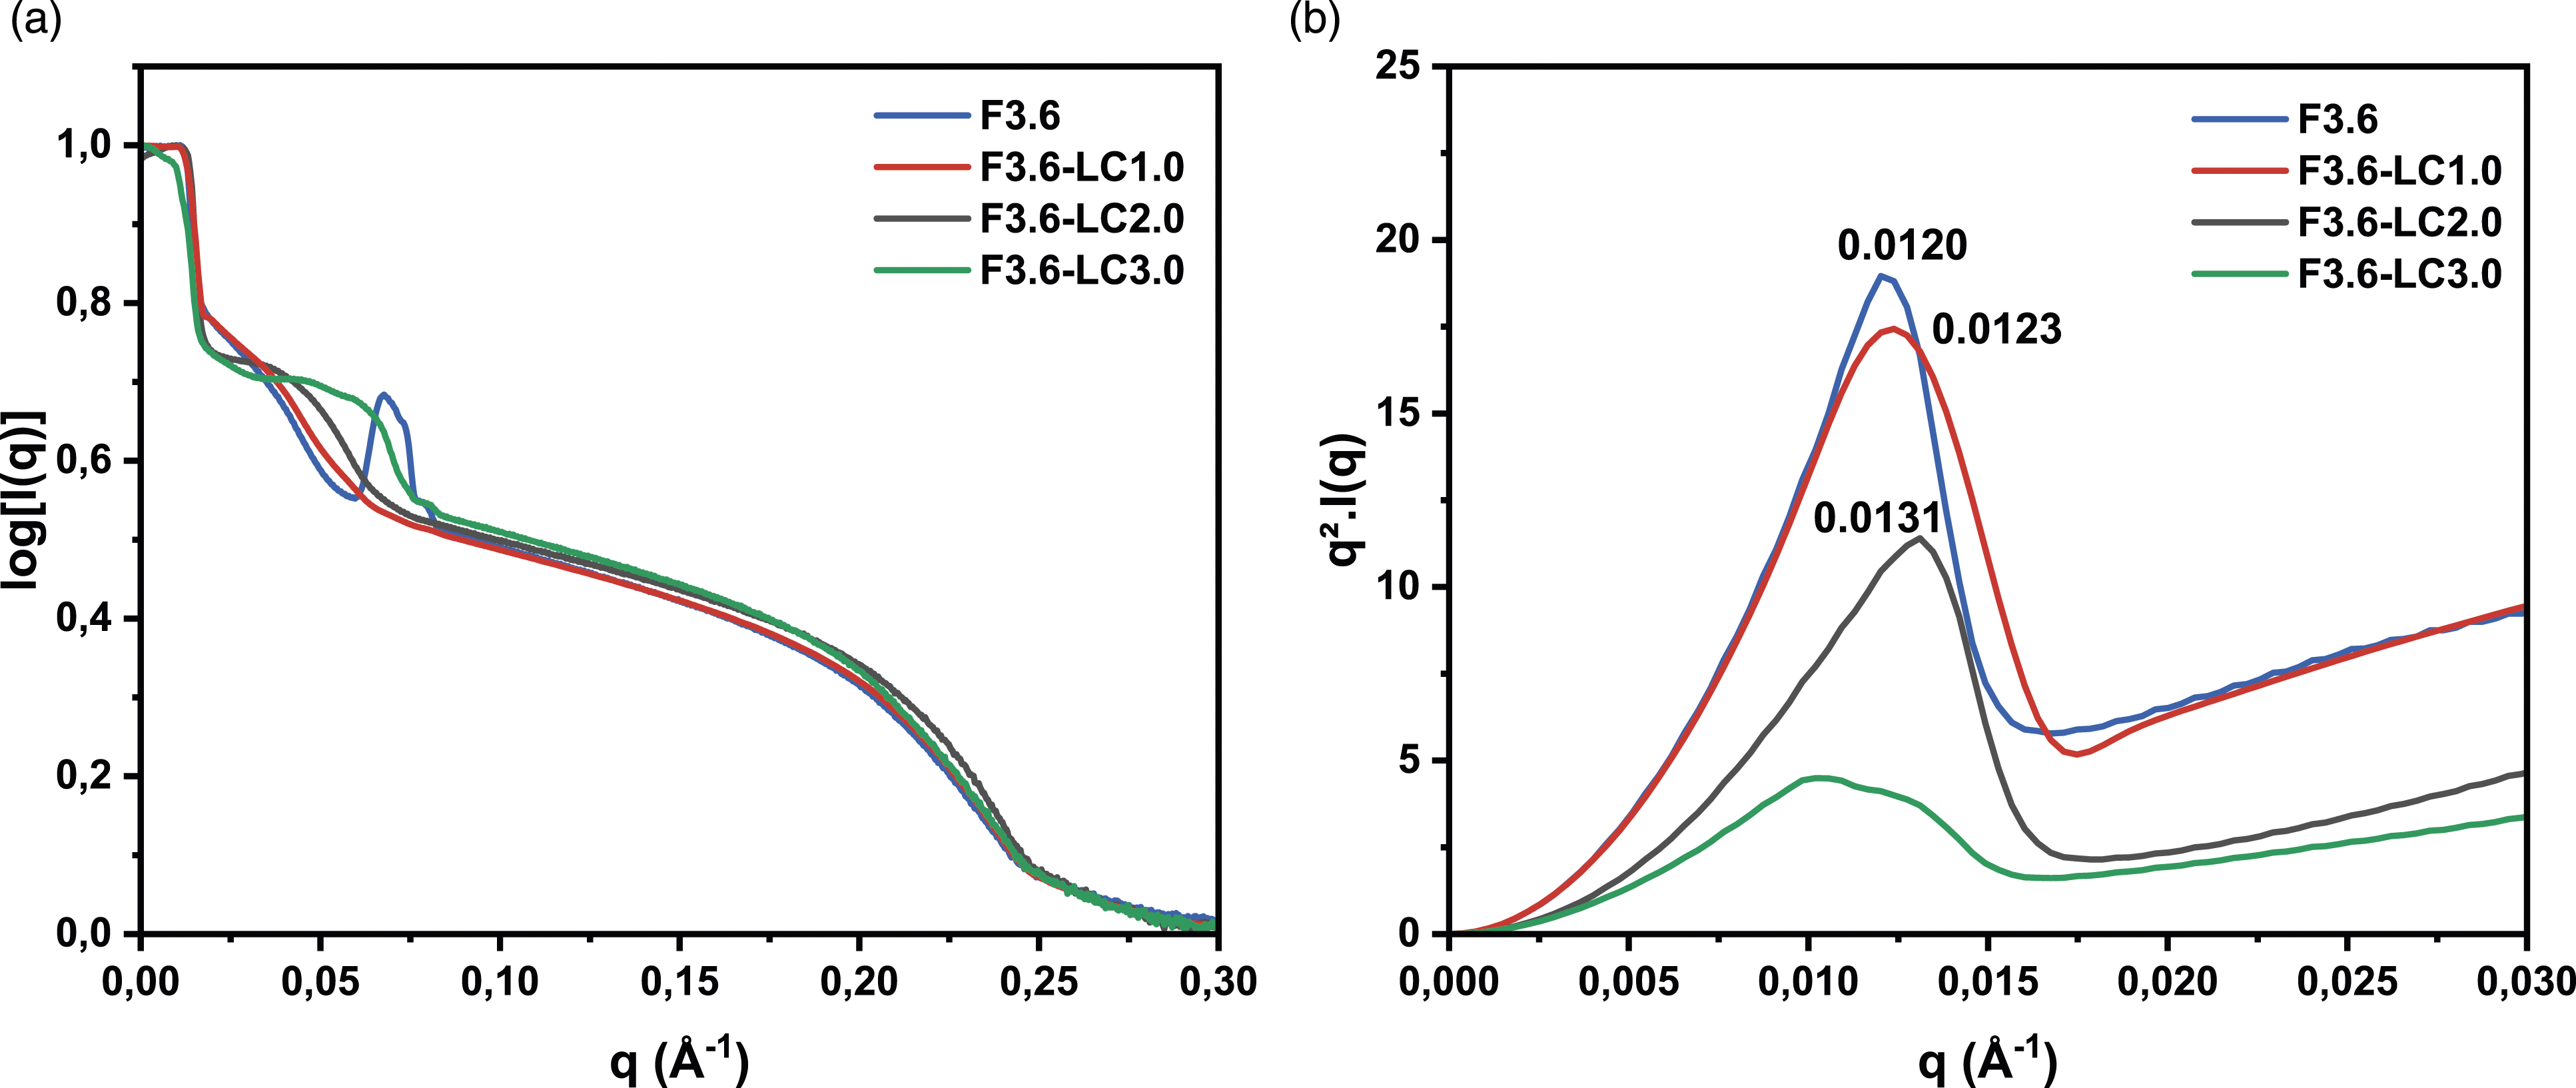
Figure 6 presents the normalized FTIR spectra of the carbonyl region for foams F3.6, F3.6-LC1.0, F3.6-LC2.0, and F3.6-LC3.0. The incorporation of LiCl leads to a modification in the ordering of the polyurea segments. A comparison of the spectra for the four foams reveals that as LiCl content increases, the peaks corresponding to bidentate urea decrease, while the peaks corresponding to monodentate urea show an increase in intensity. F3.6-LC1.0 and F3.6-LC2.0 exhibit little difference in the peak intensity representing bidentate urea, whereas sample F3.6-LC3.0 displays a weak peak. Moreover, F3.6-LC3.0 presents a distinct peak for monodentate urea compared to the other foams. This observation can be explained by the fact that LiCl alters the bidentate structure7,26,31 of urea and converts a portion of them into monodentate urea groups, which are less ordered. This could potentially account for the defective formation of urea aggregates observed in the previous SAXS analysis. FTIR spectra for F3.6, F3.6-LC1.0, F3.6-LC2.0 and F3.6-LC3.0.
The WAXD profiles for F3.6, F3.6-LC1.0, F3.6-LC2.0, and F3.6-LC3.0, as shown in Figure 7, present a diffraction peak corresponding to a spacing of 4.4 Å. Notably, the foams that contain LiCl lack the weak peak at 5.5 Å. This suggests that the presence of LiCl reduces the regularity of the hard segment packing arrangement. WAXS scattering for F3.6, F3.6-LC1.0, F3.6-LC2.0 and F3.6-LC3.0.
Diisocyanate structure effect
Figure 8 illustrate the SAXS scattering and Kratky plot profiles of foams prepared by various isocyanate structures, F3.6 prepared by a mixture of 2,4-toluene diisocyanate and 2,6-toluene diisocyanate, F3.6 TDI prepared by an asymmetric diisocyanate (2,4-toluene diisocyanate), F3.6 PDI prepared by a symmetric diisocyanate (1,4-phenylene diisocyanate) and F3.6 HDI prepared by an aliphatic diisocyanate (1,6-hexamethylene diisocyanate). The results of the Kratky plot profiles in the lower region (q < 0.02 Å−1) illustrates that F3.6 PDI and F3.6 HDI showed a very low peak, indicating the quasi-absence of globular urea aggregates, whereas F3.6 and F3.6 TDI have parabolic curves, it can be observed, by comparing the Kratky curves of these foams, that F3.6 TDI has smaller sized urea aggregates than F3.6. In the second region (0.02 Å−1 < q < 0.08 Å−1), the F3.6 PDI and F3.6 HDI foams exhibit the most prominent peaks when compared to the data from the other two foams. This suggests that the urea microdomains spacing in these two foams is the most ordered and well-defined, whereas the F3.6 TDI foam has a less orderly urea microdomains structure. Experimental SAXS curves (a) scattering curves for F3.6, F3.6 TDI, F3.6 PDI and F3.6 HDI (b) Kratky plot curves for F3.6, F3.6 TDI, F3.6 PDI and F3.6 HDI.
The normalized FTIR spectra of the four foams studied, all prepared using different types of diisocyanates, are shown in Figure 9. The bidentate urea in these foams exhibits hydrogen bonding in the range of 1620–1640 cm−1. Examination of the spectra reveals that the F3.6 HDI foam, characterized by the aliphatic structure of hexamethylene diisocyanate (HDI), has the highest intensity peak at 1620 cm−1, signifying an abundant presence of bidentate urea. In contrast, F3.6 TDI, prepared with an asymmetric diisocyanate, shows a weaker peak at 1640 cm−1, with the intensity of the highest peak attributed to the free urea bond, suggesting difficulties in the formation of stable hydrogen bonds. In addition, F3.6 PDI foam, prepared with a symmetric diisocyanate, shows the second highest peak at 1640 cm−1, after F3.6 HDI, highlighting the impact of diisocyanate symmetry on the formation of the bidentate urea. This comparison reveals that the bidentate urea content decreases when the isomer asymmetry increases.8,37 In Figure 10, the WAXS profile for F3.6 HDI shows a peak at 4.5 Å, similar to the curve observed for F3.6 TDI. Notably, both curves lack the peak corresponding to the 5.5 Å spacing. This suggests that the aliphatic structure of 1,6-HDI and the asymmetric structure of 2,4-TDI reduce the regularity of hard segment packaging in the resulting foam. Meanwhile, the F3.6 PDI curve shows two distinct diffraction peaks at 4.2 Å and 4 Å, reflecting a high level of crystallinity in the PDI-based foam. FTIR spectra for F3.6, F3.6 TDI, F3.6 PDI and F3.6 HDI.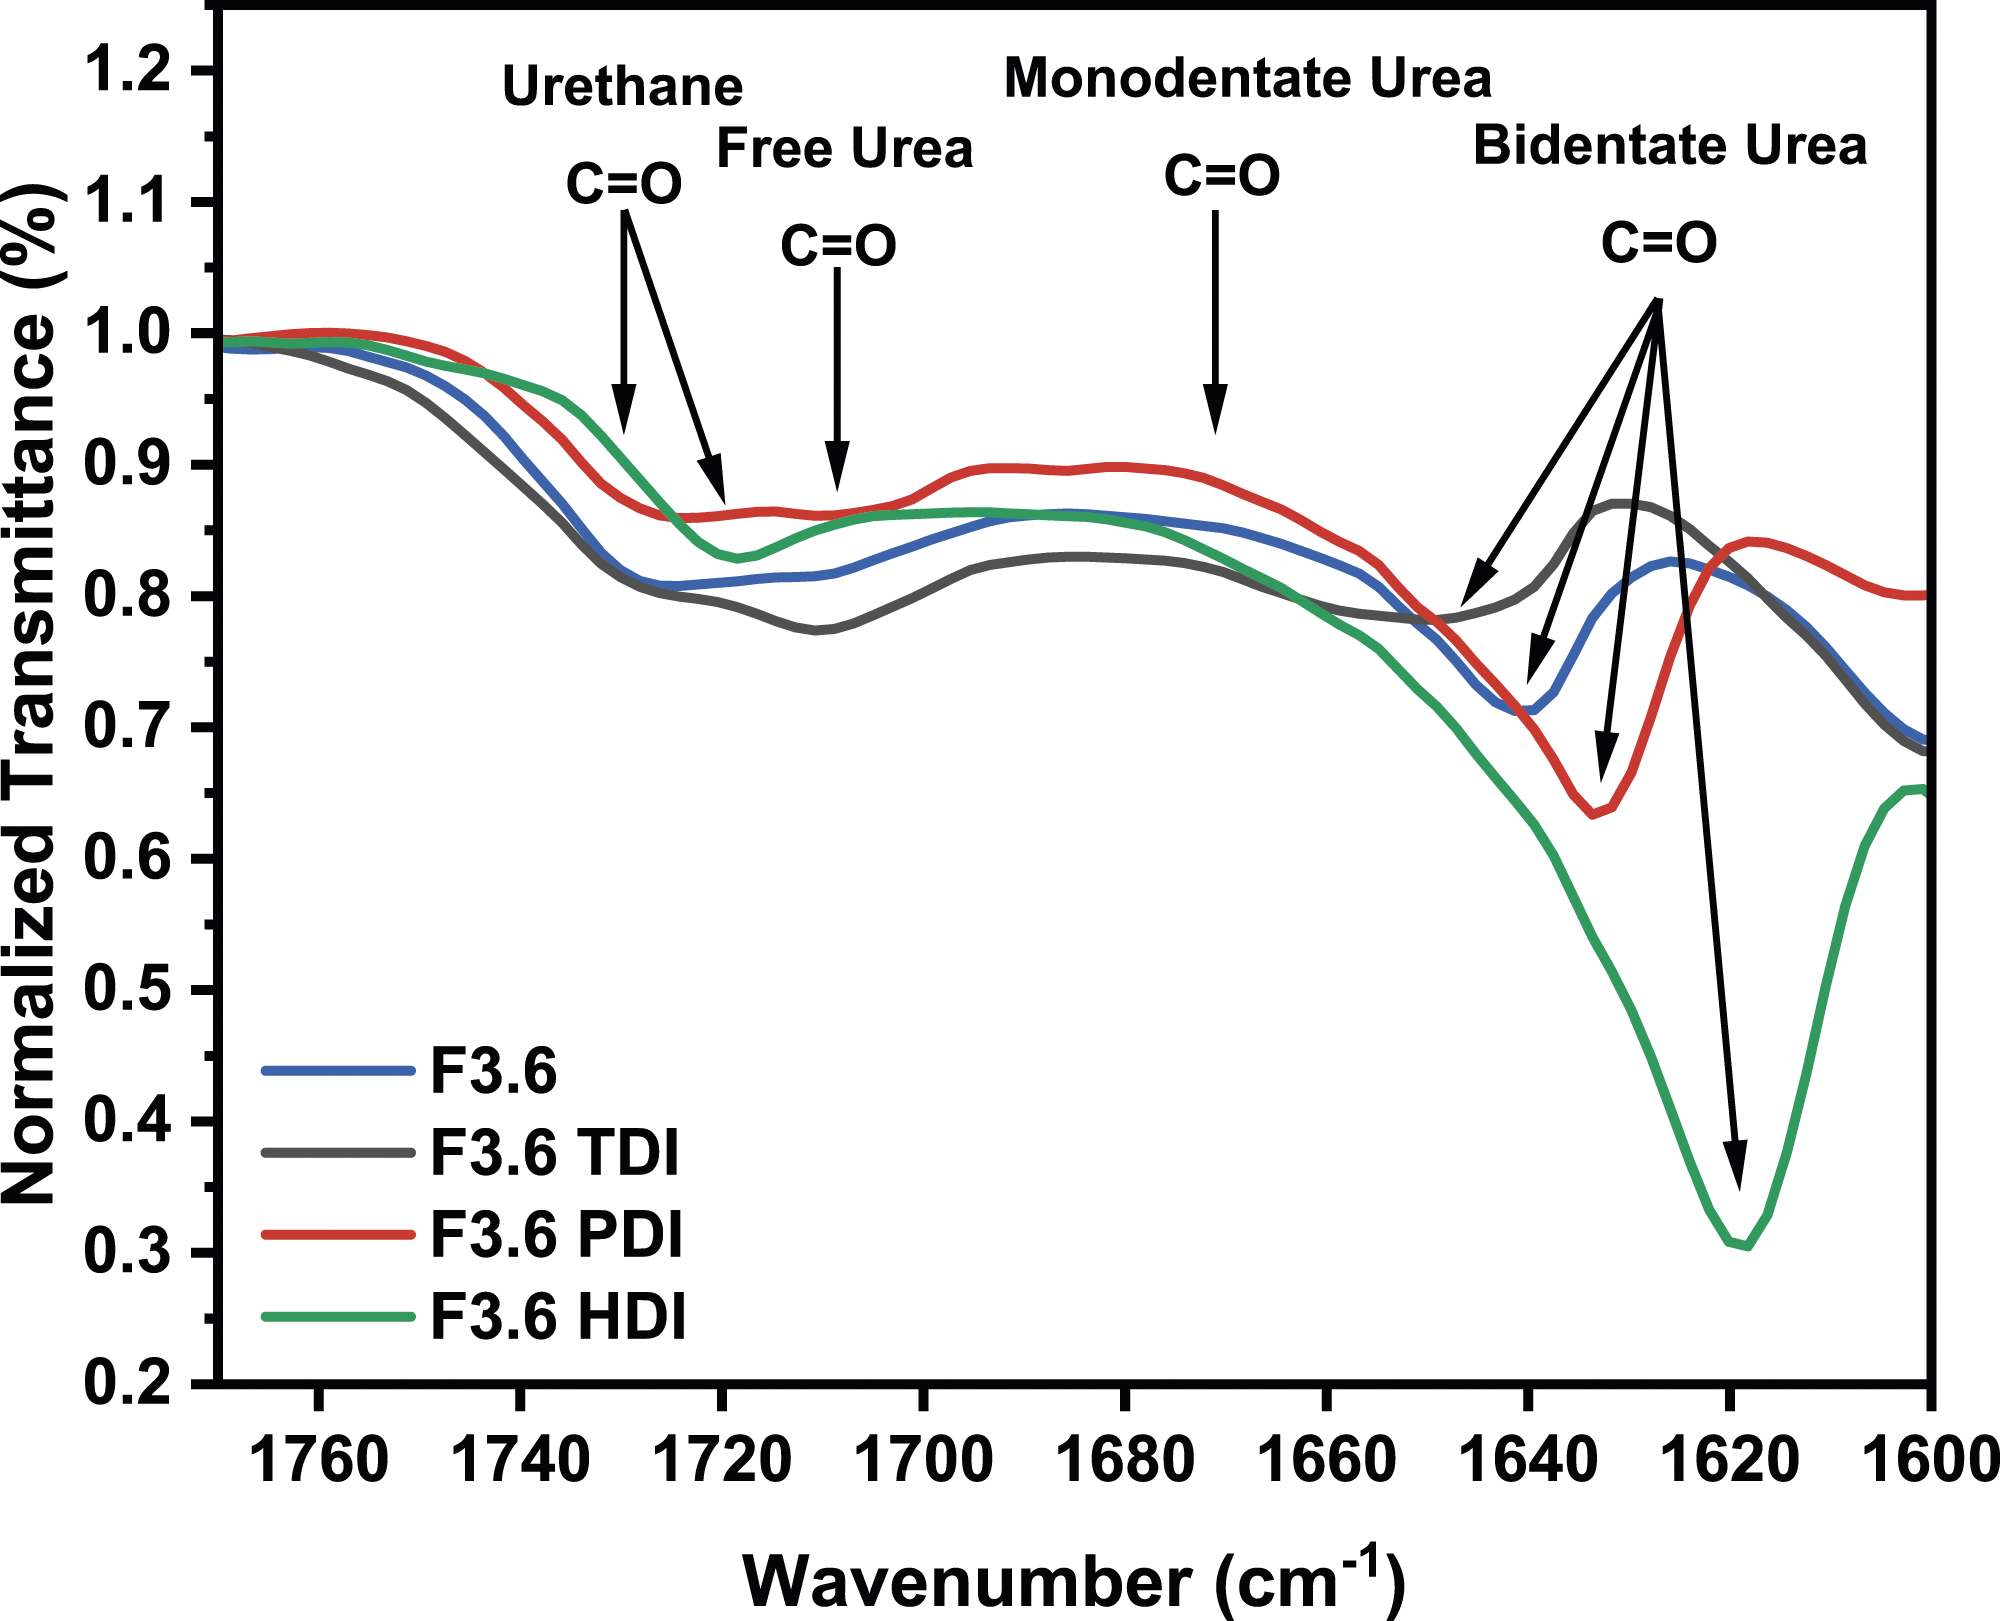
WAXS scattering for F3.6, F3.6 TDI, F3.6 PDI and F3.6 HDI.
Conclusion
This study investigated the phase separation behavior and morphology of urea in FPUFs prepared with different systems. Through the use of characterization techniques such as SAXS, FTIR, and WAXS, several key findings were obtained, shedding light on the influence of various factors on the urea dispersion and aggregation within the FPUFs. The results indicate that an increase in the water content of the formulation leads to a significant rise in the amount of urea microdomains and aggregates, resulting in a greater degree of urea dispersion throughout the system. Conversely, the addition of LiCl reduces the connectivity of the urea phase observed by SAXS and disrupts the regularity of hard segment packing noted by WAXS. As the LiCl content increases, the urea microdomains become more homogeneously dispersed in the polyol matrix. Moreover, FPUFs with different isocyanate structures exhibit variable levels of urea aggregation, with HDI and pPDI structures reducing urea aggregation and showing a high level of dispersed urea microdomains as noted by SAXS. FTIR curves also indicate that an increase in the content of asymmetric 2,4 TDI isomer reduces the degree of hydrogen bonding of the hard segments. 8 Hence, the asymmetric TDI isomer relatively prevents the formation of urea microdomains and reduces urea aggregation.
Footnotes
Acknowledgments
The authors would like to express their gratitude to SALIDOR for providing access to the raw materials and sample preparation equipment utilized in this study.
Declaration of conflicting interests
The author(s) declared no potential conflicts of interest with respect to the research, authorship, and/or publication of this article.
Funding
The author(s) received no financial support for the research, authorship, and/or publication of this article.