
Abstract
This paper aims to identify the creep mechanisms of high tenacity (HT) polyester industrial fiber under different loads. In-situ synchrotron small-angle X-ray scattering (SAXS) and wide-angle X-ray scattering (WAXS) tests were conducted on a 1000 D HT fiber during the creep and creep recovery process with a low load (15 N) and a medium load (50 N) as well as creep rupture process with a high load (60 N). The measured creep strain-time curves comprised tensile zone (I), creep deformation zone (II) and creep recovery/rupture zone (III). The SAXS indicated that the macroscopic initial creep strain in zone I and creep deformations in zone II were attributed to conformation transition from gauche to trans in amorphous region, increasing the amorphous orientation and long period. Irreversible portion of conformation changes accounts for the small unrecoverable plastic creep strain after removing 15 N load in zone III. The initial creep strain in zone I and creep deformations in zone II of the 50 N creep process were bigger than the microscopic long period strain, because amorphous layers had conformational transformation and microfibril slippage which also produced a higher unrecoverable plastic creep strain in zone III. The long period increased significantly at the beginning of rupture zone with 60 N due to fragmentation of amorphous tie molecular. The disappearance of lamellar peaks at the end of rupture zone implied destruction of periodic lamellar structures, for the entire breakage of amorphous chains. The WAXS suggested that the crystal structure was stable under the creep loads.
Keywords
Introduction
Polyester (PET) industrial fiber has found wide applications in automotive safety, engineered reinforcements, geotextile, geogrid, rope, and conveyor belts for its excellent mechanical properties, dimensional stability, and chemical resistance [1]. An in-depth understanding on the microstructure evolution of PET industrial fibers subject to both rapid and creep tensile deformations is crucial to improve the fiber quality in production and to predict the mechanical performance in real applications, respectively.
Over the past decades, the structural changes of PET materials during the deformation process have been investigated by analyzing their rapid tensile deformation in both the film and fiber forms in order to improve their mechanical performance. Particularly, the causes of reconstruction or destruction of structure and macroscopic fracture of PET films and fibers were emphatically discussed.
For amorphous PET films, the microstructure development underwent orientation, nucleation and growth steps subject to uniaxial tensile loading [2]. Ran et al. proposed that tensile deformation gave rise to the formation of mesophase and then transformation from mesophase to the crystalline phase during annealing process [3]. Stockfleth et al. studied the deformations of oriented PET film at 23, 60, 125 and 156°C and found that the microvoids formed if lamellar slip is hindered to a certain degree below or near the glass transition temperature. Volynskii et al. reported that stress-induced crystallization of amorphous PET occurred only at high draw rates and temperature above Tg [4]. As for low oriented polyester fiber, the structure changes have been extensively studied during the tensile deformation. Kawakami et al. [5–9] conducted a systematic study on the structural evolution of amorphous PET fibers during uniaxial drawing and revealed different mechanisms at the temperatures of 50, 90, and 100°C. At 50°C, the microstructure development process of amorphous PET under uniaxial drawing followed the sequence of forming the isotropic slush, oriented slush, smectic C, quasi-smectic A, and triclinic crystalline phases. By contrast, the microfibrillar structure and oriented chain appeared in the plastic deformation region at 90 and 100°C, but crystallization was not evident. SAXS pattern changing from X-shaped pattern to the four-spot can be attributed to the formation of new lamellar crystals during drawing and the isolated lamellae changed to stacked lamellae [8,10].
Unlike those of less oriented films and fibers, the structural evolutions of highly oriented commercial PET fibers with desired orientation and crystallinity during tensile process can be quite different. Shioya et al. [11] conducted SAXS measurements on a fully drawn PET fiber during tensile deformation at room temperature, and the results showed that a small fiber strain brought about marked change of the scattering patterns from the layer line scattering of four-spot to concentrating on the meridian, which was attributed to the slight decrease in the longitudinal disorder. At large strains, microvoids larger than the long period structures were formed. Murthy et al. [12] performed in-situ SAXS/WAXS measurements on four different fully drawn PET fibers, and a reversible transformation from a structure giving a four-point small-angle pattern (oblique lamellar surfaces) to a structure giving a two-point pattern (normal lamellar surfaces) was observed. The strain-induced structural evolutions of fully drawn PET fiber during drawing at 20°C and 200°C were studied by Liu et al [13]. It was found that the main rupture mechanism with low temperature was the destruction of periodic lamellar stacks, but the tensile rupture mechanism with high temperature was microfibril slippage.
Previous studies on PET materials have mainly focused on the structural evolution during rapid tensile fracture which could provide insights into how the microstructure changes in the production process. However, creep in continuous elongation under loading is of great importance in practical applications. Most of the studies concerned with creep mechanisms were carried out on high-performance fibers which are complex and closely related to the fiber microstructures [14–17]. Ericksen et al. [15] investigated the creep of Kevlar 29, Kevlar 49 and PRD 49 fibers, and argued that creep mainly results from the interaction of stress and thermal activation. Chain slippage [16] and chain scission [17] have also been proposed for interpreting the creep behavior of Kevlar fibers. It is considered that the tensile creep mechanism of high-performance fibers has been well established, but that of PET industrial fiber is still not clear because its different microstructure could have different tensile creep deformations.
Our previous work on off-line creep revealed that room temperature creep behavior of PET industrial fiber was largely related to the extending coiled molecular chain and conformational transformation in amorphous structure, and the crystalline structure did not show apparent changes during the creep process up to 70% of the breaking load [18]. This is inconsistent with the structural evolution of the fiber during the rapid tensile facture at room temperature for which the main mechanism was crystal destruction [13]. Offline creep tests can not completely reflect the real-time changes of the structure during the creep process. In this work, the micro-structural evolutions of a high tenacity (HT) polyester fiber (1000 D/192 f) with creep loads from low to high levels (15 N, 50 N, 60 N) during the creep process were studied by means of in-situ simultaneous synchrotron small- and wide-angle X-ray scattering techniques (SAXS/WAXS) [19,20]. The creep and creep recovery (rupture) mechanism in terms of amorphous structure, lamellar structure and conformation structure in different length scales were identified. The findings from this study could enhance the understanding of the creep deformation mechanism of HT industrial polyester fibers.
Material and methods
Material
A high tenacity (HT) polyester industrial fiber was specially prepared by Zhejiang Unifull Co. Ltd. in China. The PET before spinning had a melting temperature of 256°C and an intrinsic viscosity of 1.05 g·dL−1, measured in p-chlorphenol/tetrachlorethylene (50:50) at 25°C. The HT fiber was prepared via melt-spinning technology by double screw melt extruder and melt-spinning equipment (TMT MACHINERY, INC, TOKYO, JAPAN). The spinneret capillary had 320 holes with the hole diameter of 0.6 mm. The spinning temperature was 300°C. The spinning speed is 500 mm/min, and draw ratio is 6.5. The heat-setting temperatures range from 150 to 250°C and the time held at heat-setting process is within 10−2 s. The detailed characteristics of the as-fabricated HT fiber are listed in Table S1.
Methods
In situ synchrotron X-ray measurements during creep deformation
In-situ X-ray measurements were carried out on the HT fiber at room temperature during creep deformation. The synchrotron radiation (BL16B beam line, Shanghai synchrotron radiation Facility (SSRF), China) was used for the X-ray source. The X-ray wavelength was 0.124 nm and the cross-section sizes of the incident X-ray beam were about 300 μm in the fiber axis direction and 150 μm perpendicularly to it. The X-ray beam impinged upon the fiber perpendicularly to the fiber axis. Two-dimensional (2 D) WAXS and SAXS patterns were acquired using a Mar-CCD (Rayonix165) detector. The sample-to-detector distances for WAXS and SAXS were 150 mm and 1770 mm, respectively. Data analysis (background correction, radical, and azimuthal integration) were carried out using the X-polar software (Precision works NY, USA) as reported in our previous papers [21–24].
Creep deformation was applied to the fiber using a miniature tensile testing device (TST 350, Linkam Scientific Instruments Co., Ltd) mounted on a movable zone for position adjustment. A bundle of the HT fibers (192 f) was gripped with the chunks of the tensile testing device with a gauge length of 15 mm. The position of the fibers was adjusted so that the X-ray beam impinged on the center of the fibers between the chucks. Since the HT fibers moved in the counter directions under applied load, the X-ray beam was kept incident on the same portion of the fiber during tensile and creep deformation. The creep deformation of the fibers can be different subject to different tensile loading levels. If the applied load is higher or close to the breaking force of the fiber, besides creep deformation, creep rupture will occur eventually and the applied load is released automatically upon rupture. On the contrary, if the applied is much lower than the breaking force, the creep deformation can be ended with a creep recovery period upon releasing the applied load. Both of the two cases were considered in this work. The creep measurements of HT fibers are divided into two categories to account for the above two cases accordingly. The first category is creep and recovery tests with low and medium creep loads. Creep loads of 15 N and 50 N (20% and 60% of tensile strength, respectively) were exerted on the HT fibers at a rate of 10 N/min, and then the respective load was hold for 30 min to record the creep strains. After that, the applied loads were released and the strains of the samples were recorded for 10 min to be considered as the creep recovery periods. The second category is creep rupture test with a high creep load. The initial creep load was increased to 60 N to accelerate the fracture process at the same rate of 10 N/min. The creep and recovery, creep rupture curves were recorded simultaneously during the collection of WAXS and SAXS signals.
In situ birefringence measurement during creep deformation
To characterize the orientation structure changes in the creep process, in-situ birefringence during the creep deformation were measured based on Berek compensation method by using a polarizing microscope (SSY-C, Kailidi Co., Ltd) with a specially designed stress control apparatus. In the stress control system, a HT monofilament was attached two identical weights at the two ends by using two pulleys. Since the monofilament moved in the counter directions under the weights, so that the light beam for measuring birefringence irradiated the midpoint of the HT monofilament throughout the deformation process. The creep measurements of the HT monofilament were similar to those of multifilament. The weights attached to the monofilaments were 8 g, 26 g, and 31 g, respectively, for the applied loads of 15 N, 50 N, and 60 N on the multifilament to provide the same creep stress. The compensation angle as a function of creep time was obtained from the Berek compensator. The birefringence Δn of fiber was determined by the ratio of the optical retardation and fiber diameter. The optical retardation can be obtained from the “Tilting Angles Retardation” supplied by OLYMPUS [25].
The amorphous orientation (fa) of HT fibers was calculated from the birefringence results by using the equation (1) [26].

Results and discussion
Lamellar structure evolutions during creep and creep recovery process with low load and medium load by in situ SAXS measurement
The HT fibers went through fast tensile deformations and followed by creep under loads of 15 N and 50 N for 30 minutes. Figure 1 shows the typical strain–time curves along with selected 2-D SAXS patterns for the HT fibers during creep and creep–recovery deformation process. The lamellar peaks in/off the meridian direction for the periodic electron density distribution of the oriented lamellar structure is the key feature of the scattering pattern [27,28]. The 2-D SAXS pattern is considered to have a two- or four- spot pattern depending on whether the two lamellar peaks have two or four scattering maxima, respectively [12]. In addition, four- and two-point structures in 2 D SAXS pattern are corresponding to the lamellae with oblique and normal lamellar surfaces, respectively. The creep and creep-recovery can be simply divided into three zones: fast tensile deformation with the load up to 15 N or 50 N (zone I), creep deformation under the constant loads (zone II), recovery process after release (zone III) according to the mechanical behavior and SAXS features. Overall, regardless of the applied loads, the four-spot lamellar peaks gradually turn into layer line peaks with the coexistence of two-and four-spot patterns in zone I. Zone II exhibits a very slow creep deformation where the lamellar peaks almost remain unchanged, demonstrating no destruction of lamellar stacks in the fiber structure even at the higher applied load of 50 N. Zone III shows a partial recovery of the creep strain which means that the creep deformation was elastoplastic. A reversible transformation from a structure giving a coexistence of four- and two-point pattern to a structure giving a four-point small-angle pattern is observed when the creep load released. This further confirmed that the lamellae still exist during a slow creep deformation even at a high load. As reported in our previous study [18], the creep parameters, including initial creep strain (ε), elastic creep strain (ε) and plastic creep strain (ε) were calculated and given in Table 1. Specifically, the residual strains of HT fibers are 2.0% at lower load (15 N) and 5.8% at higher load (50 N), which is much higher than that produced by rapid deformation at the same applied load (see Table 2). The rapid tensile curves with 15 N and 50 N are shown in Figure S1. In addition, accumulation of plastic deformation by creep for 30 min produced lower elastic strain recovery ratios than rapid deformation with the same load levels. In summary, the microstructure evolutions subject to 15 N and 50 N creeps are similar in terms of their changes in SAXS patterns throughout the whole creep processes, but their residual strains are not identical which needs to be further elucidated quantitatively.

Creep strain–time curves and selected SAXS patterns collected during creep deformation and creep recovery of HT fiber at (a) 15 N and (b) 50 N.
The creep parameters of HT fiber at different creep loads.

The tensile and recovery parameters of HT fiber at different loads.

The SAXS data are able to provide quantitative lamellar structural parameters for better interpreting the structure evolution of the HT fiber during the creep process which is beneficial for understanding and predicting the its performance during long-term service. The quantitative lamellar structure parameters including long period, amorphous thickness, lamellar thickness and tilting angle of inclined lamellae from 2-D SAXS patterns were obtained based on the previous reports [19,29–31]. The calculation details are provided in the supporting information (SAXS analysis).
Figure 2(a) and (b) show that long periods increased obviously in zone I and slightly in zone II, and decreased after removing the creep load in zone III. The amorphous thicknesses increased slightly during the creep deformation and decreased a little when the creep loads were removed. The crystalline thicknesses had an obvious increase with fiber strains in zone I/II and can be recovered when the creep loads were retracted. It is worthy to note that, crystalline phase cannot produce strain-induced deformation during zone I and zone II [13]. The less oriented amorphous molecules changed their configuration and extended initially, and the electronic cloud density of oriented amorphous molecular is similar to that of the crystalline region. Therefore, the increase in lamellar thickness resulted from the more oriented amorphous phase during the creep deformation [18]. Upon releasing the creep loads, the extended amorphous chains and conformations were shrunk and partially recovered, respectively, thereby decreasing the crystalline thicknesses and long periods. It should be stressed that the increases of long period, amorphous and lamellar thicknesses in the creep and creep recovery process by 50 N are greater than those by 15 N.

Lamellar structure evolutions at different creep time with creep load of (a) 15 N and (b) 50 N. (c) The microscopic long period strain and macroscopic fiber strain at different time with creep load of 15 N and 50 N. (d) The microscopic long period strain and corresponding macroscopic creep strain during zone II.
It is necessary to compare long period strain and fiber strain to determine the quantitative relationship between microscopic deformation and macroscopic strain. The long period was calculated by applying the Bragg equation to the scattering peak of the intensity distribution, and the curves of long period strain and fiber strain versus time is shown in the Figure 2(c). The long period strain is defined as εL= (L-L0)/L0, where L0 and L are initial long period values of original samples and long period strain at certain creep strain, respectively. As for 15 N creep process, long period strain is equal to the fiber strain in zone I, indicating that the lamellar stacks wholly contribute to the deformation process. However, the long period strain in the case of 50 N is smaller than the macroscopic tensile deformation during zone I. This suggests that fiber elongation resulted from both the deformation of the lamellar stacks and the slippage of the fibril structures [13]. Hence, the creeps with two load levels brought about different microscopic deformation modes.
In order to check whether there is further fibril structure slippage within zone II, the long period strain during the 30 min creep was also defined and calculated by ε = εL-εL1, where the εL is long period strain at different creep times and εL1 is the long period strain when the creep time at 0 min. The macroscopic creep strain and long period strain during the creep process is shown in Figure 2(d), and a reference line is defined representing long period strain ε equal to macroscopic creep strain. If they are equal, the macroscopic fiber creep strain comes from the microscopic lamellar deformation. When the microscopic long period deformation is smaller than the macroscopic strain, lamellar structure deformation and the fibril structure slippage occur simultaneously. For creep deformation with 15 N creep load, the strain of long period is always close to the macroscopic fiber creep strain which is completely originated from the lamellar deformation. This is consistent with the previous study by Shioya et al. [11]. They found that the long period strain equaled the macroscopic strain before 10% fiber strains during cold drawing of high oriented PET fiber. The microscopic long period deformation is smaller than the macroscopic strain with 50 N. Hence, in addition to deformation in lamellar structure, the fibril structure slippage was also involved in zone II.
Figure 3 shows azimuthal scans of the lamellar peaks along q2 at different creep zones with low and medium creep loads. Original samples and the relaxed samples after creep recovery have four-spot 2 D SAXS patterns, and the intensity distributions along q2 were fitted with two Lorentz functions (I, II) as shown in the inset of Figure 3(a). However, at higher strains during creep deformation, the third Pearson VII function is also necessary to be involved at peak position of q2= 0, indicating the coexistence of two- and four-spot patterns (inset in Figure 3(b)) [12,32]. The separation of the centers of the two Lorentz functions is assigned to the lamellar shearing. The tilting angle of incline lamellae (Φ) with respect to the fiber axis was obtained with the following equation:
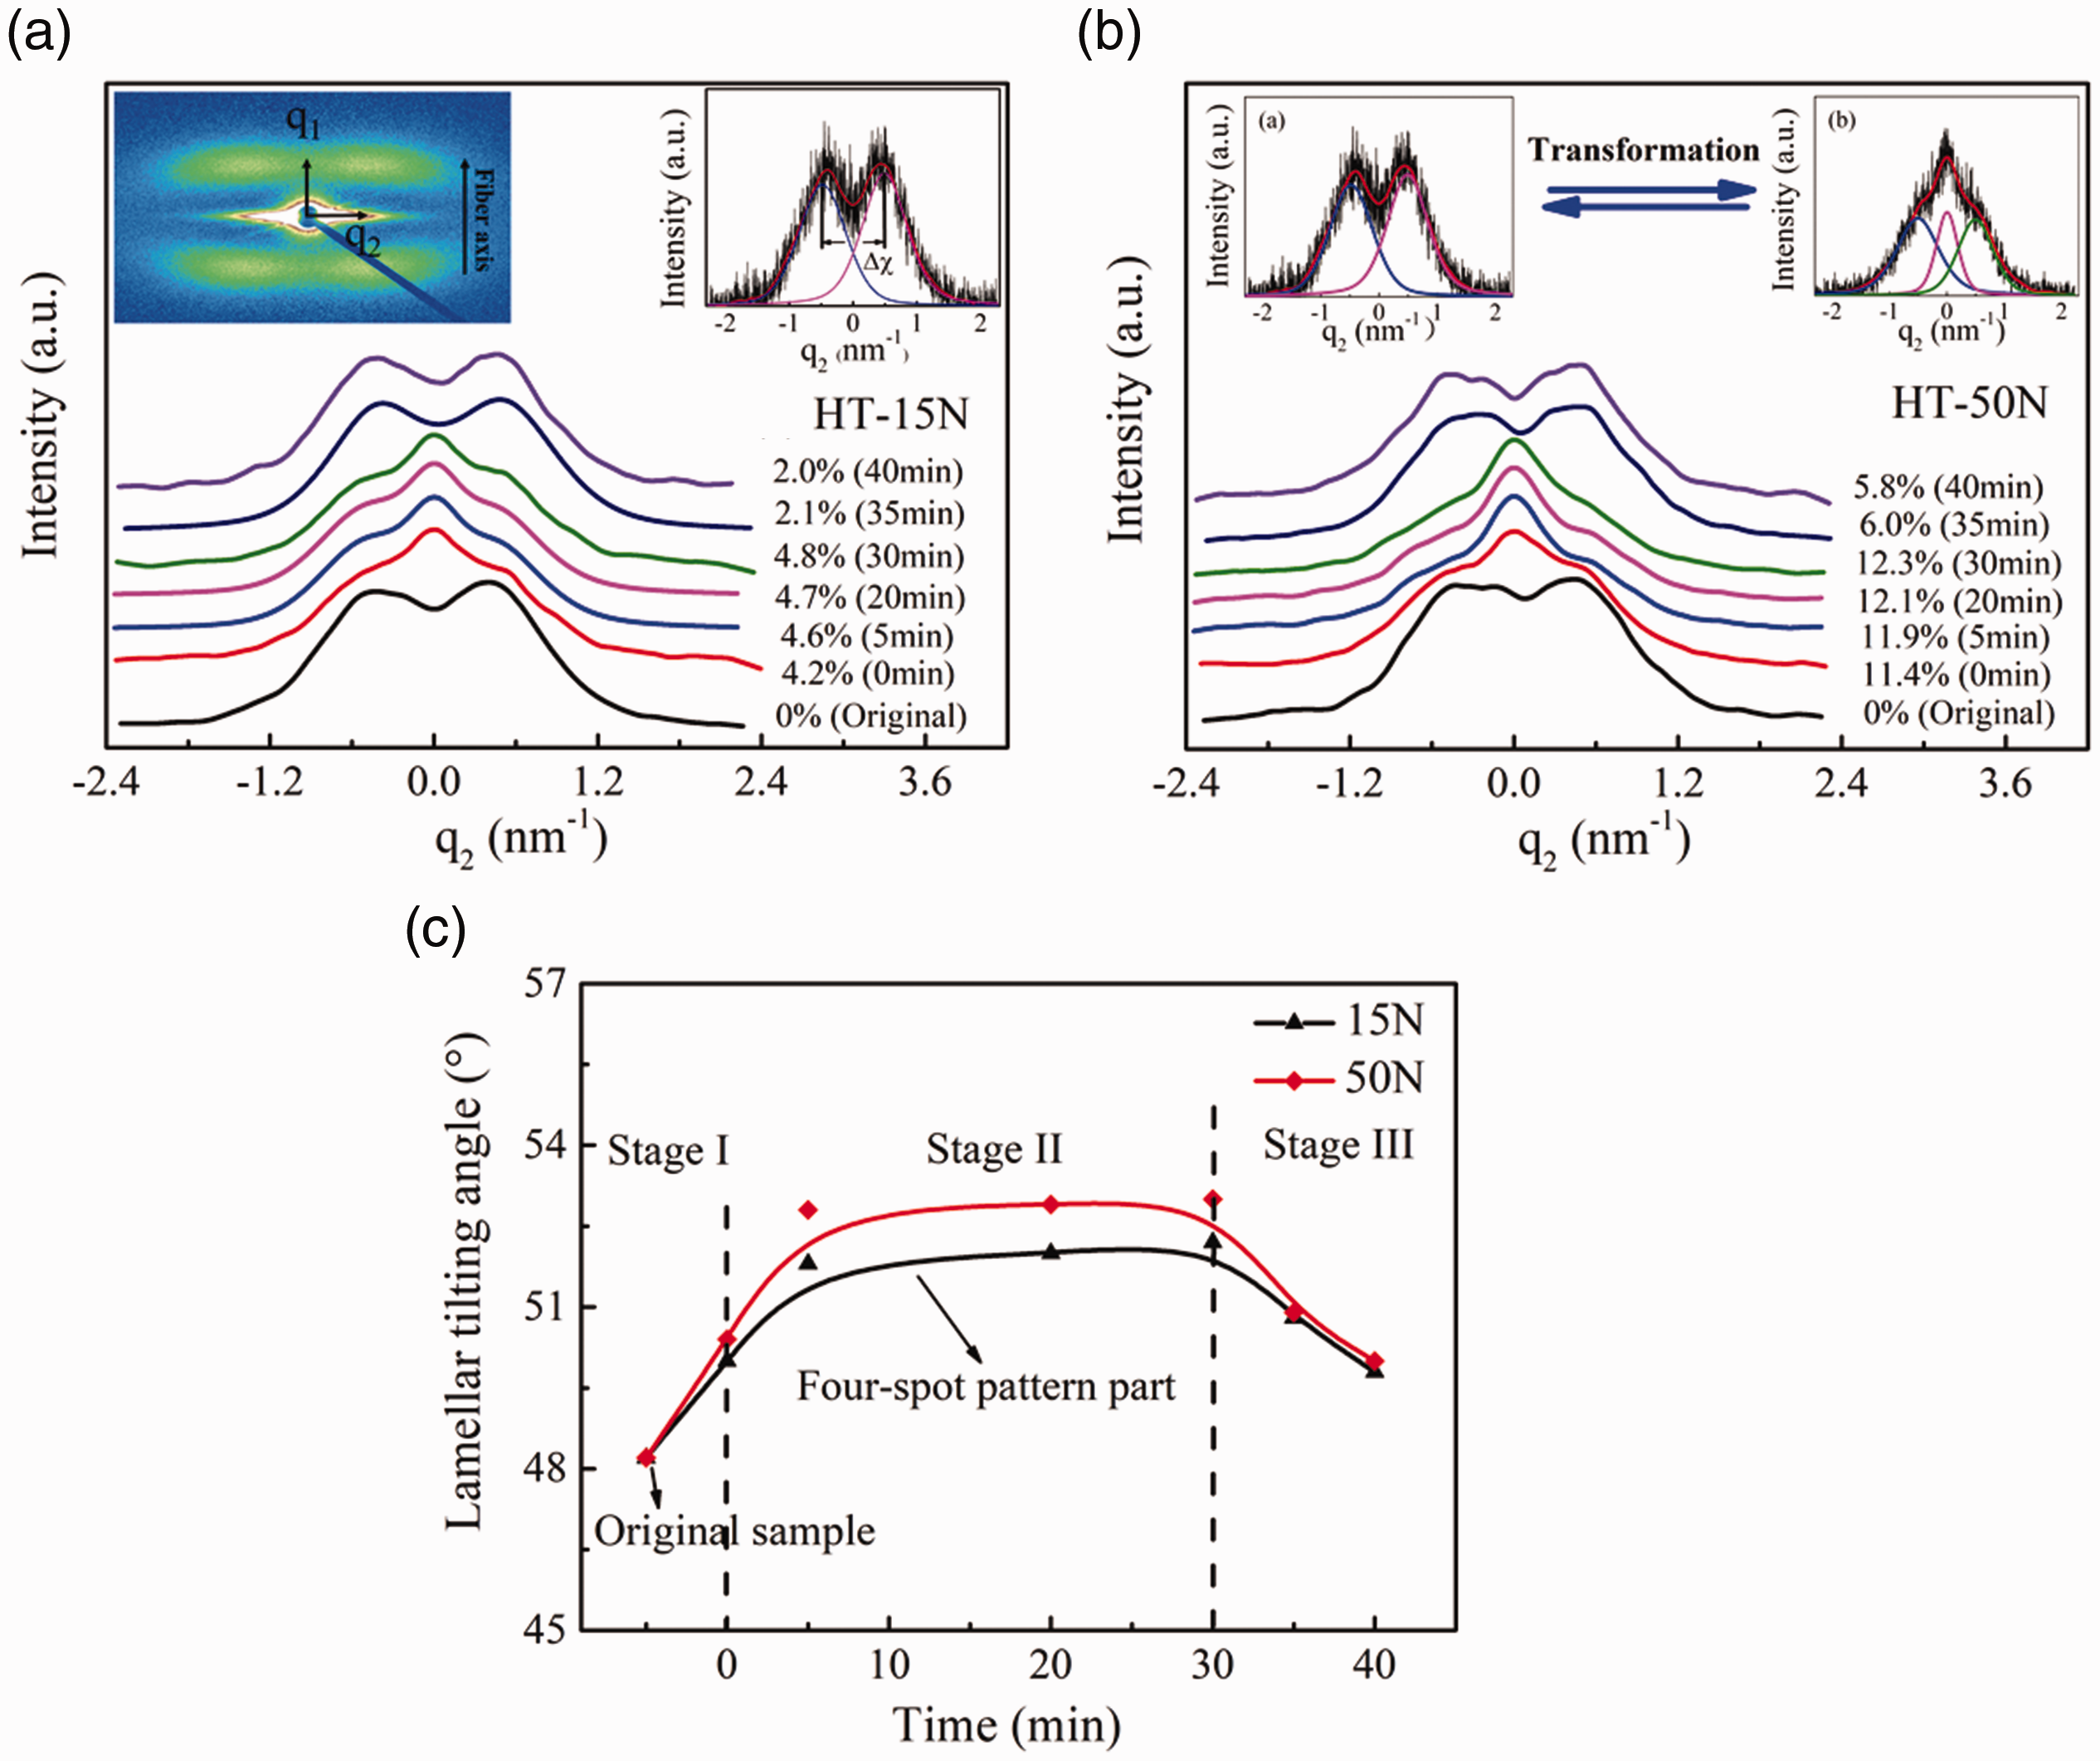
Scans of lamellar peaks along q2 at different strains for creep process (a) with 15 N creep load and (b) with 50 N creep load, respectively. The insets in (a) shows the peak fitting procedure to determine the lamellar tilting angle. The insets in (b) reflects the transformation of the SAXS pattern under creep load and removed the creep load. (c) Changes in tilting angle of the lamellae with creep time (four-spot pattern part).
By referring to Figure 1, the pattern changes from a four-point pattern to a two-point pattern when the creep load was applied in zone I, this transformation continues as the fiber is further stressed in zone II, and the four-point pattern returns when the creep load was removed in zone III. In the medium creep load (50 N) process, the change from a four- to a two-point pattern is more obvious. In this work, peak area was used to represent the amount of tilting or normal lamellae. Table S2 shows the changes of peak area at different fiber strains during zone II. The amount of tilting lamellae decreases, while the amount of normal lamellae increases. This indicates that more and more inclined lamellar surface change into the normal lamellar surface through the crystal rotation during zone II. The extent of this transformation in the 50 N creep process is greater than that in the 15 N creep process. With respect to the inclined lamellae, Figure 3(c) shows that the tilting angle of these lamellae increases with creep time under the creep load and then decreases after removing the creep load. The high creep load (50 N) appears to facilitate the changes of tilting angle during the creep process.
Crystalline structure evolutions during creep and creep recovery with low and medium load by in situ WAXS measurement
The crystalline structure of the HT fibers in nanometer scale was analyzed with in situ WAXS. The complete 2-D WAXS pattern with miller indices of the diffraction reflections shows in Figure S3. Figure 4 shows selected 2-D WAXS patterns at different times during creep and creep recovery process with 15 N and 50 N. As shown in Figure 4, the equatorial characteristic (010), (-110) and (100) diffractions remain clear and bright during both the 15 N and 50 N processes, implying a stable and complete crystalline structure. The obtained 1 D intensities vs scattering angle (2θ) at different times (strains) are presented in Figure S4. At 15 N and 50 N creep loads, the sharp diffraction peaks remain unchanged during the creep deformation and creep recovery. The detailed crystal structure parameters were determined based on reported methods [33,34].

Selected 2-D WAXS patterns during creep and creep recovery process with creep loads of 15 N and 50 N.
The crystallinity and crystallite size of the samples at different creep strains were determined and are shown in Figure 5. It is evident that the crystallinity, and the crystallite size of (0-11), (100) plane are relatively stable and kept constant with creep time at 15 N and 50 N during creep and recovery process. Figure 6 presents the crystalline orientation (fc), amorphous orientation (fa) and birefringence (Δn) versus creep time at creep loads of 15 N and 50 N. Note that the birefringence relates to the total molecular orientation of fibers. The crystalline orientation remains almost unchanged with the creep time regardless of the applied creep loads. Therefore, it is reasonable to ascribe the changes of total molecular orientation to the changes of amorphous molecular orientation. The amorphous orientation and total molecular orientation increased significantly in zone I because the less oriented amorphous molecular chains were stretched in the tensile process and then increased slightly because the conformation in amorphous regions transited from gauche to trans in zone II. The amorphous orientation could not fully recover when the 15 N and 50 N creep loads were removed in zone II due to the fixed conformation transformation. The orientation change is more obvious with medium creep load (50 N) compared to that with low creep load (15 N), since amorphous chains were stretched largely in the 50 N creep and creep recovery process.

Evolutions of crystallite size of (0-11) and (100), crystallinity with creep time at creep load of (a) 15 N, (b) 50 N from WAXS patterns.

Evolutions of crystalline orientation (fc), amorphous orientation (fa) and birefringence (Δn) with creep time at creep load of (a) 15 N, (b) 50 N.
Creep strain–time curves and selected 2D SAXS patterns during creep and creep rupture process with high creep load
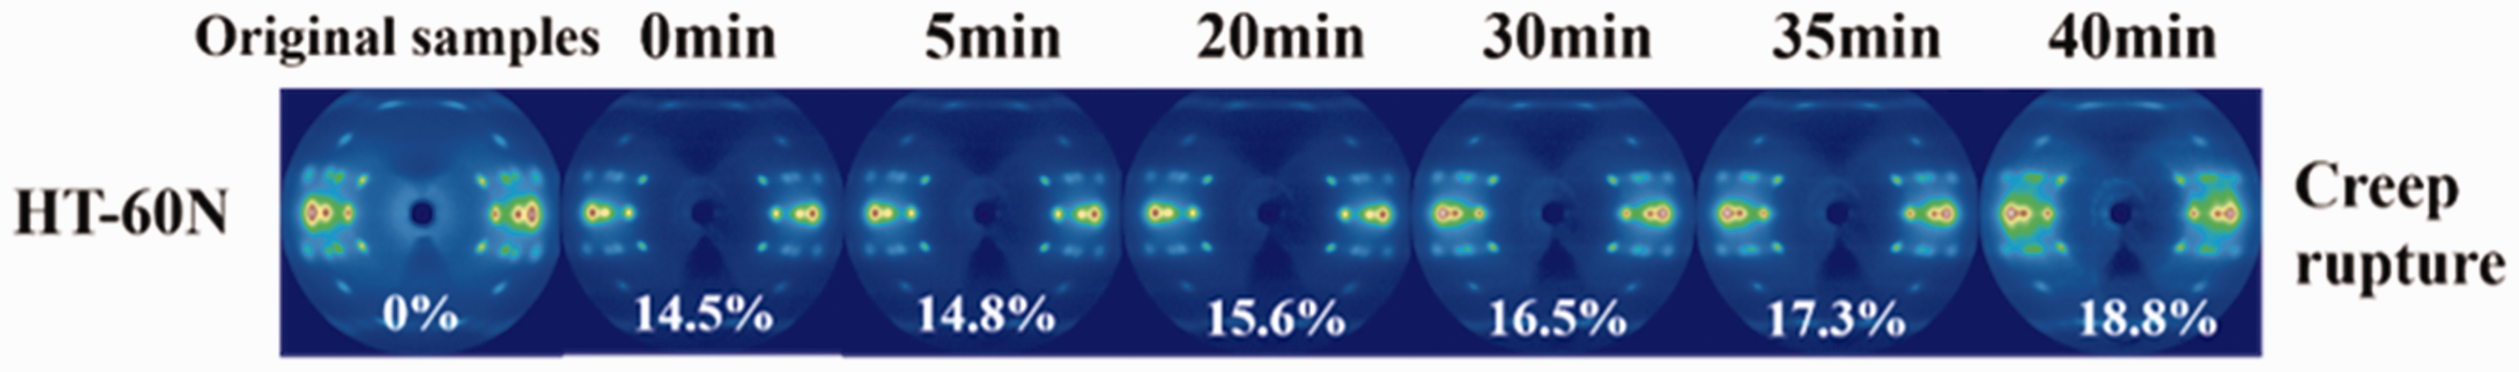
An initial creep load of 60 N was applied to ensure the HT fiber undergo a full creep and creep rupture process. Figure 7 shows the rupture curve and selected 2-D SAXS patterns. The creep rupture curve is also divided into three zones: tensile deformation (zone I), and continuous creep deformation (zone II) until the fiber rupture (zone III). The initial creep strain of HT fiber under 60 N creep load was 13.5% and then the strain increased slightly to 17.4% after around 40 min creep. Similarly, the lamellar structure deforms from a four-point structure to a two-point structure partially, and these two structures coexist and can be clearly seen up to 30 min creep time. Afterwards, the lamellar peaks gradually diminished which means that the lamellar stacks started to be destroyed. The changes in crystalline thickness, amorphous thickness and lamellar inclination are discussed below.

Creep strain–time curves and selected SAXS patterns collected during creep and creep rupture process at creep load of 60 N.
The one-dimensional (1-D) SAXS profiles along the meridian direction during room creep rupture process at 60 N load are shown in Figure S5. During 60 N creep rupture process, lamellar stacks were completely destroyed at the end of rupture zone (zone III). The long period was calculated by Bragg’s law based on the peak maximum in the 1-D SAXS profiles. The corresponding correlation function was also calculated (shown in inset Figure S4) to obtain the amorphous layer thickness. Figure 8(a) shows the resultant lamellar structure evolutions during 60 N creep and creep rupture. The long period and lamellar thickness increase significantly during the tensile deformation (zone I) and creep deformation (zone II), while the amorphous thickness increases slightly, suggesting that the increase of long period is mainly attributed to the increase of lamellar thickness. The entangled amorphous molecular chains were stretched during the tensile process (zone I), so the orientation increased gradually by the conformational transformation under the creep loads, the newly oriented amorphous chains resulting in the increase of lamellar thickness (zone II). The tie-chains in the amorphous region serve as bridges transferring load between two adjacent crystalline lamellae. In zone III, there is an apparent increase in lamellar thickness and long period prior to the complete destruction of the periodic lamellar structures, which was caused by the tie molecular fragmentation in the amorphous domain. After this fragmentation in the amorphous regions, the ordered lamellar stacks are entirely destroyed and no longer existent, which can be confirmed from the disappearance of lamellar peaks in SAXS pattern.

(a) Lamellar structure parameters evolutions during creep process at 60 N. (b) Evolution of lamellar tilting angle with creep time at creep load of 60 N. (c) The microscopic long period structure and macroscopic fiber strain at different time with creep load of 60 N. (d) The macroscopic creep strain and corresponding microscopic long period strain during creep deformation process. The solid line shows strain of long period equal to fiber strain.
Figure 8(b) shows that the tilting angle of inclined lamellae increases with creep time under the 60 N creep load until the periodic lamellar structure was destroyed. The inclined lamellar surface changed into the normal lamellar surface through the crystal rotation during zone II. However, the orientation of the inclined lamellar surface was decreasing during 60 N creep process. The curve of long period strain and fiber strain versus time during the creep and creep rupture process is shown in Figure 8(c), and Figure 8(d) shows the macroscopic creep strain and corresponding long period strain in specific zone II. Similarly, as for 60 N creep and creep rupture process, the strain of long period is always smaller than the macroscopic fiber creep strain in the whole loading process. This suggests that besides the deformation in lamellar structure, microfibrils slippage persisted in the tensile deformation (zone I) and creep deformation process (zone II) of the fiber prior to destruction. In addition, it can also be inferred that the microfibrils slippage accelerated the brakeage of the amorphous molecular chains, which cause the breakage of lamellar structure. The creep rupture mechanism at room temperature in this study differs from Liu’s report, in which the crystalline fragment was the main cause of rapid tensile rupture process [13].
Crystalline structure evolution during creep and creep rupture during high creep load by in situ WAXS measurement
Figure 9 shows the selected 2-D WAXS patterns of the samples during room temperature creep and creep rupture process. All the equatorial and off equatorial diffractions maintain bright and clear, indicating a stable crystal structure. Figure S6 shows 1-D WAXS profiles at different times. Figure 10(a) shows the crystallinity and crystallite size changes during the creep and creep rupture process. It can be found that both crystallinity and crystallite size remain nearly unchanged in zone I and zone II and keep the same till fiber fracture in zone III. The evolutions of crystalline orientation (fc), amorphous orientation (fa) and birefringence (Δn) with creep time at creep load of 60 N are also shown in Figure 10(b). The results from WAXS confirm that the orientation of coiled amorphous chains and the conformational transformation were the main cause of macroscopic creep deformation.
Selected 2-D WAXS patterns during creep rupture process at 60 N creep load.

(a) Evolutions of crystal size of (0-11) and (100), crystallinity with creep time at 60 N creep load. (b) Evolutions of crystalline orientation (fc), amorphous orientation (fa) and birefringence (Δn) with creep time at 60 N creep load.
Schematics of structure evolutions during creep process with various loads
Schematic diagrams for the major strain-induced structural changes during creep and creep recovery process with low (15 N) and medium (50 N) creep loads are illustrated in Figure 11 based on the SAXS and WAXS analyses. Figure 11(a) illustrates the stress-free state of the crystalline and amorphous phases in a semi-crystalline polymer. Once 15 N/50 N creep loads are applied, the initial response of the HT fiber in zone I is shown in the Figure 11(b), and the less oriented polymer chains in the amorphous phase elongate or uncoil. During the creep deformation zone with low creep load, the thickness of lamellar and amorphous, as well as amorphous orientation increase slightly with the creep time due to slowly conformation changes of the stretched amorphous chains (the top half of Figure 11(c)). The fibril structure and crystalline regions do not contribute to the creep, and the crystallinity and crystalline orientation keep constant during the low stress creep deformation. The conformation changes can be fixed in the deformation zone, resulting in the amorphous molecular chains cannot be recovered completely (the top half of Figure 11(d)). Besides the extension of molecular chains and conformation changes in amorphous regions, the slippage of fibril structure is also involved in the tensile and deformation zone in the creep process with medium load, resulting in more obvious creep strain. The unrecoverable plastic creep strain after removing the medium creep load is also resulted from the small microfibril slippage and fixed conformation changes (the bottom half of Figure 11(d)).

Physical molecular model of HT fiber under creep: (a) crystalline and amorphous regions without any load, (b) straightening amorphous region (initial creep), (c) transformation of molecular conformation at 15 N load, slip of fibril structure and transformation of molecular conformation at 50 N load (maximum creep deformation), and (d) recoiled molecule in amorphous region after removing the creep load (creep recovery).
The schematic diagrams in Figure 12 are proposed to illustrate the rupture mechanism during the creep and creep rupture process with high creep load (60 N). The deformation mechanism in tensile zone and creep deformation zone also relates to the amorphous structure and the fibril deformation (Figure 12(b)). The apparent increase in the lamellar thickness is attributed to the break of amorphous tie molecular (Figure 12(c)), accelerating the complete fracture of amorphous molecular chains and lamellar structure at the end of rupture zone (Figure 12(d)).

Physical molecular model of HT fiber under creep and creep rupture process at 60 N: (a) crystalline and amorphous regions without any load, (b) straightening amorphous region (initial creep), (c) slippage of fibril structure and transformation of molecular conformation in zone II, and rupturing of tie-molecule in amorphous region, (d) amorphous chains were totally destroyed and resulting in the breakage of lamellar structure.
Conclusions
In-situ synchrotron SAXS and WAXS were performed to investigate the creep induced structural evolutions of a 1000 D HT polyester industrial fiber with low (15 N), medium (50 N) and high level (60 N) creep loads. The crystal structure was stable during the creep process with various creep loads, but the creep deformation mechanisms in the amorphous structure with different creep loads are different.
For creep and creep recovery process with the low load and the medium load, the amorphous molecular chains were stretched in the tensile zone. In the creep deformation zone, low load creep lead to conformation transition from gauche to trans in amorphous regions, but medium load creep induced additional microfibril slippage. In creep recovery zone, the unrecoverable plastic creep strain after removing the low creep load was related to the irreversible conformation changes. Besides conformation changes, the unrecoverable plastic creep strain in medium creep load process was also resulted from the small microfibril slippage. As for creep and creep rupture process with high creep load, the destruction of periodic lamellar structures in creep fracture zone was attributed to the break of amorphous tie molecular, resulting in the complete fracture of molecular chains in the amorphous regions at the end of rupture zone.
Supplemental Material
sj-pdf-1-jit-10.1177_1528083720937379 - Supplemental material for Structural evolutions during creep deformation of polyester industrial fiber via in situ synchrotron small-angle X-ray scattering/wide-angle X-ray scattering
Supplemental material, sj-pdf-1-jit-10.1177_1528083720937379 for Structural evolutions during creep deformation of polyester industrial fiber via in situ synchrotron small-angle X-ray scattering/wide-angle X-ray scattering by Kang Chen, Yanping Liu, Hong Ji, Yang Zhang, Yuzhu Wang, Yumei Zhang and Huaping Wang in Journal of Industrial Textiles
Footnotes
Declaration of conflicting interests
The author(s) declared no potential conflicts of interest with respect to the research, authorship, and/or publication of this article.
Funding
The author(s) disclosed receipt of the following financial support for the research, authorship, and/or publication of this article: This work is financially supported by The National Key Research and Development Program of China (2016YFB0303004), the South of Tai Lake Innovative Elite Team Project of Huzhou (2016HJYLB-03-B) and Fundamental Research Funds for the Central Universities (CUSF-DH-D-2018016). We are particularly grateful to beamline BL16B1 and BL14B1 (Shanghai Synchrotron Radiation Facility) for providing the beam time and helps during experiments.
Supplemental material
Supplemental material for this article is available online.
References
Supplementary Material
Please find the following supplemental material available below.
For Open Access articles published under a Creative Commons License, all supplemental material carries the same license as the article it is associated with.
For non-Open Access articles published, all supplemental material carries a non-exclusive license, and permission requests for re-use of supplemental material or any part of supplemental material shall be sent directly to the copyright owner as specified in the copyright notice associated with the article.