
Abstract
In this paper, a method to obtain correction factors for in-plane shear properties in fibre-reinforced polymers with high Poisson’s ratio under biaxial load conditions and at high loads is presented. Experimental testing shows the deviations from classical laminate theory for such cases. The transverse deformation ratio is a general form of Poisson’s ratio and, for a ±45° angle-ply laminate, increases with strain. This effect is shown to exist for long and short test specimens, where significant biaxiality in the stress state is present. Reasons for this include fibre rotation at higher loads in tensile load conditions, and matrix plasticity and damage initiation. Test results show that the expanded formulas compensate errors in shear strength calculation of angle-ply laminates which arise from using nominal parameters with standard formulas. The results are also applicable to structures under biaxial load and when transverse contraction is inhibited, e.g. in shear panels. Further potential uses are in the presence of high shear strains and to detect the onset of damage under shear loading.
Keywords
Introduction
Modern laminates are often designed for a number of different load cases, including loading at angles to main fibre directions. The laminate can then be subjected to significant shear stresses. Despite the generally symmetric shear strength, the influence of normal stresses in composite laminates, especially at high loads and in fatigue, can give asymmetric shear strength values for angle-ply lay-ups. Obtaining experimental laminate shear strength values with additional compression loading usually requires short angle-ply specimens to avoid buckling of the flat laminates. In such specimens, the Poisson’s ratio, i.e. the ratio of global transverse to longitudinal deformation may be high, even exceeding the value of 0.5 for some angle-ply lay-ups. 1
A further important consideration is the load introduction, and different standards use different methods, i.e. end-loading of specimens or clamping of specimens in grips for shear-loading (ASTM D3410 2 ). Both methods have disadvantages, end-loaded specimens are prone to crushing the laminate, and in shear loaded specimens, stress concentrations at the clamped ends may exist. New compression test methods as the combined end load and shear load test (ASTM D6641 3 ) have the benefit to reduce the effects of end crushing and stress concentrations at tabs or grips. This is seen as a marked improvement over previous test methods. Whereas the end-loaded testing is of lesser importance nowadays for fibre reinforced polymers (FRPs), shear loaded tests are still common in compression strength testing. Test methods using shear loaded long specimens with lateral anti-buckling support rails exist, but these rails prevent the natural failure mode of fibre kinking, and make strain monitoring more difficult.
Specimen testing with short gauge length is thus the preferential compression test method. Strains are often measured in load direction only and e.g. by mechanical or optical extensometers over the gauge length, or by strain gauges on front and back to additionally monitor for buckling. However, especially when testing laminates with high Poisson’s ratio, the support restrictions on transverse deformation may influence the test outcome. Sevenois et al. 4 investigated the tab bonding influence on specimen testing and showed a large influence of the tabs on results. With compression testing, low clamping forces as suggested for D6641 may lead to undesired stick-slip in transverse direction and undefined stress and strain states in the gauge length, invalidating test results relying on single-axis strain measurement. Despite the higher lateral pressure in shear-only loading, it is so far not been investigated if shear-loaded compression testing suffers from the reported tab debonding effects or slipping in the grips as well. In such a case, single-axis strain measurement may also lead to invalid results. In this paper, an optical digital image correlation (DIC) system was used to measure full-field strains over the centre region of the gauge length. The full field data gives the transverse deformation over the test, and the deviation from the composite lay-up Poisson’s ratio can be established. In addition, the rotation of the surface material layer is obtained, facilitating an additional correction for fibre rotation during the test.
The mechanical behaviour of angle-ply laminates made from FRP has attracted interest by number of researcher recently.5–7 The in-plane Poisson’s ratio for bending-free loading of such laminates can be calculated by classical laminate theory (CLT)1,8 from the A-matrix as
In-plane shear properties of composite material are currently obtained with flat specimens under tension loading, where additional tensile load is present but neglected. As an application for the compression test correction method, a non-crimp fabric (NCF) ±45deg angle-ply laminate with high Poisson’s ratio made from Carbon-fibre reinforced polymer (CFRP) material is tested.
CLT is generally only valid for small strains and gives reliable results when boundary conditions do not affect the laminate response. Then, an in-plane Poisson’s ratio as a material property can be defined, e.g. over the range used for shear modulus calculation given by ASTM 9 or ISO 10 standards. For large static loads and general deformations, the more general term of transverse deformation ratio (TDR) is better suited. The TDR is defined by the ratio of actual global strains compared to the ratio of strains between two small loads, which defines the Poisson’s ratio. Throughout this paper, Poisson’s ratio is used when referring to a material property, and TDR when referring to the more general ratio of strains.
Using the DIC-calculated full field strain data, a compensation for (i) the transverse deformation constraint, and (ii) fibre rotation, which are both not constant over the compression test, can be applied. This paper aims to give correction factors for shear properties of fibre reinforced laminates. They should be considered in testing of shear loaded specimens and in applications in the presence of large shear strains, when high Poisson’s ratios are given for the tested laminate, and when using highly restrained laminates in shear applications, e.g. shear panels.
Materials and methods
In this section, the material and experimental set-up is introduced first, followed by analytical and numerical modelling.
Materials
The specimens were manufactured from NCF layers made from Toray T620SC carbon fibres in balanced, symmetric ±45° lay-up, using Araldyte LY3505 epoxy resin with Aradur 3834 hardener.
Tensile moduli for the material system in 0° and 90° directions are E0 = 110.7 GPa and E90 = 5.2 GPa, respectively, and were obtained from preliminary testing. For initial analytical calculations and the Finite Element analysis (FEA), the in-plane shear modulus is assumed as G12 = 4.0 GPa and the layer Poisson’s ratio as ν12 = 0.3.
Experimental Set-up
Specimen manufacturing
The manufacturing process of all specimen was performed at an industrial partner and followed the manufacturer guidelines for curing temperatures and times.
Figure 1 gives drawings of the test specimens for tensile and compressive load quasi-static tests. The geometry of the long specimens used in tensile quasi-static testing has been chosen according to ASTM-D3518,
9
with the deviation in thickness resulting from the lamina thickness. Glass-fibre reinforced polymer (GFRP) tabs were bonded to the specimen ends for load introduction. Between the tabs, the gauge length of the long specimens is 150 mm. For compressive quasi-static and alternating fatigue testing, the specimen gauge length was 10 mm as suggested in ASTM-D3410-03
2
to avoid buckling. Note that in experimental testing, because of the grip design, the minimum distance of clamping for the specimen was approx. 22 mm as is indicated by the dashed line in lower part of Figure 1. Specimen drawing including global coordinate system. CFRP specimen (1) and GFRP tabs (2) are shown.
Test set-up
Figure 2 shows the test set-up. The tests were carried out on a test rig in a laboratory under environmental conditions and at room temperature of 22±2°C. A Zwick-Roell BPS-LH0025 hydraulic cylinder with a nominal force of 25 kN and controlled by a CATS Control Cube system is used. The test specimen are fixed with MTS 647 hydraulic grips to cylinder and ground. Lateral motion is minimised by guide rails, thus facilitating compressing loading of the specimen. Low-friction sliding bearings are used to minimise the effect of stick-slip on the load measurement during the fatigue testing. Strains were recorded by a Correlated Solutions digital image correlation (DIC) system, capable of measuring the full surface on one side of the flat specimens or an area of the components.
11
During the quasi-static tensile and compressive tests, a sample frequency of 2 Hz was set. Figure 3 shows a long and a short specimen with a full field measurement of principal strain in load direction. The evaluation rectangle, over which the strains were averaged to obtain one TDR, is indicated. Furthermore, the connecting lines for which the rotation during the test were evaluated, are indicated. Note that only one representative line in the specimen centre will be shown in the result section. Test set-up for the specimen testing with (a) load cell and hydraulic cylinder, (b) sliding guide, (c) test specimen, and (d) hydraulic grips. Evaluation areas and lines for long and short specimens. The underlying colour map indicates the major principal strain under load. (a) Long specimens (b) Short specimens.

Quasi-static test procedure
The quasi-static tests were performed in displacement controlled operation with a test-head speed of 2.0 mm/min for the long specimens. 12 For the short specimen this value was reduced to obtain similar strain rates in the material. All quasi-static tests were stopped once the specimen was fully separated into two parts or crushed, i.e. no maximum strain limitation was enforced.
In the relevant standard,
9
the shear stress τ12,std is calculated by transformation of the global stresses to the layer coordinate system for ±45° layers, giving

Transverse deformation ratio calculation
The values for the in-plane TDR of the specimens are calculated for all data points acquired during the quasi-static testing of the specimens. From DIC-measured strains, averaged over the evaluation rectangle in load and transverse direction, ɛ
xx
and ɛ
yy
, respectively, the TDR νTD is obtained by

Modelling of the transverse deformation ratio
In this section, analysis using classical laminate theory (CLT) and Finite Element (FE) modelling of the specimens with ±45° lay-up are presented. The x-axis of the laminate coordinate system is aligned with the specimen load direction, and the y-axis is in the layer plane.
Classical laminate theory
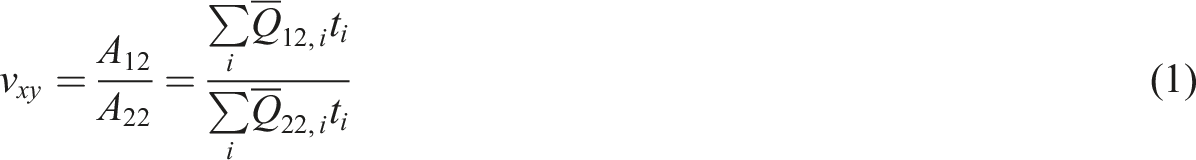
The expression for the TDR of a laminate from CLT assuming membrane stresses was given in Equation (1). For ±45° angle-ply laminates, the transformation of the layer stiffness to the laminate stiffness is easily performed
1
by


Using the above equations gives the TDR νTD as

Equation (6) indicates that the TDR is very sensitive to changes in the in-plane shear term, Q66.
Furthermore, angular rotation may occur, for which a corrected TDR can be calculated from CLT. For the given laminate, the nominal Poisson’s ratio is ν
xy
= 0.763. This result is valid when excluding boundary condition influence. For short specimen, clamping in grips via the tabs constrain transverse deformation and a reduced TDR is expected. Using the transformation from CLT for a special orthotropic laminate, A16 and A26 are zero, the global shear is decoupled from global normal stresses. Then, the reduced expression for the membrane stiffness is


Finite element analysis of the specimen
The assumptions of CLT are invalid for wide specimens with short gauge length, for which a tab influence on the stress state and TDR is expected. Therefore, the specimens were investigated by FEA. Figure 5(a) shows the finite element mesh of the short specimen. The test specimens were modelled with 3D-solid elements and using tied conditions between layers. To reduce the modelling effort, homogenised material parameters of the fibre-matrix composite were used, leading to a transversely isotropic material. The virtual lay-up was symmetrical and balanced and the Abaqus linear static solver algorithm was used. On the front face, element lengths were 0.5 mm, and through the thickness 0.1 mm. Quadratic brick elements with reduced integration, C3D20 R, were used. The load is introduced via GFRP tabs. For convenience, the multi-layer GFRP tabs were assumed as quasi-isotropic. The long specimen geometry was additionally modelled with similar mesh to validate the FE model against CLT predictions.
Results and discussion
In this section, analytical and numerical results are presented, followed by the quasi-static test results for long and short specimens.
Analytical and numerical results
Results from analytical and finite element models presented before are given in the following. Figure 4(a) shows the influence of the parameter νTD on the global stress ratio, and the reduction in measured TDR on increase in transverse stress. Figure 4(b) shows the effect of νTD on the layer shear stress. Comparing both plots in Figure 4 visualises the result of equation (10), i.e. that a positive ratio R
g
reduces the shear stress in the laminate. Transverse deformation ratio (a) as influenced by the transverse stress in the specimen, and (b) effect on the shear stress τ12.
Figure 5(b) shows FEA results of the short specimen under static displacement. From strains in the centre, measured over 7 mm, indicated by the arrows, the following TDRs are obtained. For the long specimen: νxy,FE,long = 0.759, which is comparable to CLT results, and for the short specimen: νxy,FE,short = 0.570. Specimen FE model comprising of laminate (grey) and tabs (green). The gauge section with arrows indicating strains for TDR evaluation is shown on the left. The right figure shows in-plane shear strain results of the pristine specimen.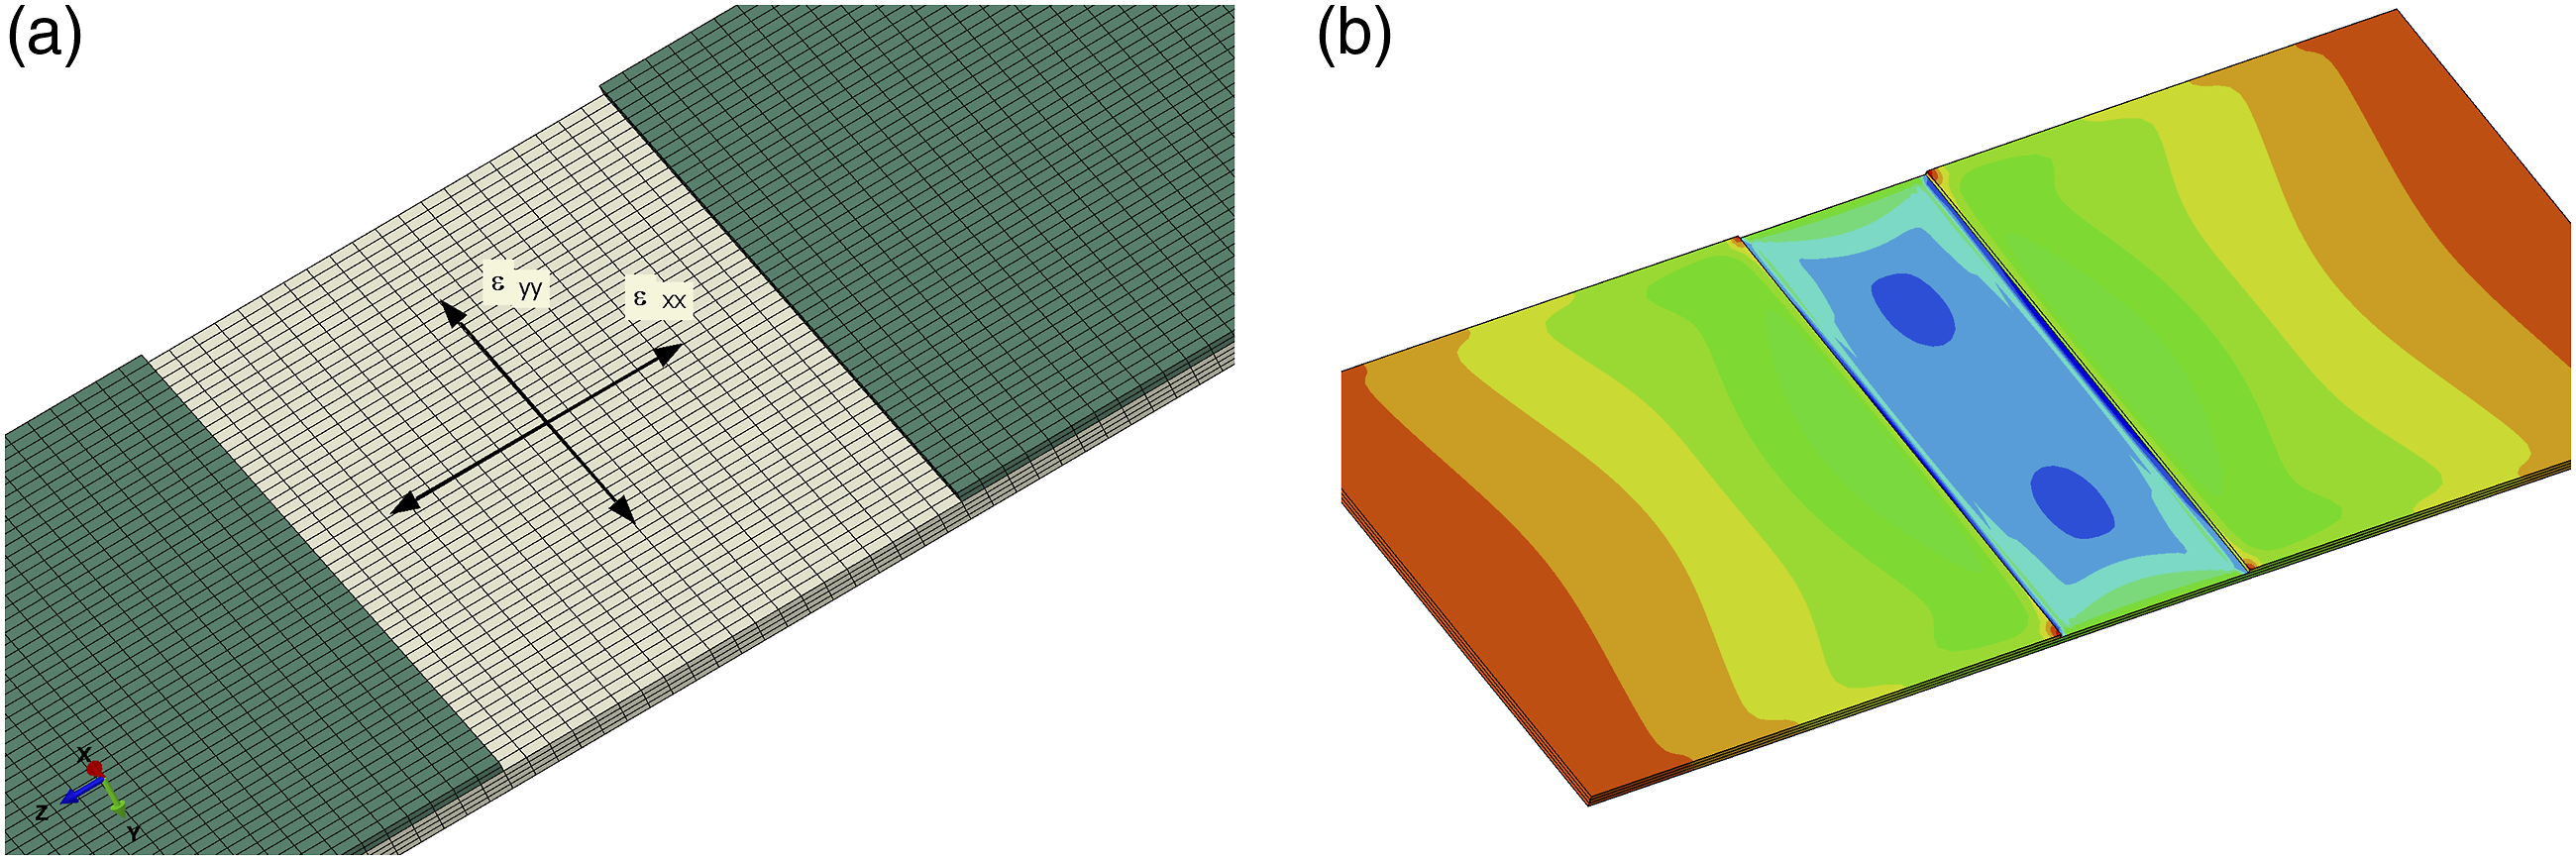
Such a discrepancy in TDR indicates significant transverse stresses in the short specimens, which can be estimated by CLT. The modelling was performed earlier in this section, and results for a range of TDR are shown in Figure 4. For νxy,FE,short from FE, the Equation (8) estimates global transverse stresses σ yy which are approximately one third of the longitudinal stresses σ xx . Furthermore, the shear stress in the layer as calculated by Eq. (10) is reduced to 60%. FEA obtained stresses in the central area gives a very close value for the transverse stress with σ yy /σ xx ≈ 0.33.
In the next sections, these results are validated by experimental testing.
Standard shear stress-strain curves and moduli
Three long specimens and three short specimens were tested in static loading. Figure 6 shows the shear stress-strain plots of the specimens. For tensile specimens, shear stresses and strains are calculated as described in ASTM D3518. The dotted lines in the compressive plot are obtained in the same way. A pronounced non-linear behaviour is visible for both load applications, and the larger shear strength in compressive loading is notable. In the next sections, two mechanisms, stress biaxiality and fibre rotation, are investigated as potentially causing the apparent increase in strength. Correcting for these additional effects gives a more realistic shear strength in the range of the tensile strength and indicated by solid, dashed, and dash-dotted lines. The shear modulus for all specimens is calculated as the chord modulus between 2000 and 6000 microstrain. Quasi-static shear stress-strain curves for compressive and tensile global load. Tensile and dotted compressive curves calculated according to ASTM standard. Other compressive curves include transverse stress correction and fibre rotation correction.
Normalised quasi-static test results: In-plane shear strength, tensile elongation at shear strength, and in-plane shear modulus. Average and standard deviation, and corrections for compressive values are given additionally.
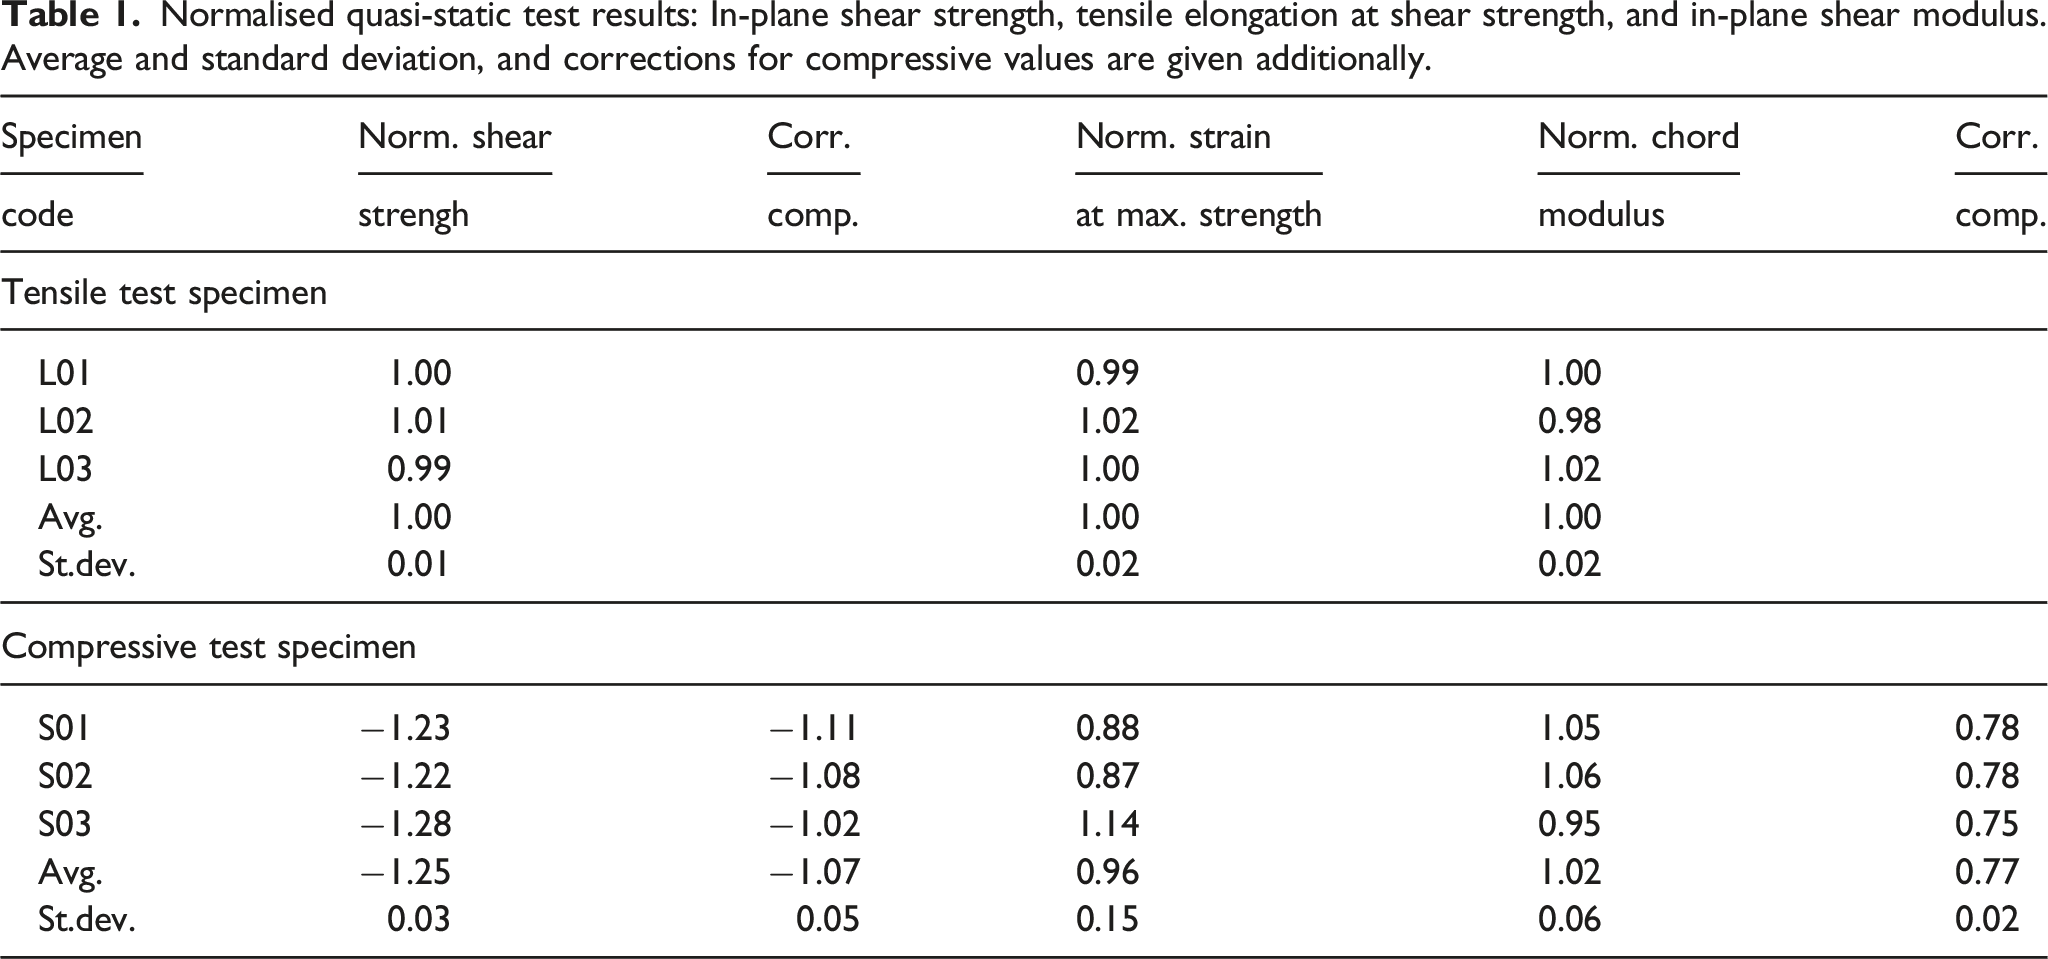
Very little variation exists within the tensile test sample, and only small variation within the compressive test sample, with the exemption of S03, which has a comparatively low modulus. Overall, the shear moduli and shear strengths calculated following the standard are larger by a factor of 1.02 and 1.25, respectively for the short specimens compared to the long specimens. Corrected values are given and are discussed later in the paper.
Figure 7 shows the fractured long specimens. The shear failure in the gauge length of all plies with no apparent areas of widespread fibre breaks indicates valid test results. Fractured specimens under tensile loading. The shear fracture of all specimens is clearly visible and occurs in the gauge length. The scale applies to all three figures.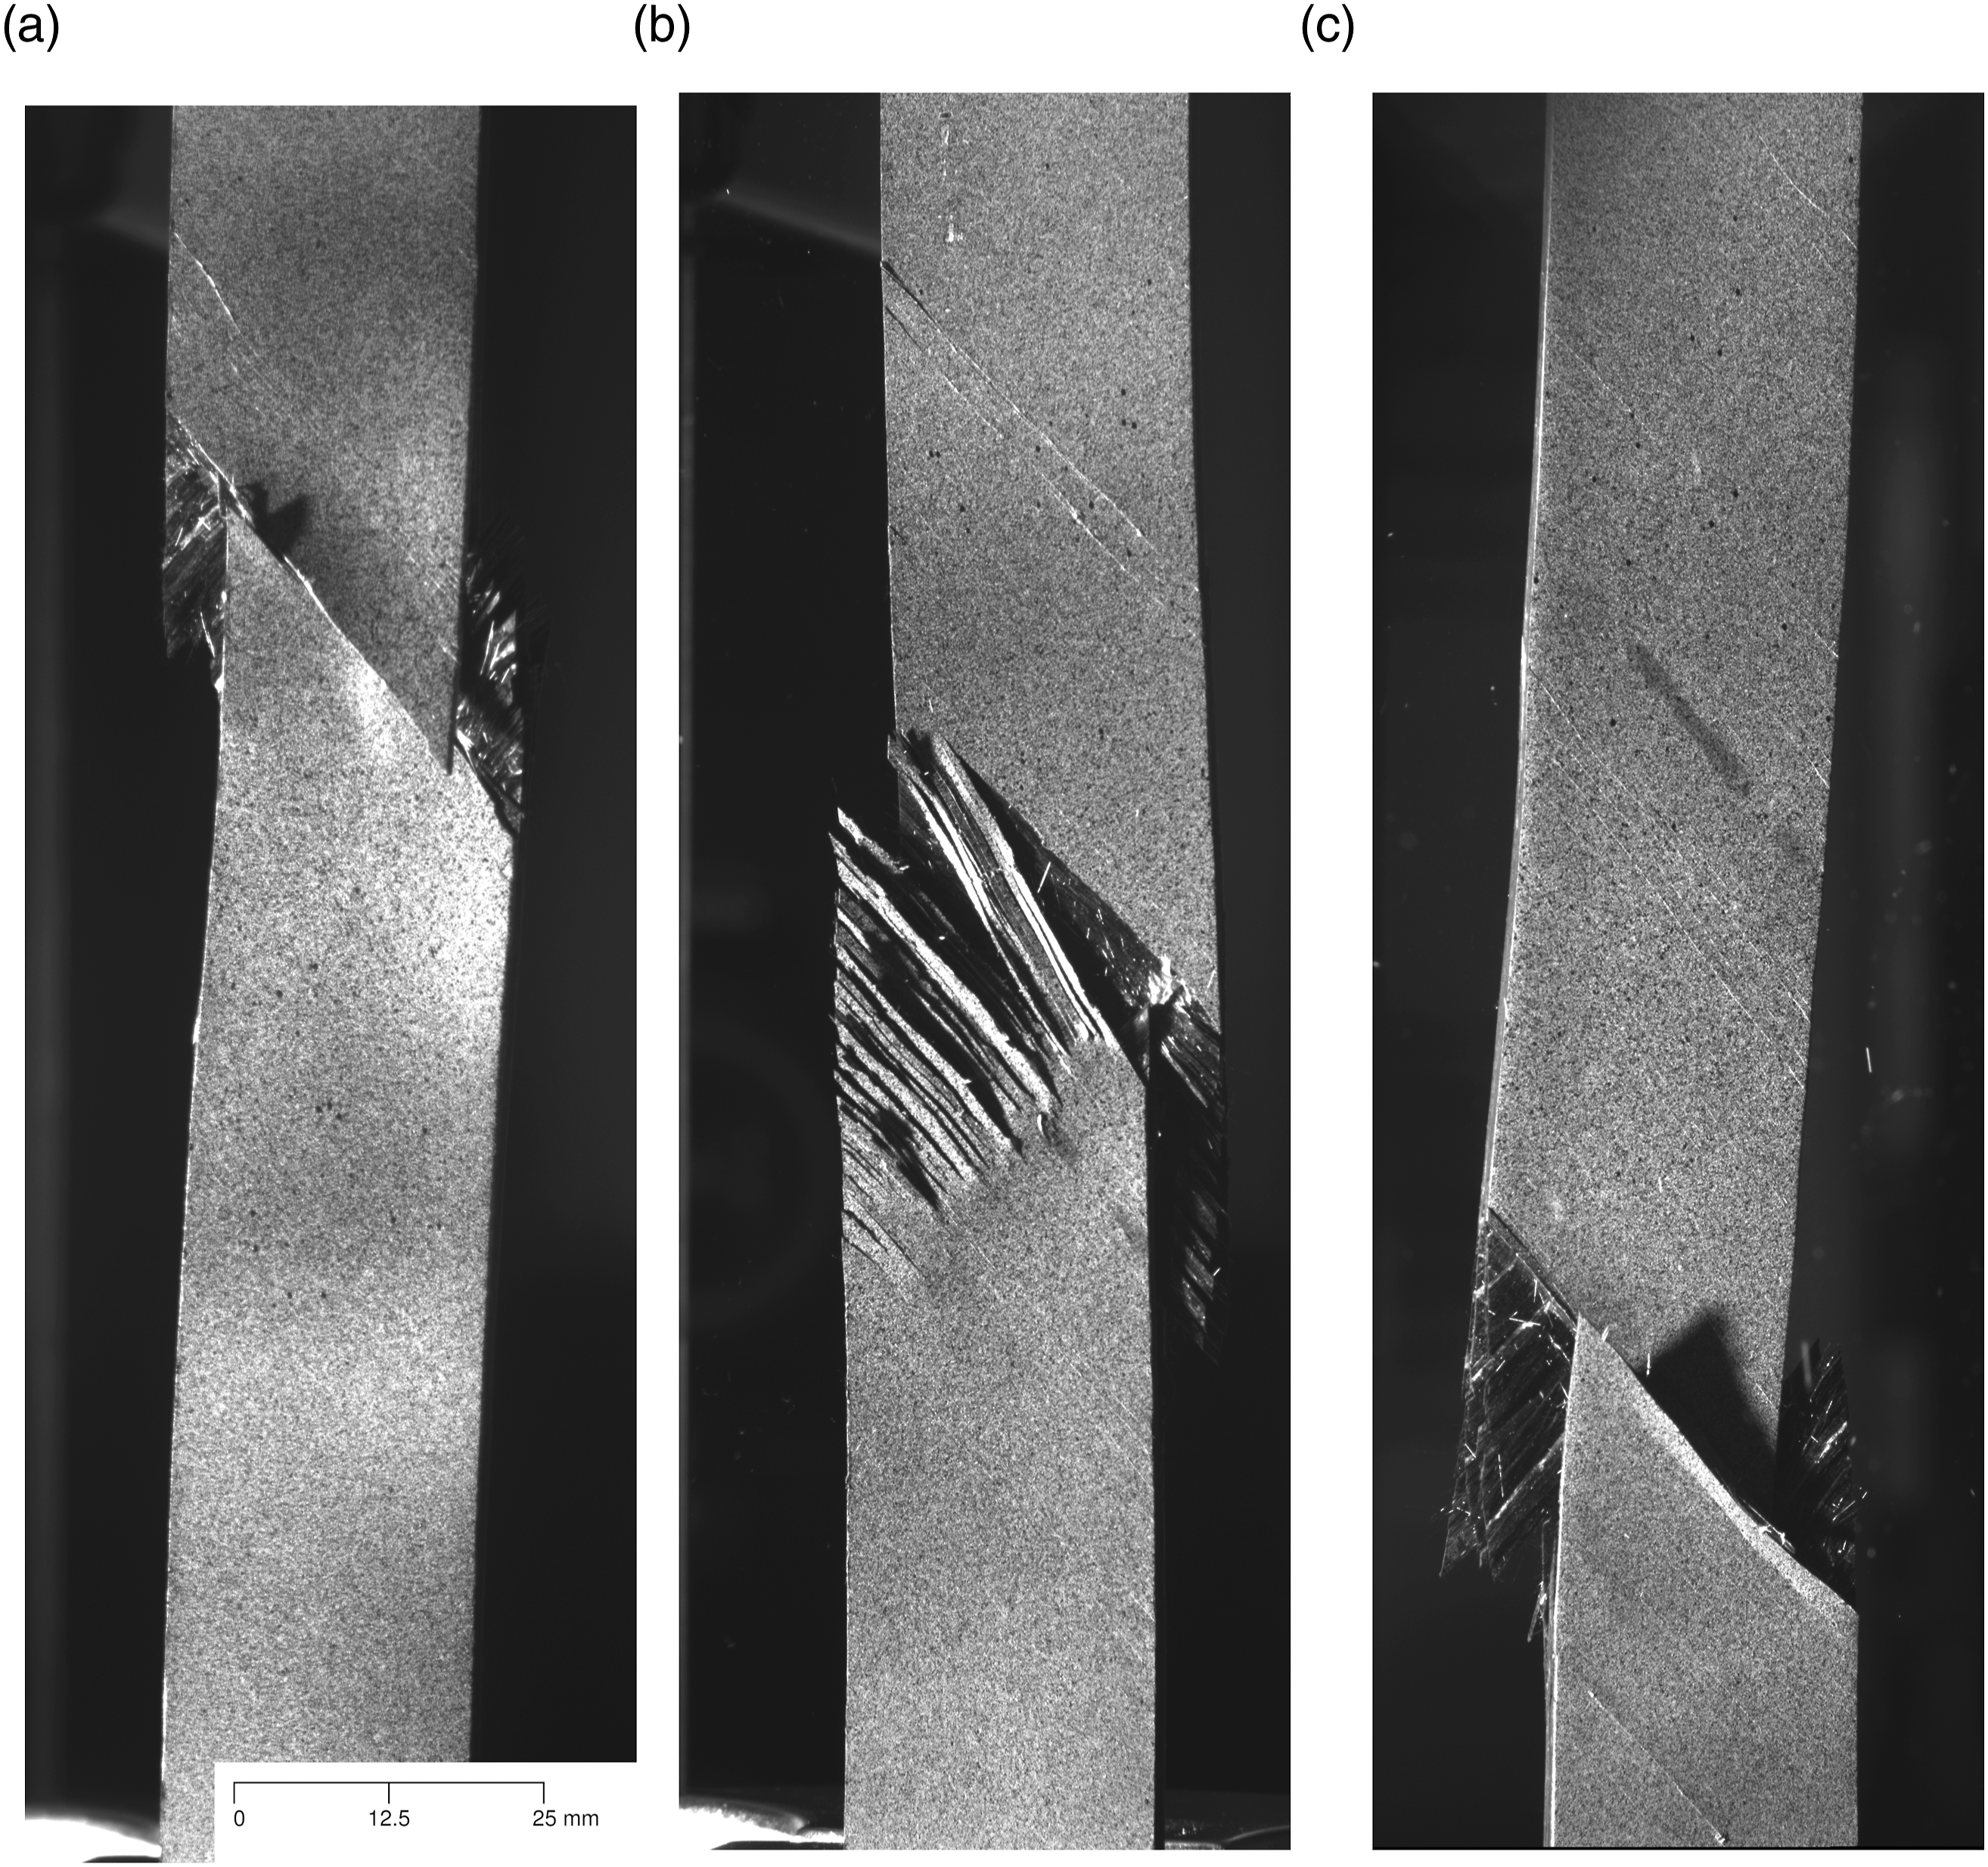
Figure 8 gives the fractured short specimens. Multiple shear fractures merge as a result of the short gauge length. Also, some out-of-plane displacement from buckling during cracking is visible. The specimens are classified as valid tests because the fracture is within the gauge length. Fractured specimens under compressive loading. Because of the short gauge length, the fracture does not appear as a single crack on the surface. All sections of the crack show in-plane shear failure as for the tensile specimens. The scale applies to all three figures.
Transverse deformation ratio in quasi-static testing
Figure 9 shows the TDR evolution over the tensile and compressive tests. The absolute value of the strain ɛ
xx
was used for better comparison. The dashed and dotted horizontal lines indicate the Poisson’s ratio of the ±45° laminate and the TDR from FE for the short specimen, respectively. TDR for quasi-static globally tensile and compressive tests.
Summary table of TDR and angle change results including average and standard deviation.

The biaxial loading affects the measured shear modulus in the short specimens. In the appendix, a formula for correction of the shear modulus to a TDR νTD ≠ ν xy is given. For the short specimens, the reduction in shear modulus is about 25% and is reported in Table 1 as the corrected modulus.
The TDR increases linearly with compressive and tensile shear strains. This is a different trend compared to the behaviour reported in the literature for 0°/90° FRP laminates13,14 and ±40°/90°laminates. 15 For multidirectional laminates with 0-degree and off-angle plies under tensile loading, such an increase was shown.16,17 Modelling e.g. by Varna et al. 16 and Barbero et al. 18 showed that transverse cracking in the off-axis plies can predict this trend in tensile loading. This was also shown by Montesano et al.19,20. However, the increase in TDR shown in this paper is present in global tensile and compressive loading. Transverse cracking alone is unlikely to be the physical mechanism for this behaviour. It is therefore postulated that matrix plasticity and the merging of matrix cracks forming fibre-parallel splits are responsible for the observed elevated transverse contraction ratio. This is supported by research by Varna. 17 They indicated that shear non-linearity, which includes both of these effects, is the reason for increasing TDR in their study on a multiaxial laminate. The fractured specimens in Figure 7 give strong indication that such splitting is widespread on the surface of fractured specimens, indicating split formation during testing. Modelling of these compressive and large-strain failure mechanisms will need some further research and testing, but may eventually give means to predicting behaviour of angle-ply under large strains.
In the next subsections, an additional fibre rotation correction will be considered.
Fibre angle evolution
The full-field measurement taken by the DIC system enabled the evaluation of fibre angle change over the tensile and compressive quasi-static tests. For this, as shown in Figure 3, a number of lines over the surface were used. Over the test, the change of the angle in a representative line at the centre of the specimen, which was nominally 45°, was analysed. Figure 10 shows the change in the angle of the specimens over the laminate strain ɛ
xx
. The angular rotation follows a linear trend for tensile and compressive specimens for most of the strain range. Near the rupture strain, the lines diverge. The nonlinearity, some curves are progressive and some degressive, does not follow a specific pattern. Different forms of damage, e.g. delamination between different layers, may be responsible for the inconclusive results. Change in fibre alignment over the absolute global in-line strain in quasi-static tests.
Figure 11 shows the angle change over the applied normalised applied force. Normalisation is done to the average failure load force in tensile tests of the long specimens, and the absolute value is shown to increase comparability. It can be seen that in the elastic range up to approximately 70% of the normalised failure load, the fibre rotation remains below 0.5°, and in the shear modulus calculation range, the angle change remains below 0.2°. Fibre rotation has therefore negligible influence on the obtained shear modulus. However, the fibres align in the latter stage of the quasi-static tests and maximum absolute fibre rotation of 2°–2.5° are obtained. Whilst this is much lower than the value of 15°and more shown by Wisnom
21
and recently by Fuller and Wisnom,22,23 the use of a material system with lower strain at failure may be the main reason for the smaller angle change. The significant fibre rotation has an influence on the TDR and shear stresses because the calculations of both values use transformation of the strains to a fibre-aligned coordinate system under the assumption of 45° orientation of the fibres to the load application. A transformation adjusting for the observed fibre rotation is presented in the following subsection. Change in fibre angle over the absolute normalised force in quasi-static tests.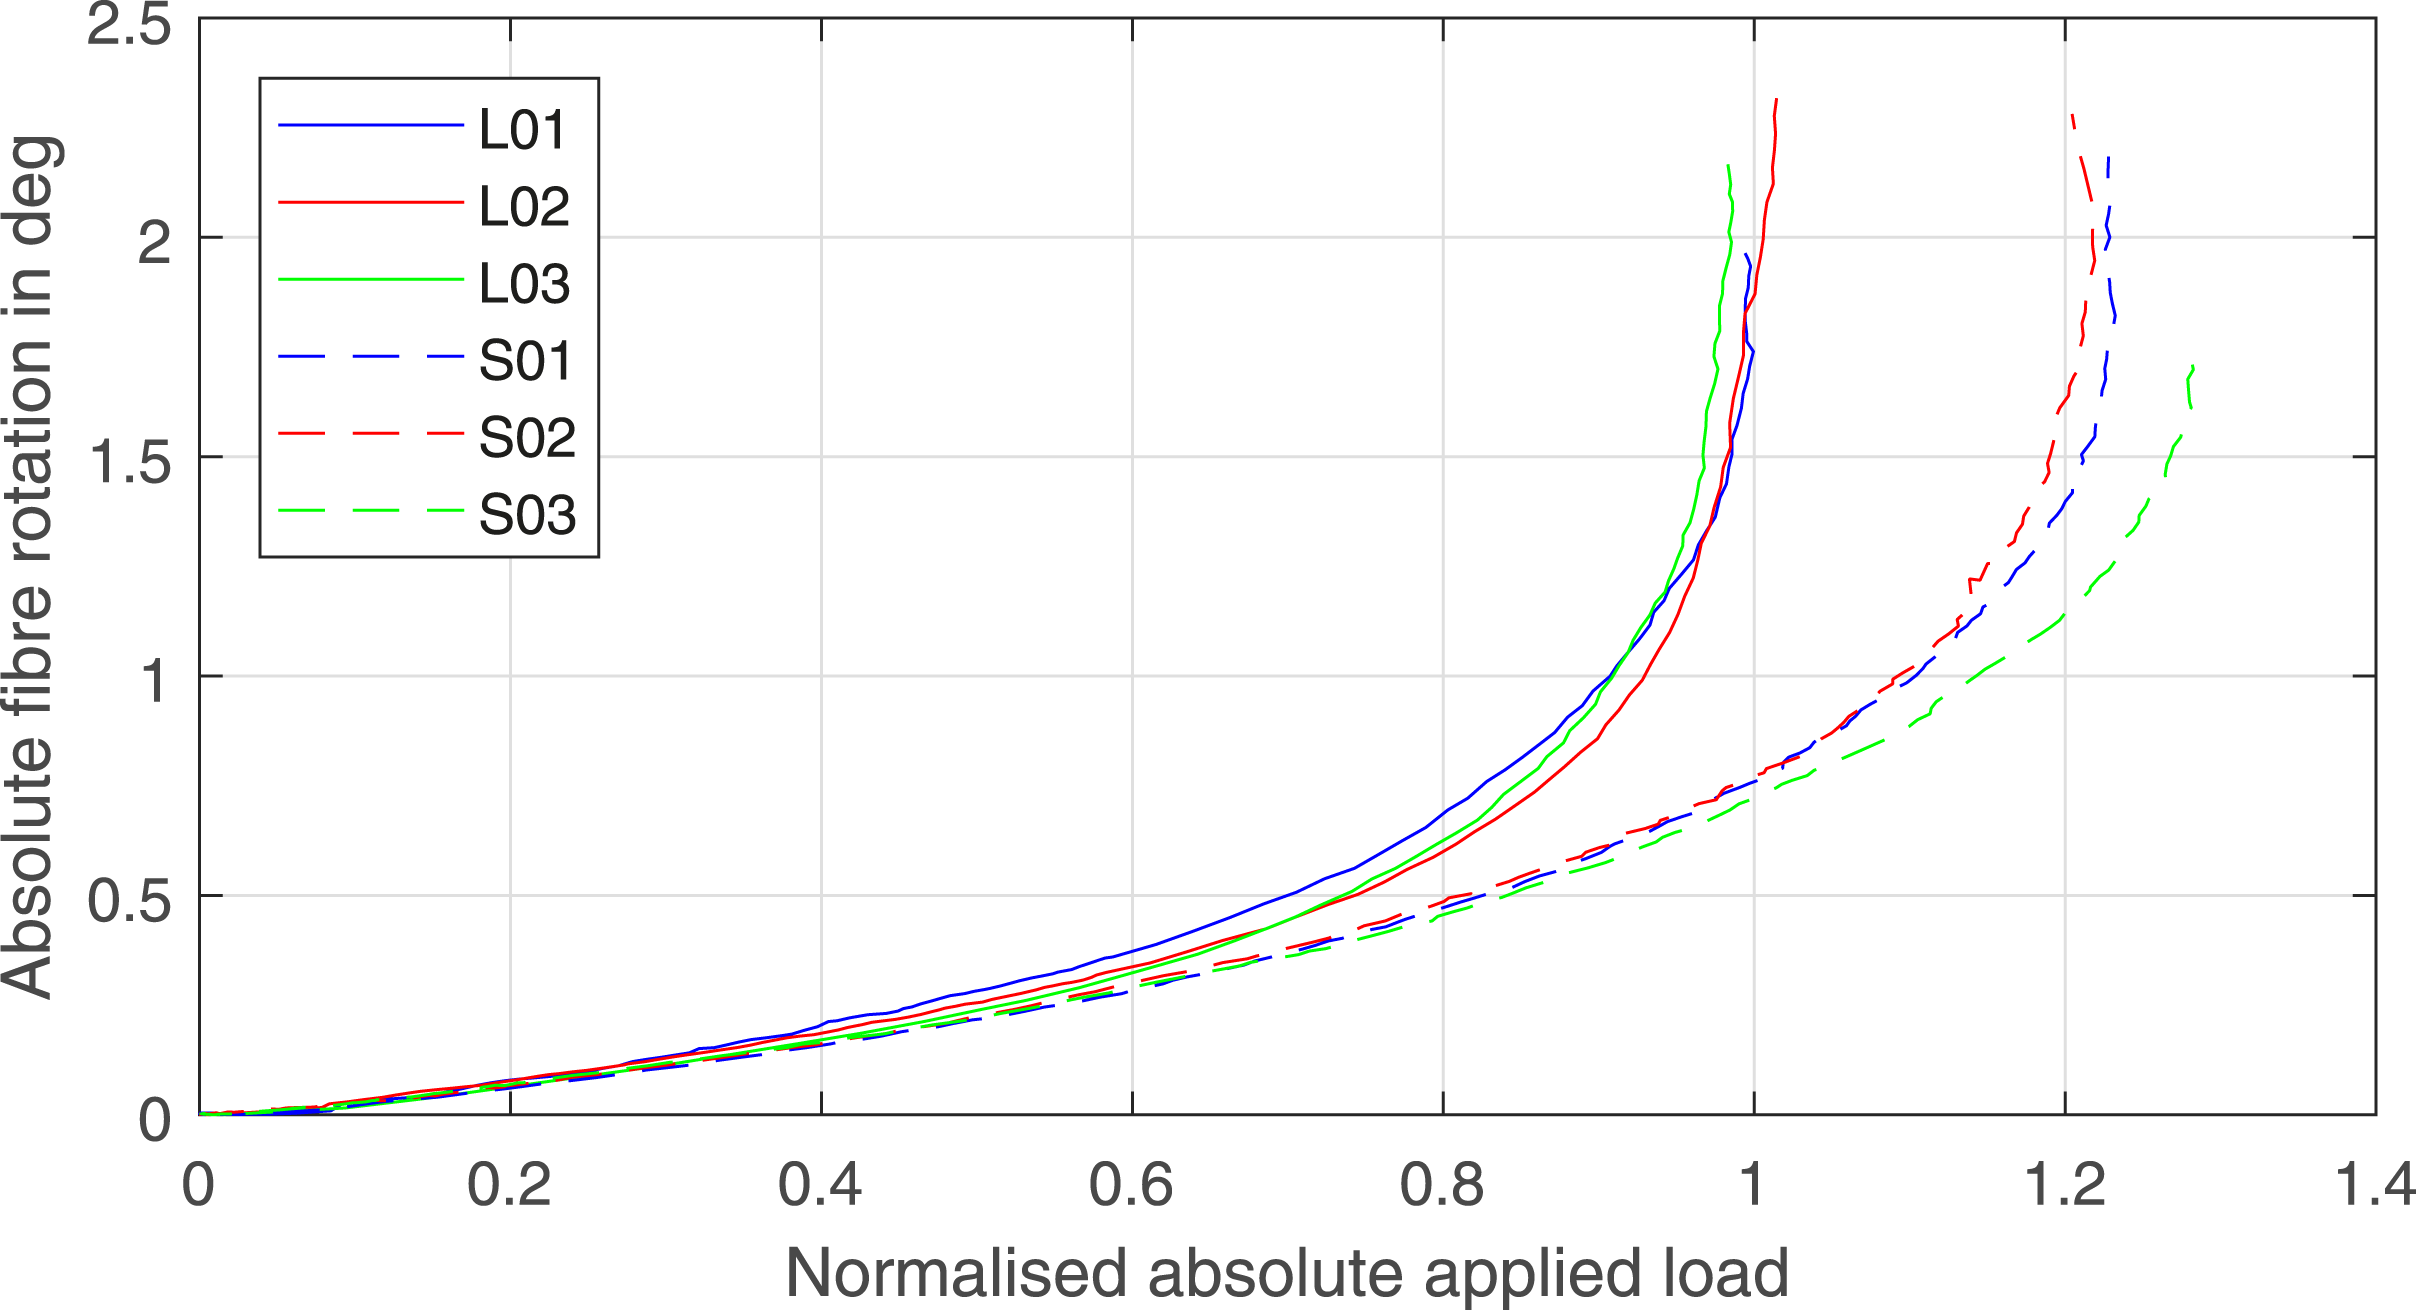
With the knowledge of fibre rotation during testing, a correction to the shear stress-strain relationship can be applied. Using shear stress and strain definitions from CLT adjusted to the measured fibre angle θ, i.e. τ12,adj = − cos θ sin θσ
x
and γ12,adj = 2(ɛ
y
− ɛ
x
) sin θ cos θ, a correction factor γ12,adj/γ12,45° can be calculated. Figure 12 shows the correction factor for tensile and compressively loaded specimens. The maximum deviations from the results obtained with the nominal ±45°-lay-up are between 0.002 and 0.004 for tensile specimens and between 0.002 and 0.003 for compressive specimens. This reduction in actual shear strength is negligible compared with the dispersion of the shear strength values in testing, which have a range of 2% and 9% for tensile and compressive loading, respectively. Correction factor of shear stress considering fibre rotation during the test. Compressive (left) and tensile (right) specimens.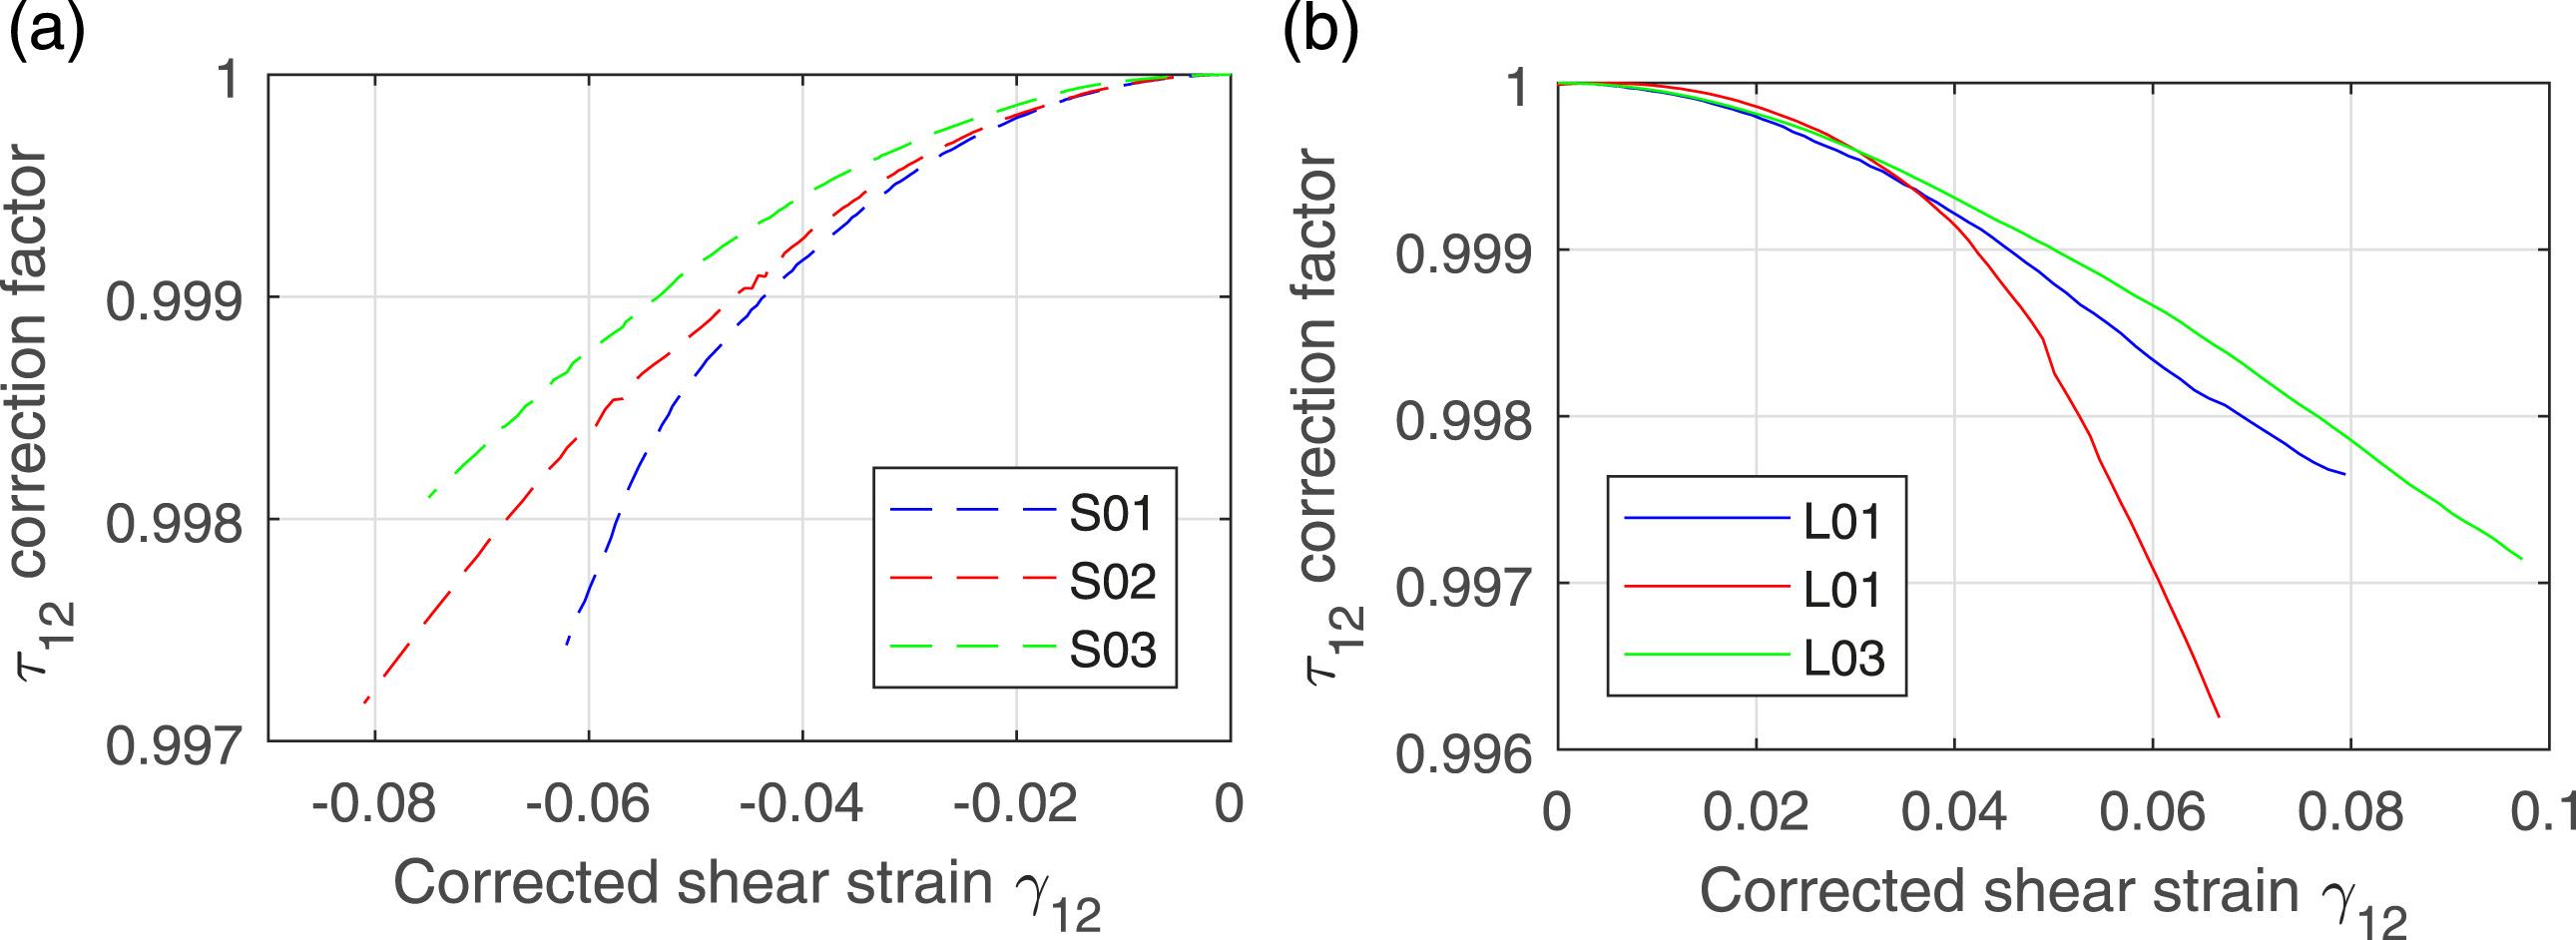
Correction of TDR to fibre rotation
The simple calculation formula for ν xy for ±45° laminates from CLT was shown in Equation (6). For the observed fibre rotation over quasi-static testing, a corrected TDR can be calculated. The CLT transformation formulae are given in the literature. 1
Figure 13 shows the change of TDR over fibre rotation. For a fibre rotation of 2°, yielding a ±43° lay-up, νxy,43,CLT = 0.838 is yielded, an increase by 9.8% to the nominal value. When comparing the linearised analytical curve with the measured values for tensile specimens, measured and predicted values show a similar trend. However, the discrepancy is significant with the measured value in Figure 9 much higher at values exceeding unity for large strains. This indicates the presence of plastic deformation of the matrix and damage in the laminate. The damage is most likely a combination of matrix cracking and delamination in the laminate. Change in TDR over fibre angle variation from CLT.
Assuming that the increase in TDR with large loads from plasticity or damage is permanent, the TDR could be used as a means of detecting damage from historic overloads, e.g. if ultimate load cases have been experienced in the operational life of a structure. Also, fatigue life estimation may be possible using TDR as a measure of damage. Other researchers have performed quasi-static sinusoidal load tests and have shown that there is a non-reversible change in the TDR. 13 As this was unfortunately not possible to validate experimentally with the limited number of specimen available for quasi-static testing, it remains scope of future research.
Fibre rotation induced change of shear properties can be included in the analysis by referring to Figure 14. Assuming 2° negative fibre rotation gives a linear reduction of TDR by 0.07 from Figure 13. Reducing the shear stress ratio by this value yields, together with the transversal stress effect, a combined reduction of the reported shear strength of short specimens in Table 2 in the range of 17%–30%. Correction factors for the shear stress and the shear modulus for short specimen from the derived formulas depending on the TDR.
The corrected shear strength and modulus values for short specimens is added to Table 1, and gives level results for long and short specimens, globally loaded in tension and compression. Table 2 shows a summary of the fibre rotations and TDRs.
Shear moduli and shear strength in short specimens are effected by two mechanisms: (i) additional compressive transversal stresses originate from the boundary conditions reduce the shear stresses τ12, see Figure 4(b); and (ii) the fibre rotation reduces the TDR, adding to the effect of (i). Effect (i) weakens over the test as the measured TDR increases, however remains below the Poisson’s ratio of the laminate, indicating reduced layer shear stresses compared to the unrestrained specimens. Additionally, mechanism (ii) reduces the TDR compared to the nominal fibre angle by a significant amount. The sum of these two effects adds to a normalised average shear strength correction for the short specimens from 1.25 to 1.07, or by 14.4%. Other mechanism potentially contributing to the remaining discrepancy in strength of short and long specimens but not related to the load direction are (iii) fibres that are clamped in both, top and bottom grips because of the short gauge length, and (iv) the size effect, which statistically reduces the strength of the longer specimens.
The shear modulus in the compressive specimen has been significantly reduced by the correction action. The physical explanation of this may be found in the biaxial stress state which is not uniform over the width. Furthermore, because of the restrained transversal contraction, the modulus is calculated over a different shear strain range. An additional potential reason is the onset of end tab constraint relaxation reported by Sevenois et al. 4 . Shear modulus estimation on short specimen is therefore not recommended with the current formula, and further research is necessary.
Conclusions
A method to correctly measure shear properties in short specimens and shear loads at high loads is presented which uses a load-dependent form of the Poisson’s ratio, the transverse deformation ratio (TDR). The main findings from the study are: • A biaxial stress state reduces τ12-stresses significantly and gives an overestimation of the shear modulus and shear strength for short specimens when calculated with formulas from standards as ASTM-D3518.
9
. • The change in TDR is positive for the considered laminate and originates from transverse cracking and shear non-linearity. • Fibre rotation in the specimen has no significant effect on the shear modulus, but influences the measured shear strength. • Correction formulas are given in this paper to be applied when using fibre reinforced polymers in shear-loaded applications where lateral contraction is inhibited. • Some more work is necessary to investigate the shear modulus correction in short specimens
Future work should also investigate the TDR evolution over the fatigue life of the material as there may be scope for using the TDR in overload monitoring of angle-ply laminates.
Appendix: Shear modulus of short specimens
This appendix introduces a correction for the shear stiffness G12 for test specimen with constraints introducing biaxial stresses, observable by a TDR νTD ≠ ν
xy
for membrane stress states. For balanced, symmetric ±45° laminates, the global longitudinal moduli 


Figure 14 gives the correction factors for specimens with measured TDR deviating from the CLT derived value. By considering the measured νTD = 0.57, the corrected shear stress is comparable to the results from FEA, presented in the main body, and the shear modulus is corrected to about 74% of the unrestricted CLT-obtained value. This reduces the normalised average modulus in compressive loading from 1.02 to 0.77 of the measured tensile value.
Footnotes
Declaration of conflicting interests
The author(s) declared no potential conflicts of interest with respect to the research, authorship, and/or publication of this article.
Funding
The author(s) received no financial support for the research, authorship, and/or publication of this article.