
Abstract
This paper reports hybrid composites based on polyaniline (PANI) and calcium titanate (CaTiO3) perovskite as a nanofiller synthesized by in-situ polymerization technique. Their structure and morphology were investigated by X-ray diffraction analysis and scanning electron microscopy. The XRD analysis shows that the addition of CaTiO3 in polyaniline reduced the amorphous structure of polyaniline transforming it into semi-crystalline nature, which agrees well with the higher conductivity. Scanning electron microscopy of composites showed a more compact and homogenous structure with uniform distribution of CaTiO3 in the polymer matrix. Dielectric parameters such as dielectric constant, loss factor, and dielectric loss, real and imaginary parts of electric modulus were measured and evaluated as a function of frequency and temperature as well. The variation of dielectric properties and ac conductivity reveals that the dispersion is due to the Maxwell-Wagner type of interfacial polarization. The observed ac conductivity behavior of polyaniline in the presence of calcium titanate was discussed in the framework of Jonscher’s power law. The result showed that ac conductivity increases with the rise of the frequency of applied field and temperature analogous to the semiconducting behavior of composites. Temperature-dependent behavior of frequency exponent seems to obey correlated barrier hopping conduction mechanism. The relaxation behavior of the synthesized samples was analyzed by the electric field modulus and was found to decrease with temperature and CaTiO3 content and increase with frequency.
Introduction
Polyaniline (PANI), among other conducting polymers, is one of the most promising candidates owing to its outstanding tunable conductivity, environmental stability, stable chemical structure, low cost, and simple synthesis process. 1 Composites of conducting polymers combined with suitable fillers exhibit modified properties that are unattainable with pure polymers. 2 Hybrid composites are very attractive materials due to their potential applications including supercapacitor, 3 multipurpose photocatalysts, 4 sensors, 5 energy harvesters, 6 EMI shielding, 2 etc. Research on hybrid composites in recent years has revealed excellent improved properties such as PANI/MWNTs, 7 PANI/BaFe12O19, 8 PANI/Al2O3, 9 PANI/Ti3C2Tx/TiO2, 10 and PANI/V2O5, 11 etc.
Well-known titanate material, calcium titanate (CaTiO3) perovskite material, is a promising candidate for high energy storage applications due to its high resistivity, high dielectric constant, and low dielectric loss. 12 Applications of calcium titanate perovskite material include capacitors, 13 thermally sensitive resistor elements, 14 electrodes, 15 varistors, 16 etc. Temperature-dependent dielectric and electric modulus analysis studies of a composite conducting polymer with calcium titanate perovskite material are scarce. Hence, we intended to study the hybrid composites by combining the organic-inorganic properties. For any electrical applications, temperature-dependent dielectric properties and electric modulus behavior of composites are studied for the effective utilization of materials as energy storage devices.
Through the survey of literature it was found that the addition of Calcium titanate perovskite in the polyaniline matrix has resulted in the improved structural, electrical, and dielectric properties. 17 A. Perveen et al. have reported the more stable structure of PANI composites in room temperature by the addition of CaTiO3 perovskite but ac conductivity values thus obtained were low (in μ S/cm). 18 And the detailed mechanism of temperature-dependent dielectric and electrical modulus formalism have not been studied yet. For the said purpose, this paper mainly focuses on the detailed dielectric properties and electric modulus subjected to variation of temperature and frequency, since this mode of analysis is absent in the literature.
In this paper, in-situ polymerization of aniline was done in the presence of ammonium persulfate as an oxidant with different weight percentages of calcium titanate perovskite. Further, we analyzed the dielectric permittivity and electrical modulus in the range 70 Hz to 1 MHz with varying temperatures in the range 303 K–403 K, and compared the morphological and structural differences which depend on the content of calcium titanate as filler in the prepared samples. The main result is that increasing the content of calcium titanate improves the dielectric permittivity, electric modulus behavior, and electrical conductivity as well. To analyze the correlation of the dielectric permittivity and electric modulus to the morphological and structural characteristics of the composites scanning electron microscopy and X-ray diffraction was applied.
Experimental part
Materials
Aniline was purchased from Riedel–de–Haen. Hydrochloric acid (HCl) was provided by Fluka and ammonium persulfate (NH4)2S2O8 (APS) was provided by Merck. All other materials were used as provided without any further purification.
Synthesis of Polyaniline (PANI)
0.05 mol of aniline was added dropwise in 30 mL distilled water within a period of about 1h and stirred for 6h. The pH of the solution was kept at 0–1 by the dropwise addition of HCl in the above solution. By keeping monomer to oxidant ratio 1:1, 11.409 g of ammonium persulfate (APS) [(NH4)2S2O8] solution was added dropwise for about a period of 30 min. The greenish black color of the composite confirmed the polymerization reaction. The solution was filtered and washed as the polymerization process was completed after 24 h. Then obtained paste was kept in a vacuum oven for 24h at 60oC.
19
The schematic illustration of the synthesis of PANI and calcium titanate perovskite composites is shown in Figure 1. Schematic illustration of preparation of PANI/CaTiO3 composites.
Synthesis of polyaniline and calcium titanate perovskite composites
CaTiO3 was dispersed with 2.5, 5, and 10 wt% of polyaniline into 1M HCl. In order to keep CaTiO3 suspended in the solution, 0.05 mol of aniline was added to form aniline hydrochloride. A stoichiometric amount of APS was added slowly and kept on a stirrer for 4–6 h.
17
The suspension was left for 24 h to complete the polymerization. Then obtained dark green paste was washed with distilled water and methanol until the filtrate become colorless. The precipitate was finally dried at 60
Measurements
Scanning electron microscopy (SEM) was carried out using a Tescan Vega three instrument. X-Ray powder diffraction analysis was carried out using an automated diffractometer, PanalyticalX'Pert PRO equipped with Cu Ka radiations (
Dielectric permittivity was carried out using the following equation

If C
p
is the equivalent parallel capacitance and C
o
= (0.08,854 × A/d) pF is the geometrical capacitance in a vacuum with the same dimensions as that of the sample,
The loss of energy in an insulating material can be measured by the phase (δ) relation of current and applied voltage as
21

The dielectric loss

A.C. conductivity (

Results and discussions
X-ray diffraction analysis
As it is obvious from the XRD patterns of pure PANI (Figure 2(a)), centering around 25.251°, a single broad diffraction peak which testifies its amorphous nature.
18
Pure CaTiO3 perovskite, Figure 2(e), 2θ diffracted peaks are viewed at 23.243°, 33.102 X-Ray diffraction patterns of (a) PANI, (b) PANI/2.5%CaTiO3, (c) PANI/5% CaTiO3 (d) PANI/10% CaTiO3, and (e) pristine CaTiO3.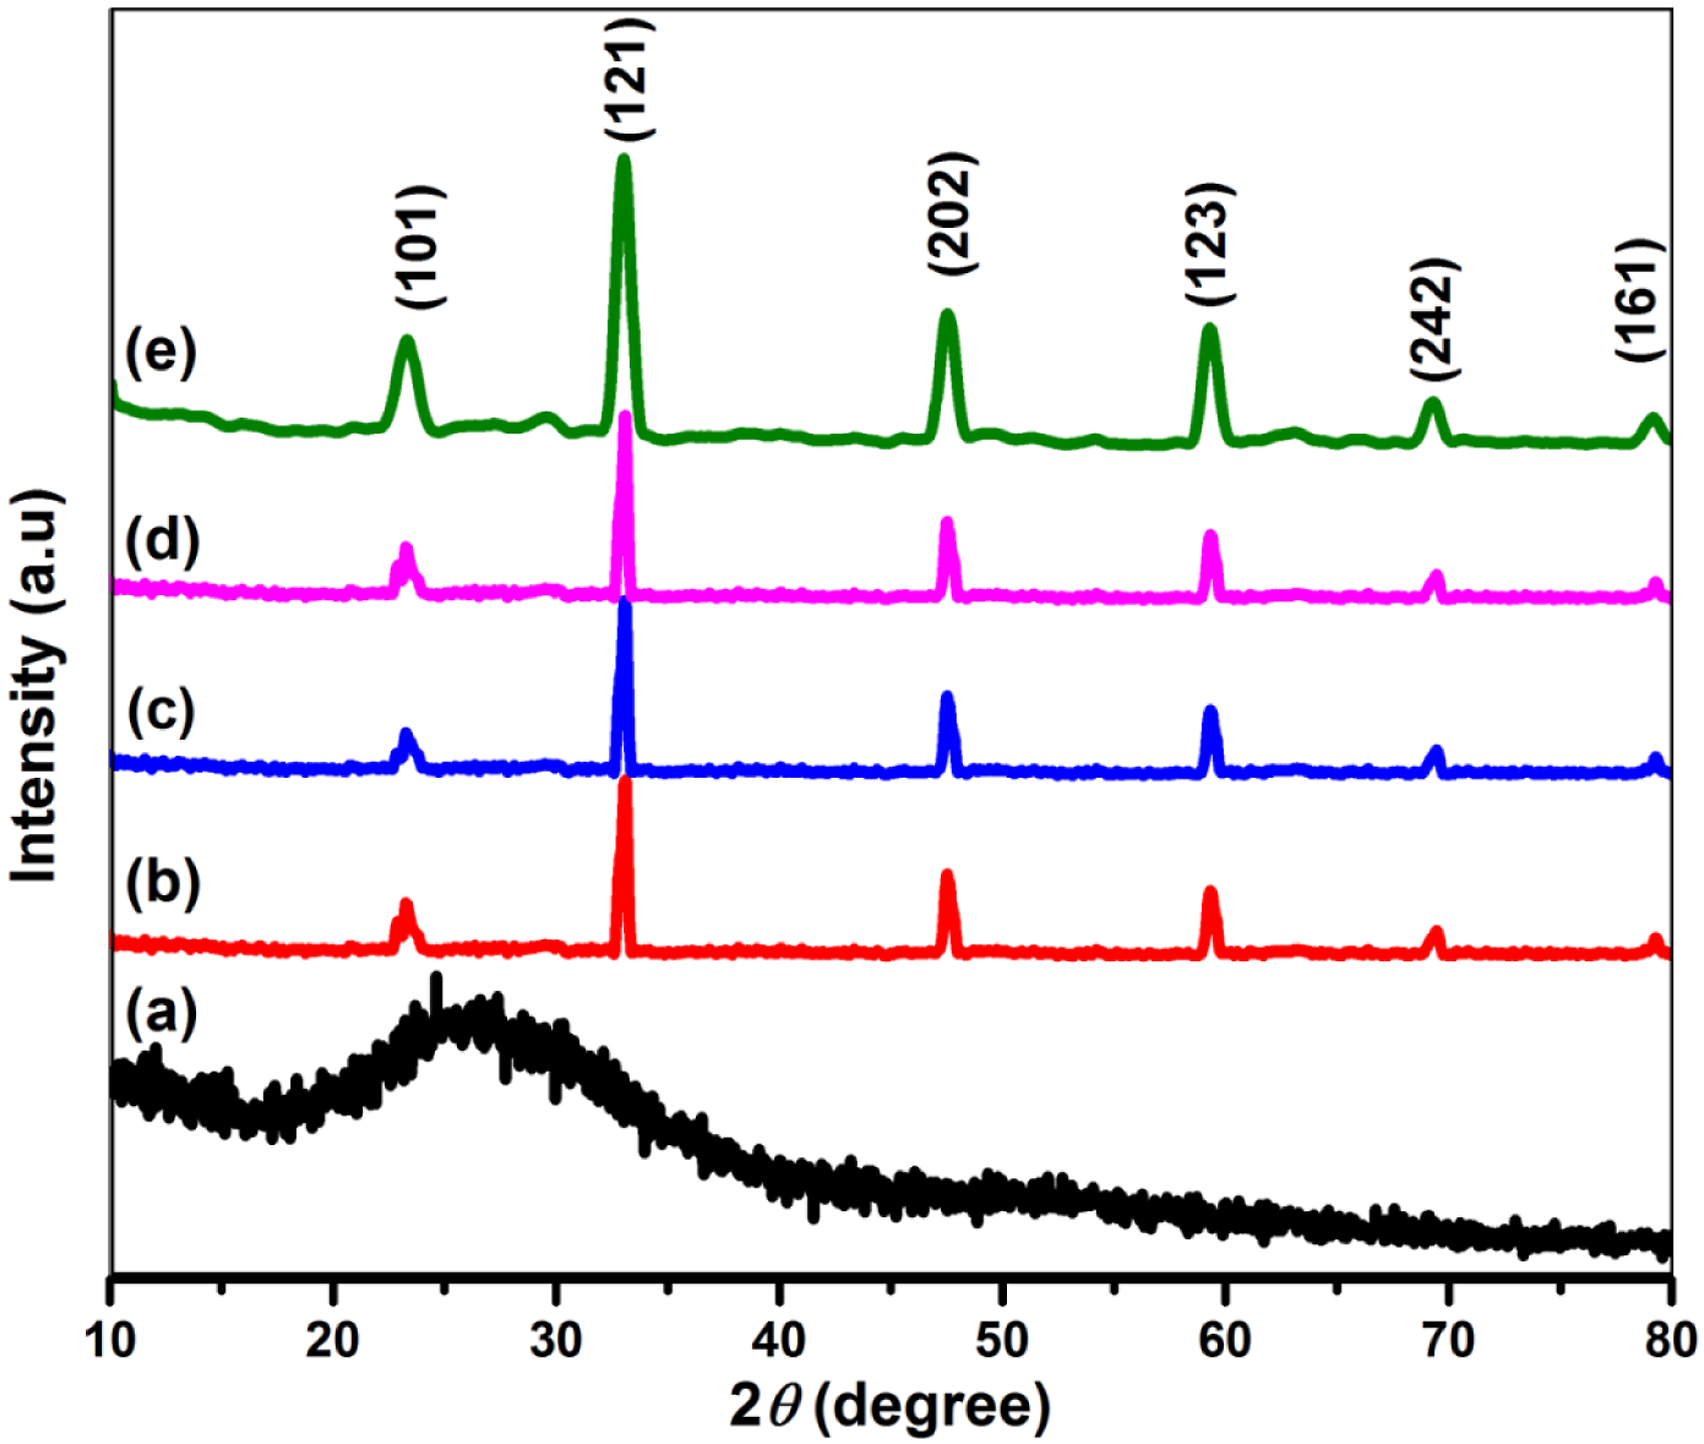
As far as the PANI/CaTiO3(Figure 2(b) to (d)) perovskite composites concerned, it is clearly shown that with the increase in concentration of perovskite CaTiO3 in polyaniline, the intensity of the characteristic peak of PANI at 25.251° is suppressed while all major crystalline peaks of perovskite CaTiO3 stimulated and intensified in all three composites. The analysis of characteristics peaks reinforces the semi-crystalline behavior of composites while reducing the amorphous nature of polymer matrix.
SEM Analysis
The morphology of PANI and its composites was studied via SEM analysis; which results are shown in Figure 3. Figure 3a shows the agglomerates of irregularly distributed interconnected nano-sized polymer granular having characteristic heterogeneous and flaky morphology of PANI.
23
Polymerization conditions such as temperature, pH, and duration of polymerization can affect the morphology and size of nanocomposites particles.
24
As far as the micrograph PANI/2.5% CaTiO3 perovskite composites concerned (Figure 3(b)) exhibit the formation of rough and agglomerates of perovskite embedded in the PANI matrix. SEM micrographs of (a) PANI, (b) PANI/2.5%CaTiO3, (c) PANI/5% CaTiO3, (d) EDX of PANI/5% CaTiO3, (e) PANI/10% CaTiO3, (f) EDX of PANI/5% CaTiO3, and (g) CaTiO3.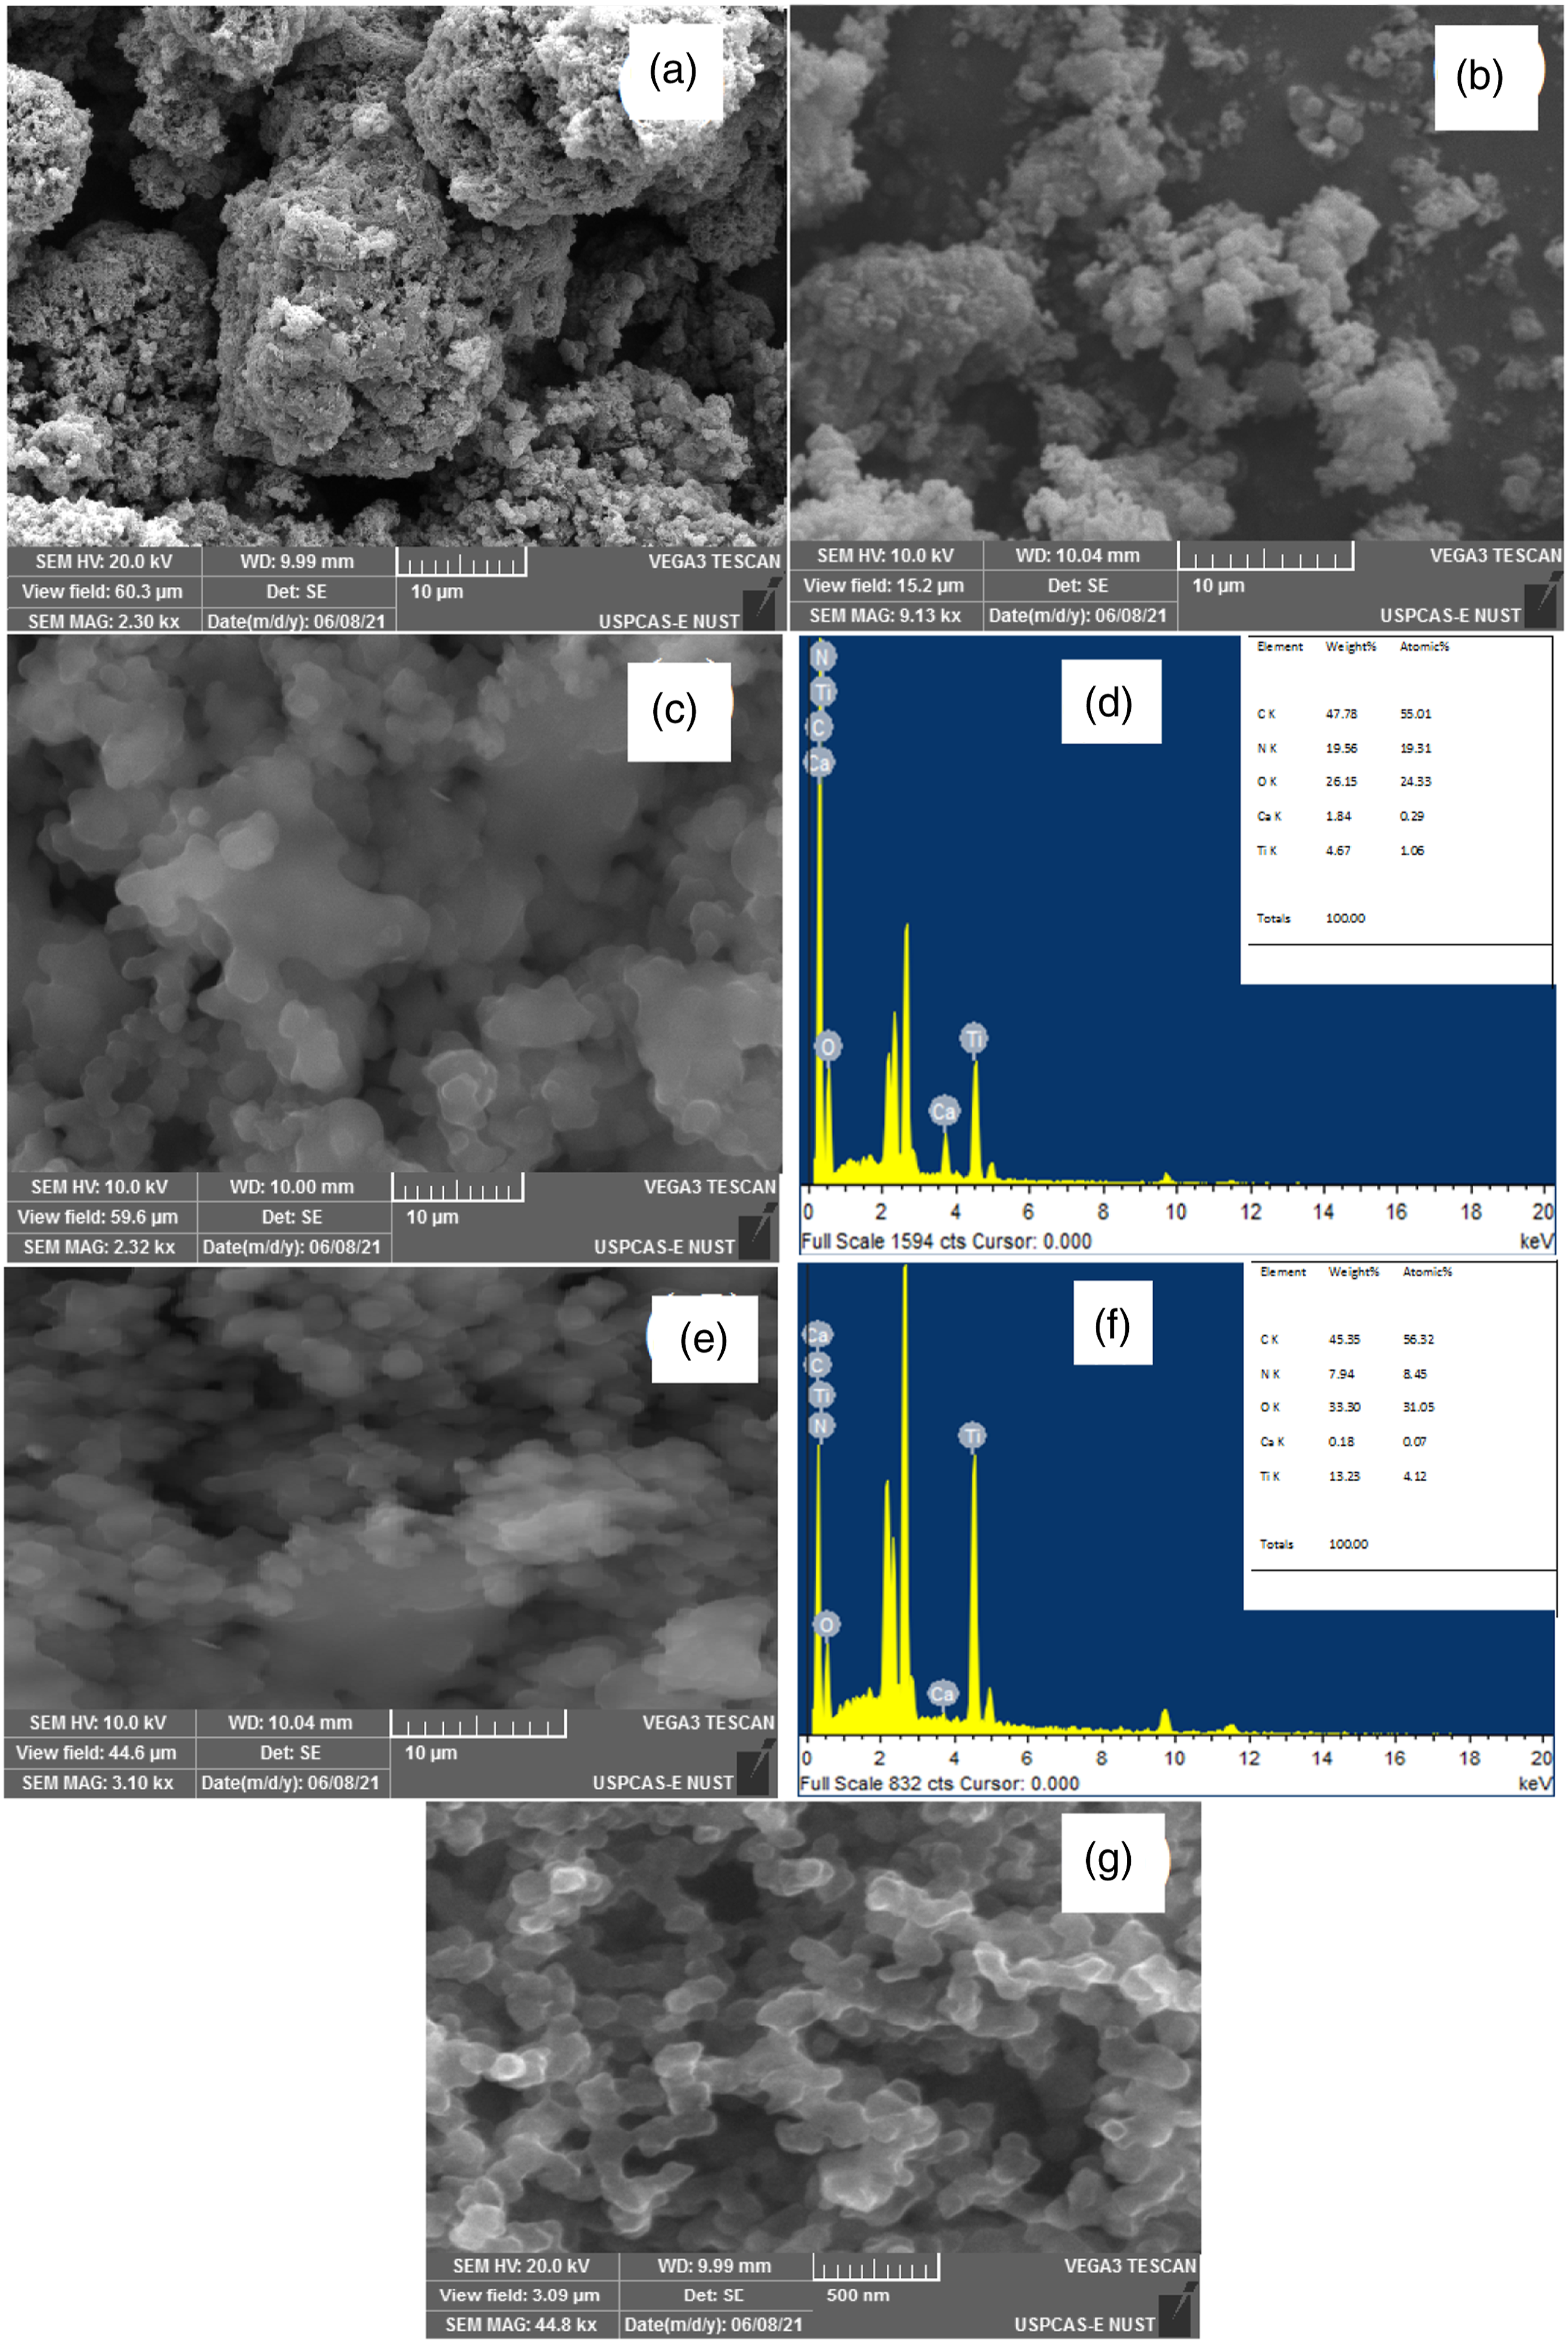
Interesting morphology was observed in the case of its composites, as in 5% and 10%CaTiO3 (Figure 3(c) and (e)), CaTiO3 was uniformly distributed within the polymer matrix exhibiting a more compact and homogenous structure with uniform distribution of CaTiO3 in the polymer matrix with crystalline regions in addition to the amorphous structure of the polymer. Morphology of CaTiO3, Figure 3(g), represents nanometer-sized uniformly shaped ordered grains which result in the formation of larger contacts. The composition of the samples and purity was confirmed by the energy dispersive X-ray (EDX). It is clear from the EDX of PANI/5%CaTiO3 and PANI/10%CaTiO3 perovskite, (Figures 3(d) and 3(f)), all major elements carbon (C), oxygen (O), nitrogen (N), calcium (Ca), and titanium (Ti) are present testifying the presence of CaTiO3 in the PANI matrix. The stoichiometry of the obtained product is tabulated according to wt% and atomic% inside Figure 3.
Frequency dependent dielectric behavior
Complex permittivity as a function of frequency was described by the following formula

The real part Dielectric constant for (a) PANI, (b) PANI/2.5% CaTiO3, (c) PANI/5% CaTiO3, (d) PANI/10% CaTiO3.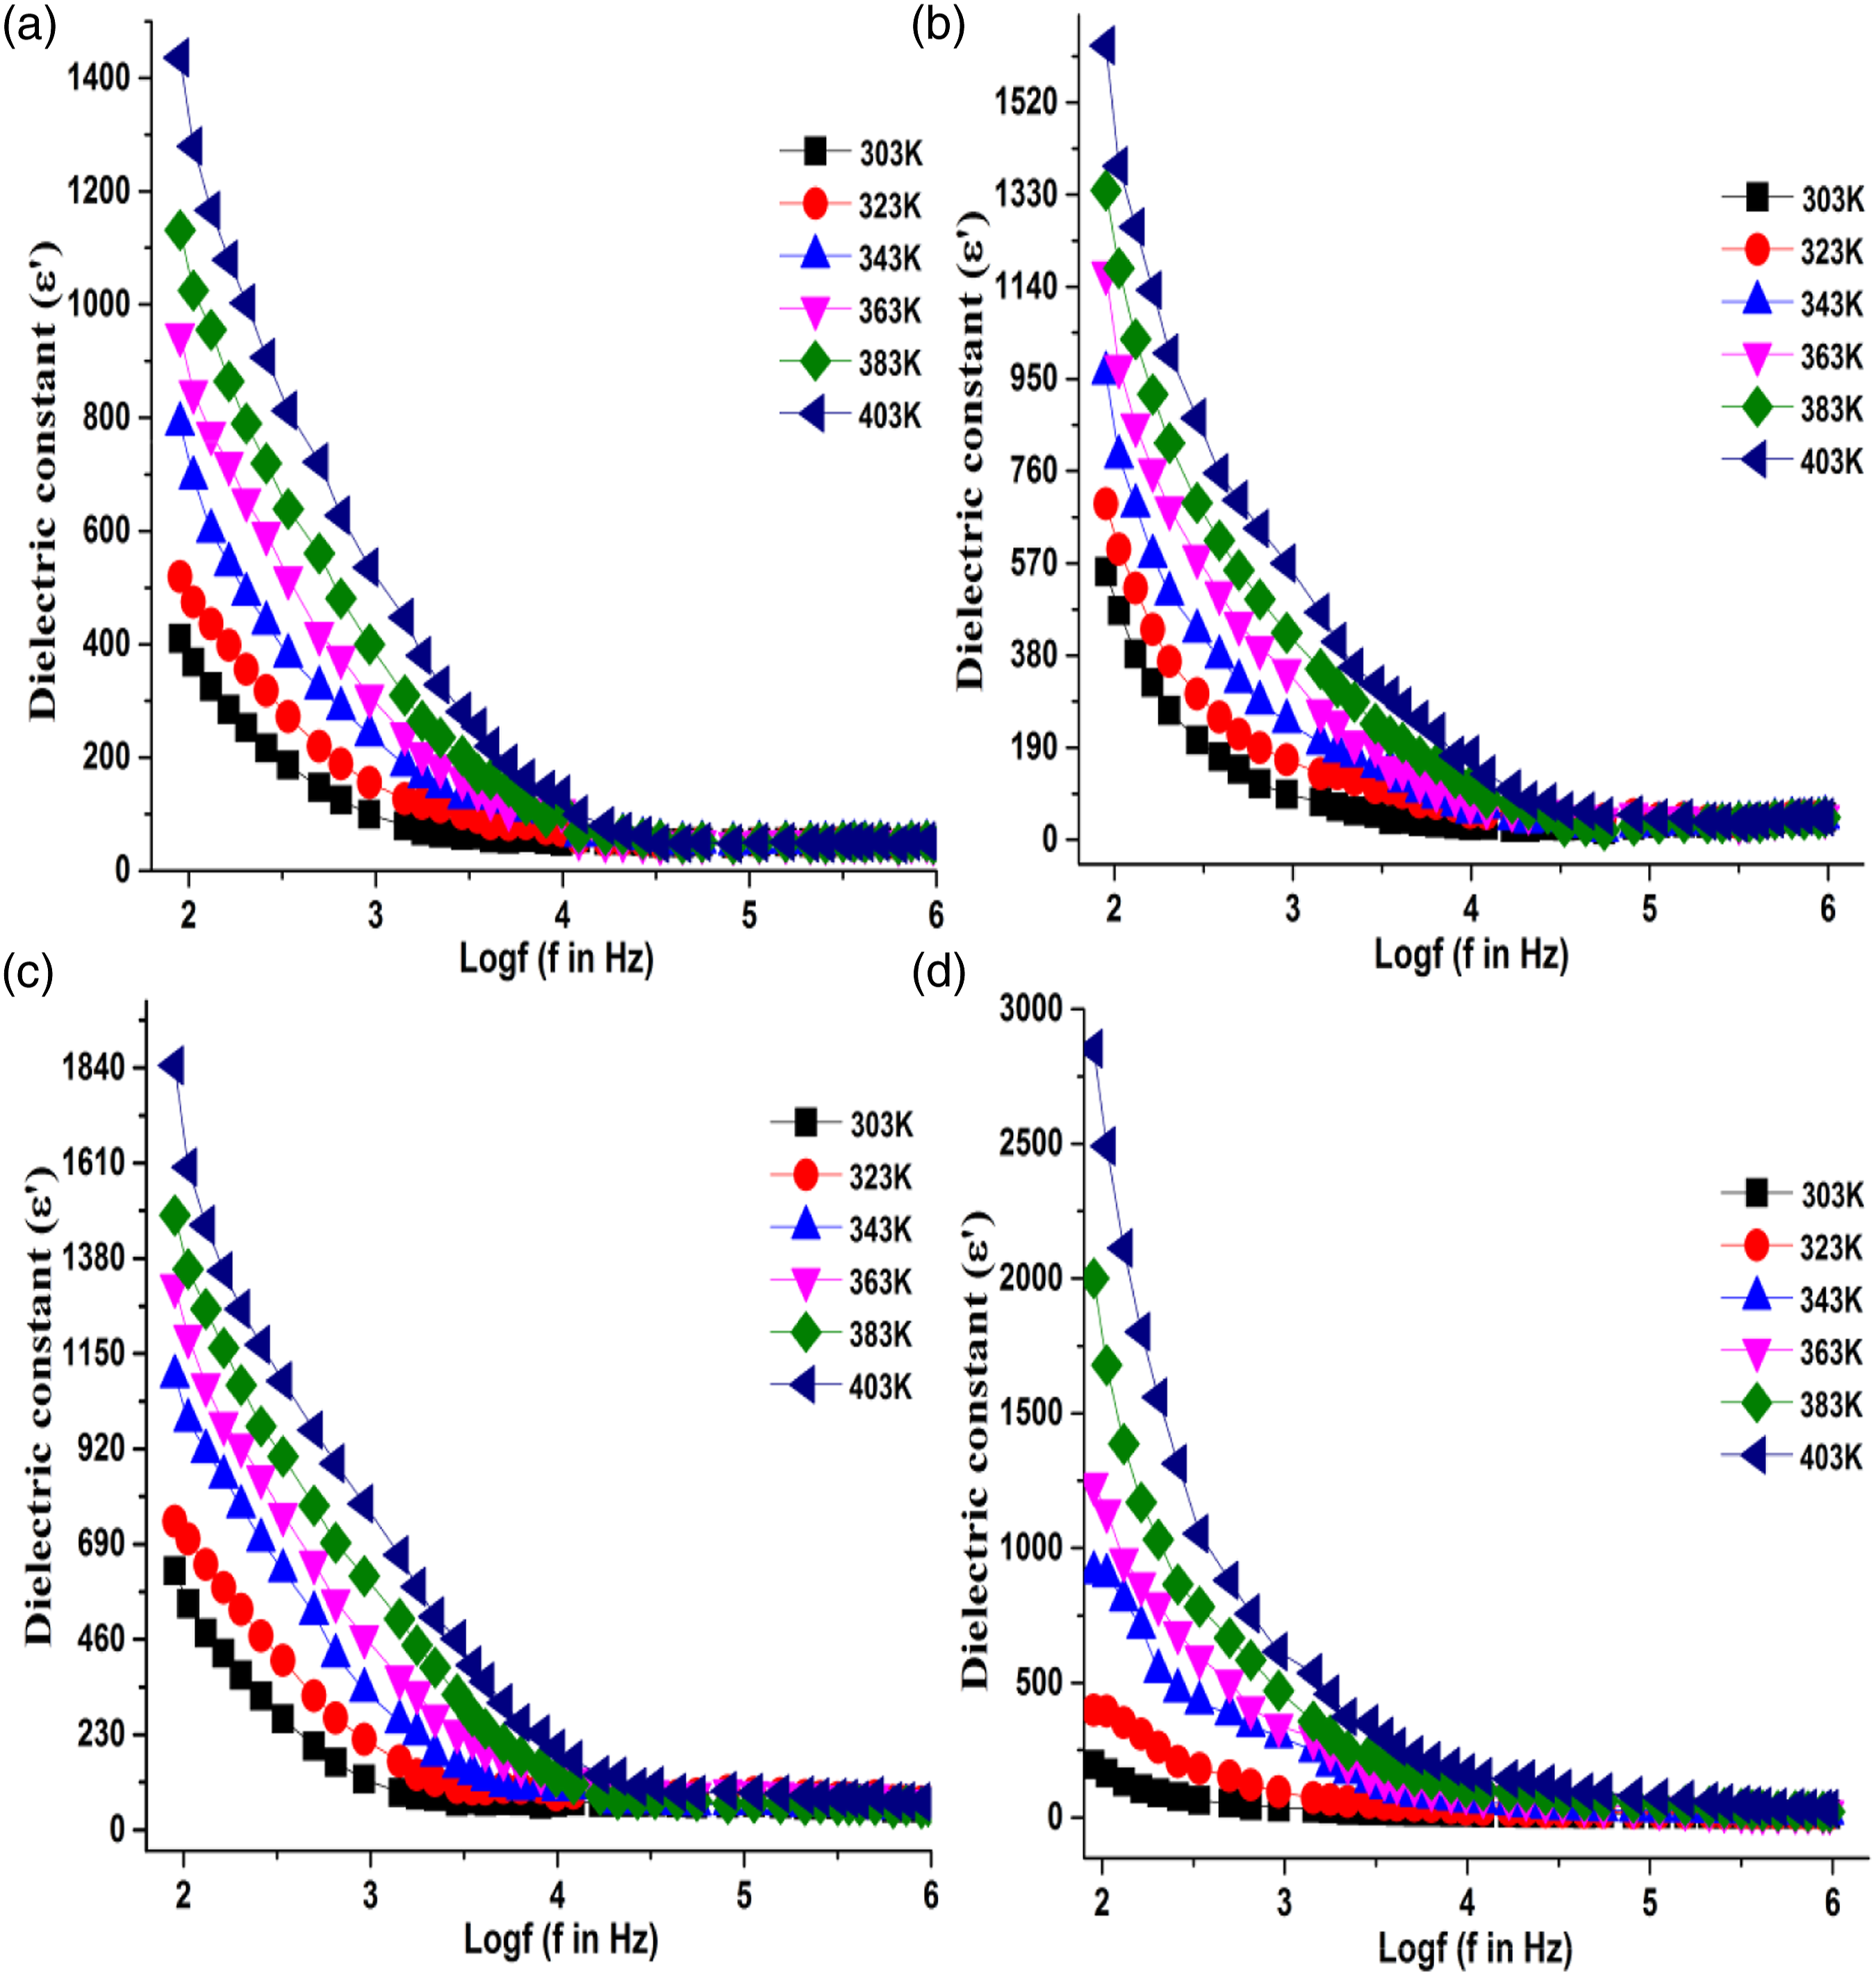
It is observed that permittivity values increase with the increase of CaTiO3 weight percentage in PANI as well as applied frequency. In general, the dielectric constant of dielectric material is a contribution of electronic, atomic, ionic, orientational and, interfacial polarization mechanism. 25 The composition, frequency, microstructure, and type of interatomic bond can influence their contribution to the total polarization mechanism. 26
Electronic polarization is predominant at an ultra-high frequency (
Atomic polarization is due to the vibration of chemical bonds at a high frequency (
Composites of polyaniline with CaTiO3 show higher dielectric constant values than pure polyaniline which may possibly be attributed to the presence of more interfacial faces as already been reported in the literature.7,9,30-31 Interestingly, it is observed that the dielectric constant has higher values only at a lower frequency and very high temperatures which may be attributed to the higher segmental mobility of charges that pile up at the interfaces within the bulk of the sample known as Maxwell-Wagner polarization.32-36 Electrode polarization effect is ruled out in this case because the dielectric properties do not change with electrode materials and with the thickness of the sample as well.
Both dielectric constant and dielectric loss usually exhibit similar trends. By using equation (3) the dielectric loss was calculated and is given in Figure 5 as a variation of the frequency of pure PANI and PANI/CaTiO3 composites. Dielectric loss for (a) PANI, (b) PANI/2.5% CaTiO3, (c) PANI/5% CaTiO3, (d) PANI/10% CaTiO3.
The dielectric loss is produced by three distinct effects
37

Figure 6 depicts the loss tangent spectra of polyaniline and its composites, where relaxation peaks are observed. The peaks for relaxation were found to be shifted towards the higher frequency region indicating the increased relaxation frequency with the temperature. The decrease in tangent loss with the increase in frequency is the typical characteristic of conjugated compounds. Hence our results are in accordance with the already reported data.57,58 Tan δ for (a) PANI, (b) PANI/2.5% CaTiO3, (c) PANI/5% CaTiO3, (d) PANI/10% CaTiO3.
Different formalisms like loss tangent, electric modulus, and dielectric loss can be used to interpret dielectric spectra. According to McCrum
42
formalism, the real (M′) and imaginary (M″) parts of the complex electric modulus can be calculated from ε′ and ε″ values using the relations
43


M′ and M″ are plotted in Figure 7 and Figure 8 as a function of frequency at different temperatures ranging from 303K-403 K. Both the figures show the decrease in relaxation strength with the increase in temperature and CaTiO3 content within the composite samples. Real part of electric modulus M’for (a) PANI, (b) PANI/2.5% CaTiO3, (c) PANI/5% CaTiO3, (d) PANI/10% CaTiO3. Imaginary part of electric modulus M˝ for (a) PANI, (b) PANI/2.5% CaTiO3, (c) PANI/5% CaTiO3, (d) PANI/10% CaTiO3.

As compared to M′, a slight broadening of the M″ curves exhibits conductivity relaxation peaks, which are dependent on the relaxation time constant Figure 8. Frequency and temperature-dependent imaginary part of electric modulus M″ generally provides information concerning the nature of charge transport mechanisms such as conductivity relaxation and electrical transport. The shift of asymmetric peaks towards higher frequency regions is attributed to the mobility of mobile charge carriers. High-frequency peaks suggest the confinement of ions in their potential well while the low-frequency relaxation peaks are related to the suppression of the electrode polarization effect. 44 The spectrum of modulus confirms the electrical conduction mechanism is due to the hopping mechanism. 45
Figure 8 depicts that the relaxation peak of complex modulus shifts towards a higher-frequency region with the rise of temperature. So it may be concluded here that the hopping mechanism of charge carriers is dominating due to thermal activation of the relaxation process. Relaxation time (τ = 1/fmax) becomes shorter while increasing polaronic hopping rate with the rise of CaTiO3 content. This may be attributed to the increased chain ordering, interaction between the host polymer and CaTiO3 perovskite, which is in agreement with the XRD and SEM results, and enhancement in charge carrier mobility. 46
AC Conductivity
Figure 9 shows the variation of ac conductivity of PANI and its three composites with respect to the frequency of applied field by using equation (4). A similar increasing trend of ac conductivity was noted respecting to the frequency of applied external electric field, temperature, and increasing content of CaTiO3 for the composites. Frequency-dependent response of ac conductivity may be explained perfectly by the Maxwell-Wagner model.47,48 AC conductivity for (a) PANI, (b) PANI/2.5% CaTiO3, (c) PANI/5% CaTiO3, (d) PANI/10% CaTiO3.
From the obtained results, it is revealed that the conductivity increases with the increase of CaTiO3 content. As per the dynamic relaxation process, the relation between the conductivity and angular frequency

At the low applied ac field frequency, σ
o
is dominant that can be explained on the basis of Mott’s hopping,
50
where f < fc

At the high applied ac field frequency, the charge transport mechanism in disordered materials can be well explained on the basis of Jonscher’s power law
51
where f

σac increases with rising of temperature and concentration of CaTiO3 perovskite as well. This increase in conductivity may be linked to the formation of more efficient conductive networks in the interface which facilitates the motion of the charge carriers within the polymer matrix. Higher frequency response of conductivity may possibly be related to two reasons: firstly the straightening and alignment of polyaniline chains as confirmed by the XRD and secondly related to the higher degree of freedom of movement in the dipole molecular chains of polyaniline. From Figure 7, frequency exponent s was calculated for PANI and its three composites and given in Figure 8 for the temperature varying from 303K-403 K. Depending on the variation of s with respect to temperature and frequency, different theoretical models such as the small polaron tunneling model (SPT), correlated barrier hopping model (CBH), quantum mechanical tunneling model (QMT) were employed to explain the conduction mechanism for the composites. Among these models, the CBH model was found to be dominating. S.R. Elliot proposed CBH model
53
in which frequency exponent s decreases with the increasing temperature that are related to hopping of charge carriers through the barrier as evident from Figure 10(a). (A) Frequency exponent (s) and (B) 1-s versus Temperature (K) for (a) PANI, (b) PANI/2.5% CaTiO3, (c) PANI/5% CaTiO3, (d) PANI/10% CaTiO3.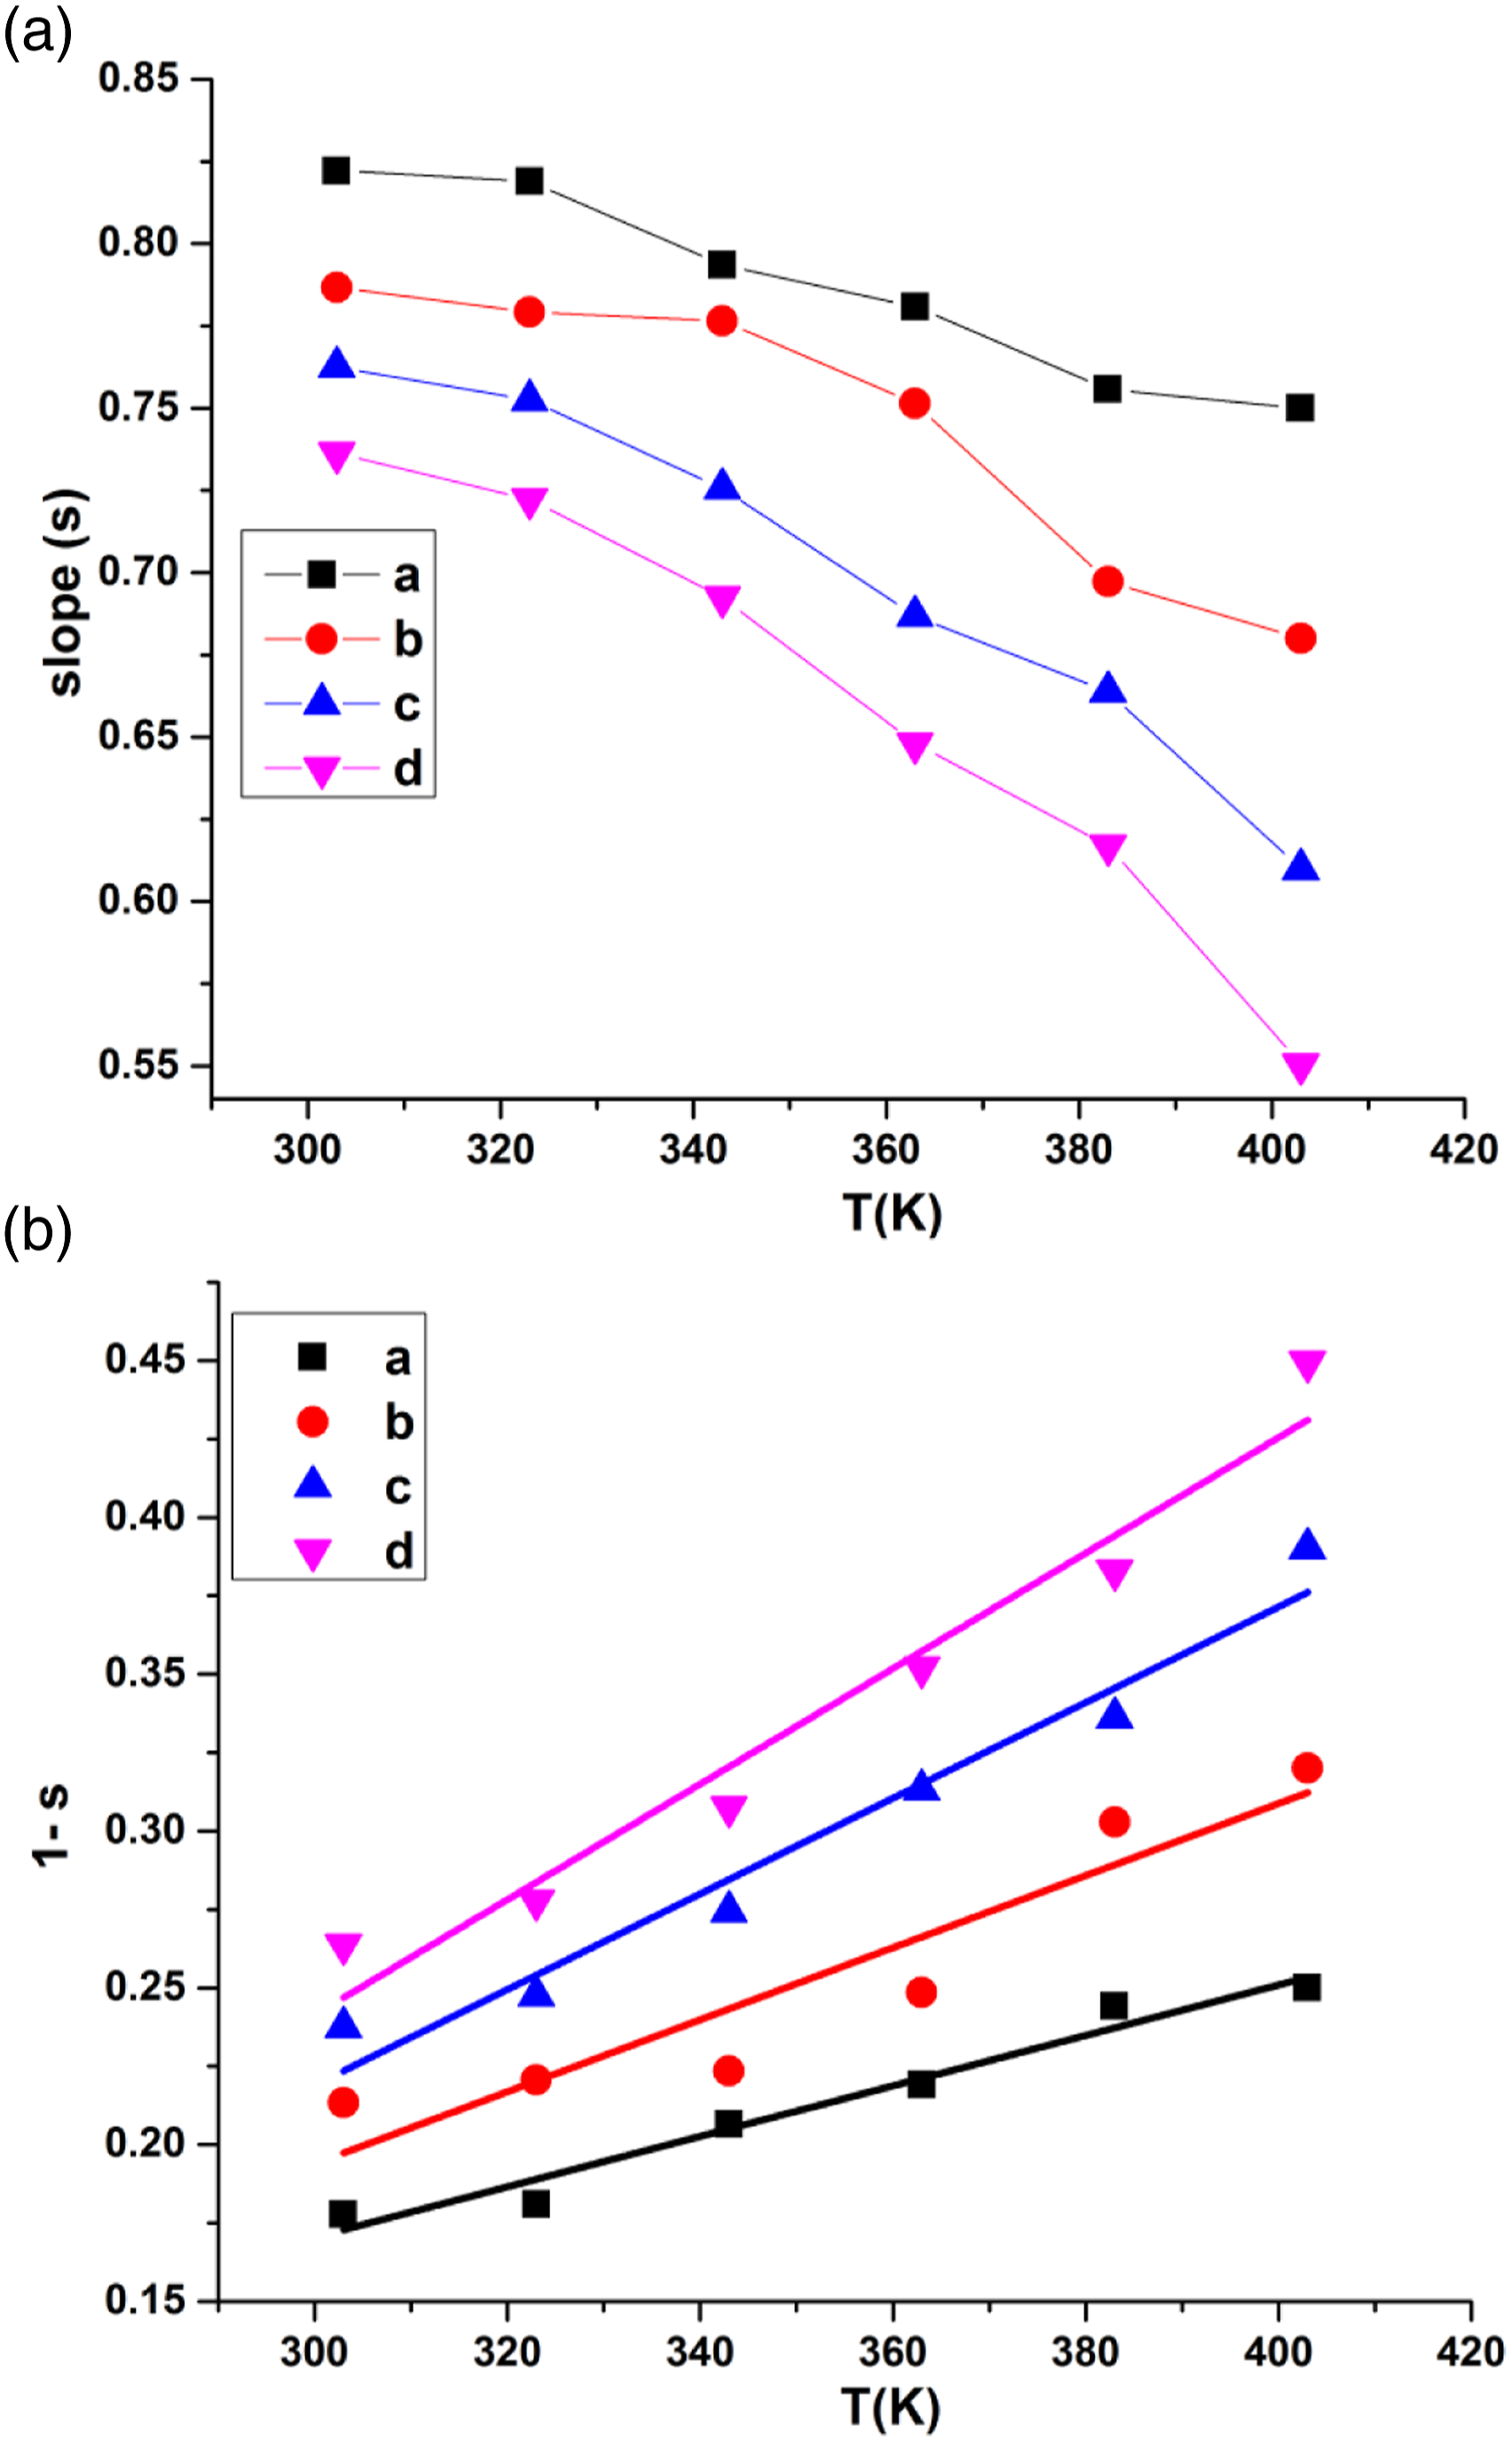
By using the CBH mechanism model, barrier height was calculated by using the following equation
53

The electrical conductivity (σac) of the composites exhibits temperature dependency and is given by Arrhenius law as follows
55
Log σac vs 1000/T for (a) PANI, (b) PANI/2.5% CaTiO3, (c) PANI/5% CaTiO3, (d) PANI/10% CaTiO3.

This phenomenon may be associated with the enhancement of electronic jumps under applied field frequency between the localized states. This testifies that the hopping of charge carriers is the only dominating phenomenon in our samples.21,56 The increment in conductivity values and decrement of activation energy with the increase of CaTiO3 content reinforces that minimum energy is required to migrate the charge carriers from one site to another.
Conclusions
In summary, polymer and its composites with CaTiO3 were prepared by in-situ polymerization. Increasing the CaTiO3 concentration increases the conductivity and dielectric properties of the composites. The polymerization of aniline in the presence of CaTiO3 causes a tremendous change in the XRD from an amorphous pattern of pure PANI to a semi-crystalline pattern. SEM also reinforced the XRD patterns that suggest good compatibility of PANI and CaTiO3. Correlated barrier hopping (CBH) was found to be the more dominating model for analyzing ac conductivity. The increase in the peak frequency of electric modulus has led to a shorter relaxation time and thus an increasing the polaronic hopping rate in the composites with higher CaTiO3 content. Incorporation of CaTiO3 perovskite in the host PANI matrix has given potential materials with improved electrical and dielectric behavior that can pave the way towards energy storage devices like capacitors and as well as energy harvesters and other significant technological and scientific importance.
Footnotes
Declaration of Conflicting Interests
The author(s) declared no potential conflicts of interest with respect to the research, authorship, and/or publication of this article.
Funding
The author(s) received no financial support for the research, authorship, and/or publication of this article.
References
Supplementary Material
Please find the following supplemental material available below.
For Open Access articles published under a Creative Commons License, all supplemental material carries the same license as the article it is associated with.
For non-Open Access articles published, all supplemental material carries a non-exclusive license, and permission requests for re-use of supplemental material or any part of supplemental material shall be sent directly to the copyright owner as specified in the copyright notice associated with the article.