
Abstract
A two-dimensional (2D) model was established by the finite element method to study the transient hygroscopic process and moisture-induced stress to better understand the moisture absorption microscopic process of ordered polyvinyl alcohol fiber (PVAF)-reinforced thermoplastic starch (TPS) composite films and the corresponding moisture-induced stress. The Mises stress contour of moisture distribution at five time points (36, 68, 100, 176, and 348 h) under four relative humidities (RH=57%, 75%, 84%, 98%) is demonstrated. The variation in moisture content along the two paths of width (AB) and thickness (CD) in the 2D model and the moisture-induced stress were also studied in detail. The results show that when the time t is 348 h, the saturated moisture contents along CD are 5.27, 17.22, 30.58, and 59.14%, and along AB are 5.27, 17.19, 30.57, and 59.07%. In addition, the change in moisture content, regardless of whether the path was AB or CD, mainly occurred before 176 h. The simulation results of moisture absorption are in good agreement with the experimental results. The ultimate moisture-induced stress is the largest in the fiber surroundings, which are 0.398, 1.30, 2.31, and 4.48 MPa at four RHs, respectively, and the internal moisture stress of 4.48 MPa was within the tensile strength (2–6 MPa) of PVAF/TPS (PVAF <0.89 vt%), which resulted in composite film failure. This paper provides a new way to understand the moisture absorption mechanism and explore possible methods for improving the water-resistance of TPS films.
Keywords
Introduction
A growing awareness of the negative impact of the indiscriminate use of fossil resources on the environment has led to renewed and increased interest in biodegradable and biobased polymers.1–6 Starch is widely used in biodegradable materials because of its easy availability, nontoxicity, annual renewability, and low cost. 7 However, with very strong intra- and intermolecular hydrogen bonds, the thermal decomposition temperature of starch is lower than its melting point, which leads to poor processability of starch. It must be plasticized with low molecular weight compounds such as polyols to form TPS for processing, further increasing the water sensitivity and decreasing the mechanical strength of the resulting materials. 8 Therefore, the key challenge is enhancing TPS water-resistance and mechanical strength in this field.
Currently, a large number of studies have focused on improving the water-resistance of TPS, mainly including chemical methods, such as esterification modification, 9 etherification modification, 10 oxidation modification 11 and crosslinking modification 12 ; physical methods, such as filling modification,13,14 surface coating modification 15 and blending modification 16 ; and other methods, such as changing the preparation process. 17 During the study of water resistance, the characterized method is the critical factor, including measuring the water contact angle of the TPS surface or ultimate moisture absorption weight of the TPS sample, which demonstrated the macroscopic experimental results. However, the dynamic absorption process, internal water distribution, and moisture-induced stress of the material, up to now, cannot be obtained through experiments. The finite element method (FEM) provides a possible way to solve this problem, and the corresponding simulation of the moisture distribution inside the material can be performed.18,19 The simulation process usually involves mass diffusion 20 and the heat conduction module 21 ; the former can be used to simulate mass diffusion driven by concentration gradients, temperature, or pressure gradients, and the latter can be applied to simulate radiation, convection, and other issues.
Polyvinyl alcohol fiber (PVAF) is the only biodegradable synthetic fiber and focuses on our recent work as a reinforcement. Firstly, the disordered PVAFs approximately 10 mm long were used to reinforce TPS to obtain the highest tensile strength of 5.2 MPa at 2.0 wt%. 22 Then, the effect of PVAF modified by sodium hexametaphosphate (SHMP) on the mechanical properties and water resistance of TPS was also studied. 23 When PVAF was soaked in SHMP solution for 1.5 h, the maximum tensile strength of PVAF/TPS was 9.18 MPa, the impact strength was 21.29 kJ/m2, and the water contact angle was 66.25. We recently proposed a method of strengthening TPS with ordered PVAFs to improve its water resistance and mechanical properties. 24 The tensile strength of PVAF/TPS composite films reached 16.54 MPa and 20.98 MPa when the amount of ordered fiber was 3.40 wt% and 4.08 wt%, respectively, which is higher than that of conventional petroleum-based plastics.
Based on previous works, in this paper, we first experimentally measured the moisture absorption curve of the ordered PVAF/TPS composite film under different RHs (57, 75, 84, and 98%). The composite film’s moisture absorption process and moisture-induced stress were then simulated and analyzed by the FEM in detail. Through the simulation and analysis, the dynamic moisture absorption process, internal water distribution, and moisture-induced stress were all demonstrated, which is beneficial for understanding the moisture absorption mechanism and provides a new path to explore possible methods for further improving the water-resistance of PVAF/TPS composite films in the future.
Experimental
Material
Food-grade corn starch (13.6 wt% moisture content, amylose content 27%) was used in this study and was supplied by the Shandong Hengren Industry and Trade Company (Tengzhou, China). Glycerol (CP) was
Purchased from the Sinopharm Chemical Reagent Co., Ltd. (Shanghai, China). Long PVAFs (38D) were purchased from Sylon Textile Technology Co., Ltd. Analytical grade sodium bromide, sodium chloride, potassium chloride, and potassium sulfate were obtained from Nanjing Chemical Reagent Factory (Nanjing, Jiangsu, China).
Preparation of ordered PVAF/TPS composite films
The PVAFs were uniformly wrapped manually on two fixed rods at a fixed width, as shown in Figure 1. Then, a TPS film was placed at the bottom of the fibers and some hot-melt adhesive was used to fix the fibers on this film. Another TPS film was placed on top of the fibers, creating a sandwich-like TPS/fibers/TPS composite film with the volume fraction (0.72 vt%), which was then placed between HDPE sheets in a flat vulcanizing machine(QLB-25T, Wuxi Jixiang Rubber and Plastic Machinery Co., Ltd., Wuxi, China) for the next hot compression step. The compression temperatures was 55°C, with no pressure applied for 30 s, followed by the application of 10 MPa of pressure for 10 min. Finally, the composite film was rapidly removed from the press and quenched with cold airflow and detached from the HDPE sheets.
24
It should be noted that, as shown in Figure 1, the fibers are dyed black to make them easier to see in the real photograph of the specimen. The scheme of preparation procedure, real and optical microscopic photograph of the ordered PVAF/TPS composite film.
24

Moisture absorption tests
The PVAF/TPS composite films were cut into 60 mm×20 mm×0.35 mm specimens and were first put into an oven at 105°C until no further change in weight was observed. This dry weight for each specimen was recorded as W
0
. These specimens were then exposed to four controlled humid environments in glass dryers, and the corresponding RHs were 57%, 75%, 84%, and 98% (sodium bromide, sodium chloride, potassium chloride, potassium sulfate supersaturated solution at 25 ± 2°C). Three specimens for each condition are utilized, and the samples are denoted as RH57%, RH75%, RH84%, and RH98%-PVAF/TPS. The specimen weight was monitored as W
t
every 24 h using a high-resolution analytical balance. Furthermore, the moisture content, M
t
absorbed by each specimen, is calculated from its weight before W
0
and after W
t
absorption as follows
25

The moisture diffusion process of materials mainly involves diffusion in the matrix, interface capillary action and the aggregation of water molecules in interface defects. The moisture diffusion behavior of materials can be described by the saturated moisture content, M
∞
, and the diffusion coefficient D. Generally, the relationship between M
t
and time t can be expressed as


Generally, the diffusion behavior of water molecules conforms to Fick’s second law in the initial stage of moisture diffusion behavior


Analysis of moisture absorption test results
Figure 2 shows that the moisture absorption process is divided into two stages: the first stage is the initial moisture absorption stage. The composite film’s moisture absorption curve shows a linear increase, typical of Fick diffusion. In this stage, water molecules rapidly enter the microcracks in the interface between the matrix and fibers or defects and flaws in the matrix,
26
so the moisture absorption rate is relatively large. With the increased moisture absorption further, the moisture absorption rate gradually slows down and tends to balance in the second stage, which is the later stage of moisture absorption. This is mainly related to the micro gaps between polymer chains or capillary transport into the gaps between fiber and the matrix.
26
Finally, the moisture content reached the saturated or equilibrium state, M
∞,
which corresponds to the RH for each sample and can be obtained from Figure 2. The diffusion coefficient D can be calculated by formula (5). The related parameters are listed in Table 1. Moisture absorption curves of ordered PVAF/TPS composite films under different relativehumidities.The dependence of the relative weight gain on the time (a) and square root of time (b). Parameters related to moisture diffusion of PVAF/TPS composite film under different RH.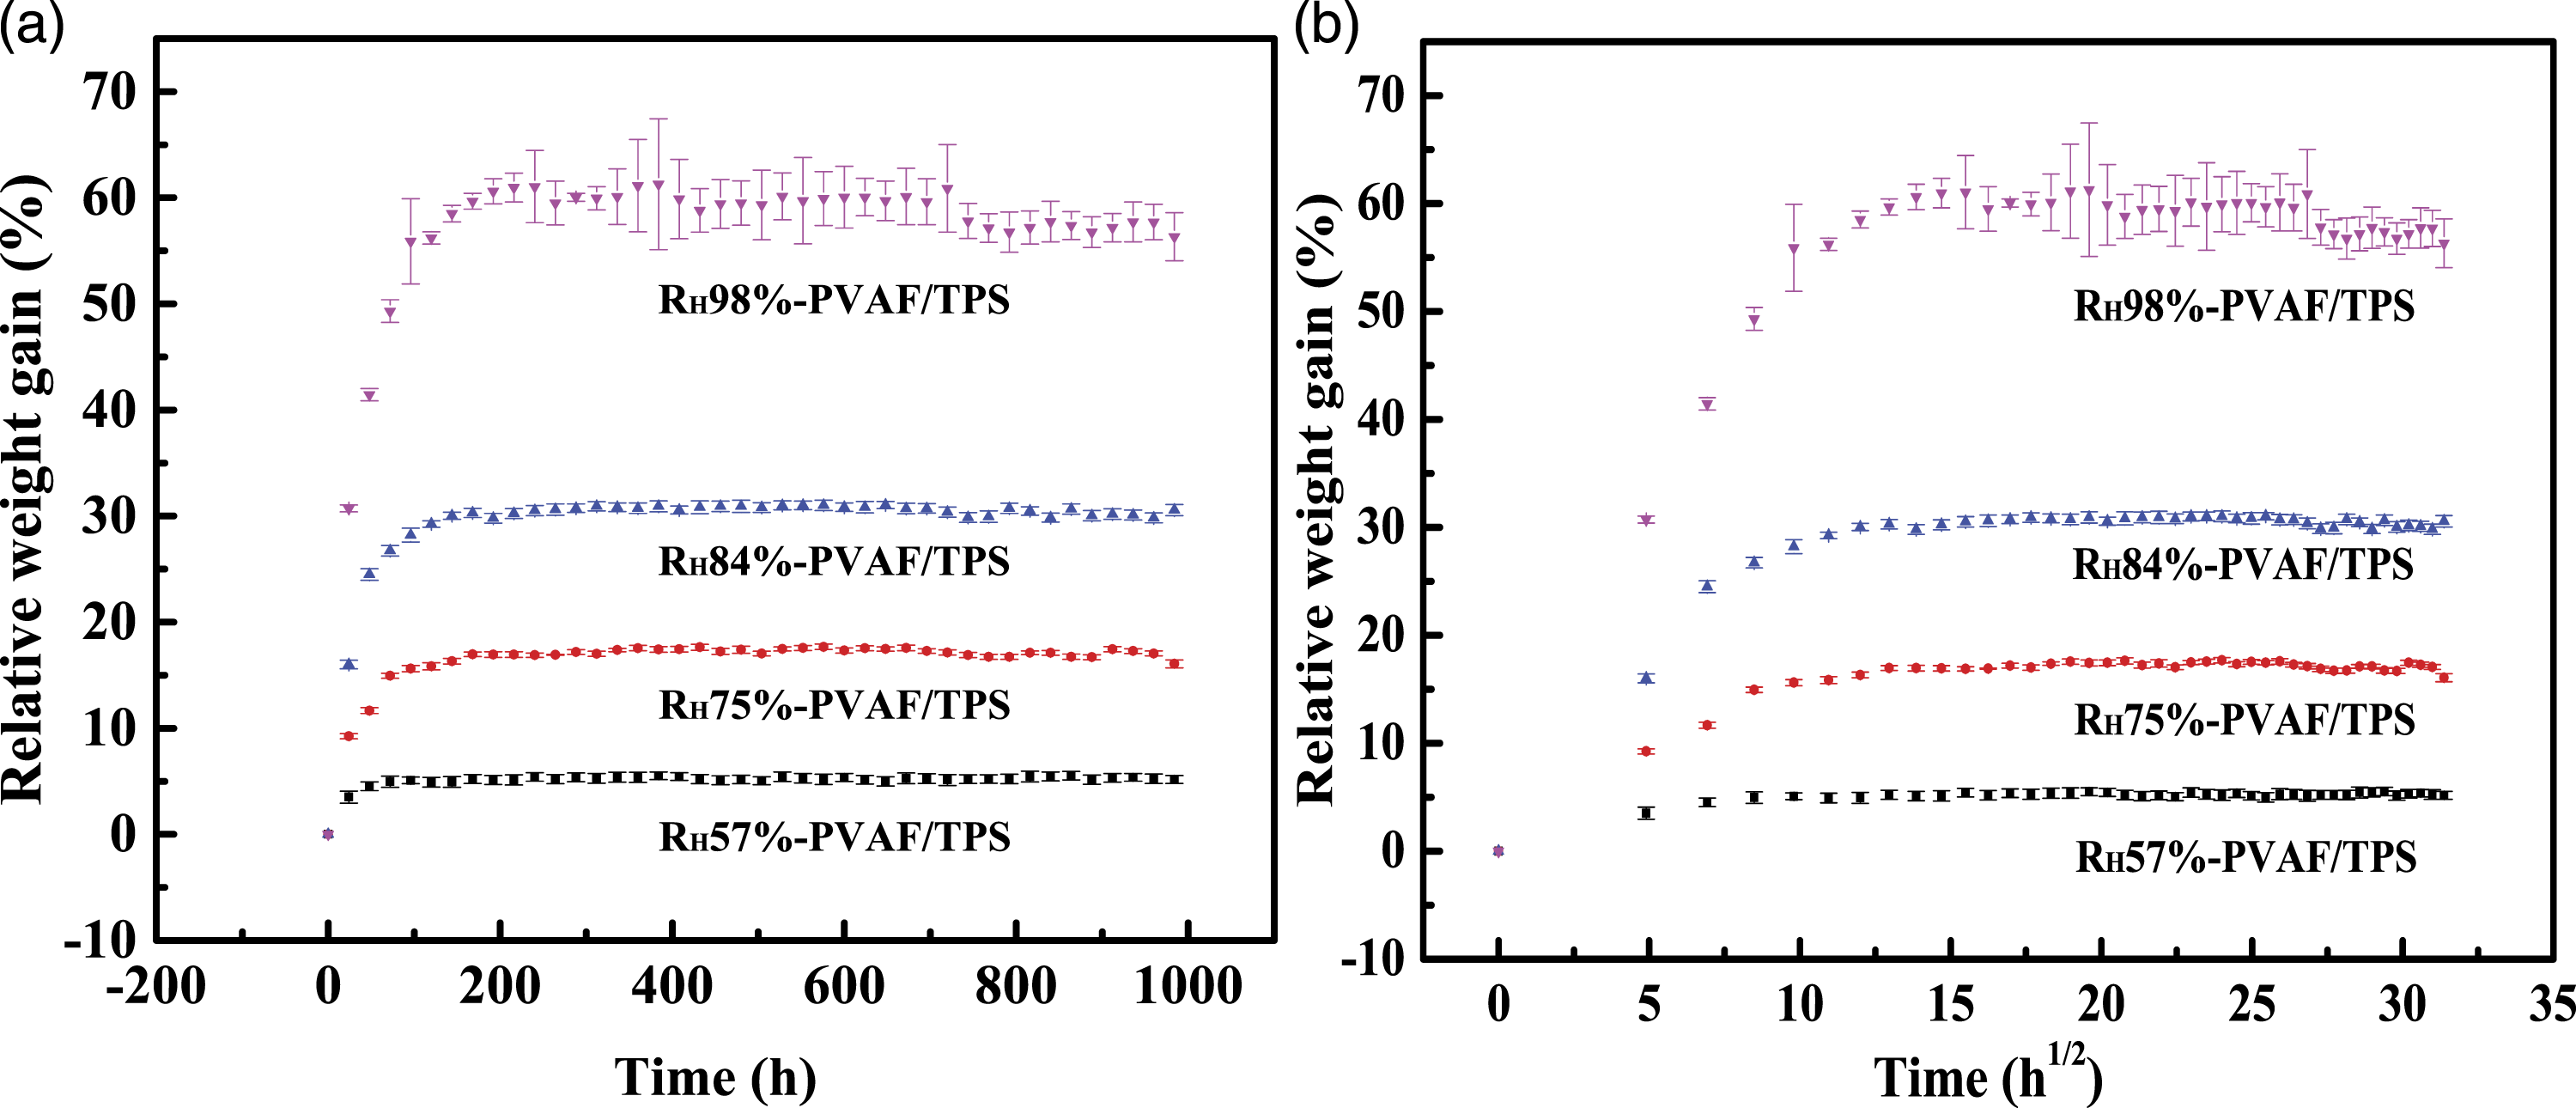
Finite element simulation
Finite element model and material properties
The mass diffusion process of moisture in the PVAF/TPS composite film can be regarded as a transient process,
27
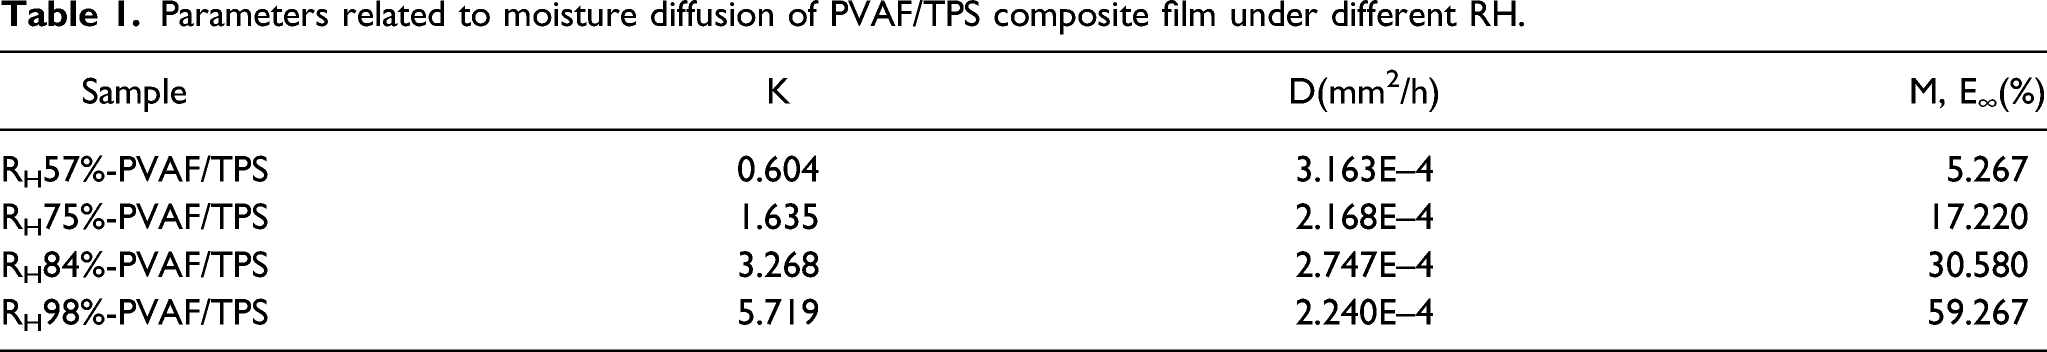
and the orderly arranged fibers in the TPS matrix can effectively simulate the actual moisture diffusion process. An appropriate calculation model is established by the ABAQUS/CAE preprocessing module and solved by the mass diffusion module. According to the composite film’s actual size (60 mm×20 mm×0.35 mm) and fiber content, the calculation model represents a simplified 20 mm×0.35 mm 2D model to make the simulation results closer to the experimental results. The volume fraction of the actual fiber determines that the radius of the PVAF filled in the 2D model is r = 0.0115. Subsequently, the geometric model of the composite film is shown in Figure 3, simulating the moisture diffusion behavior in the xy-plane from the four sides to the inside. Schematic figure and two-dimensional model of ordered PVAF-reinforced TPS. (a)Two-dimensional model. (b) Enlarged view of the local two-dimensional model. (c) Three-dimensional model.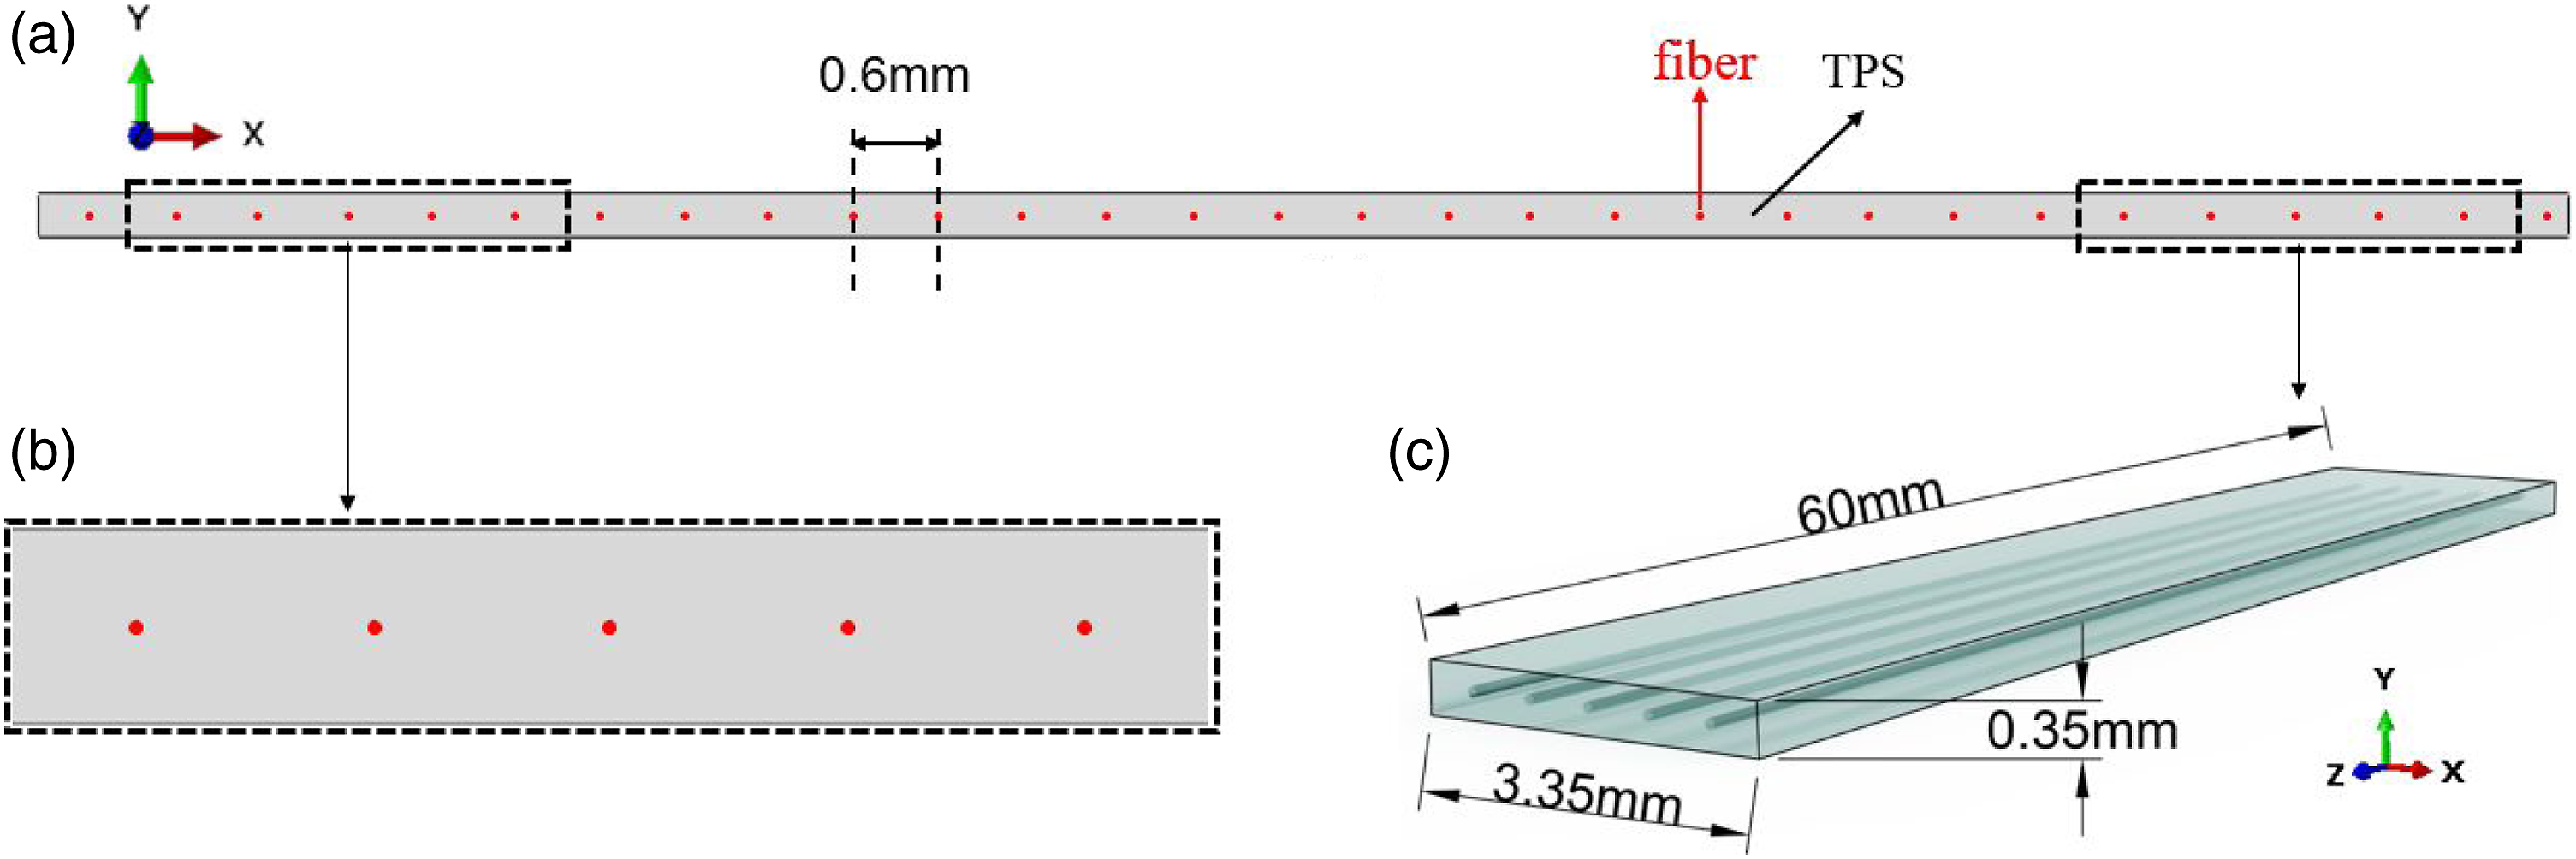
Material parameter setting
The moisture diffusion behavior of the PVAF/TPS composite film is simulated and calculated under four distinct relative humidities, which are 57%, 75%, 84%, and 98% at ambient temperature T = 25 ± 2°C. The mass diffusion in ABAQUS follows the conservation of mass
Here, V is the volume, S is the surface area, n is the external normal of S, and J is the diffused material concentration. The governing equation of mass diffusion analysis in ABAQUS can be obtained by combining equations (4) and (6) 
Here, D is the diffusion coefficient; s is the solubility coefficient; Ф is the standard concentration, and J is the diffusion flux. It is necessary to input D and M ∞ for calculation when setting the material parameters. According to the moisture absorption curve of PVAF and equation (5), the D of PVAF is calculated as 2.431 × 10⁻⁵ mm2/h, and M ∞ is 3.2%. In addition, solubility can be used to adjust the infiltration degree of the fiber. In the process of moisture absorption, the fiber and water molecules are mainly combined by hydrogen bonds. Therefore, the fiber’s chemical structure is the most crucial factor in determining its moisture absorption. Generally, if the fiber is hydrophobic, its solubility s = 0; if the fiber is hydrophilic, its solubility s is not 0. Here, s is set to the value of M ∞ .
Boundary conditions
The FEM is used to simulate the moisture diffusion process of the composite film. The water molecules mainly diffuse into the composite film along the four outer surfaces in the transverse direction of the fiber to simplify the calculation. The boundary conditions of the four outer surfaces in the model are defined as M
∞
in Figure 3(a). Each node has only one degree of freedom in Figure 4, which represents the water concentration, and its moisture content is 0 when time t is 0. The total calculation time of the model is 984, which is divided into 246 incremental steps. Boundary condition and mesh generation of the ordered PVAF-reinforced TPS model. (a) Boundary condition. (b) Mesh generation. (c) Mesh of local region. (d) Enlarged view of mesh. (e) Different paths. (AB: thickness CD: width).
Element and mesh
The transient solver was used in the finite element calculation, and the model mesh type and mesh division selection significantly impact the simulation result accuracy. Since the mesh complexity can improve the accuracy and prolong the calculation time, the appropriate mesh division plays a vital role in the later experimental results and calculation results fitting. The mesh generation of the model is displayed in Figure 4(b)–(d). The selected element type is DC2D4. Two paths are established in Figure 4(e) at a thickness of 0.0875 mm (AB) and width of 0.88 mm (CD) in the composite film to intensively study the change in moisture content and distribution on the path.
Results and discussion
Moisture distribution profiles in the 2D model at different humidities and times
Finite element analysis was carried out using the finite element code ABAQUS. Figure 5 illustrates the moisture distribution profiles of the 2D model of the composite film at different times. The samples are exposed to different humidities of RH = 57, 75, 84, and 98%. The moisture contents of the 2D model, that is, the xy-plane, are shown in various colorful moisture distributions contours for five different exposure durations of 36, 68, 100, 176, and 348 h. In the outer region, which is the moisture-exposed surface, the moisture content immediately saturated and reached different maximum moisture contents of M∞ = 5.267, 17.22, 30.58, and 59.267%. Consequently, this was the boundary condition prescribed along the exposed plane. Subsequently, the moisture was transported toward the inner xy-plane as time progressed. This process is illustrated by blue to red color in the 2D model in Figure 5. At t = 348 h, almost the entire TPS phase was fully saturated except for PVAF. Because the maximum moisture content of PVAF is only 3.2%, which is far less than that of the TPS matrix, the moisture content of PVAF in the PVAF/TPS composite film is always at a low level. Afterward, the composite films would only absorb a limited amount of moisture, and hence, only a small additional weight gain would be possible.Y in et al.studied the moisture induced failures in Flip-Chip-on-Flex interconnections using Anisotropic Conductive Films (ACFs).The wetness faction distribution in the ACF layer at 1,3 and 12 h have similar profiles with PVAF-TPS, indicating the same diffusion process.
28
Moisture distributions within PVAF-TPS at five different times (T = 25 ± 2°C). (a) RH57%-PVAF/TPS; (b) RH75%-PVAF/TPS; (c) RH84%-PVAF/TPS; (d) RH98%-PVAF/TPS.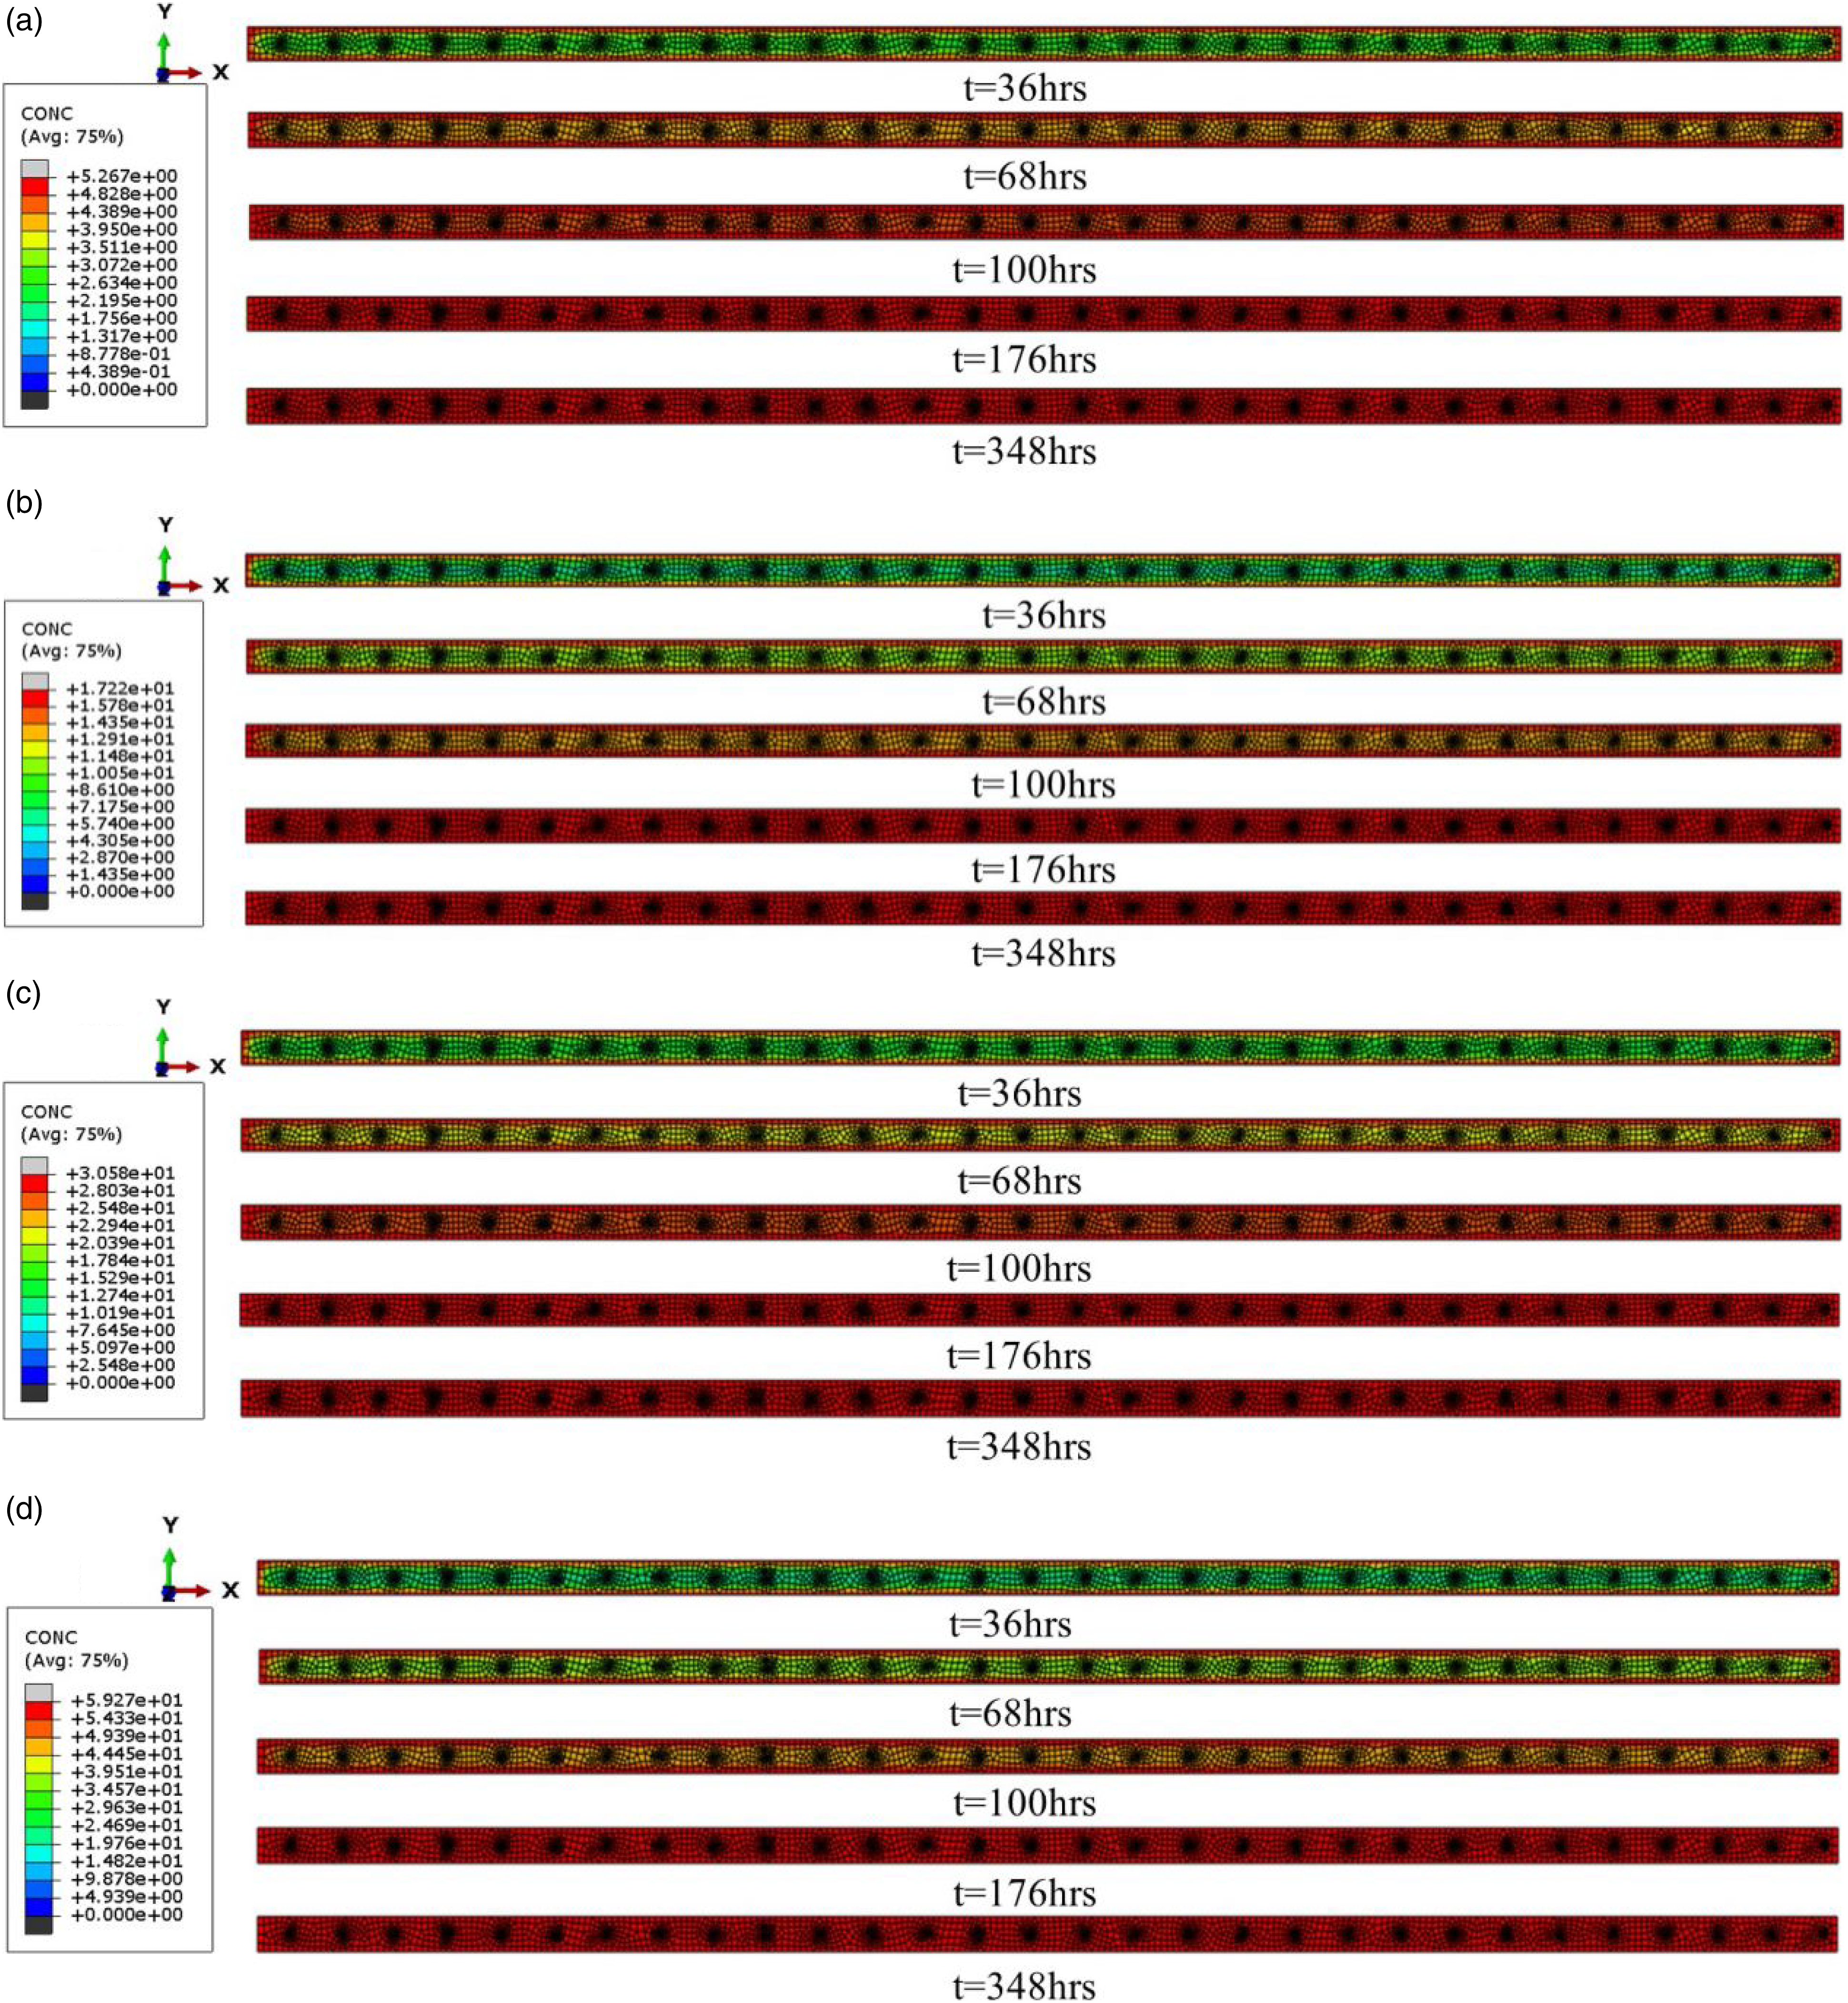
The moisture does not diffuse uniformly across the width or thickness of the composite. Disregarding the fiber phase, one can observe that the moisture content is not constant through the width (x) at a given thickness (y) or the thickness (y) at a given width (x), especially in the earlier time plots (t = 36 and 68 h). This occurs due to the ordered arrangement of the fibers. Since moisture can only diffuse around the fibers, the local arrangement of fibers influences the moisture absorption process. Therefore, to clarify the evolution of moisture absorption within the composite film, two different paths in Figure 4(e) are selected to study the effects of fiber arrangement on moisture absorption of the TPS matrix in detail.
The moisture content curve of the AB path in the 2D model at different RHs and times
Figure 6 illustrates the AB path moisture content variation along the width at the same thickness of 0.2625 mm under four different relative humidities of 57, 75, 84, and 98%. The hygroscopic state of each node in the sample increases with increasing time, and all the TPS phases at different RHs reach the saturated state when the time is 348 h. When the moisture absorption time is 36 h, the minimum moisture content of the AB path is 3.22%, 8.50%, 17.31%, and 29.85% at four different RHs of 57, 75, 84, and 98%, respectively. The addition of fiber to the composite film inhibits moisture absorption in the width direction, especially in the earlier stage; for example, in Figure 6(a), the saw-toothed curve at 36 h provides obvious evidence that PVAF affects moisture diffusion in the TPS matrix. When the time was 348 h, the AB path in all samples attained a saturated moisture content of 5.27%, 17.22%, 30.58%, and 59.14%, as shown in Figure 6(a)–(d). Wang et al. also obtained similar water absorption distribution in the thickness direction of fibre reinforced composite laminates.
29
In addition, Figure 6(e) shows that the minimum moisture content of the AB path changes with different times under different RHs, and it is clear that the minimum moisture content of the AB path changes little after 176 h. In Figure 6(f), the relationship between the difference value of the minimum moisture content from 36 h to 176 h and the RH is demonstrated to be not linear but parabolic, suggesting that the moisture content increases gradually with increased RH in the AB path, and the corresponding equation is presented in Figure 6(f). Moisture content distribution of ordered PVAF reinforced TPS composite films through model width: (a) RH57%-PVAF/TPS; (b) RH75%-PVAF/TPS; (c) RH84%-PVAF/TPS; (d) RH98%-PVAF/TPS; (e) Minimum moisture absorption at different time and humidity; (f) The difference between the minimum moisture content of 176 h and 36 h at different humidity.
The moisture content curve of the CD path in the 2D model at different RHs and times
Figure 7 shows the CD path moisture contents along the thickness at the same width of 0.88 mm under four different relative humidities of 57, 75, 84, and 98%. Since the diffusion direction of water molecules is from the outer surface of the 2D model to the inner surface, the four outer surfaces reach the equilibrium moisture content at the beginning of moisture diffusion. Hence, the moisture content curve along the CD path gradually decreases from outside to inside and attains the minimum point at the CD midpoint, nearest to PVAF. In particular, the moisture content curve is centrosymmetric at the earlier stage of moisture absorption. For example, when the time is 36 h, the minimum moisture content of the CD path is 2.44%, 5.36%, 12.34%, and 19.16% at four different RHs of 57, 75, 84, and 98%, respectively. With increasing time at 348 h, the moisture content curve becomes a line due to the finished saturated absorption, which is 5.27%, 17.19%, 30.57%, and 59.07% from Figure 7(a)–(d). The moisture content curves at 176 h and 348 h overlapped in Figure 6(a) and (d), suggesting that the moisture content attained a saturated state at 176 h. Figure 7(e) indicates that the minimum moisture content of the CD path changes with different times under different RHs, and it is also evident that the minimum moisture content of the CD path changes little after 176 h. In Figure 7(f), the difference value of the minimum moisture content from 36 h to 176 h also has a parabolic relationship with the increased RH, evidencing the increased gradual effect of RH on the moisture content in the CD path, and the corresponding equation is also presented in Figure 6(f). Moisture content distribution of ordered PVAF reinforced TPS composite films through model thickness under different relative humidity: (a) RH57%-PVAF/TPS; (b) RH75%-PVAF/TPS; (c) RH84%-PVAF/TPS; (d) RH98%-PVAF/TPS; (e) Minimum moisture absorption at different time and humidity; (f) The difference between the minimum moisture content of 176 h and 36 h at different humidity.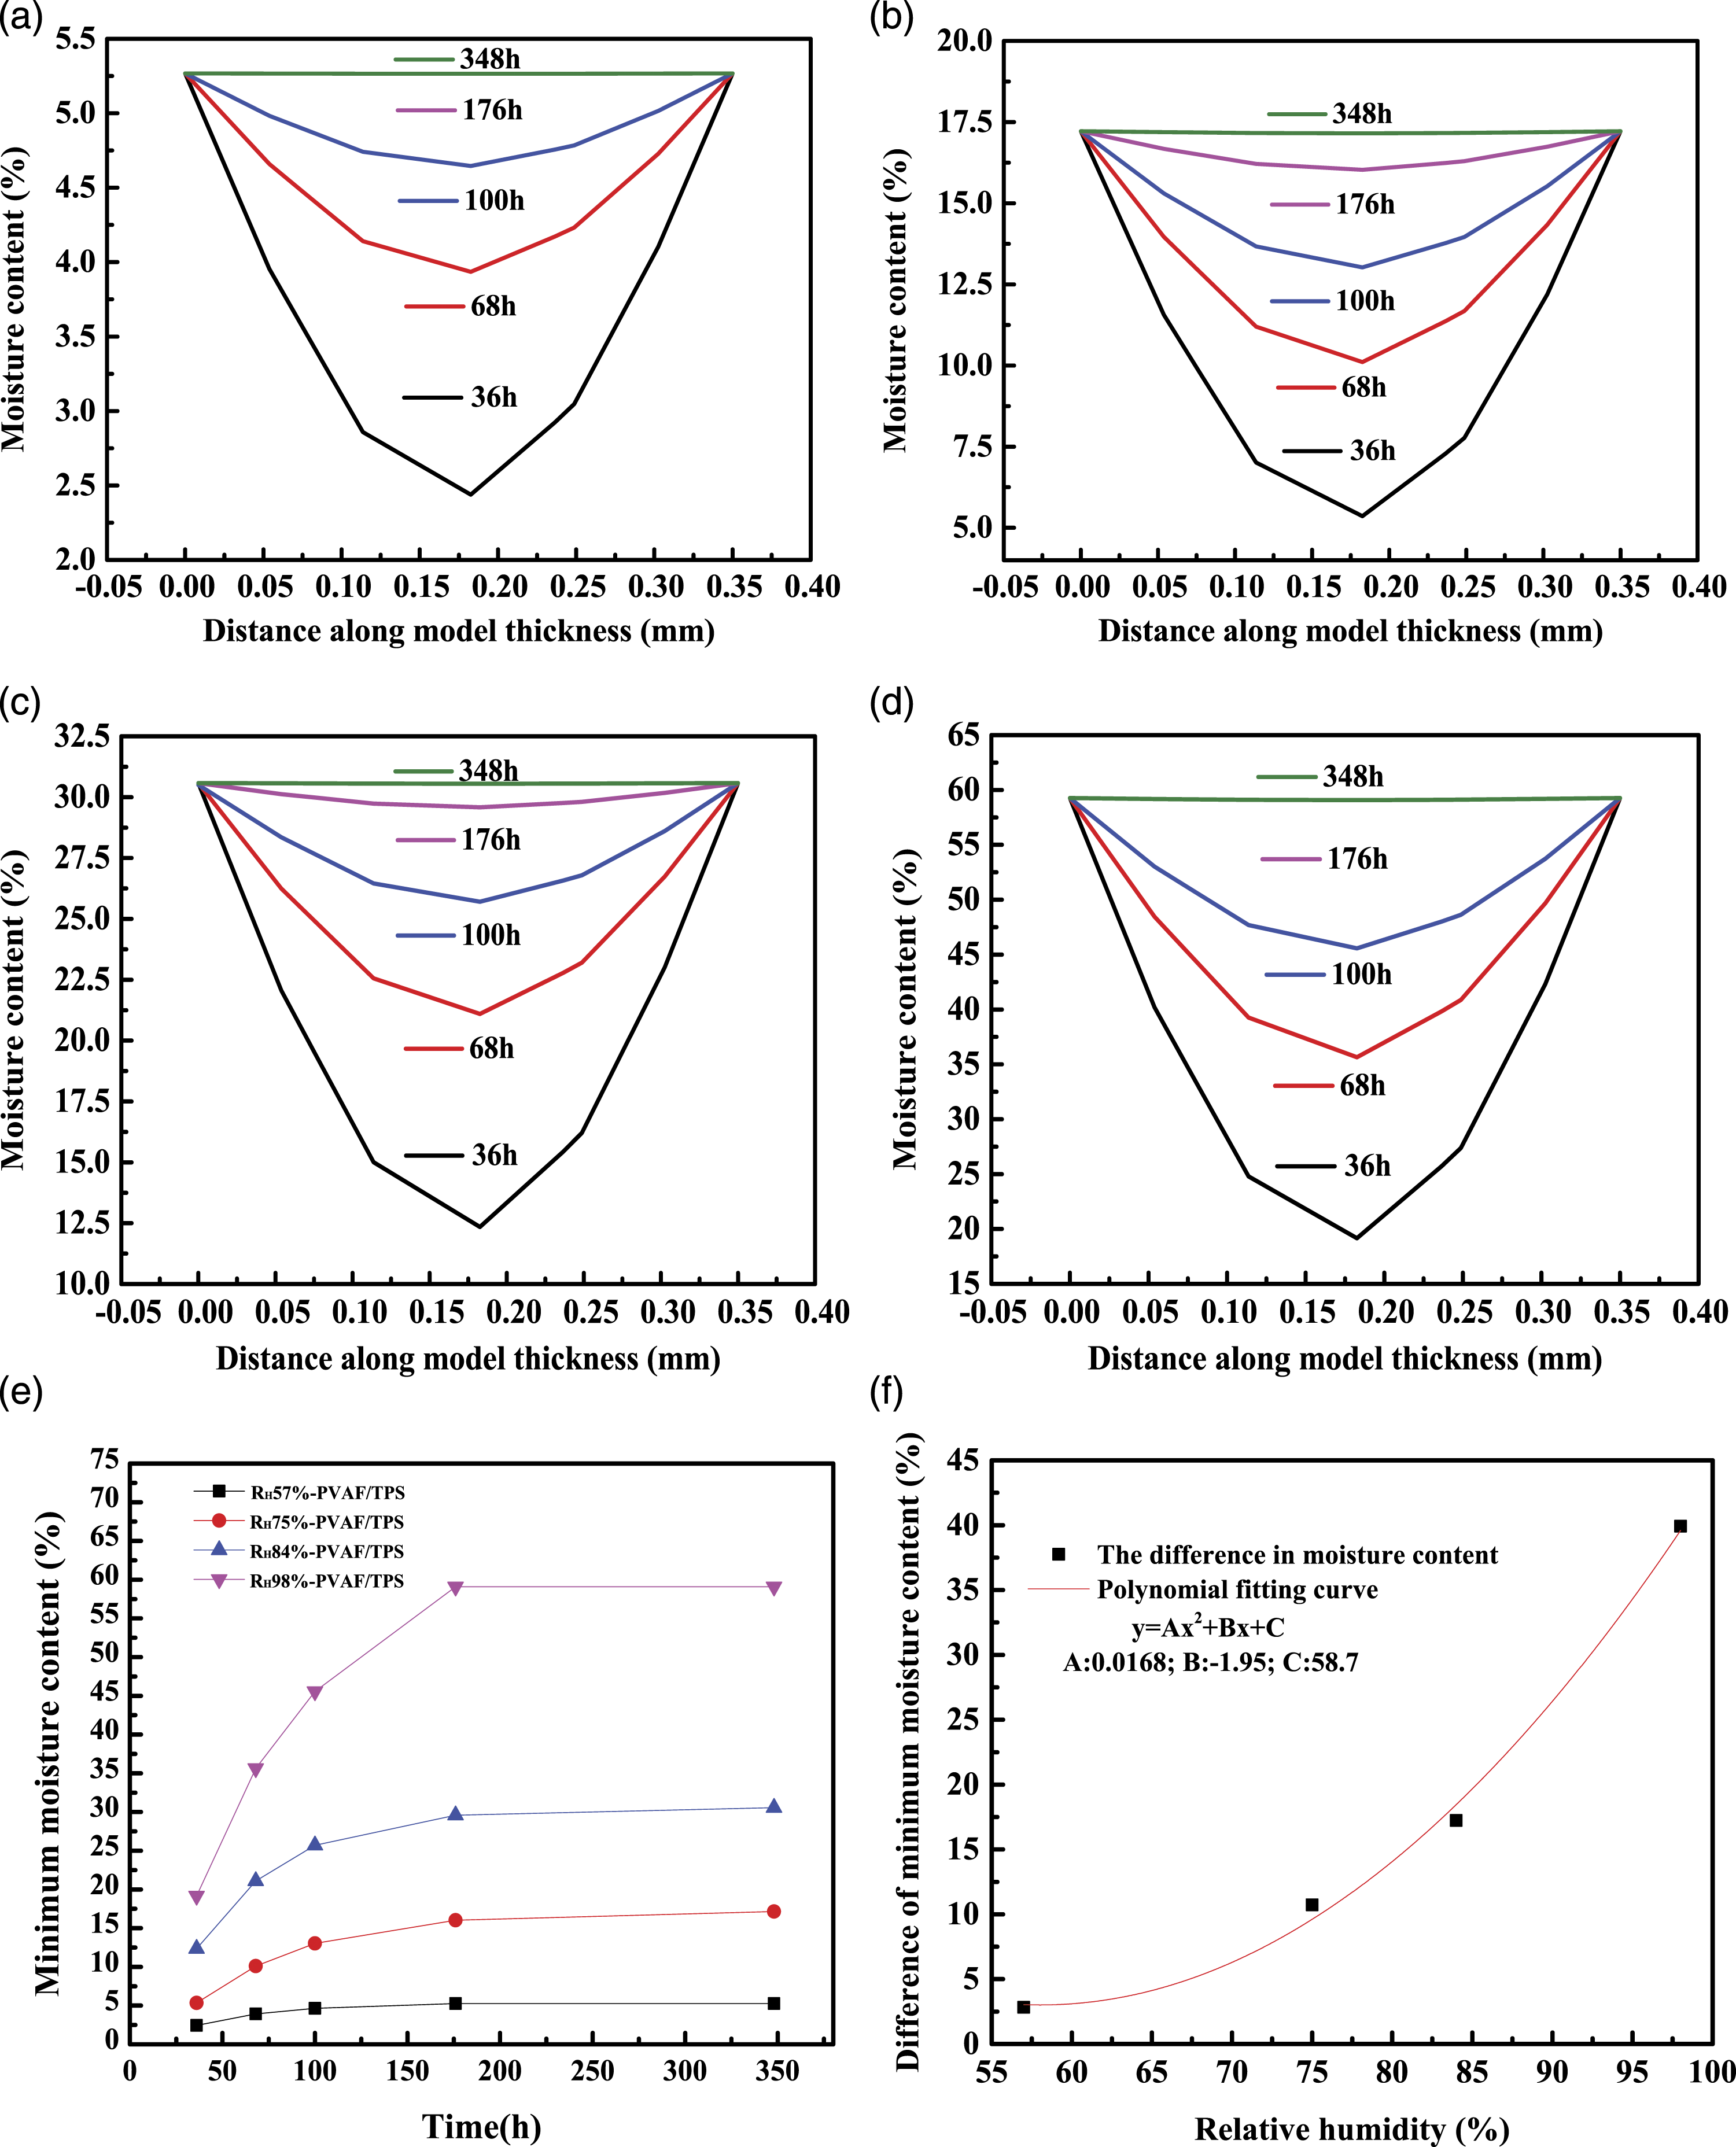
Comparison between experimentally measured and computed moisture weight gain under different RHs
The moisture diffusion process results of experimental measurements and computational simulation with the 2D finite element model at different relative humidities are shown in Figure 8. More specifically, the relative weight gains were computed and are shown with time 1/2 variations under different RHs of 57%, 75%, 84%, and 98%. The composite film’s hygroscopic curve increases linearly in the initial stage, which is in line with Fick diffusion. The hygroscopic rate decreases in the later stage, and the curve gradually slows down and tends to reach equilibrium. The agreements between the measured and simulated values are remarkable. In all cases, the simulated results remain within the bounds of experimental error throughout the measured period (0–984 h). The close match between the simulated results and the experimental observations supports the setting parameter accuracy in the diffusion process from the 2D finite element model. Therefore, the moisture diffusion model based on ABAQUS can fit the moisture diffusion behavior of composite films well, which helps further understand the moisture absorption process. Comparison between experimentally measured and computed weight gain of ordered PVAF reinforced TPS composite films under different relative humidity: (a) RH57%-PVAF/TPS; (b) RH75%-PVAF/TPS; (c) RH84%-PVAF/TPS; (d) RH98%-PVAF/TPS.
Moisture induced stresses
Simulation computing method
The transient moisture-induced stress analysis was performed as a coupled temperature displacement analysis.21,30,31
First, assuming that there is no heat or temperature source in the material, the equation of the temperature field is as follows
The equation of the humidity field is as follows:
The mathematical expressions of equations (8) and (9) are precisely the same, so the field temperature and moisture follow the same diffusion law. Therefore, the analogy between Fick’s law for mass diffusion and Fourier’s law for heat transfer was employed to model transient moisture diffusion. It is feasible to use the heat transfer module of ABAQUS instead of the mass diffusion module to calculate the distribution of moisture in the composite,32,33 which is just the temperature field instead of the moisture concentration field. In this way, the transient moisture-induced stress can be calculated by the thermally induced stress.
Finite element model and material properties
In the coupled temperature displacement analysis, the models used in the two steps of heat transfer and thermal analysis are the same, so the mesh generation and boundary conditions of the thermal stress analysis model are entirely consistent with the previous mass diffusion model. However, the unit type is different. The DC2D4 unit is employed in mass diffusion analysis, and the CPS4R unit is used in thermal analysis.
Corresponding parameters of the thermal and moisture properties for finite element calculation.

For D and Csat, the Arrhenius formula is used
35
:


Material properties of PVA fiber and TPS.

Results and discussion
The presence of moisture and the stresses associated with the moisture-induced expansion can lower damage tolerance, with an adverse effect on long-term stability. The amount of moisture absorbed by the TPS matrix is significantly greater than that absorbed by the PVA fibers, which absorb very little moisture. This results in a significant mismatch in the moisture-induced volumetric expansion between the matrix and the fibers, leading to the evolution of localized stress and strain fields in the composite.36,37
In Figure 9(A)–(D), the small region’s effective stress distributions near the mid-model are shown by the colorful von Mises stress contour at four different elapsed times, demonstrating the evolution process of the moisture-induced stress field in the composite film. During the earlier stage of moisture transport, such as t = 36 h, the internal stresses are apparent due to the moisture expansion generated in the TPS phase and the interface between the fibers and TPS, and the maximum moisture-induced stresses are 0.313, 1, 1.8 and 3.45 MPa at RHs of 57, 75, 84 and 98%, respectively. The stress distribution at 100 h is similar. As more moisture seeps through, higher stresses only develop, especially at locations between the fiber and TPS matrix, suggesting that the moisture is saturated at 348 h. The moisture-induced stress at 984 h reaches approximately 0.398, 1.30, 2.31, and 4.48 MPa at RHs of 57, 75, 84, and 98%, respectively, in which the difference is small compared to 348 h. (A) Moisture stress field in the PVAF/TPS (RH57%) composites and partial amplifying figure at different times
According to the calculation results above, the composite material’s strength failure caused by moisture-induced stress can be analyzed. 38 The tensile strength of PVAF/TPS composite films (PVAF <0.89 vt%) is usually approximately 2–6 MPa. 24 In Figure 9(e), the maximum Mises stress at the interface between the fiber and matrix reaches 4.48 MPa at 98% RH, which lies in the range of tensile strength. Therefore, long-term exposure to this humid environment is more prone to local damage and failure, especially in the interface region between the fiber and TPS, leading to significant effects on damage and failure initiation in composite films.39,40 Accordingly, the whole mechanical properties of the composite films, such as tensile, bend and impact strength, will decrease obviously.
Conclusion
Based on the moisture absorption curve of ordered PVAF/TPS film, a two-dimensional model was established using the ABAQUS mass diffusion module. A stress contour shows the hygroscopic moisture distribution at five time points in the hygroscopic process, and the moisture absorption of AB and CD path changed mainly before 176 h and then changed little. By comparing the experimental results of moisture absorption with the finite element simulation, the experimental data is determined to be in good agreement with the calculation results. In addition, the moisture-induced stress, in the initial stage, mainly exists in the matrix and the area between the fiber and the matrix, and it mainly exists in the fiber surroundings after moisture saturation.The maximum stress of 4.48 MPa may lead to material failure. Therefore, this simulation can well show the moisture absorption process and the change in internal stress for the composite film, which is beneficial for understanding the moisture absorption behavior of the material and provides a new path for further improving the water-resistance of thermoplastic starch composites.
Footnotes
Acknowledgements
The authors thank the Jiangsu Government Scholarship for overseas studies, the Nanjing Forestry University Yong top talent program, Postgraduate Research &Practice Innovation Program of Jiangsu Province (SJCX22), the Natural Science Foundation of Jiangsu Province (BK20140967).
Declaration of conflicting interests
The author(s) declared no potential conflicts of interest with respect to the research, authorship, and/or publication of this article.
Funding
The author(s) disclosed receipt of the following financial support for the research, authorship, and/or publication of this article: This study is supported by Postgraduate Research &Practice Innovation Program of Jiangsu Province (SJCX22).