
Abstract
In this work, a comparative assessment of the mechanical properties of chopped glass-carbon-aramid fiber reinforced polypropylene (PP) composites was carried out. Reinforcement and matrix materials were mixed with the extrusion method, and then composite materials were produced in the form of plates with the press molding technique. The composites' tensile, 3-point bending, and drop weight tests were carried out and the surface morphology of the fractured surfaces was examined by Scanning Electron Microscope (SEM). The tests’ results indicate that the mechanical properties increase significantly in the presence of fiber. On the other hand, it is observed that the effect in percentage decreases as the fiber content increases. Moreover, It was observed that some of the fiber materials were pulled out from the matrix as a result of stress. ANOVA analysis using S/N values, and F-Test were performed to observe the effectiveness of each test factor (fiber type, and fiber additive content) on the test results. Finally, an optimization study was carried out to obtain the mathematical expression by fitting the experimental data.
Keywords
Introduction
Chopped fiber-reinforced polymer composites have become very attractive due to their ease of fabrication, economy, and superior mechanical properties. Extrusion and injection molding processes are frequently used in the production of chopped fiber reinforced polymer composites. 1 In general, high fiber content is required to obtain a high-performance composite. Therefore, the influence of fiber content on the mechanical properties of composites is particularly important. Increasing the fiber content significantly increases the strength properties. 2 Generally, the mechanical properties of composites such as strength, modulus, and toughness increase with increasing chopped fiber length; so, the mechanical properties of the composite are determined by the matrix and fiber content, as well as the size of the chopped fiber. 3 On the other hand, it results that the fiber efficiency in the fiber-reinforced composite decreases as the fiber content increases. In particular, as the fiber content increases, the homogeneous distribution in the matrix deteriorates. This negatively affects the efficiency of the fiber. In addition, the chemical forms of the fiber-matrix couples identify the degree of interfacial adhesion (chemical or plasma treatment on the fiber surface is applied commonly). 4
Glass fiber reinforced polymer composites are preferred in a wide variety of fields. 5 Glass fibers have properties such as high strength, stiffness, and chemical resistance. The mechanical behavior of fiber-reinforced composites is primarily determined by the strength of the fibers, the chemical stability of the matrix, and the interfacial bond between the fiber and the matrix to assure stress transfer. 6
The injection method is common in the production of randomly directed long (ranging from 5 to 25 mm) and short (less than 3 mm) fiber-reinforced composites. 7 This method provides flexibility, and significant strength values in producing short glass fiber reinforced composites. 8 However, polymer reinforcement fails when the fiber length is less than the critical length required to transfer the mechanical load from the polymer matrix to the fiber. 9 It also exhibits undesirable performance high fiber content due to poor fiber-matrix interaction, expansion of matrix cracks, and consequent low load-carrying capacity. 10
The applications of chopped carbon fiber polymer composites are also increasing rapidly, and most of the composites made from these materials are exposed to dynamic loading. The extrusion molding method is also common in the production of carbon fiber-reinforced composites since, based on the studies available in the literature, it is reported that among all the composite manufacturing methods, extrusion molding is faster, easier to manufacture, and highly efficient. Composites give satisfactory results according to the content of chopped carbon fiber and polymer. 11
Recently, the alternative to glass and carbon fibers, aramid fiber-reinforced polymer composites, has also been gained significant attention. Their applications have been practiced in engineering fields due to their high strength values and low densities. 12 Various studies have been carried out to modify the aramid fiber surface to improve the interfacial adhesion between the fiber and the matrix. The purpose of aramid fiber surface modification is to improve the chemical activity of the surface, increase the surface roughness and provide an excellent chemical bond and mechanical interlocking between the fiber and the matrix.13,14
The main objective of this paper is to perform a comparative study for assessing the mechanical properties of chopped glass, carbon, and aramid fiber reinforced polypropylene (PP) composites. To do that, the focus is to gain a deep understanding of the tensile, 3-point bending, and drop weight properties of the glass fiber-PP, carbon fiber-PP, and aramid fiber-PP composites couples. Next, the experimental design and ANOVA Analysis structure are introduced. Subsequently, in the results and discussion sections, the comparative assessment of the mechanical properties of the fiber-polymer couples is carried out by results tables, plots, SEM images, and ANOVA Analysis. Finally, an optimization study is carried out to obtain mathematical expression by fitting experimental data.
Materials and methods
Material and production method
Mechanical properties of materials.

Siva et al. produced fiber-reinforced thermoplastic composite by injection and extrusion production methods. The samples produced by the extrusion method were found to have higher mechanical strength and better bonding with the matrix than the injection method, and their mechanical properties showed superior performance by approximately 17%. 1
Therefore, in our study, a twin-screw extruder (Polmak Plastik 22 mm Lab type research extruder) was used for composite production. The temperature values for the five zones in the extruder were determined using the literature and the product catalog of the materials (195 °C-215 °C-225 °C-225 °C-240 °C).20,21 After the composites were produced, the samples were granulated with a cutter. 500 mm x 500 mm composite plates were obtained by the granular press molding method. Molding consists of three stages, and all the samples taken were kept at the first stage for 120 s, at the second stage for 180 s, and 60 s at the third stage (the first stage is at 170°C under 15 tons of pressure, the second stage is at 180°C under 20 tons of pressure, and the third stage is at 190°C under 30 tons of pressure). And the final composite thickness was set as 4 mm. The test samples were prepared by cutting the relevant molds into standard sizes on the CNC machine.
Mechanical testing
In this section, tensile, bending, and drop weight impact tests were performed. Five samples for each type of composite were prepared and tested. Tensile tests were carried out with Besmak-BMT 100E brand Universal Tensile Tester (100 kN). The samples for the tensile test were prepared according to TS EN ISO 527–2 type 2 standards. The tensile speed and the pre-stress value were set as 2 mm/min and 10 N, respectively. The measuring length was 50 mm video extensometer and the test conditions were carried out at 21°C. Fractured surface images of 30 vol.% fiber reinforced samples were examined with Hitachi TM3000 brand scanning electron microscope (SEM) at Bursa Technology Coordination and R&D Center (Bursa, TURKEY).
Based on the tensile test results, the fiber efficiency on matrix materials can be calculated using the Kelly-Tyson model (equation (1)).9,22 Tensile test results of composites.

The maximum stress that a material can withstand before its efficiency in a bending test is called flexural strength. The bending test was performed on a SHIMADZU brand three-point bending tester. Bend test specimens were prepared according to TS EN ISO 178–3 three-point bending standards. The distance between the supports is 64 mm, the test speed is 2 mm/min, and the tested ambient temperature is 21°C.
The amount of sudden load that a specimen can absorb before breaking is called impact strength. The usage of natural fiber-reinforced composites is rather low due to the lesser mechanical properties, especially impact strength. Drop Weight Impact was done in Instron/CEAST 9340 impact tester. Drop Weight impact test the dimensions were prepared as 60x60 mm, the wall thickness of 2.5 mm according to TS EN ISO 6603 standards, and the tested ambient temperature was adjusted to 21°C. For each sample, the impact energy was determined as 1500 J, and the impact velocity was determined as 3 m/s. Fractured surface images of 30 vol.% fiber reinforced samples were examined with Hitachi TM3000 SEM.
Experimental design and ANOVA analysis
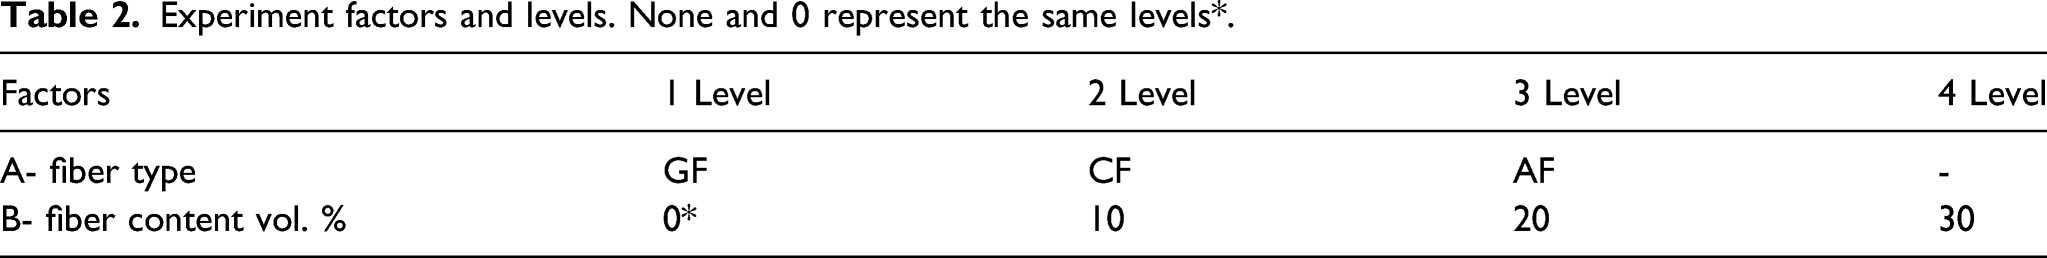
Experiment factors and levels. None and 0 represent the same levels*.
Experimental design.

Signal value (S) represents the actual value given by the system and intended to be measured. The noise factor (N) represents the share of undesired factors in the measured value. According to this approach, the following equation (2) is used to calculate the S/N ratio.
24

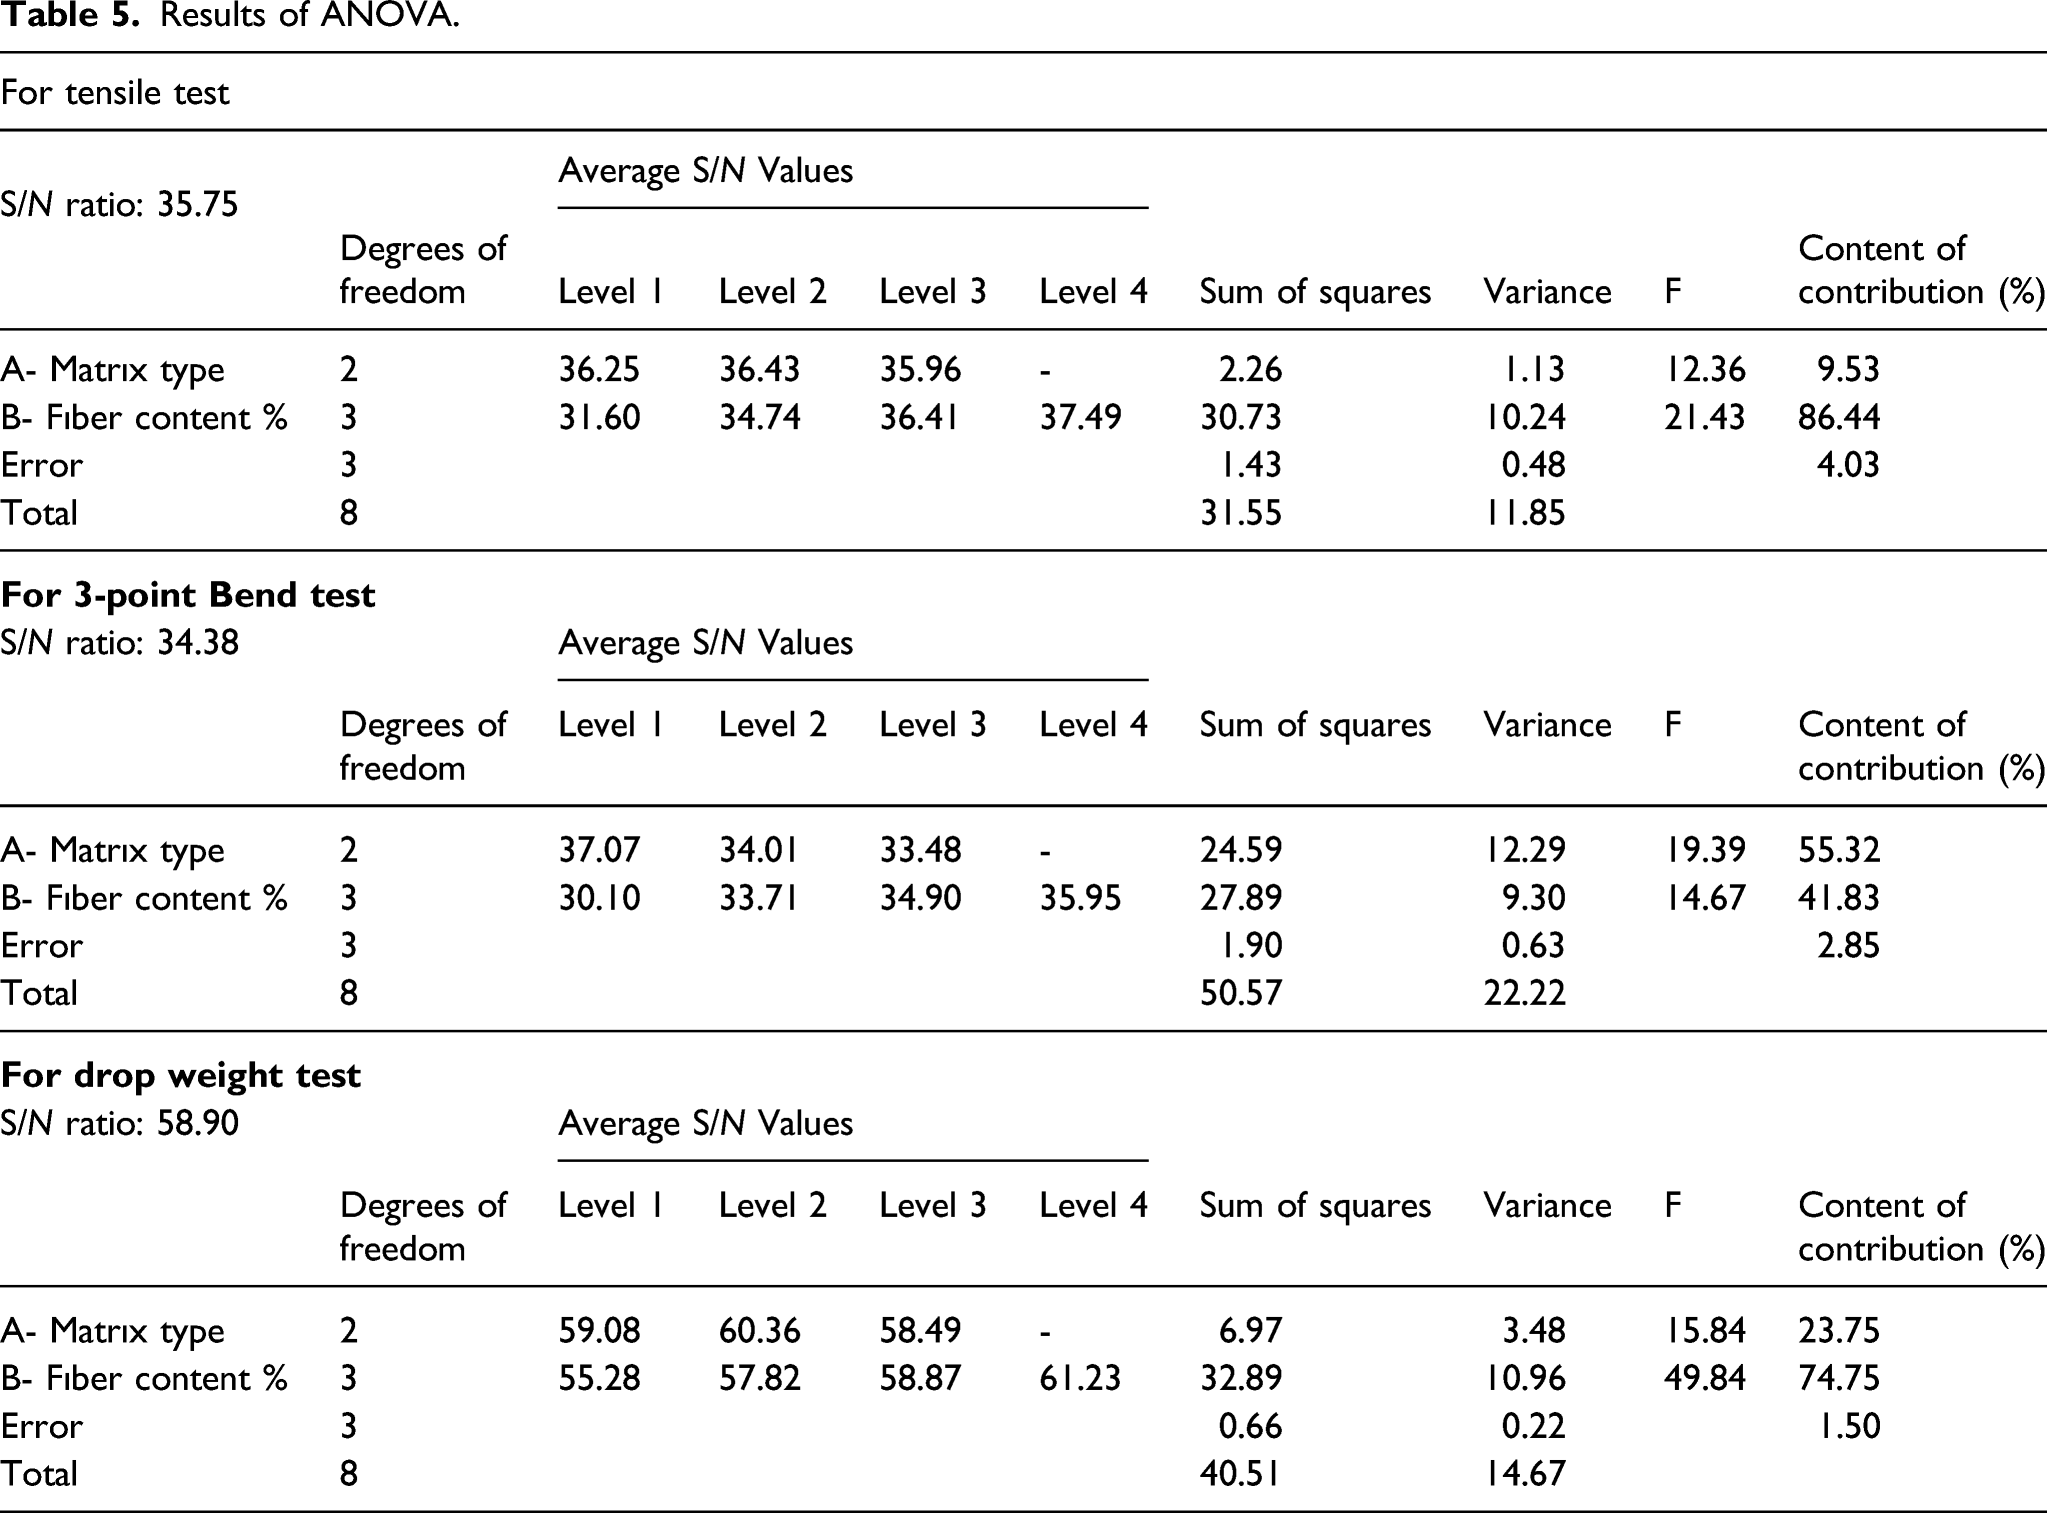
The analysis of variance reveals how much the investigated factors influence the output value used to gauge the quality and what effects different levels have. Furthermore, the statistical reliability of the obtained results is examined. For this purpose, firstly, the SST value (sum of total squares), which represents the overall variability of the signal/noise (S/N) ratio, is calculated according to equation (3).
25


For the next step, the F-Test is performed by calculating by equation (5) to present how much each experimental factor affects the test results.
Results and discussion
Tensile properties and fractography
It was observed (Figure 1.) that the tensile strength of all composite materials increased as the content of reinforcement material increased; so, the highest values were obtained at the ratio of 30 vol.% reinforcement material.
The summary of the test results: (1) It was observed that the highest enhancement for each composite was obtained for 30 vol.% reinforcement cases, (2) 30 vol.% GF increased the tensile strength of PP 2.1 times and increased it from 38 MPa to 78.5 MPa, (3) 30 vol.% CF increased the tensile strength of PP by 2 times and increased it to 74.2 MPa, (4) 30 vol.% AF increased the tensile strength of PP by 1.8 times and increased it to 72.2 MPa.
The results of the tests show that the mechanical properties are improved significantly in the presence of fiber. On the other hand, it is observed that the effect (fiber efficiency factor) in percentage decreases as the fiber content increases (Figures 1 and 2). As the introduction of fiber content increased, the deformation increased between the matrix and the fiber interface. As a result of the weakening of the contact adhesion, this result was obtained.36,37 Fiber efficiency factor in composites.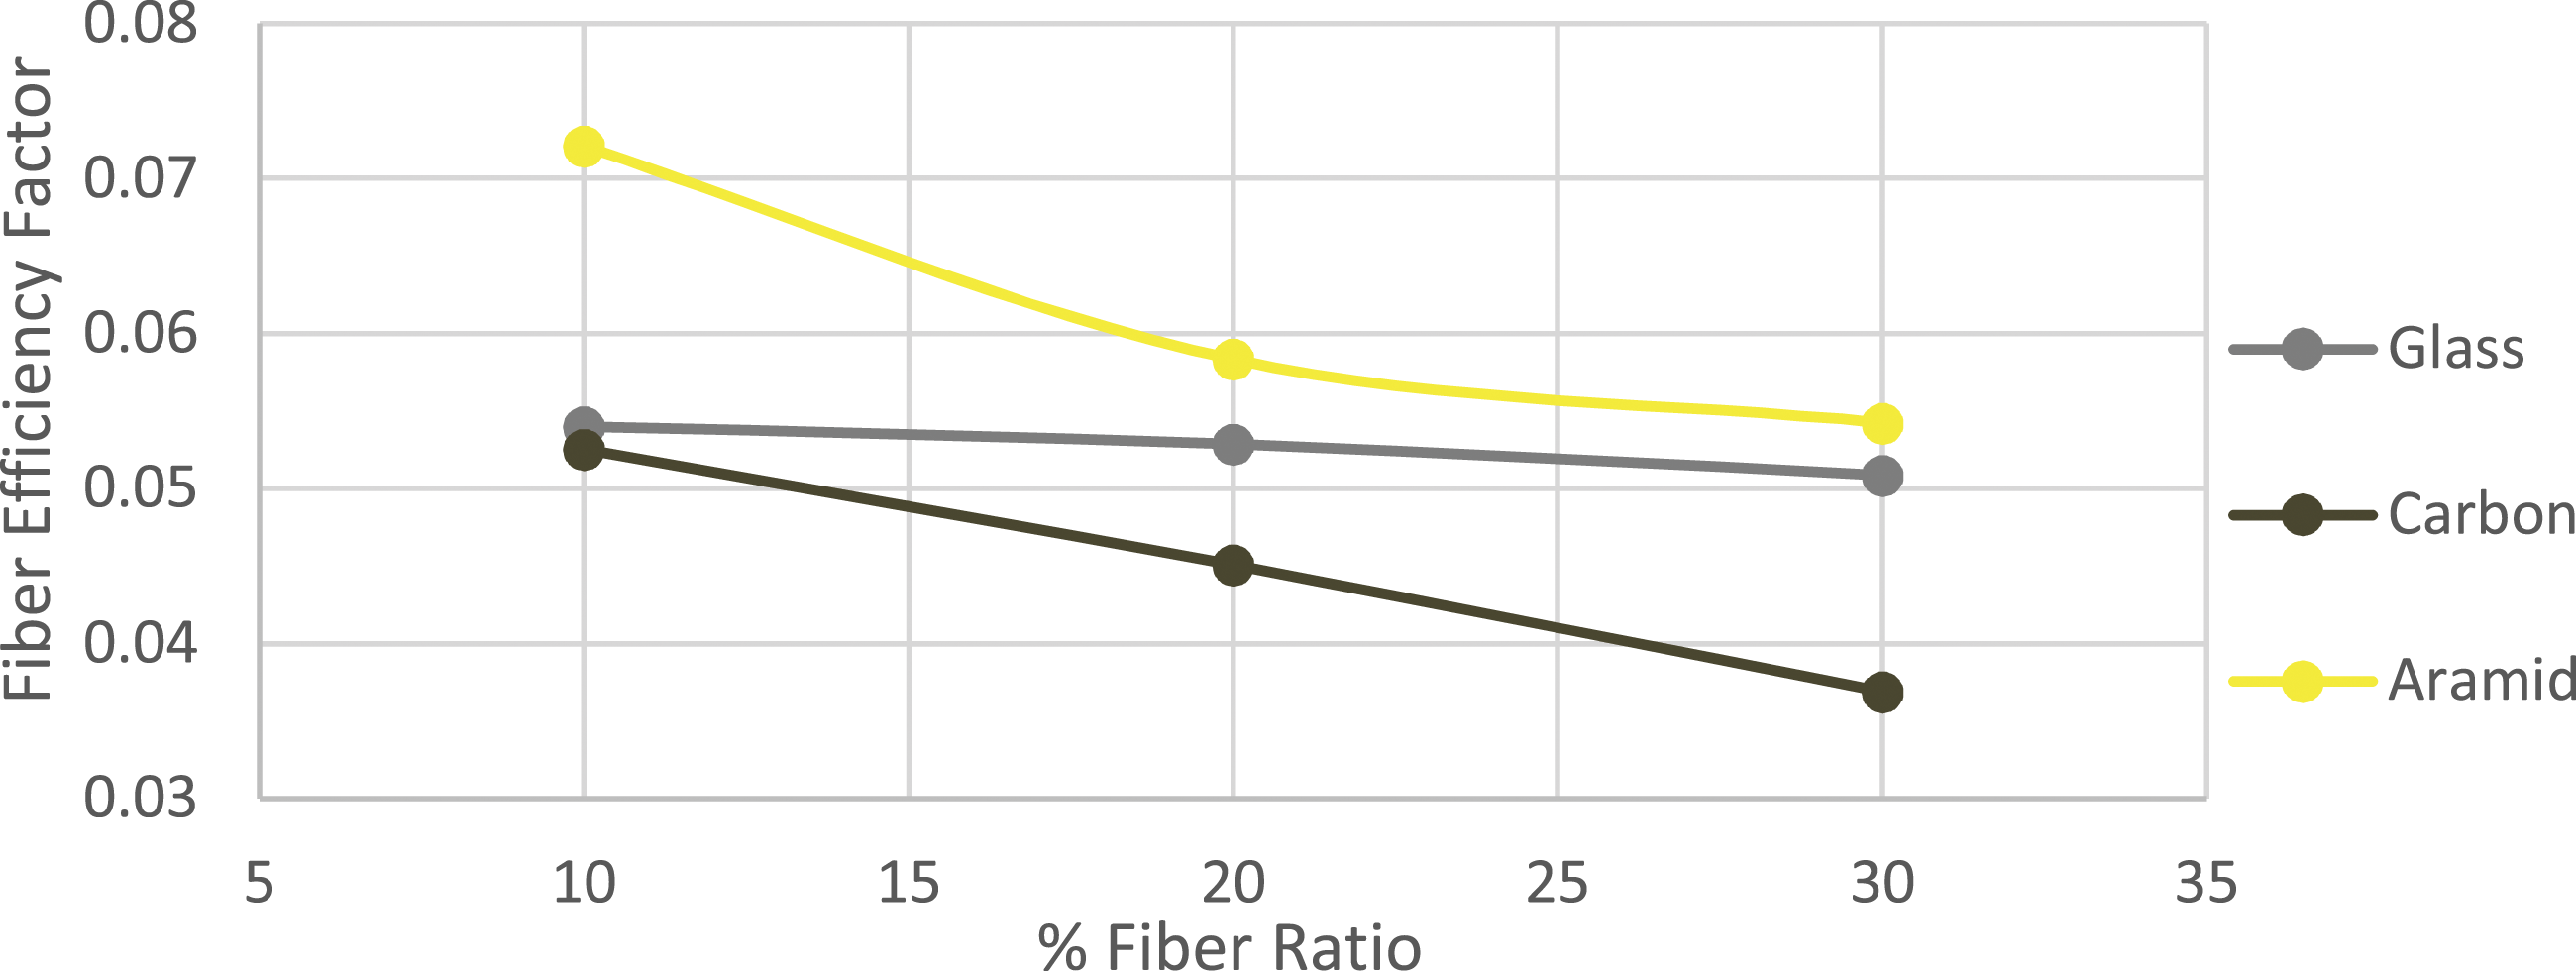
S.Y. Fu and B. Lauke investigated the fiber efficiency of chopped CF and GF reinforced PP. Tensile testing of 8%, 16%, and 25% reinforcing composites was carried out and found that as the fiber content increased, the tensile strength remained almost the same as that of GF reinforced PP, where the CF reinforced PP decreased. It was also concluded that the fiber efficiency of CF is lower than that of GF. 9 Zhang et al. attributed this decrease in fiber efficiency to the smoothness of the surface of the fibers, and they argued that as the fiber content increases, the tensile strength decreases. 16 In our study, 10 vol.%, 20 vol.%, and 30 vol.% GF, CF, and AF were added to the PP matrix. Thus, the effect on PP was compared as the content of these three fibers increased.
Wenfeng et al. measured the surface energy of CF and AF using the liquid droplet method. As a result of this study; the surface energy of the AF is 34.9 mJ m−2, and the surface energy of the CF is 42.1 mJ m−2.
30
Young-Man Park et al. measured the surface energy of GF at 32.5 mJ m−2.
31
Since CF has the highest surface energy, its performance would be expected to be higher than other fibers. As can be seen in Figure 2, it was the opposite of what was expected. As explained above, this is because the surface of the CF is smooth, and the CF is not dispersed homogeneously in the matrix. To achieve an optimal bonding, the substrate to be bonded must have surface energy higher than the adhesive’s surface tension, thus achieving good wettability or wetting; while hotmelt adhesive must have lower surface tension than the surface energy of the substrates to help its wetting.32,33 When the 30 vol.% CF-reinforced PP was examined, the fiber efficiency decreased as the additive content increased in the PP. Figure 3(b) is examined, and it is seen that the CF is not homogeneously dispersed in the PP matrix. Wang et al. (2008) investigated the effect of fiber distribution on the mechanical properties of CFRC samples and concluded that the inhomogeneity of fiber distribution adversely affected the strength of the composite.
4
Therefore, in our study, it can be concluded that while the fiber content increases in CF reinforced PP, one reason for the decrease in fiber efficiency is the deterioration of homogeneous distribution as this fiber content increases. In addition, it can be said that another reason for the low fiber efficiency is the poor surface adhesion between the CF and PP matrix since the CF surface is smooth and chemically inert.34,35 However, when we look at the highest-fiber efficiency, it is seen that the composite is made with 10 vol.% reinforced PP. This means that the matrix deformation increases with the CF content and the fibers do not provide the desired level of adhesion to the matrix.
22
SEM images of 30% fiber reinforced PP composites (a) GF, (b) CF, (c) AF reinforced.
In addition, SY Fu et al. explained this decrease in fiber efficiency as follows; as the fiber volume content increase, the average fiber length decreases. These indicate that a higher fiber content results in greater damage to fiber length. The increased damage in fiber length for a higher fiber volume content is mainly attributed to the higher fiber-fiber interaction. It is also noted that the average CF length is less than the average GF and AF length. This is explained by the fact that CF is more brittle and therefore breaks easily during processing. 9 The decrease in fiber efficiency of composites with increasing CF content can be associated with the high brittleness of this CF.
Scanning Electron Microscope images of 30 vol.% fiber-reinforced composites are shown in Figure 3. When the images are examined, it is seen that the damage mechanism in composite materials takes place in three stages. In the first stage, micro cracks were formed in the matrix, and in the second stage, it was observed that the separation between the fiber and the matrix, and finally the separation at the interface and the breakage of the fibers caused damage. 36
The physical adhesion between fibers and matrices and the formation of voids at the interface between these two materials depends on the wetting properties of the fibers. 37 Good wettability means that the reinforcing material that completely covers the rough surface of the matrix will flow over and take in all the air. If good wetting does not occur between the matrix and the fiber, pull-out appears in the composites. 37 When Figure 3 is examined, it is seen that pull out occurs in the fibers, and when the surface of the fibers is examined, it is not covered with the polymeric matrix. This means that there is poor interface adhesion between the fiber and the matrix. Dark circles around the fibers indicate local deformation in the matrix around the fibers. 38 In addition, these dark circles at the interface indicate that the fibers have been unbonded with the matrix. 22 The dark circle is due to the local deformation of the matrix around the fiber after the fibers separate from the matrix. Most of the fibers were pulled from the matrix during deformation.
When the fracture surfaces of 30 vol.% CF and GF-reinforced composites in Figure 3(a) and (b) were examined, it was observed that the surface of the fibers was clean and smooth. As a result, the lowest performance was seen in composites made with CF, as indicated in Figure 2.
When the fracture surfaces of 30 vol.% fiber-reinforced composites in Figure 3(c) were examined, it was seen that bending and crossing occurred in the fibers with the increase in fiber content. This adversely affected fiber performance. 39
Three-point bending properties
The 3-point bending test results are shown in Figure 4. When the results were examined, it was observed that the bending strength of the composites increased, and the flexibility decreased as the fiber content increased. However, mechanical properties fiber-matrix interface adhesion problems and random dispersion of fibers were also adversely affected. CF and GF reinforced composites were expected to be stronger than the AF-reinforced composites and this was observed. However, although the modulus of CF is higher than that of GF, GF reinforced composites have higher flexural strength. The mechanical properties were adversely affected because of poor fiber-matrix adhesion and random fiber dispersion. So, shows Figure 4 us that GF is more effective than CF in the PP matrix.
40
Three-point bending test results of composites.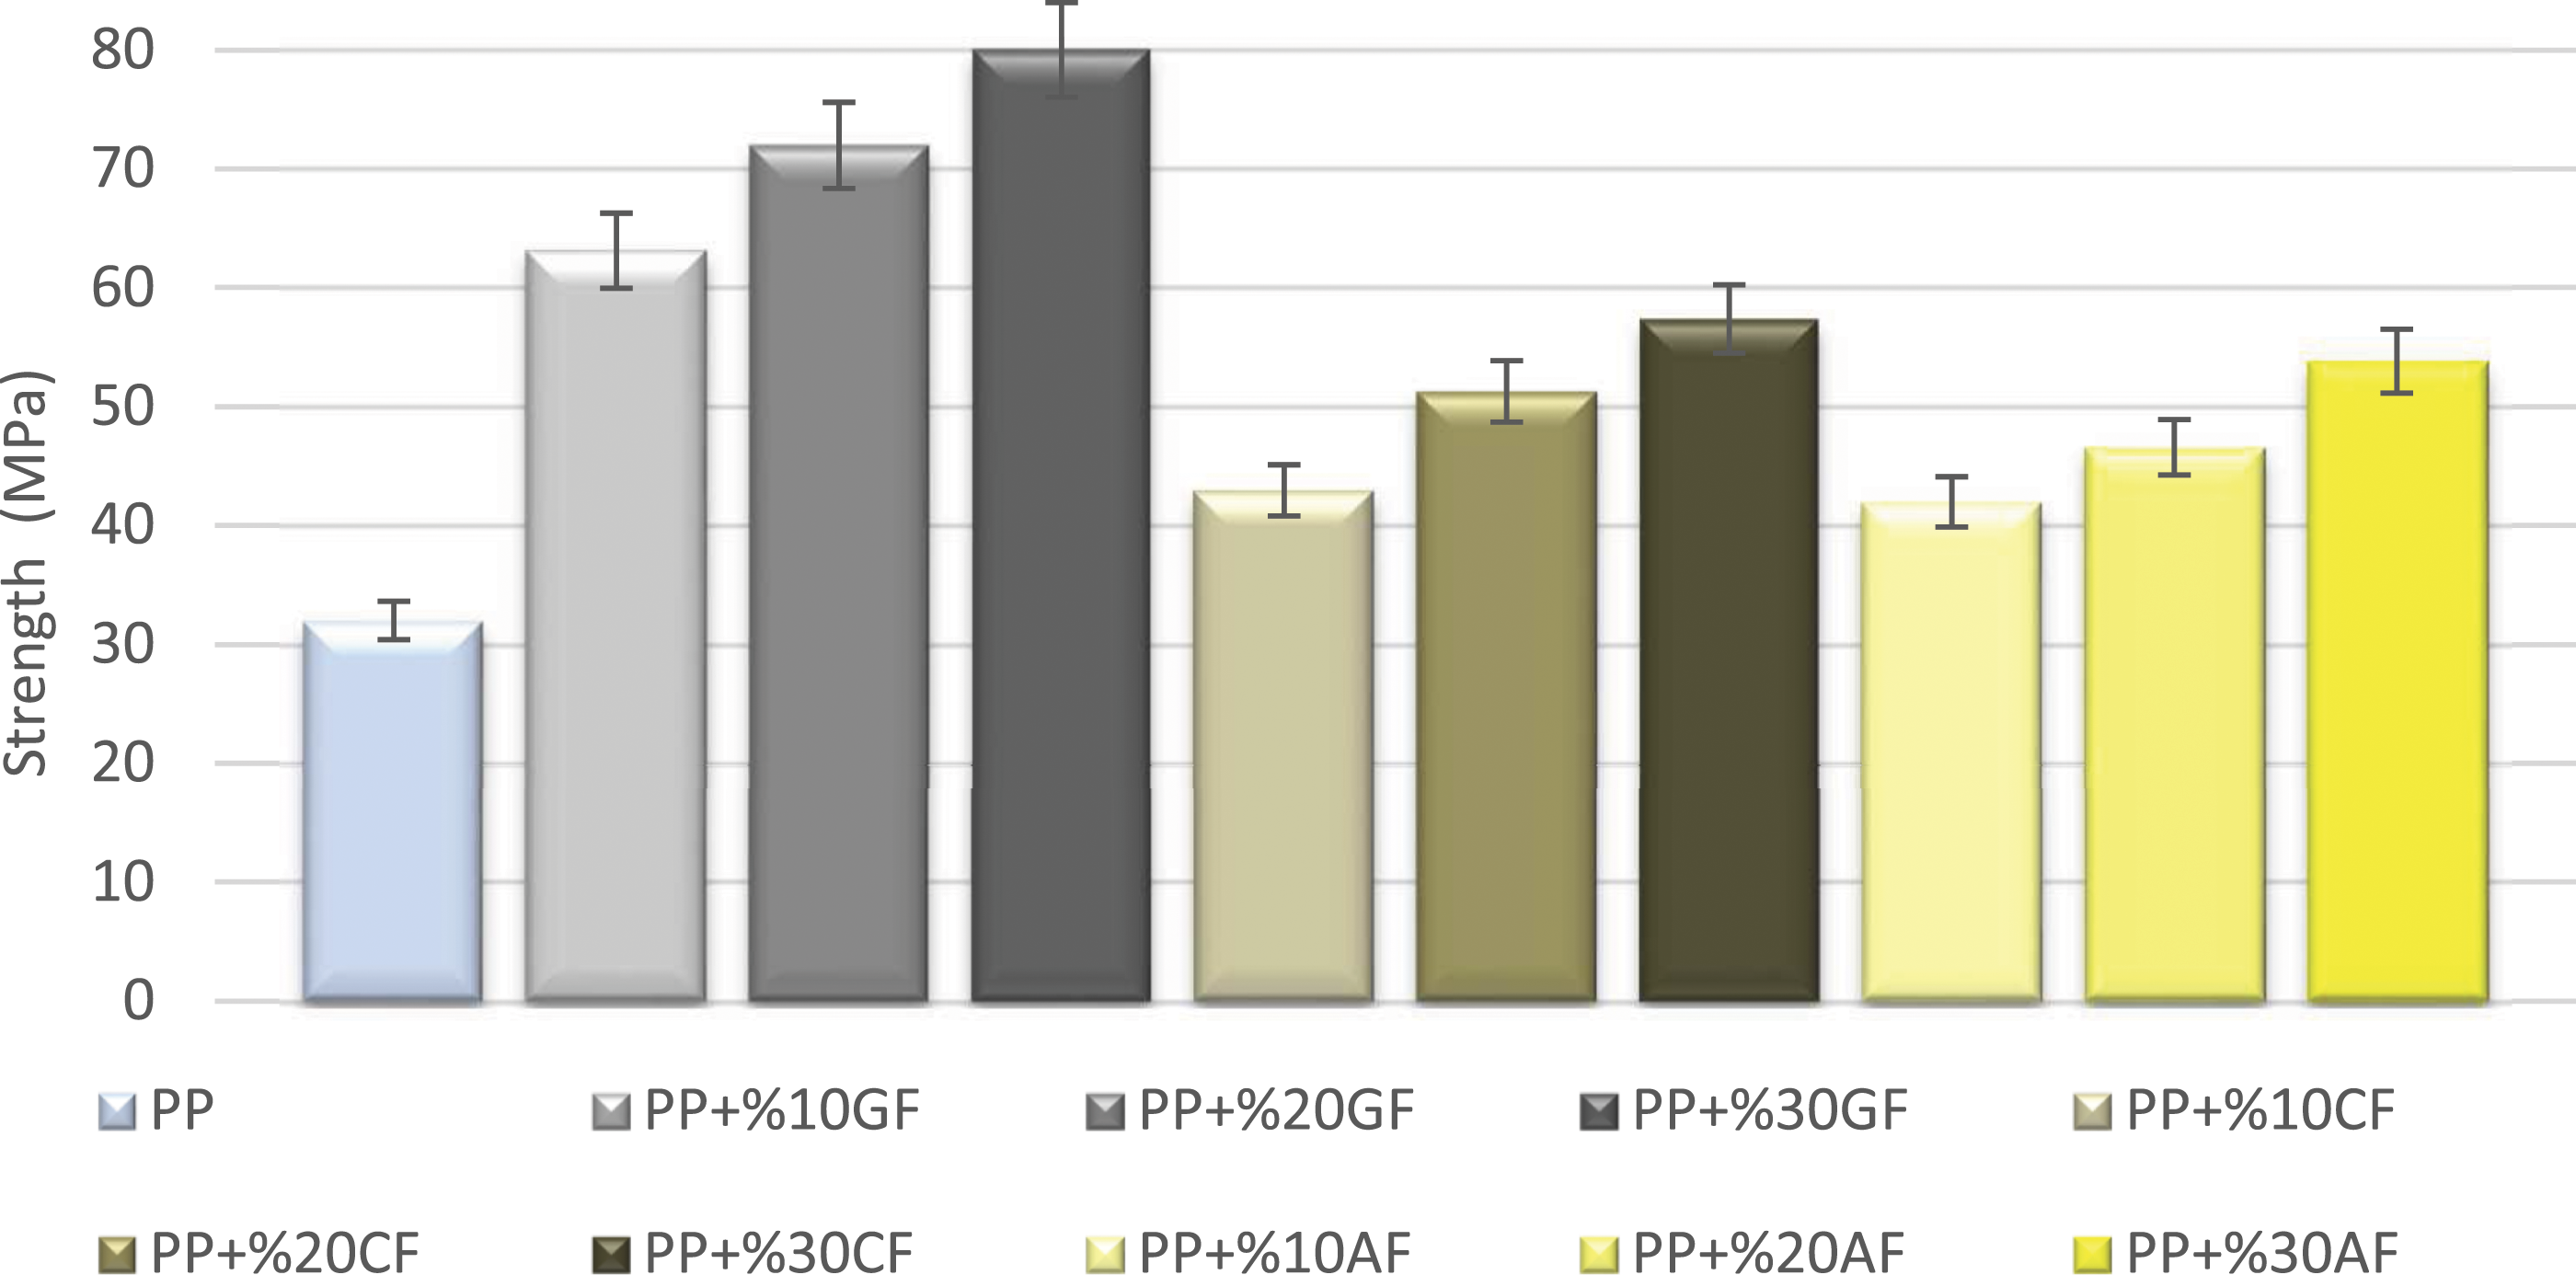
The summary of the test results: (1) It was observed that the highest enhancement for each composite was obtained for 30 vol.% reinforcement cases, (2) 30 vol.% GF reinforcement increased the flexural strength of PP approximately 2.5 times by enhancing it from 32 MPa to 80 MPa, (3) 30 vol.% CF reinforcement increased the flexural strength of PP 1.8 times and increased it to 58 MPa, (4) 30 vol.% AF reinforcement increased the flexural strength of PP 1.7 times and increased it to 54 MPa.
Drop weight properties and fractography
The result of the drop weight test carried out all samples were perforated. When we look at the impact results of the composites in Figure 5, it was seen that the impact force increased as the fiber content increased. However, although CF has higher impact strength than GF and AF, the composites displayed similar properties. As stated in the fiber efficiency obtained from the tensile test result, the interfacial bonding property of CF is low (Figure 2). Normally, better performance was expected as the surface energy of CF is higher. However, since the surface of the fiber is smooth, the PP matrix could not adhere well to the fiber. Drop weight impact test results of composites.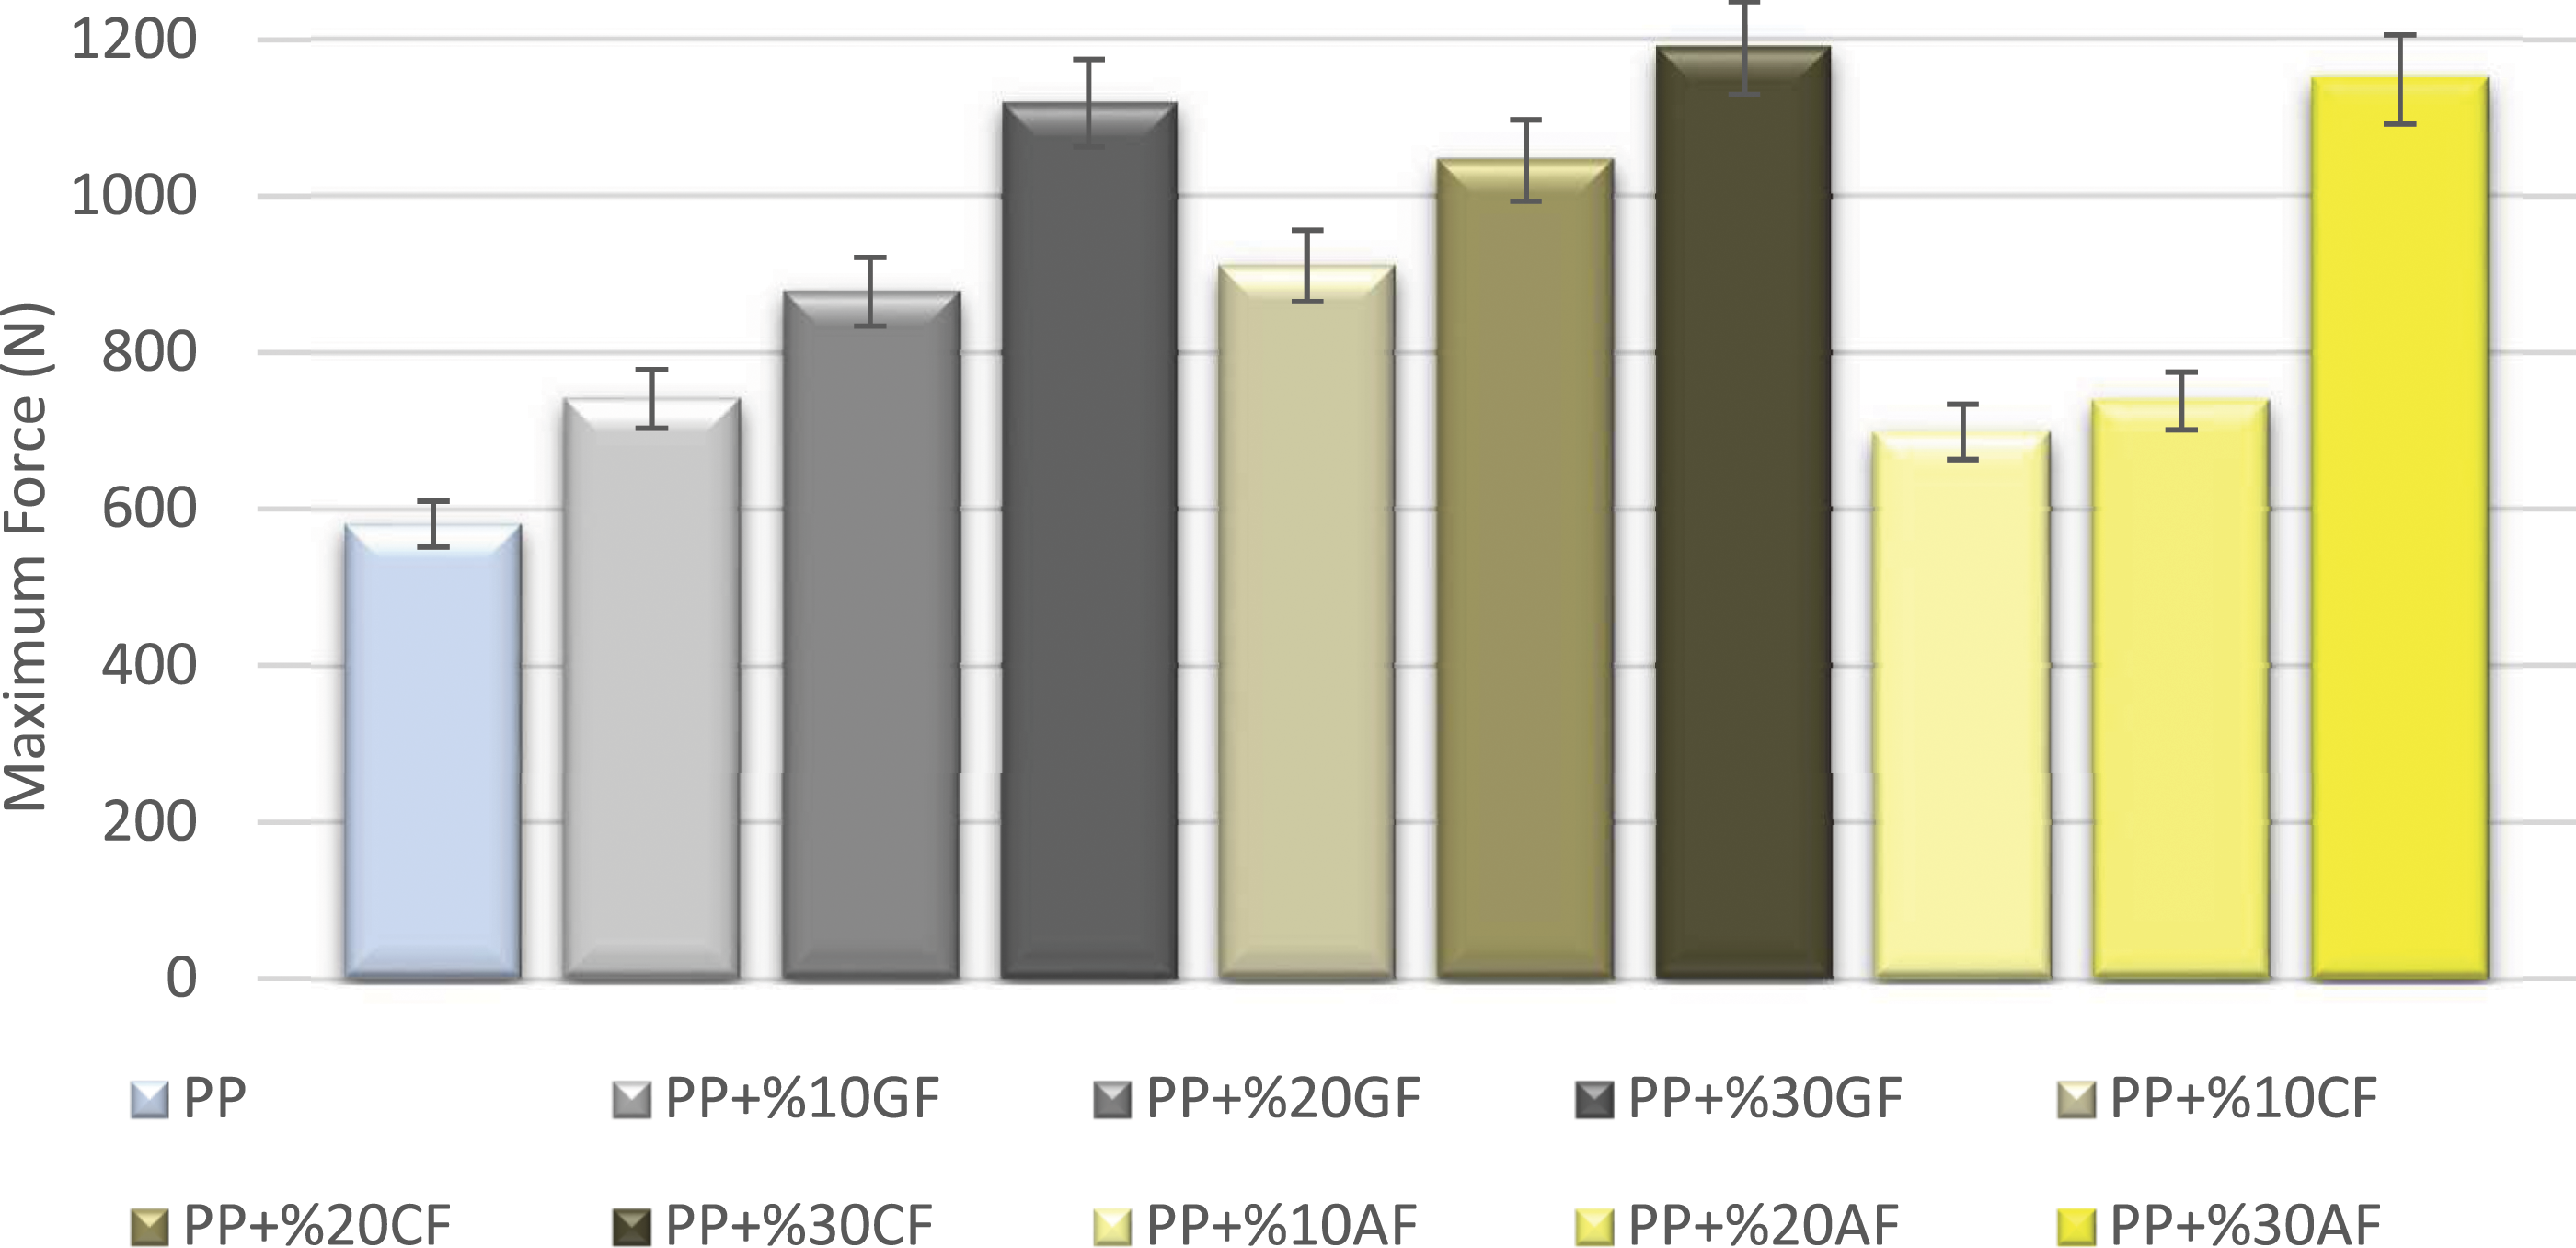
The summary of the test results: (1) It was observed that the highest enhancement for each composite was obtained for 30 vol.% reinforcement cases, (2) 30 vol.% GF reinforcement increased the drop weight impact by 1.9 times and increased it from 580 N to 1118,4 N, (3) 30 vol.% CF reinforcement increased the drop weight impact 2 times and increased it to 1189 N, (4) 30 vol.% AF reinforcement increased the drop weight impact 1.98 times and increased it to 1149 N.
When the SEM images of the fracture surfaces as a result of the Drop Weight test of 30 vol.% fiber reinforced composites were examined, it was observed that there was a brittle fracture in the fibers (Figure 6). SEM images of fractured surfaces as a result of impact test of 30% fiber reinforced PP composites (a) GF, (b) CF, (c) AF reinforced.
The response of composite materials to impact is very complex. Under impact loading, the impactor has invisible or poorly detectable damage modes. Low-velocity impacts may not cause visible damage. Impact damages caused by the impact of composites are matrix cracking, delamination, and fibers damages. The damage, which started with matrix cracking in low-speed impacts, caused delamination and fiber damage occurred due to the impact energy applied to the composite and continued to increase, and it was observed that the impactor stuck in the sample and pierced the sample. 41
Pull-out is seen in composites. When the surface of the fibers is examined, it is seen that the surface is not covered with polymeric matrix, and the surface is clean. This indicates poor interfacial adhesion between the fiber and the matrix. Dark circles around the fibers indicate local deformation in the matrix around the fibers.
When the fracture surface of 30 vol.% GF and CF reinforced composites in Figure 6(a) and (b) was examined, it was seen that the fibers were clean. This showed that the fiber-matrix interface adhesion performance was not good.
When the fracture surfaces of the 30 vol.%, AF-reinforced composites in Figure 6(c) were examined, bending and crossing were observed in the fibers with the increase in fiber content. This adversely affected fiber performance. 39
In summary of the test results, (1) when the SEM images of the fracture of 30% fiber reinforced composites were examined, it was seen that there was a brittle fracture in the fibers (Figure 6), (2) it was observed that the impactor stuck in the sample and pierced the sample, (3) pull-out was observed in composites, (4) it was observed from the surface of the fibers that the surface was not covered with polymeric matrix, and the surface was clean. That was an indication of having poor interfacial adhesion between the fiber and the matrix, 11 (5) dark circles around the fibers indicate the local deformation in the matrix around the fibers. 42
Analysis of experimental results
S/N ratios of experimental results.
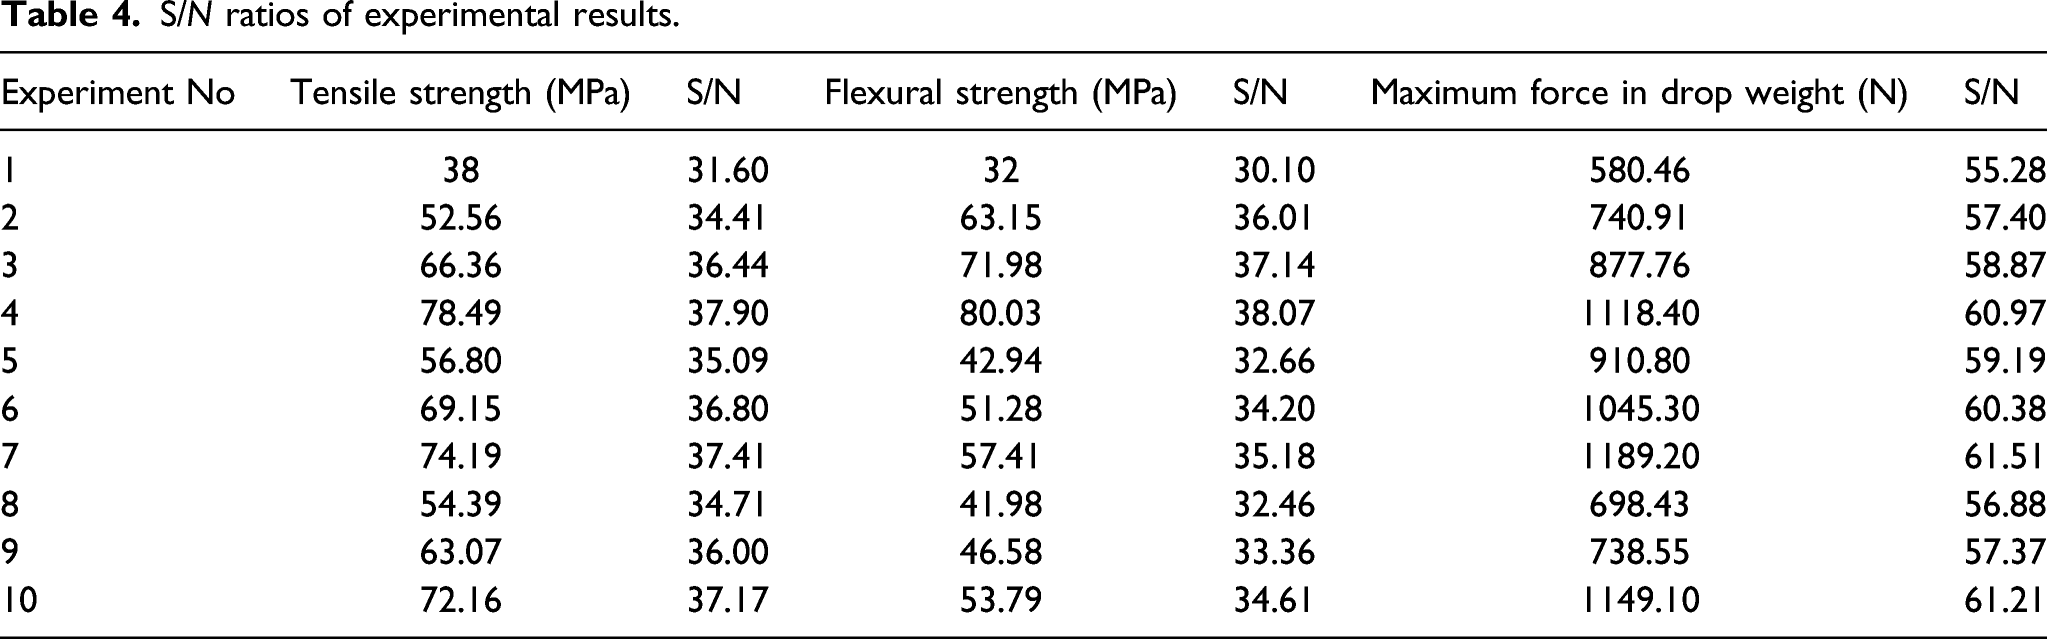
In the next step, the effect of each factor at each level needs to be assessed. For this reason, the average of the S/N ratios calculated in Table 4 is taken separately for each level of each factor. The largest signal-to-noise ratio gives the best experimental result. These values are graphically shown in Figure 7(a) to (c). The S/N ratio increases as the fiber content increases.
24
(a) S/N ratios for tensile strength (b) S/N ratio for flexural strength (c)S/N ratio for dropped weight.
When the S/N ratios of the tensile, 3-point bending, and drop weight experiments are examined (Figure 7), it is seen that the mechanical properties increase as the fiber content increases. However, it was observed that the effect decreased as the fiber content increased. The reason for this is that as the fiber content increases, the deformation energy of the composite increases, and the bond strengths between the matrix and the fiber weaken. It is seen that CF shows the highest effect on the composites (Figure 3). The main reason for this is that the mechanical properties of CF are superior. But the reason why CF performs lower than glass and AF despite this high surface energy and high strength properties is the surface roughness of CF. When SEM images are examined, CF has a smooth surface. This adversely affects the matrix-fiber performance.
To show the efficiency level of each experimental factor on the test results, the calculated F-values are two for the A factors, three for the B factor, and three for the error term, the degrees of freedom taken from the critical F table are F0.05; 2;3 (9.5) and F0.05; 3;3 (9.2) is compared with the value. The calculated F values are greater than the critical F values and provided the targeted 95% confidence level. 43
Mathematical modeling and data analysis by regression
Mathematical models have been developed to evaluate the relationship between input and output parameters. The output values of tensile strength, flexural strength, and impact strength have been used to construct the mathematical models. 44
In this study, second-order polynomial (quadratic) regression is used to fit data. The model constants are obtained by the least square optimization method. In the model, fiber volume fraction (b) is used as the independent variable to result from dependent variables (y(b) = the mechanical properties of the composites). The general representation of the equation is shown in equation (6).
44

Alternative to the second-order polynomial model, the non-linear (cubic) model, built by Mixture Design Analysis, is also used for estimating the output response corresponding to the input parameters. The general form of the model equation is shown in equation (7).
45

Mathematical models for predicting the mechanical properties of composites.
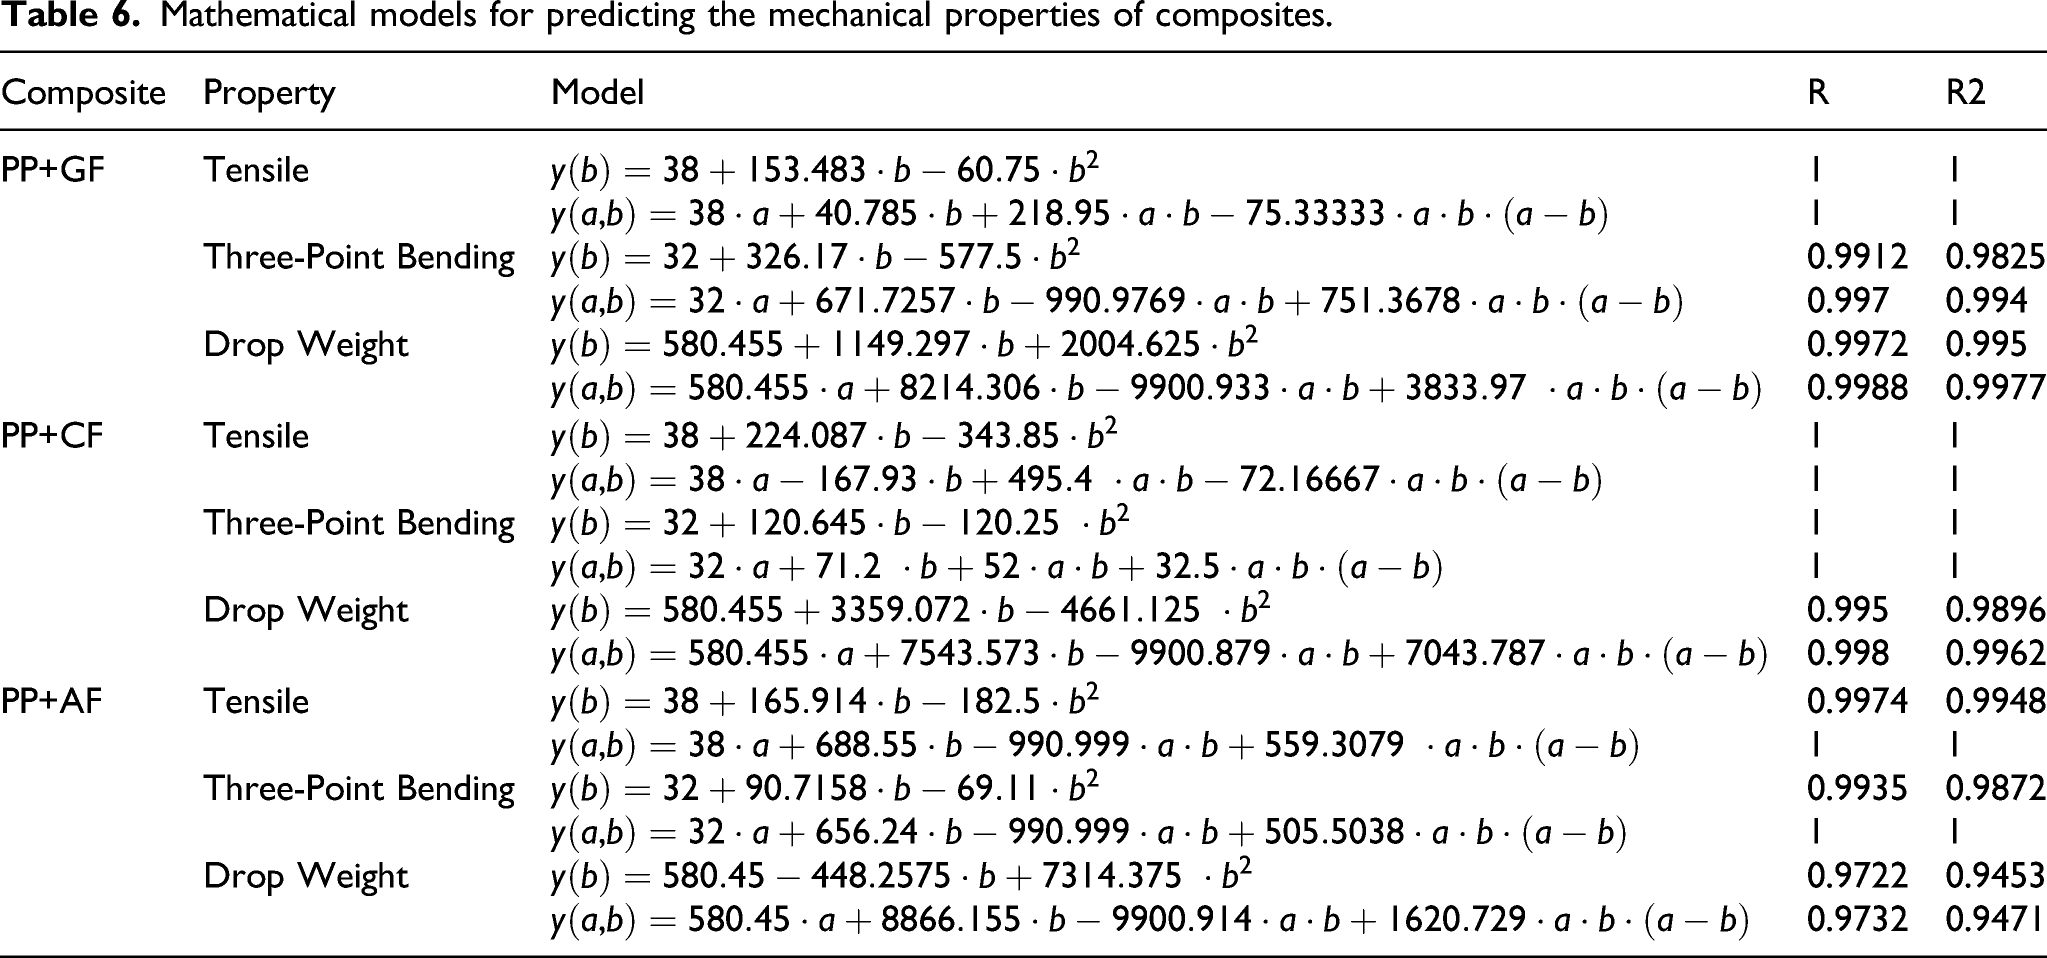
Comparison among the experimental values and corresponding fitted models, model 1 (Second-order polynomial model) and model 2 (Non-linear (cubic) model), are represented in Figures 8 to 10. In general, it is observed that these predicted values by both models and experimental values show good agreement. Hence, both models appear to be suitable for predicting the correct outcomes. However, the prediction performance of model 2 is better than model 1.
45
Composites’ tensile strength values versus fiber volume fraction for experiments and corresponding fitted models, Model 1 (Second-order polynomial model) and Model 2 (Non-linear (cubic) model). Composites’ flexural strength values versus fiber volume fraction for experiments and corresponding fitted models, Model 1 (Second-order polynomial model) and Model 2 (Non-linear (cubic) model). Composites’ drop weight values versus fiber volume fraction for experiments and corresponding fitted models, Model 1 (Second-order polynomial model) and Model 2 (Non-linear (cubic) model).


Conclusion
In this study, a comparative assessment of the mechanical properties of chopped GF, CF, and AF reinforced PP was performed. The presence of reinforcement material, the type of fiber, the degree of adhesion between the matrix and the interface, matrix/fiber content, distribution, and orientation in the matrix are all found to be effective parameters on the mechanical behavior of composites.
The results of the experiments show that when the fiber is present, the mechanical properties improve dramatically. On the other hand, when the fiber content increases, the effect in percentage decreases. Fiber efficiency decreased due to some fiber being pulled out from the matrix and deformations around the fiber.
Among the GF, CF, and AF reinforced composites, the composite made with PP+10 vol.% AF has the highest fiber efficiency. Also, it has been found that the most efficient fiber content among the chosen experimental factors is 10 vol.%.
From the results of S/N ratios and ANOVA analysis, it has been observed that the presence of fiber and fiber content has a greater effect on the composites than the fiber type.
Finally, nonlinear mathematical models were developed to fit the experimental data. The proposed second-order polynomial model (Model 1) and nonlinear cubic model (Model 2) represent the experimental data in good agreement. Therefore, it is reasonable to conclude that the proposed models are sufficiently robust to correlate the experimental response of polymer composites.
Footnotes
Declaration of conflicting interests
The author(s) declared no potential conflicts of interest with respect to the research, authorship, and/or publication of this article.
Funding
The author(s) received no financial support for the research, authorship, and/or publication of this article.