
Abstract
The polymeric based membrane technology has been an attractive alternative option among other gas separation technologies due to its ease of operation, good efficiency and low operational cost. However, a few concerns have been expressed about the polymeric based membrane technology for GS applications, such as the permeability-selectivity trade-off, mechanical stability and its environmental impacts. Therefore, the main objective of this research is to investigate the effects of polymer concentration on a biopolymer-PVA asymmetric membrane morphology, its mechanical properties and gas transport behaviour in order to optimize it for O2/N2 separation using the non-solvent induced phase separation (NIPS) technique. For this purpose, initially, a theoretical solubility model and cloud point phase diagram analysis were conducted to study the solubility and demixing behaviour of the PVA/Water/THF ternary system. Afterwards, these membranes were prepared at different polymeric concentrations from 10 to 14 weight percent (wt.%) and then characterized using scanning electron microscopy (SEM), porosity measurement test, universal testing machine (UTM) and gas permeation test to analyse their physical structure, mechanical properties and GS performance. The analysis results showed that a lower polymer concentration of 10 wt.% facilitated larger pore sizes of 2.486 ± 1.2 μm with a higher porosity of 77.73 ± 15.26% having higher O2 permeance but lower O2/N2 selectivity and mechanical properties. Whereas, a higher polymer concentration of 12 wt.% promoted smaller pore sizes of 2.096 ± 0.5 μm with a porosity of 56.31 ± 3.6%, having better O2/N2 separation performance and higher mechanical properties. However, increasing the polymeric concentration to 14 wt.% resulted in a densified membrane structure having voids and small pore sizes of 1.447 ± 0.9 μm, with a porosity of 31.35 ± 11.98%, and lower elasticity causing membrane rigidified, making it unsuitable for GS applications. Therefore, the intermediate concentration of 12 wt.% PVA asymmetric membrane represents the most optimum morphology and mechanical properties for better O2/N2 separation.
Keywords
Introduction
In recent years, membrane technology has gained quite a substantial interest among researchers in various fields, which includes gas purification systems and water treatment applications. Because of their remarkable properties, polymeric membranes are considered to be an innovative substitute for traditional technologies. They possess high physical and chemical stability, are resistant to chemicals and have the ability to bear elevated temperatures and pressure without affecting their structure and properties.1–4 Up till now, various types of polymeric membranes have been used for gas separation (GS) applications, in which asymmetric membranes outperform dense membranes in terms of performance by combining a thin separation layer with a support layer, resulting in a compact, durable structure with higher permeability. In these membranes, both layers are composed of the same materials.2,5 Commercially, asymmetric membranes are developed through the non-solvent induced phase separation (NIPS) method, which is a type of phase inversion technique. 6
The NIPS process depends on different factors, which include concentration of polymeric solution, coagulant selection (non-solvent) and its composition, additives in the polymeric solution, temperature of formation, etc. By precipitating the polymeric solution in different coagulants, effects the demixing rate of the process, which impacts on the morphology, stability, transport performance and durability of the membrane. 7 On the basis of demixing rate, the NIPS mechanism is classified into two types: (i) instantaneous demixing; and (ii) delayed demixing. In instantaneous demixing, a fast mass transfer process takes place between solvent and non-solvent, which leads to the formation of a finger-like structure asymmetric membrane. While in delayed demixing, the rate of mass transfer between solvent and non-solvent is slower, which forms a sponge-like morphology of the asymmetric membrane.7–9 The thickness of the separating layer also greatly affect the GS performance of the membrane. A thicker membrane structure would lead to higher selectivity, while having lower gas permeance and vice versa. Thus, optimal morphology is a crucial requirement for the preparation of membranes for GS applications. For its optimization, the concentration of the polymeric solution is an important key parameter in the NIPS process. 10
Several research projects were also conducted to investigate the impact of polymer concentration on the correlations between morphology, gas transport properties, precipitation conditions and mechanical properties of various polymeric asymmetric membranes. N.M. Ismail et al., 10 investigated the polysulfone (PSF) asymmetric membrane morphology and mechanical characteristics for GS applications by varying the polymer concentration from 20 – 30 wt. %. This study signifies that, by increasing concentration of polymeric solution leads to the thicker membrane matrix structure. This also resulted lower gravimetric porosity and decreased in productivity (permeance). The PSF concentration was optimized at intermediate value of 26 wt.%. This phenomenon of change in morphology of asymmetric membranes was explained by S. Hamzah et al. 11 They determined that, by increasing polymeric solution concentration leads to higher solution viscosity. Which caused diffusional exchange hindrance rate between the solvent and coagulant. Hence this resultant to the formation of smaller size of pores in asymmetric membranes with thick dense layer and vice versa, which was also supported by I. Pinnau and W. J. Koros. 12
H. Hasbullah et al. 13 used the phase inversion method to study the formation of Mindel S-1000 Asymmetric membranes at a varied polymeric concentration ranging from 20 to 23.5 wt. % for improved O2/N2 separation performance. Their research indicated that varying the polymer concentration has a substantial impact on the morphologies and gas transport properties of the resulting membranes. However, the asymmetric membranes with 21 wt.% had the optimal morphology with improved mechanical strength, which possessed a maximum selectivity (O2/N2) of 1.43 and an O2 gas permeance of 11.33 GPU. Similarly, F. Mohamed et al. 14 research group studied Poly (lactic acid) – PLA asymmetric membranes for O2/N2 separation, prepared at different concentrations from 15 to 25 wt.% by using dichloromethane as a solvent and water as a coagulant in the dry/wet phase inversion method. According to their studies, increasing PLA concentration resulted in a decrease in membrane porosity and an increase in membrane compactness and mechanical strength. However, at 17.5 wt.% of PLA, the membrane has higher tensile strength but lower elasticity, forming a highly brittle membrane unsuited for GS applications. The 15 wt.% PLA concentration possessed the optimal mechanical properties and GS factor, having O2/N2 selectivity of 1.03 and O2 gas permeance of 0.34 GPU at 6 bar pressure. According to these studies, it is suggested that it is essential to determined optimized polymer concentration for GS application.
In our previous work, 15 the impact of coagulation residence time (CRT) on the morphology, gas transport behaviour and mechanical properties of the biopolymer-PVA asymmetric membranes prepared using the NIPS method for O2/N2 separation were discussed. Which showed that a shorter CRT promoted the formation of smaller pores and a thicker dense skin layer, resulting in a lower O2 gas permeance. Contrary to this, a CRT favoured the formation of more porous structure, a thinner dense skin layer and higher O2 gas permeance with a selectivity (O2/N2) in the range of 1.0–1.5. The tensile strength of the optimized membrane also remained high despite the increase in porosity. Whereas, the effects of varying polymer concentrations on the physical and gas transport properties of the biopolymer-PVA asymmetric membranes prepared through the PVA/Water/THF ternary system using the NIPS method for O2/N2 separation were explored in this research work. In this study, the polymer concentration of PVA asymmetric membranes were variated in the range of 10–14 wt.%. The theoretical solubility model and phase diagram were also analysed in order to predict the demixing behaviour of the PVA/Water/THF ternary system. The physical structure of membranes were investigated using different characterization techniques, which includes scanning electron microscopy (SEM), gravimetric porosity test. Whereas the mechanical properties such as tensile testing and elongation at break percent (EAB) % were also analysed using ultimate testing machine (UTM). This research work also highlighted the gas transport behaviour and the selection of most optimum concentration of PVA asymmetric membrane for GS applications such as O2/N2 separation.
Materials and Method Section
Materials
Polyvinyl alcohol (PVA) with 87–90% hydrolysed having MW 30,000–70,000 was purchased from Sigma Aldrich, UK. Tetrahydrofuran (THF) with 99+% purity was purchased from RCI Labscan Limited, Thailand, and de-ionized water (DI) was purchased from Lab Care, Pakistan.
Solubilization Analysis
The polymer (PVA) solubility with solvent (THF) can be predicted and estimated through the Hansen solubility parameter (HSP) model. The HSP parameters include dispersion force (δD), polar bonding (δP) and hydrogen bonding (δH). In order to determine the solubility distance (Ra) between the water soluble PVA and the THF solvent, for estimating Ra, the following equation (1) was used.15–17


Solublization analysis between polymer (PVA) and solvent (THF) – Reprinted by permission from Springer Science Business Media, LLC, Springer Nature, Journal of Polymers and the Environment, Ref 15 copyright © 2020.

Membrane Preparation Method
To prepare PVA asymmetric membranes, different concentrations of polymer ranging from (10–14 wt.%) were dissolved in DI water as depicted in Figure 1. The solutions were continuously agitated at 550 r/min at a temperature (T) of 70°C–100°C for 2 h (hrs). Afterwards, it was degassed for 1 h at room temperature (RT) in order to remove trapped gas bubbles in the PVA solutions. These solutions were then finally cast on the glass plates over a thickness range of (14–125 μm), which were then immersed in the THF coagulation bath, tightly packed with aluminium sheet. The precipitation process takes 3 h to form different concentrations having a thin layer of PVA asymmetric membrane,
15
as mentioned in Table 2. The final asymmetric membranes having different concentrations and morphologies were dried at RT for 12 h. Then these membranes were thoroughly analysed using SEM, gravimetric porosity test, UTM and gas permeation test. Through these characterizations, surface, cross-section, pore connectivity, mechanical properties and gas transport properties were investigated to determine the optimum concentration of PVA asymmetric membrane for GS applications such as O2/N2 separation. PVA 3H asymmetric membrane casting having variable concentration using the NIPS method. Nomenclature for PVA Asymmetric membranes having different concentrations.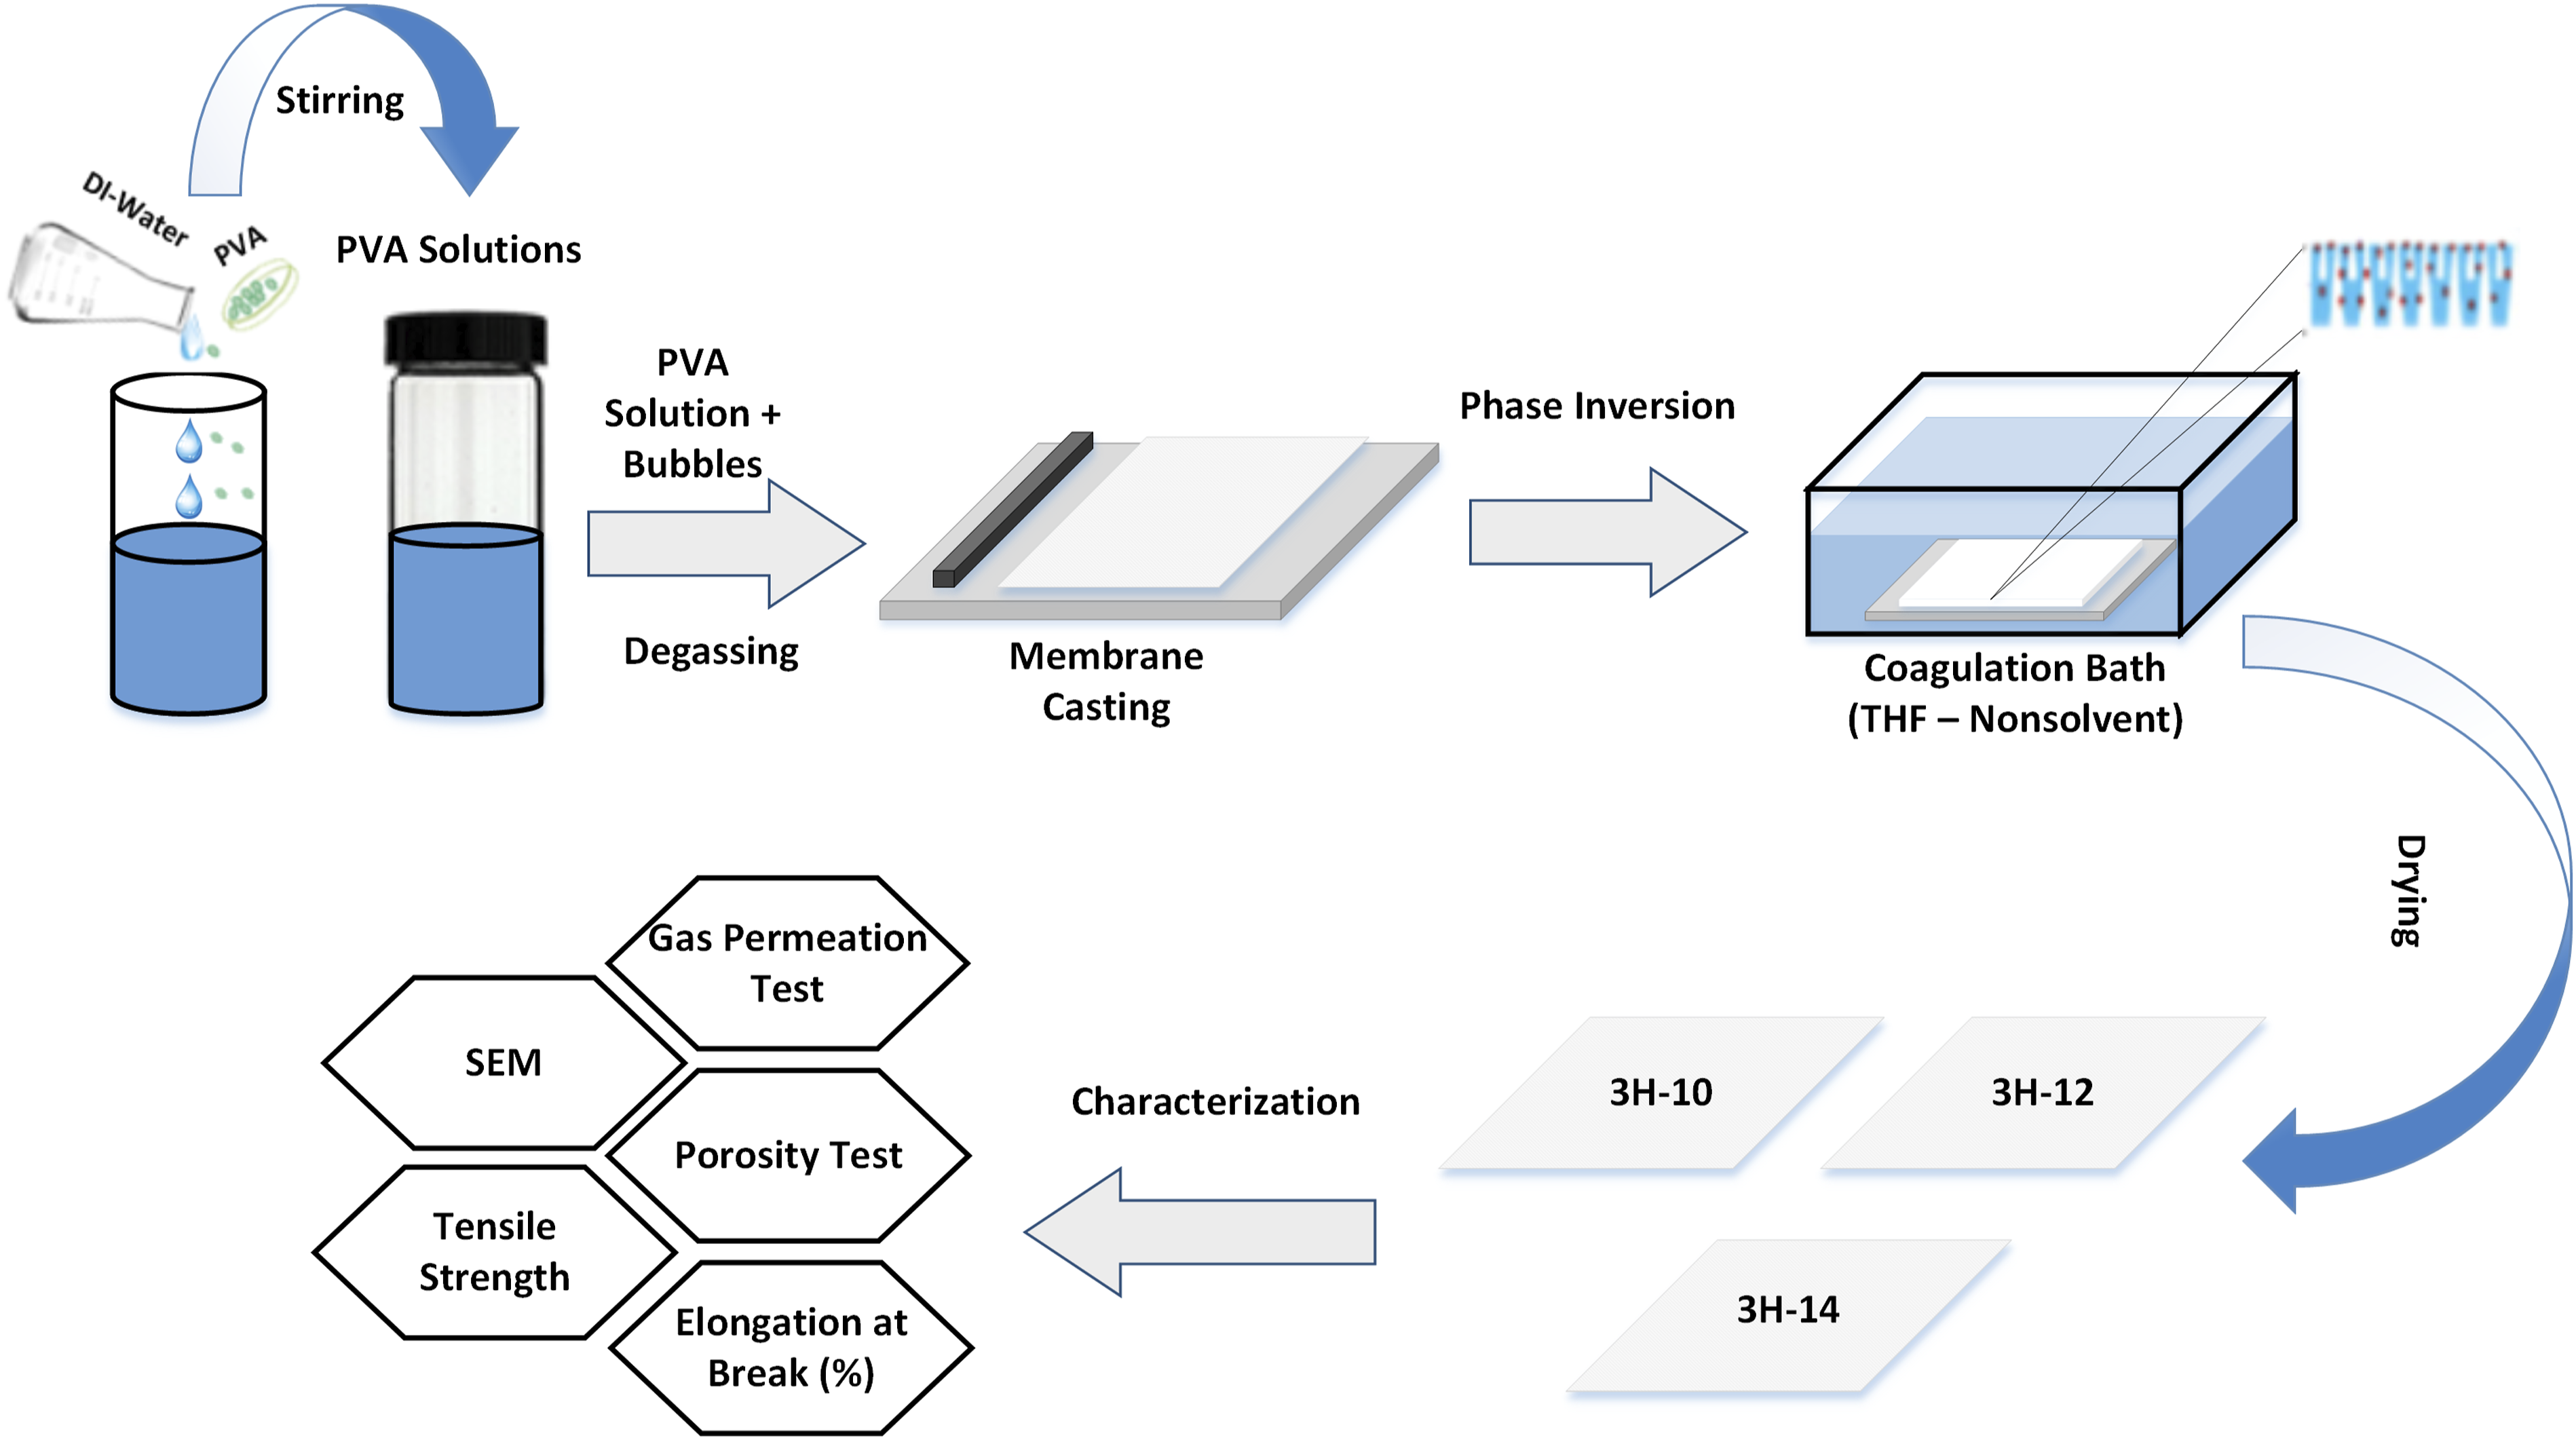

Characterization Section
Cloud Point Estimation
The cloud point was measured using rapid titration methodology. 19 The PVA solutions with different concentration of between (5–15 wt.%) were prepared using DI Water as a solvent in a sealed flask. The prepared solutions were placed on a hot plate having a magnetic stirrer for vigorous stirring and at a temperature of 20°C. After that, using a 5 mL syringe, a small amount of THF (non-solvent) was drop-wise slowly added to the solution present in the sealed flask and stirred for at least 1 h. The addition of THF was continued until a permanently cloudy product was formed. The final compositions were recorded and then the mass fraction of these three components with its percent were calculated, which were represented in the phase diagram.
Scanning electron microscopy (SEM) Analysis
The surface and cross-sectional morphology of PVA asymmetric membranes were investigated using SEM characterization. The polymeric samples were attached with copper stubs using carbon tape. After that, the polymeric samples were sputtered to form a very thin film of gold and then analysed by using a high-resolution scanning electron microscope – SEM (JSM-6490, Joel Japan). The analysis was recorded at different magnifications of 500X to 10,000X, whereas the 10 kV voltage was used in the process.20,21
Membrane Porosity Measurement Analysis
The inter-connectivity of PVA asymmetric porous structure can be determined by using gravimetric porosity (ε) analysis. Which is the fraction of the volume of pores over the total volume of the porous matrix. As mentioned below, equation (3) was used to estimate the porosity of the membrane.15,22
Mechanical Characteristics Testing
The mechanical properties of the PVA asymmetric membranes were investigated utilizing the Universal Testing Machine (UTM) SHIMADZU AGS-X Plus, Japan, which was used to evaluate the membrane tensile strength and elongation at break percent (EAB) %. This characterization of membrane samples was carried out according to ASTM standard D0882-02 at an elongation rate (ER) of 10 mm/min, as all the membrane samples were cut according to the dimension provided by the standard. In order to determine the standard deviation and remove random errors, three samples of each PVA asymmetric membrane were evaluated and mean values were reported.23,24
Gas Permeation Experiments
The gas permeation properties of the PVA asymmetric membrane were measured using pure O2 and N2 gases at different feed pressures and at a constant volume. A gas permeation testing system (PHILOS, Korea) was used to conduct the permeation experiments. The membrane cell of the rig has an area of 8 cm2. For the accuracy and reproducibility of data, three samples of each membrane were tested and mean values were reported. The measurements were obtained against a pressure of 2–5 bar at a constant temperature of 298.15 K. The rate of gas permeation was measured manually with the help of a soap bubble flow metre. The permeance of both gases was determined using the solution diffusion model as given in equation (4) due to the formation of a thin, dense skin layer of PVA asymmetric membranes.15,25

Results and Discussion Section
Phase Diagram and Cloud Points Estimation
The cloud point measurement analysis was experimentally carried out to investigate the thermodynamics behaviour of the PVA/water/THF ternary systems. In this system, THF as a non-solvent was added drop-wise to different polymer solutions (PVA-water) concentrations of 5–15 wt. %, which converts the initial polymer solution into a cloudy product (Cloud Point) as represented in Figure 2. The measured cloud point’s values were plotted in the ternary components phase diagram, forming a binodal curve. Table 3S represented the measured cloud point’s values, which were plotted in the ternary components phase diagram forming a binodal curve. The experimental binodal curve divided into two regions, the inside portion denoting the single phase region, where all the components are miscible, and the outside region of the curve represents the two-phase region, consisting of a polymer-rich phase (solid) and a polymer lean phase (liquid). The curve also provided information about the coagulation power, which is the known parameter that affects the phase separation. If there is less distance between the binodal curve and the polymer–solvent axis, then the non-solvent as a coagulant is considered strong, which results in instantaneous demixing and the formation of a finger-like structure.26,27 According to Figure 2, there is more distance between the binodal curve and the polymer–solvent axis. Also, during experimentation, it was observed that the phase inversion process also took a long time, which concludes that THF works as a weak coagulant for this ternary system, indicating the delay-demixing process and forms a sponge-type structure. Phase inversion ternary diagram for PVA/Water/THF system at 20°C.
Scanning electron microscopy (SEM) Analysis
PVA asymmetric membrane samples were analysed by SEM at different resolution ranges from 500X to 10,000X, to study the effects of the concentration variation on the morphology of membrane, which includes variation in pore size, dense and porous layers structure, of the asymmetric membrane. Through this analysis, PVA asymmetric membrane samples (3H-10, 3H-12 and 3H-14) have the same sponge-type morphology as predicted through phase diagram analysis. However, as illustrated in Figures 3 to 6, due to the change in polymer concentration from (10–14 wt.%), the sponge-type PVA asymmetric morphology membrane showed variations. PVA 3H-10 asymmetric membrane (A) porous layer, (B) dense layer, (C) cross-section. PVA 3H-10 asymmetric membrane (D) defective porous structure. PVA 3H-12 asymmetric membrane (A) porous layer, (B) dense layer, (C) cross-section – Reprinted by permission from Springer Science Business Media, LLC, Springer Nature, Journal of Polymers and the Environment, Ref 15 copyright © 2020. PVA 3H-14 asymmetric membrane (A) porous layer, (B) dense layer, (C) cross-section.


(a) Effect of Polymer Concentration on Membrane Thickness
The fabricated membrane samples of PVA 3H-10, 3H-12 and 3H-14 possessed a dense layer on top of the sponge-type porous matrix. These membranes have different thickness of 14–16 μm, 40–42 μm and 130–135 μm as shown in Figures 3, 5 and 6(c) cross-sectional SEM images, respectively. This change in thickness is due to the change in viscosity of the PVA solution. As a lower concentration of PVA solution shows lower viscosity, which can easily spread on a glass plate, forming a lower thickness of asymmetric membrane. Whereas, by increasing polymer concentration, the PVA solution started to show higher viscosity, which caused difficulty in spreading on the glass plate, forming a thicker membrane matrix.
Figure 3(b) illustrates some partial void formation in the top dense layer of PVA 3H-10, which was reduced in PVA 3H-12 and PVA 3H-14 asymmetric membranes having a uniformly densified top layer. The thickness of the dense layer also increased in the PVA 3H-12 and PVA 3H-14 asymmetric membranes. Whereas, Figures 3, 5 and 6(c) represents a reduction in porous structure as the membrane’s polymer concentration increases. The PVA 3H-12 shows the intermediate structure of both dense and porous layers having a uniform distribution of both layer thicknesses. This signifies that a higher polymeric concentration favours more a densified and thicker skin layer of the PVA asymmetric membrane.10,28 However, by comparing the SEM cross-section analysis of all the PVA asymmetric membrane samples, we concluded that the PVA 3H-12 membrane shows the most optimal and uniform cross-sectional morphology for GS applications such as O2/N2 separation.
(b) Effect of Polymer Concentration on the Membrane Porous Structure
By analysing SEM images from Figures 3 to 6(a), in-depth information about the porous layer morphology of the different PVA asymmetric membranes has been obtained, which shows that, PVA 3H-10, PVA 3H-12 and PVA 3H-14 have different average pore sizes of 2.486 + 1.2 μm, 2.096 + 0.5 μm and 1.447 + 0.9 μm, respectively, as represented in Figure 7. In PVA 3H-10 asymmetric membrane, large pores and an irregular connective porous structure have been observed. This membrane also shows some defective sides of the porous layer as illustrated in Figure 4(d), signifying a mechanically unstable porous matrix. Whereas, in comparison to the PVA 3H-10 membrane, the PVA 3H-12 membrane has smaller pores but the most uniform and interconnected porous layer. This also signifies mechanically stable porous membrane structure. However, PVA 3H-14 has both voids and small pores in the porous layer. The pore size of PVA 3H-14 is even smaller than the PVA 3H-12 membrane. This concludes that increasing the polymer (PVA) concentration leads to the formation of a denser membrane structure.28–30 However, the intermediate polymeric concentration (PVA 3H-12) shows the least pore size deviation. Which means that the PVA 3H-12 membrane has an optimal and uniform pore size distribution as compared to the PVA 3H-10 and PVA 3H-14 asymmetric membranes. Mean pore size of PVA asymmetric membranes at different concentrations.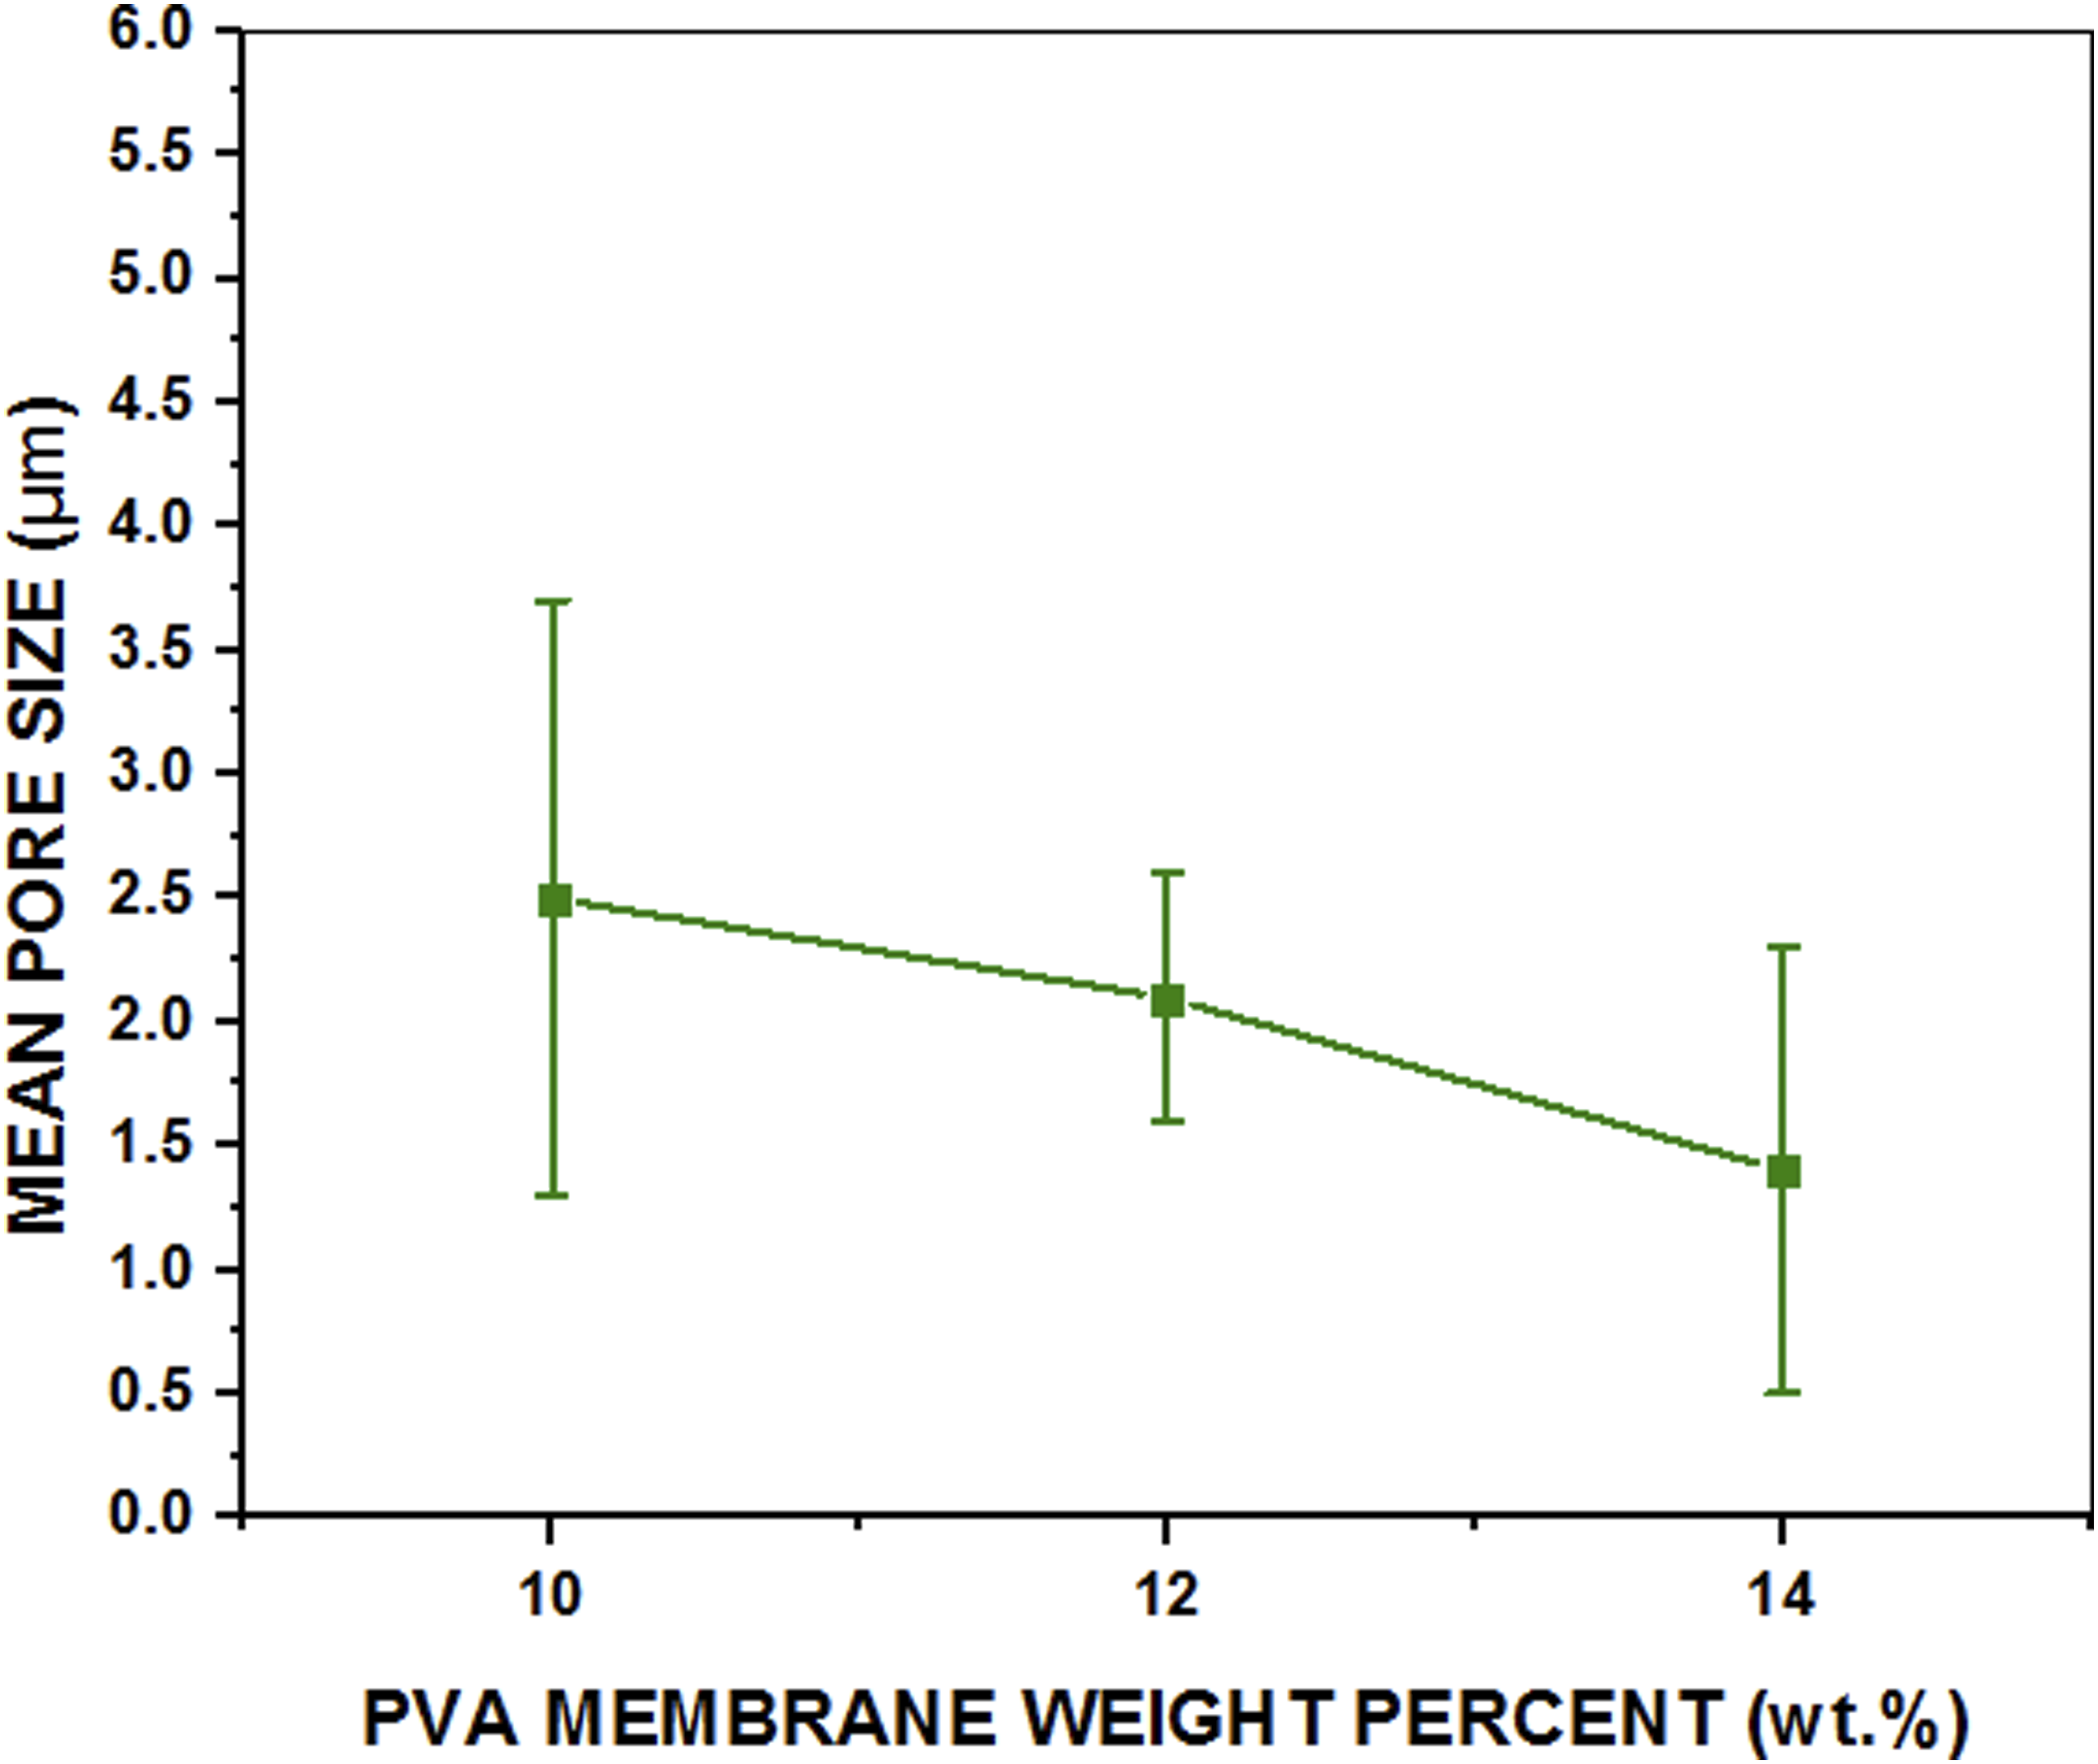
Membrane Porosity Measurement Analysis
The effect of polymeric concentration on PVA asymmetric membrane porosity was investigated through gravimetric-based experimental analysis. As shown in Figure 8, three samples of each PVA asymmetric membrane were evaluated to determine the average porosity with standard deviation, which also eliminates random errors in the characterization. The analysis results show that the PVA 3H-10, PVA 3H-12 and PVA 3H-14 asymmetric membranes have an interconnected average porosity of 77.73 ± 15.26%, 56.31 ± 3.6%
15
and 31.35 ± 11.98%, respectively. These results indicate that increasing the concentration of polymer (PVA) leads towards the lower gravimetric porosity of membrane.
31
Whereas standard deviation represents the membrane’s pore channel connective uniformity, the PVA 3H-12 asymmetric membrane has the most uniformly interconnected channels in the porous layer when compared to the other PVA asymmetric membranes. These analysis results are also supported and concluded by SEM characterization analysis. Gravimetric-based mean porosity of PVA asymmetric membrane samples.
Mechanical Characterization Analysis
The effect of polymer concentration on the mechanical properties of PVA asymmetric membranes was analysed based on their tensile strength and elongation at break percent (EAB) % as depicted in Figure 9. The analysis results show that PVA 3H-10, PVA 3H-12 and PVA 3H-14 asymmetric membranes have tensile strengths of 14.5 ± 1.2 MPa, 19.4 ± 2.88 MPa,
15
and 26.6 ± 1.2 MPa, respectively. As depicted in Figure 9, there is an increasing trend in tensile strength with respect to the increase in polymer concentration of PVA asymmetric membranes. However, elongation at break (EAB) % testing shows a different trend as compared to tensile strength testing results as illustrated in Figure 9. The (EAB) % of PVA 3H-10 to PVA 3H-12 increased from 158.4 ± 30.2% to 247 ± 48.77%.
15
Whereas, by increasing the polymer concentration further up to 14 wt. %, the PVA asymmetric membrane (PVA 3H-14) shows decrement, having (EAB) % of 121.5 ± 38.2%. This indicates that increasing polymer (PVA) concentration from 10 wt.% to 12 wt.% leads to a smaller size of pores, which enhances both tensile strength and (EAB) %. However, after increasing the polymer concentration from 12 wt.% to 14 wt.%, PVA membranes become rigidified, which shows an increased in tensile strength with reduced (EAB) % as compared to lower polymer (PVA) concentration based membranes.10,32–34 This concludes that PVA 3H-12 has the most optimum mechanical properties, which possesses higher durability for GS applications such as O2/N2 separation. Mechanical properties of PVA asymmetric membranes at different concentrations.
Gas Permeation Analysis
Gas permeation analysis was carried out to investigate the correlation between the membrane morphology obtained at different polymeric (PVA) concentrations and its gas permeation properties. The gas permeation analysis results of PVA asymmetric membranes were shown in Table 4S and graphically depicted in Figure 10, which showed the gas permeation properties with respect to the change in morphology of the PVA asymmetric membrane at a variable pressure of 2–5 bar. According to these results, the gas permeance increases with an increment in pressure, which is attributed to the increase in driving forces for both gases passing across the membrane.
14
The PVA 3H-10 membrane showed the highest permeance of both O2 and N2 gas as compared to the PVA 3H-12 membrane. However, in this case, the membrane showed distinctive voids formation in the skin layer and had selectivity in the range of 0.90–0.95, indicating the gas transport was predominantly determined by the pore flow.
35
This result showed that the skin layers of the PVA asymmetric membrane fabricated at 10 wt.% polymeric concentration through the NIPS method were highly defective. By increasing the polymeric concentration from 10 wt.% to 12 wt.%, a uniform thin dense layer is formed on the inter-connective porous layer as shown in the SEM results, which enhanced the separation performance of the membrane having an O2/N2 selectivity in the range of (1.0–1.5). In the case of the PVA 3H-12 asymmetric membrane, the gas permeance of O2 is higher than that of N2 gas, which is attributed to the better diffusion of O2 gas molecules within the dense skin layer. The kinetic diameter (K.D) of the O2 gas molecule is 3.46 A, less than the K. D of the N2 gas molecule, which is 3.64 A. This means that the space between the polymer chains has higher restrictions on passing bigger-sized molecules of N2 gas across the membrane. Whereas O2 gas molecules have a lower restriction of passage due to their smaller K.D. This result also proves the inverse relation of the gas molecular size with its diffusion coefficient.14,15 This gas separation performance of the PVA asymmetric membrane is expected to be further improved by increasing the concentration up to 14 wt.%. Although at this concentration, the membrane has a higher tensile strength, it also loses elasticity due to the increment of polymeric concentration up to 14 wt.%. Thus, the membrane becomes rigidified and also has a thicker dense skin layer. For these reasons, it is currently not readily evaluated further in a gas separation process.
14
Based on these results of the gas permeation investigation, it can be concluded that the PVA 3H-12 asymmetric membrane has the optimum GS properties and potential for O2/N2 separation. Oxygen (O2) and Nitrogen (N2) gas permeation analysis of PVA asymmetric membranes.
Conclusion
In this research work, a thorough study was conducted in order to investigate the impact of different polymer concentrations on the morphology, mechanical properties and gas transport behaviour of biopolymer-PVA based asymmetric membranes in order to optimize it for GS application such as O2/N2 separation. For this purpose, initially, a theoretical solubility model and cloud point phase diagram analysis were conducted to study the solubility and demixing behaviour of PVA/Water/THF ternary systems. Afterwards, PVA asymmetric membranes having different concentrations in the range of 10–14 wt.% were fabricated through the NIPS method. These membranes were then thoroughly analysed using different characterization techniques, which included SEM, gravimetric-based porosity, mechanical properties test (UTM) and gas permeation test. The overall analysis results showed that the fabricated PVA asymmetric membranes have the morphology of a sponge-type structure, having a top dense layer as predicted through the ternary phase diagram. The effects of different polymer concentrations have also been observed, which revealed that a lower polymer concentration of 10 wt.% resulted in larger pore sizes of 2.486 ± 1.2 μm, higher porosity of 77.73 + 15.26% and higher O2 gas permeance but lower O2/N2 selectivity and mechanical characteristics. Whereas, a higher polymer concentration of 12 wt.% resulted in smaller pore sizes of 2.096 ± 0.5 μm and a porosity of 56.31 ± 3.6%, leading to a better O2/N2 separation performance and higher mechanical properties. However, increasing the polymeric concentration to 14 wt.% resulted in a highly densified membrane structure with voids and much smaller pore sizes of 1.447 + 0.9 μm, a porosity of 31.35 + 11.98%, a thicker skin layer and lower elasticity. This indicated the rigidification of polymeric (PVA) asymmetric membrane at 14 wt.%, which makes it unsuitable for GS applications. This concludes that the PVA 3H-12 asymmetric membrane has the optimum polymeric concentration, which represents the most optimum morphology, gravimetric porosity and enhanced durability for better O2/N2 separation.
Supplemental Material
sj-pdf-1-ppc-10.1177_09673911221090053 - Supplemental Material for The influence of polymer concentration on the morphology and mechanical properties of asymmetric polyvinyl alcohol (PVA) membrane for O2/N2 separation
Supplemental Material, sj-pdf-1-ppc-10.1177_09673911221090053 for The influence of polymer concentration on the morphology and mechanical properties of asymmetric polyvinyl alcohol (PVA) membrane for O2/N2 separation by Syed S Karim, Sarah Farrukh, Arshad Hussain, Mohammad Younas and Tayyaba Noor in Polymers and Polymer Composites
Footnotes
Acknowledgements
We would like to acknowledge the support of MEMAR Lab at SCME, NUST Islamabad, Pakistan, for providing state-of-the-art lab facilities and Higher Education Commission (HEC), Pakistan grant No: 10032/Federal/NRPU/R&D/HEC/2017.
Declaration of conflicting interests
The author(s) declared no potential conflicts of interest with respect to the research, authorship, and/or publication of this article.
Funding
The author(s) disclosed receipt of the following financial support for the research, authorship, and/or publication of this article: This work was funded by the MEMAR Lab at SCME, NUST Islamabad, Pakistan and Higher Education Commission (HEC), Pakistan grant No: 10032/Federal/ NRPU/R&D/HEC/2017.
Supplemental Material
Supplemental material for this article is available online.
References
Supplementary Material
Please find the following supplemental material available below.
For Open Access articles published under a Creative Commons License, all supplemental material carries the same license as the article it is associated with.
For non-Open Access articles published, all supplemental material carries a non-exclusive license, and permission requests for re-use of supplemental material or any part of supplemental material shall be sent directly to the copyright owner as specified in the copyright notice associated with the article.