
Abstract
Development of polymers with excellent dielectric properties is a challenge for advanced electronic devices. Impregnating conducting fillers like carbon nanoparticles can enhance the dielectric constant, retaining low loss due to its compatibility and favorable polarization within the polymer matrix. The multifunctional characteristics of coal-derived nanocarbon can improve permittivity and facilitate large-scale production at a lower cost. The incorporation of coal-based nanocarbon in the polymer matrix and its dielectric response is seldom investigated. In this work, different ratios (10:90, 50:50, 90:10 by weight) of nanocarbon/PVDF composite are prepared via a simple solution casting technique. The dielectric measurements show that nanofillers’ addition significantly augments the dielectric constant value, which is ∼3 times (50:50 composite) higher than pure PVDF. The uniform distribution of 50% filler within the polymer matrix impeded the seepage of charge at the interface and enhanced the permittivity via polarization of accumulated charges. The composite also exhibited balanced dielectric loss that is essential for energy storage applications.
Introduction
High-performance dielectrics have got a massive potential for integration into electronic devices like capacitors, electromagnetic interface (EMI) shielding, sensors, actuators, and so on.1-3 Particularly, materials with high dielectric permittivity and low loss are hailed for the fabrication of advanced electronic devices. Owing to the excellent dielectric characteristics, stability, easy processing, and economic viability, polymeric dielectrics are strongly recommended as a potential substitute for conventional ceramic materials.4,5 Although polymer possesses low loss tangent and high breakdown strength, the poor value of dielectric constant limits its commercial applications. Manufacturing of polymer blend or composite is one of the effective strategies for obtaining new polymeric material with various properties. The dielectric permittivity of polymer can significantly be improved by introducing conducting fillers like metal and carbon-based nanoparticles into polymer matrices.6,7
Nanocarbon has gained its primary importance in developing advanced technologies owing to its chemical inertness, ease of functionalization, electrical and mechanical performances.8,9 The low dimensional carbon-based particles consisting of localized charge trap sites and surface defects can favor polarization and electronic conduction of embedding media. 10 Hence, nanocarbon fillers with high dielectric constant and insulating polymer matrix of low loss would help ratify the fabrication of novel dielectric hybrid materials. Madhu and his group have fabricated PVA composite incorporating nanocarbon synthesized by microwave irradiation technique. The impedance studies realized a direct dependence of dielectric permittivity on the loading of nanofillers. 11 Poly(methyl methacrylate) (PMMA) is functionalized by nanocarbon obtained via high-temperature carbonization of citric acid by Bouknaitir et al. 12 The presence of nanoparticles greatly augments the dielectric response of PMMA/nanocarbon composite through induction of polarization. The potential improvement of dielectric and electromechanical characteristics of poly(vinylidene fluoride) (PVDF) matrix on the dispersion of nanocarbon has also been reported. 13 The introduction of nanocarbon fillers in the polymeric matrices can complement the dielectric response of nanocomposite by retaining the physiochemical features of both components. In addition, the introduction of filler containing C=O (Carbonyl group) into the PVDF matrix can significantly improve the strong dipole interaction between C=O and CF2 group of PVDF. 14
Nanocarbon has been synthesized from various precursors by approaches like microwave irradiation, electrochemical oxidation, laser ablation, chemical ablation, and chemical vapor deposition. 15 Coal consisting of graphitic crystallites in its internal structure makes an ideal source for deriving novel nanocarbon as the reserves are cheap and abundant.16,17 Sub-bituminous coal with a low degree of coalification facilitates the ease of exfoliation of carbon nanoparticles comprising broad application prospects. This aids in the preparation of superior polymer composite and scales up the production at a lower cost.
In this work, the dielectric performance of PVDF polymer embedded with coal-derived nanocarbon is systematically investigated. PVDF is known for its excellent thermal and chemical resistivity, toughness, and low water absorption properties make it a potential contender for the fabrication of electronic components. Also, PVDF-based composites can easily be synthesized via solution casting and melting techniques. Here, we have prepared nanocarbon from sub-bituminous coal via acidic oxidation method and incorporated it into PVDF matrix at different loading % using solution casting method. The developed composite exhibited enhanced dielectric characteristics that can be employed for electrical applications and energy storage devices.
Materials and methods
Synthesis of nanocarbon
Carbon nanoparticles are synthesized from sub-bituminous coal via the acidic oxidation method (Figure 1). The precursor is powdered finely to attain a uniform size distribution. The sample is then oxidized with diluted HNO3 taken in the ratio of 1:5. The mixture is kept for sonication and followed by oil bath heating at 100°C for an hour. Once the sample is cooled down to room temperature, the supernatant and residue are segregated out of the solution via centrifugation at 4000 rpm for 15 min. The residue is washed multiple times until the pH value becomes seven and vacuum dried at 70°C. The collected sample is labeled as NC. Process of synthesis of nanocarbon from coal.
Preparation of composites
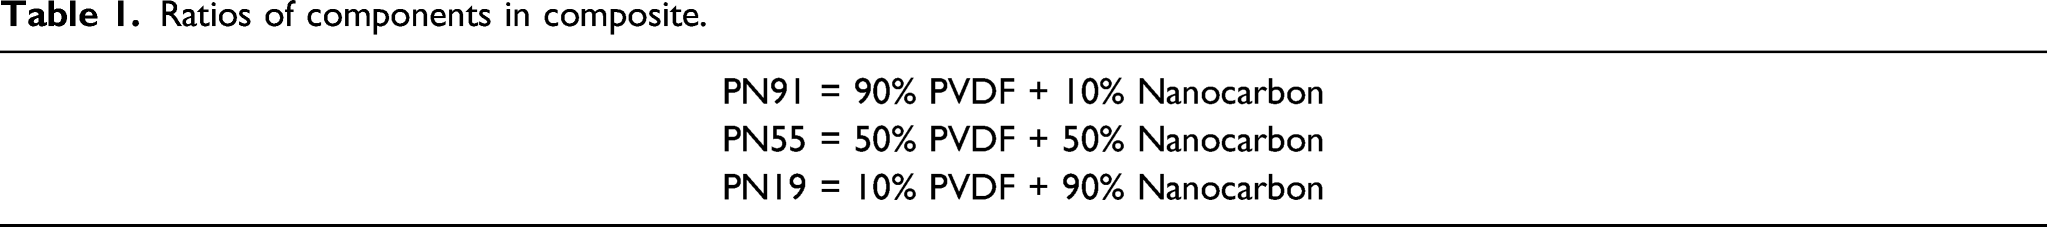
The schematic representation of the preparation of composite is shown in Figure 2. DMF is taken as a solvent for dissolving both PVDF and as-synthesized nanocarbon. First, PVDF is weighed in different ratios (90, 50, 10), mixed with DMF, and kept for 1h stirring. Similarly, the obtained nanocarbon in different ratios (10, 50, 90) is combined with DMF via stirring for 1 hr. Finally, both PVDF and nanocarbon solutions are mixed in appropriate ratios and stirred continuously for 2 h till the solution becomes homogenous. The obtained composites are dried at 60°C and labeled as PN91, PN55, and PN19. PVDF/nanocarbon composites are prepared by adding nanocarbon to the PVDF matrix in different ratios, as mentioned in Table 1. Schematic representation of the preparation of composite. Ratios of components in composite.
Characterization
The morphology of composites is analyzed using scanning electron microscopy (Gemini SEM-300 at 0.5 kV accelerating voltage). X-ray diffraction studies are carried out using Rigaku 6000 X-ray diffractometer with CuKα radiation in the range of 10°<2θ<80°. Fourier transform infrared spectroscopy is recorded from 4000 to 500 cm−1 using Shimazdzu IR spirit-FTIR spectrophotometer. Raman spectra are obtained over the range of 600–1800 cm−1 on inVia Raman Microscope at 785 nm laser excitation wavelength. The dielectric performance is characterized using an impedance analyzer (LCR-8101G) as a function of frequency. The dielectric constant was calculated using the equation ε = Ct/ε0A, where C is the capacitance, t is the thickness of the material, ε0 is the absolute permittivity of free space, and A is the effective area of the electrode. The dielectric loss was evaluated using the equation, loss tangent = tan δ, and dielectric modulus was assessed using the equation, M′=ε′/(ε′2/ε′′2).
Results and discussion
Morphological analysis
The morphological properties of composites are investigated employing scanning electron microscopy. It can be seen that the nanocarbon possesses a spherical morphology with nano-size ranging from 20 to 70 nm. The images of Figure 3 indicate the presence of nanocarbon, which is proportionate with the loading amount of filler. Figures 3(a) and (c) specify the non-uniform deposition of nanocarbon that occurred over the surface of the PVDF matrix. In comparison, Figure 3(b) suggests the uniform dispersion of carbon nanoparticles impregnated within the polymer matrix for PN55 composite. The aggregation of nanocarbon probably results from the excess and low amount of nanocarbon in PN19 and PN91, respectively, that hinders the self-assembly between nanocarbon and PVDF matrix. But with the 50:50 ratio of the components, the nanocarbon is found to have good dispersion within the PVDF matrix. This means that the PN55 composite is expected to showcase higher dielectric performance due to the strong adhesion between the matrix and the embedded nanofiller. SEM images of polymer-nanocarbon composite a) PN91 b) PN55 c) PN19.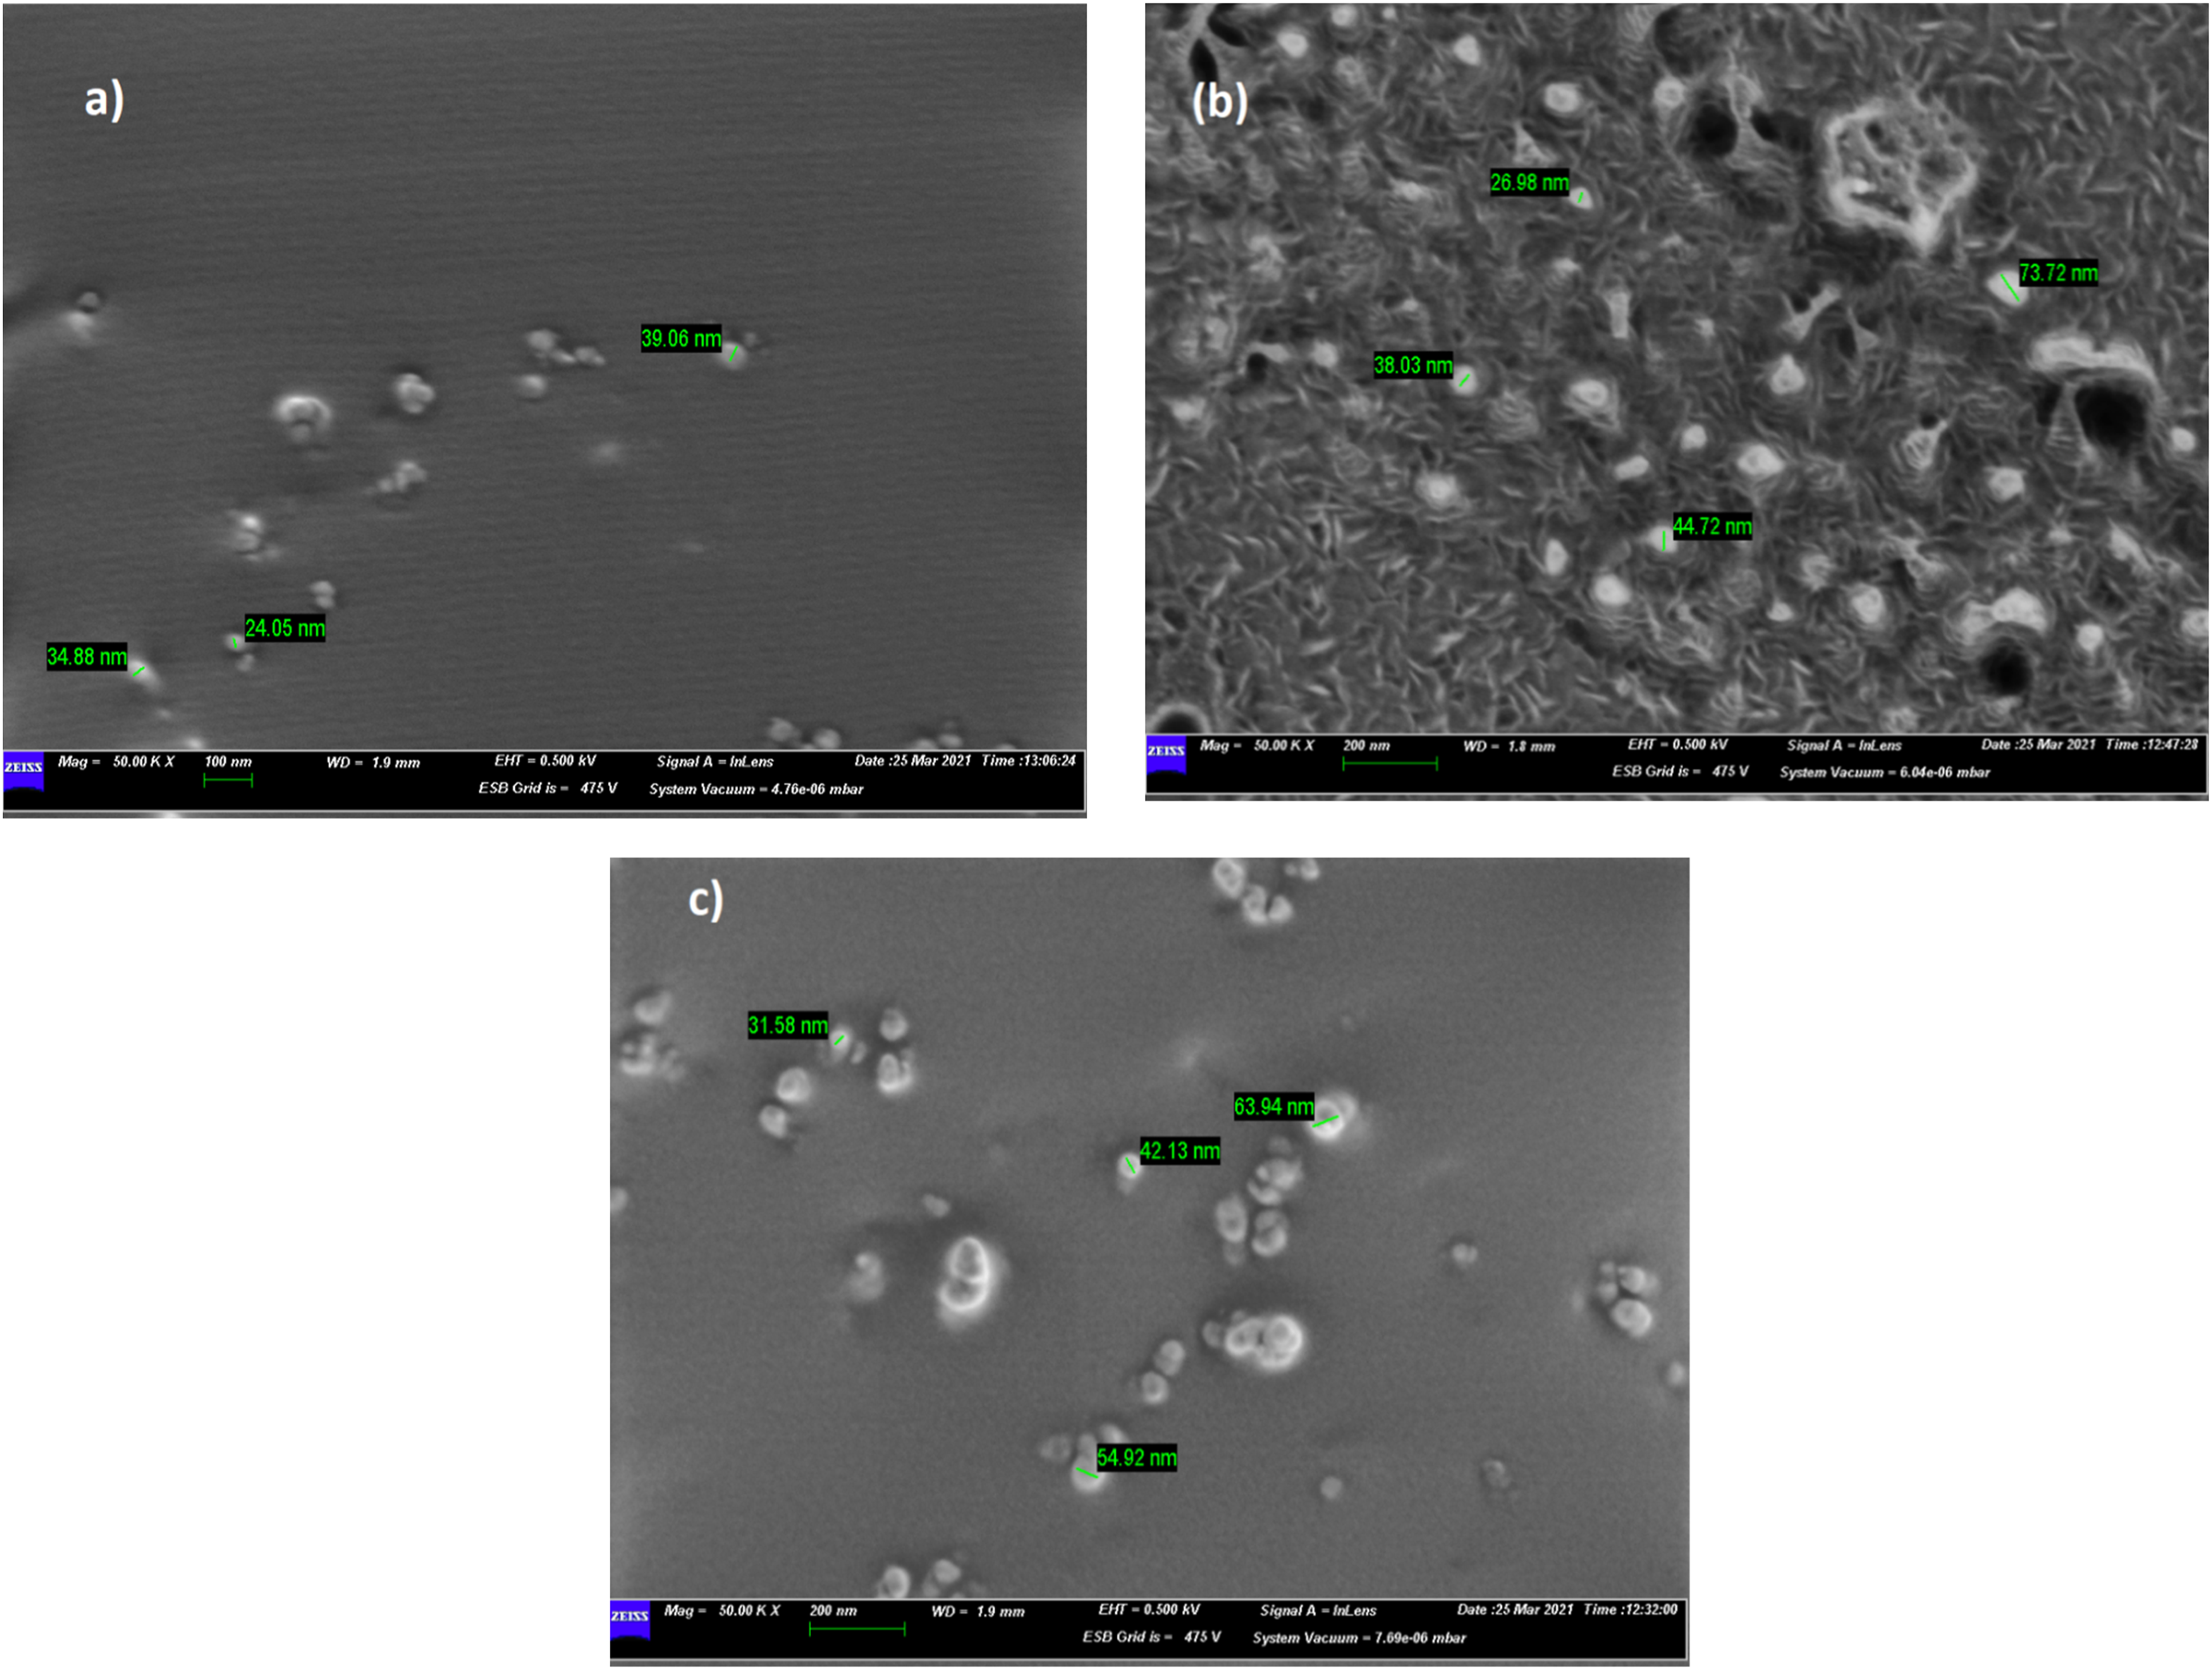
Structural analysis
The X-ray diffractograms of as-synthesized nanocarbon (NC), pristine PVDF, and nanocomposite in the 2θ range 10–80° are shown in Figure 4. The diffraction peak of nanocarbon centered at 2θ = 25.5° corresponds to the graphitic structures’ characteristic (002) plane.
18
The appearance of a broad hump is an indication of the formation of nanoscale-sized carbon with a few layers of graphene. The lattice spacing for the most intense peak at 2θ = 25.5° is calculated to be 0.37 nm. PVDF shows a prominent peak at 19.04° ascribed to the crystalline plane (100), which originates from the superposition of (200) and (110) reflections.
19
The other peaks appearing at 17°, 36°, and 41° are assigned to (020), (201), and (111) lattice planes, respectively. The interlayer spacing of PVDF is estimated from the diffraction peak at 2θ = 19.4° to be 0.47 nm. Structural analysis of the polymer-nanocarbon using XRD.
It can observed from the XRD patterns of nanocomposites that the peak at 19.04° are intensified by increasing the loading % of fillers up to 50%. This increase in the peak intensity can be correlated with the degree of crystallinity. According to Hodge, the increase in peak intensity discloses the increment in the crystalline regions of the composites, which is directly related to its mechanical properties. 20 Conversely, the crystallization behavior of PN19 is considerably different from PN91 and PN55. This is because the diffraction peaks of PVDF were masked by the strong reflections from nanocarbon. 21 However, the prominent diffraction profiles of both PVDF and nanocarbon are witnessed in composite PN55. The d-spacing of PN91 and PN55 is calculated to be 0.44 and 0.45 nm, respectively. Thus, the X-ray analysis confirms the successful incorporation of nanocarbon to the polymer matrix, and it is in agreement with the surface morphological investigation by SEM.
FTIR analysis
FTIR studies are carried out to study the presence of functional groups on prepared nanocarbon (NC), pristine PVDF, and different wt% ratios of PVDF/NC nanocomposites (Figure 5). In nanocarbon, signals for the stretching vibration of –OH (around 3406 cm−1) and stretching vibrations for the absorption of C–H (at 2923 cm−1) are observed. The IR vibration modes corresponding to C=O and skeletal vibration of aromatic rings are identified at 1745 and 1596 cm−1, respectively. The sample also presented FTIR bands at 1250 cm−1 for the stretching vibration of –C–O–C.
22
The fingerprint region for the crystalline phases of PVDF is recorded in the region of 900–500 cm−1. The strong transmission peaks observed at 590 and 619 cm−1 are the characteristic α-phase vibrating modes of the CF2 group. The CH2 rocking of α-phase shows absorption in the region of 835 cm−1. The contribution to the dip in transmission at 873 and 1400 cm−1 can be attributed to the C–F stretching of β-phase and α-phase, respectively, whereas the peaks at 3119, 3015, 3013, 2975, 2930, 2970, and 2860 cm−1 correspond to the asymmetric and symmetric stretching vibration of the CH2 group. The bands at 1432 and 1395 cm−1 are due to the deformation of the CH group.
23
FTIR analysis of the polymer-nanocarbon composite.
The interaction between the polymer matrix and the filler can be inspected in terms of hydrogen bond formation endorsed by FTIR spectroscopy. 24 The peak at 873 cm−1 due to the -CF-CH-CF- vibrations of the pristine PVDF exhibits a shift to higher energy (880, 886, and 809 cm−1) in composites, signifying the existence of strong intramolecular interaction between polymer matrix and nanofiller. With the addition of 10% filler, an increase in the intensity of the β-phase peak (873 cm−1) with a simultaneous reduction in the α-phase peak (835 cm−1) is observed. But with the further increment in the amount of nanofiller, the intensity of IR bands due to PVDF peaks is found to be declining. On grafting the nanocarbon filler onto the PVDF matrix, it is the PN55 composite that revealed the characteristic bands of both NC (∼1596 cm−1) and PVDF (900–500 cm−1), demonstrating the successful embedding of NC within the PVDF matrix of PN55 in comparison to the other two composites.
Raman analysis
Raman spectrum of samples recorded with 785 nm excitation wavelength is shown in Figure 6. The synthesized nanocarbon displays the presence of D-band and G-band at 1325 and 1590 cm−1, respectively. These bands feature the amount of graphitization (G-band) and the presence of defects and disorders in the hexagonal lattice (D-band).
25
The ratio of the intensity (ID/IG) of these bands is calculated to be 1.1. PVDF spectra reveal the characteristic Raman bands at 837 and 1350 cm−1. It resembles the Raman intensities from different functional groups such as CH2 rocking, CF2, and C-C stretching. The Raman band at 813 and 1431.4 cm−1 are assigned to the deformations of the CH2 group.
26
Raman analysis of the polymer-nanocarbon composite.
Focusing on the PVDF/NC composites, the Raman spectra of PN55 and PN19 are analogous to nanocarbon, albeit the characteristic graphitic band and defect band appeared to be broad and less intense. In the case of 10% additive, these bands are neither distinct nor prominent. Conversely, the Raman bands of PVDF are distinguishable only in PN91 and PN55, as there are still few layers of PVDF film exposed to the laser irradiation. Compared with pure nanocarbon, PN55 and PN19 show a blue shift in the positions of the G band up to 6 cm−1 and 14 cm−1. Moreover, in PN55, the Raman band of PVDF 813 cm−1 and 837 cm−1 is shifted to higher energy (874 and 901 cm−1). This behavior is a confirmation of the intense interaction between the polymer matrix and filler by means of Π- Π stacking, H-bonding, and electrostatic interactions. 27 Although nanofillers’ loading ratio in composites is different, the ID/IG ratios of PN55 (1.00) and PN19 (0.99) are identical, validating the effective hybridization between PVDF and nanocarbon.
Impedance analysis
The nanocarbon is a better choice as a nanofiller for fabricating polymer nanocomposites due to its impressive electrical conductivity and favorable polarization. On blending the polymer with nanocarbon used as fillers, they tend to interconnect with each other, and a conductive network is induced within the polymer matrix.
28
Consequently, the insulating polymer nanocomposite is altered to a conducting one. Thus, even less amount of conducting fillers can establish an appreciable dielectric value in comparison to other metallic or ceramic fillers. To understand the effect of nanocarbon fillers on the dielectric properties of the PVDF matrix, the dielectric constant of nanocomposites is measured and depicted in Figure 7. a) Frequency dependence of dielectric constant (ε′) of the polymer-nanocarbon composites; b) variation of dielectric constant on the volume fraction of nanofillers at 1 kHz.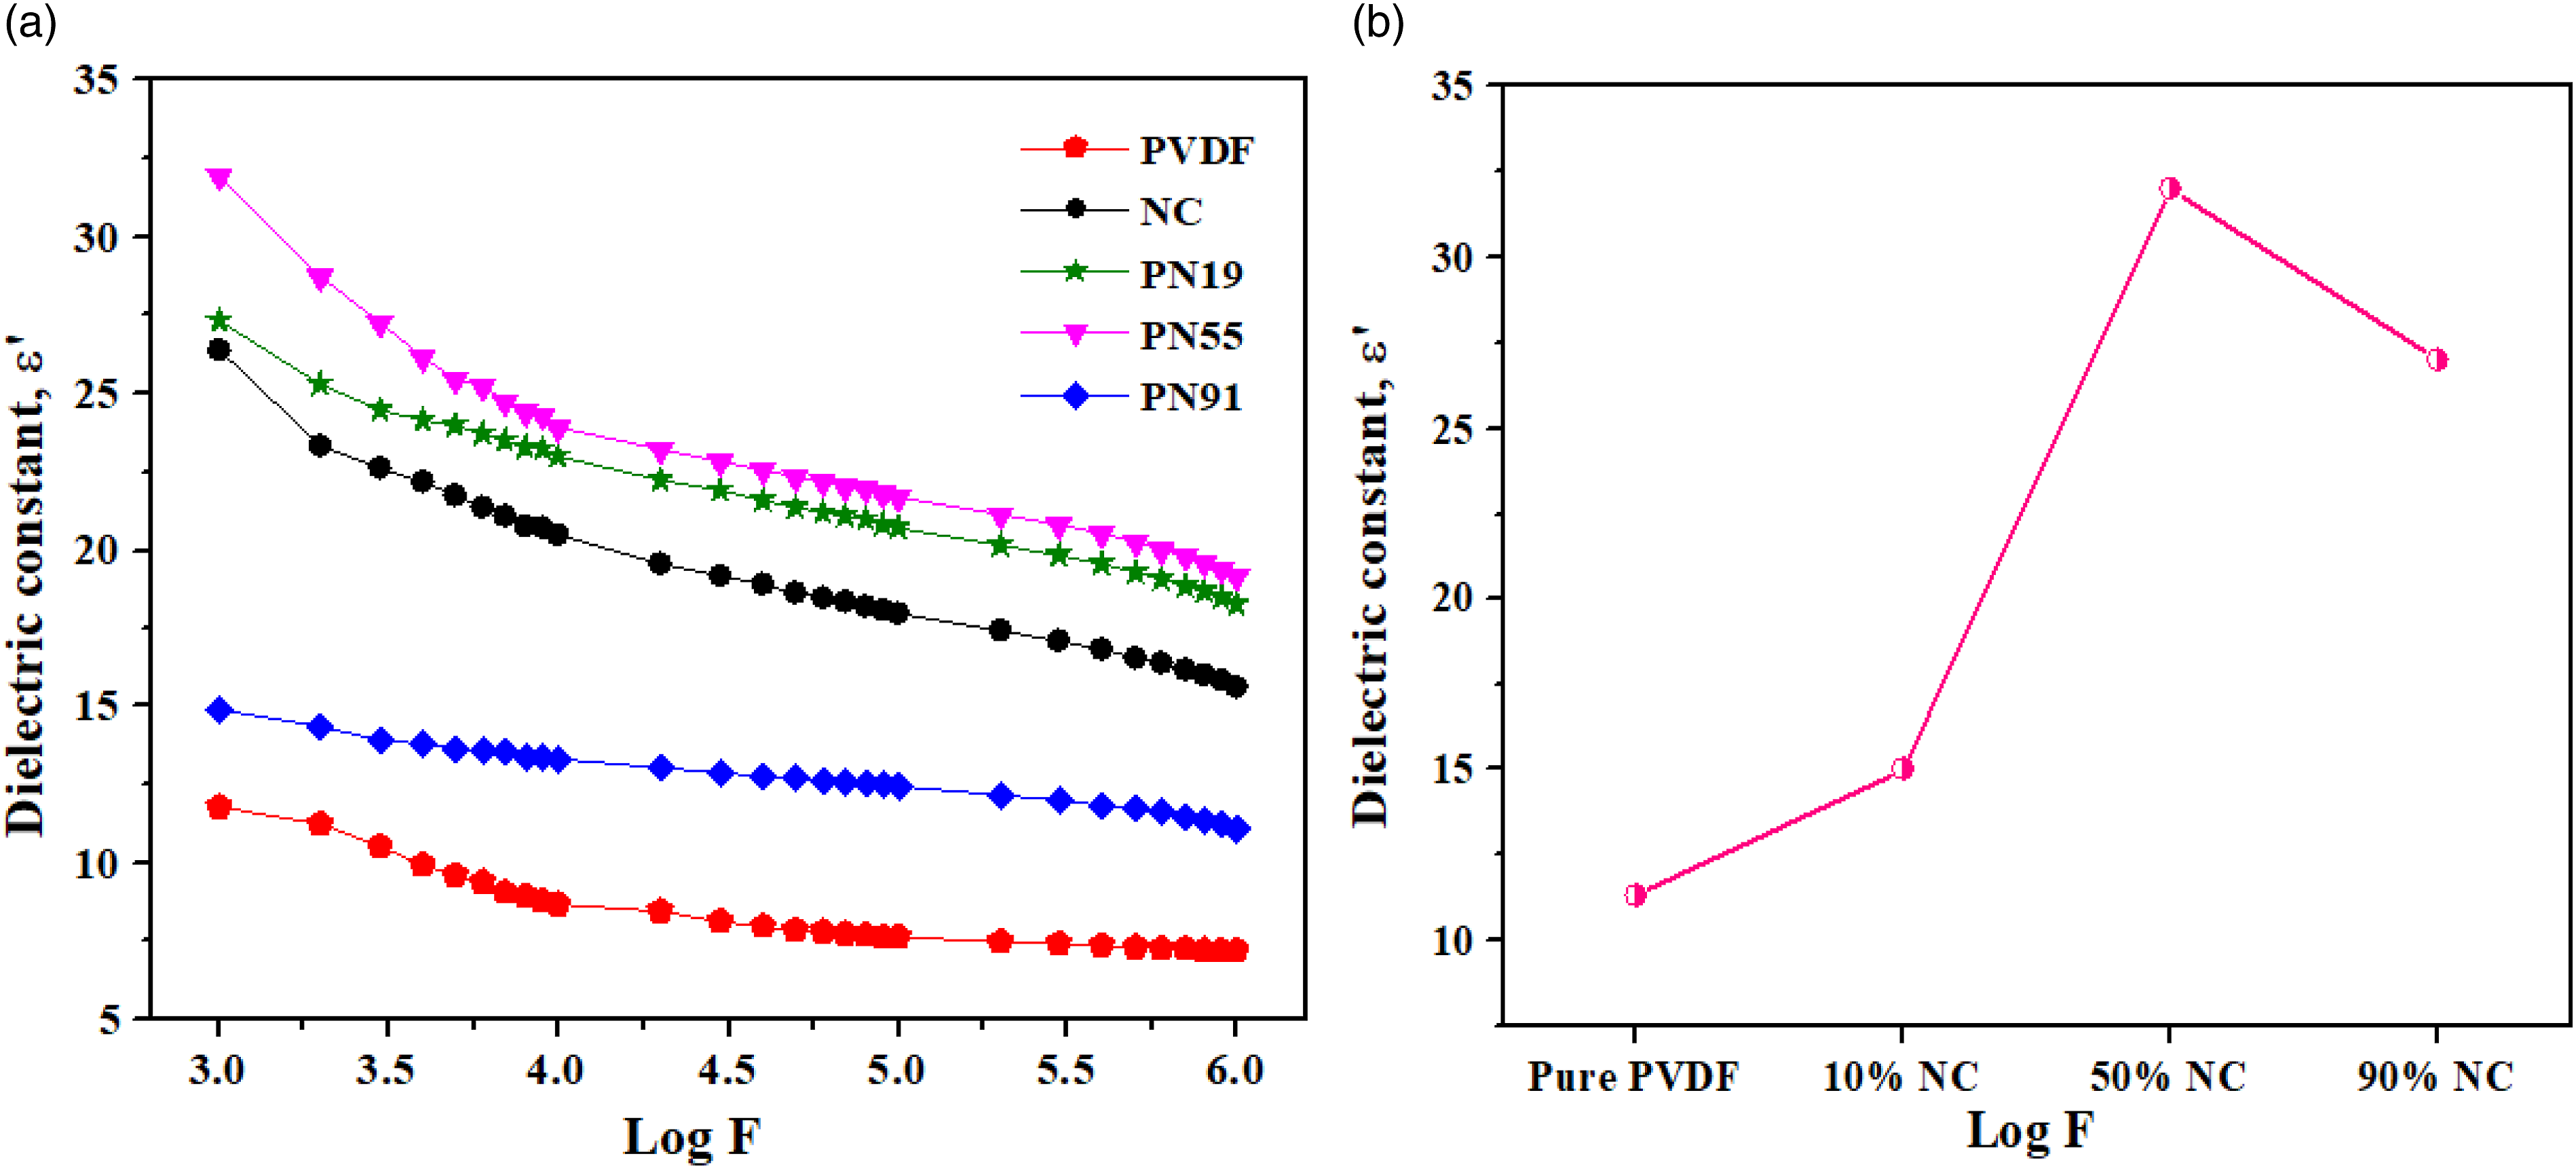
It is observed that the dielectric constant increases with the volume fraction of nanofillers. Dielectric constant attains a maximum value of 32 on the addition of 50% nanofillers, which is ∼3 times higher than that of the pure PVDF matrix (∼11) at 1 kHz (Figure 7(b)). This augmentation in the value of the dielectric constant of nanocomposites could be attributed to the rise in the electric field of PVDF matrix upon the incorporation of nanocarbon. Underneath this point of view, the enhanced dielectric value is owing to the larger densities of dipoles at constituent interface aroused from the accumulation of charges via interfacial polarization. 29 On further increasing the loading % of nanofillers (90%), ε’ values are further decreased. This is because the nanofillers brought more polarized ions leading to more dielectric loss and hence deteriorated the dielectric constant value. The variation of the dielectric constant on the volume fraction of nanofillers at 1 kHz is shown in Figure 7(b).
It is the combination of ionic, electronic, orientation, and space polarizability components that contribute toward the higher dielectric value at lower frequencies. 30 For an applied electric field, these electric dipoles get enough time to get aligned and thus augment the polarization. As seen in Figure 7(a), bare nanocarbon, PN55, and PN19 composites had a significant reduction in the value of the dielectric constant at higher frequencies because of the reduction in the net polarization effect. Though the permittivity of PN91 is low compared to other composites, it could retain the same dielectric value over the entire frequency range till 1 MHz without much drop.
The interfacial attachment of nanofillers within the PVDF matrix can be estimated from the degree of dielectric loss. The variation of dielectric loss with frequency is shown in Figure 8. The loss tangent significantly declined with increasing frequency due to the reduction of polarization effects.
31
Clearly, all the polymer-nanocarbon composites maintained a low loss tangent in comparison with the neat PVDF counterpart. But, concurrently, the values of dielectric constant and tan δ are found to increase with the amount of nanofillers. These results indicate that the addition of conductive nanofillers contributed to enhanced permittivity and resulted in a higher dielectric loss. With the increase in the loading amount of nanofiller, the dipole charges are further increased, leading to higher dielectric loss. Compared with the dielectric performances of all composites, the PN55 displayed higher dielectric permittivity (32) while maintaining a low loss tangent (0.09). The excellent compatibility of 50:50 composite offered a spatial distribution of filler within the polymer matrix that obstructed the leakage of charge at the interface and enhanced the permittivity via polarization of these accumulated charges. Frequency dependence of loss tangent (tan δ) of the polymer-nanocarbon composites.
The variation of AC conductivity (σAC) with the frequency for the prepared nanocomposites is depicted in Figure 9. The σAC values of all composites were nearly constant up to 10,000 Hz (Log 4). But, a rapid exponential change in the AC electrical conductivity has appeared at each step of higher frequency. These higher values of σAC are attributable to the substantial migration of charge carriers via the hopping mechanism.
32
Increasing the content of nanofillers augmented the electrical conductivity of nanocomposites at the entire frequency range. The maximum σAC is observed for NC, followed by PN19. The 10% and 50% addition of nanofillers over the insulating layer of PVDF matrix maintained a lower conductivity, and it is in agreement with the dielectric performance of the composites, as shown in Figure 7. Often, low values of AC conductivity are anticipated in dielectric materials for reducing the conduction of charge carriers. Frequency dependence of AC conductivity of the polymer-nanocarbon composites.
Figure 10 shows the variation of dielectric modulus as a function of frequency. The dielectric modulus articulates the relaxation process of the electric field in the material. At lower frequencies, the dielectric modulus approaches zero and attains an optimum maximum value at higher frequencies. This phenomenon is due to the lack of restoring forces for the charge carriers on the application of external electric fields, and a similar trend has been observed for many polymer composites.33–34 These results demonstrated the reverse frequency behavior of the dielectric modulus in comparison to the dielectric constant. Likewise, the value of M′ decreases with the amount of nanocarbon fillers, while the value of the dielectric constant is increasing. Frequency dependence of dielectric modulus (M′) of the polymer-nanocarbon composites.
Conclusions
The PVDF nanocomposites with various loading % of nanofillers were fabricated utilizing coal-derived nanocarbon. The morphological, compositional, and dielectric properties had been investigated as a function of nanofiller loading. The carbon nanoparticles of size 20–60 nm are synthesized from sub-bituminous coal, and the successful incorporation of nanocarbon in the polymer matrix was confirmed through SEM analysis. But the effective hybridization between PVDF and nanofiller was validated in PN55 composite with the aid of XRD, FTIR, and Raman analysis. An enhancement in the value of the dielectric constant was observed on incorporating nanofillers in comparison to pure PVDF. This improvement could be attributed to the higher electrical conductivity and interfacial polarization inside the nanocomposite system contributed by the nanocarbon fillers. The variation of dielectric parameters with the loading % of nanofillers and applied frequency was also noticed. The PN55 composite exhibited higher dielectric permittivity (32), fewer loss tangent (0.09), and lower AC conductivity than other composites that might be suitable for energy storage devices. This work offers a facile and economical strategy to achieve an optimum dispersion of fillers in the polymer matrix and hence to obtain a significant dielectric material desired for electronic applications.
Footnotes
Acknowledgments
The authors are grateful to the Centre for Research, CHRIST (Deemed to be University), Bangalore for facilitating X-Ray diffractometer, Fourier transform infrared spectroscopy and RAMAN microscopy and impedance analyzer for the successful completion of the work. The authors would also like to acknowledge the ZEISS center, Bangalore, in providing scanning electron microscopy analysis.
Declaration of conflicting interests
The author(s) declared no potential conflicts of interest with respect to the research, authorship, and/or publication of this article.
Funding
The author(s) received no financial support for the research, authorship, and/or publication of this article.