
Abstract
Pultruded fibre reinforced composite (PFRC) can be used in oil drilling because of the corrosion resistance and energy conservation. The studies of fatigue behaviour and life distribution model are essential to the design and application of PFRC. In this paper, the tensile fatigue behaviour of PFRC was studied by the experiment combining with the acoustic emission technology, and the fatigue life distribution model is established to explore the distribution characteristics of fatigue life. The results show that, the fatigue load level has little effect on the failure modes of PFRC, and the matrix damage occurred firstly followed by the appearance of the delamination and the fibre damage. The proposed fatigue life distribution model can accurately describe the three stages of the fatigue life curve, and can well predict the fatigue life under different survival rates.
Keywords
Introduction
The fibre reinforced composite materials have comprehensive advantages in safety, economics and functionality. 1 The pultruded fibre reinforced composites (PFRC) have the properties of light weight and corrosion resistance, and have been used in many fields, such as the telecommunication towers, civil engineering buildings and oil drilling industry.2-4 The fatigue behaviour of PFRC is a major concern because PFRC mainly bears cyclic load during the engineering application.
The fatigue damage of fibre reinforced composite often accompanies cyclic loading. There are several damage modes appearance, including fibre fracture, matrix cracking and delamination, which results in degradation of the materials properties. The loading pattern, material type and environmental conditions are all the influence factors for the type and occurrence sequence of damage modes.5-8 In addition, the stacking conditions have obvious effects on the fatigue damage distribution and evolution. A large amount of researches have been carried out to study the damage mechanisms for unidirectional, cross-ply and angle-ply laminates.
9
The fatigue damage evolution of brittle matrix unidirectional fibre reinforced composites has been analyzed through the proposed model and the experiment,
10
the results showed that the matrix cracking, fibre/matrix debonding, fibre breakage appeared in sequence and the damage events contributed individually to the stiffness degradation. Huang et al.
11
revealed that the warp yarn breakage of the woven composites is the critical damage mode leading to the inflection point of stiffness degradation, followed by the binder yarn breakage, a wide range of matrix cracks and interface debonding cracks. Varvani-Farahani
12
has investigated the dominant physics and mechanism of damage in matrix, fibre-matrix interface, and fibre for off-axis unidirectional composite, and proposed damage parameter
In order to serve the engineering application, the fatigue life of fibre reinforced polymer composites has been studied in certain numbers.13-19 Fatigue life curves are commonly expressed as S-N curve, where S represents the applied stress (or strain) range, or maximum stress (or strain), N represents the fatigue life. According to the predominant mechanisms of the fatigue failure, the typical S-N curve of the fibre reinforced composite can be divided into three distinct regions. 20 For the first region, the stress (or strain) value is high, and the fibre breakage and the interfacial debonding are the dominant failure modes; the S-N curve has a shallow slope. For the second region, the matrix cracking and interfacial shear are the dominant failure modes, and the curve has a steeper slope. For the third region, the slope of the S-N curve turns to flat again, and there is no matrix crack propagation below a certain strain level, which forms the fatigue limit.
Besides, a large number of studies have shown that the fatigue life of fibre reinforced polymer composite has stochastic mature.21,22 The large fatigue life dispersion of the composite is mainly caused by the variation of fibre volume fraction, defects, high anisotropy of the material and the fibre distribution and arrangement. 23 It is very necessary to consider dispersion in fatigue life prediction of the composite structures in engineering for safe service. A variety of statistical distribution methods, including normal distribution, 24 lognormal 25 and Weibull,26,27 have been used to describe the fatigue life data of fibre reinforced composites, and the distribution parameters have been calibrated by experiments. The normal distribution has obvious limitations. For the normal distribution, when the failure probability is very small, the fatigue life of the material tends to zero, which is quite different from the real situation. In the reliability analysis, the normal distribution is often used to predict the short and medium life zone. Weibull distribution has been proved to be particularly suitable for describing the distribution of strength and fatigue life data of composite materials, and it is still applicable to the prediction of fatigue life in long life zone.
Although there have been many studies on fatigue damage and life prediction of composite as mentioned above, it is still difficult to directly use the above methods or theories for composites with complex structures. The configuration of the PFRC studied in this paper is complicated, the internal damage of the PFRC under fatigue conditions is also hard to be obtained by simple test. Meanwhile, the exploration of the fatigue damage evolution is the basis for determining the fatigue failure of PFRC in engineering application, and the S-N curve is also an important theoretical reference for fatigue design. The objection of this paper is to clarify the tensile fatigue behavior and fatigue life dispersion of PFRC. The dominant failure mode, fatigue damage types and the order of various damage initiation have been fully investigated through the experiment combining with the acoustic emission technology. The fatigue life distribution model of PFRC has been established to obtain the probabilistic fatigue life curve family.
Experiment
Setup
The PFRC was made of continuous fibre reinforced epoxy. It consists of three layers as shown in the Figure 1, namely, the carbon/epoxy layer in the centre, the glass/epoxy layer at the outside and the wound glass/epoxy layer with angle Configuration of PFRC
The experiment setup is shown in the Figure 2. The tension-tension fatigue test of PFRC was performed through the hydraulic servo fatigue testing machine of CCQB (Changchun Qianbang) as shown in Figure 2(a). At the same time, the PCI-2 acoustic emission (AE) detection device of PAC company was used to monitor the real-time damage of the fatigue, and the AE system is shown in Figure 2(b). During the process of loading, various damages occur, which lead to the rapid release of local source energy and the generation of transient elastic wave, namely, AE signal. AE technology can record the AE signals generated during the loading process of composite materials. By analyzing the characteristics of the signals, and judging the characteristics of acoustic sources, different damage modes can be distinguished. Finally, the relevant information of damage initiation, damage evolution and final failure can be obtained. Fatigue test machine (a), Acoustic emission detection System (b).
Because PFRC is easily destroyed under compression loads, the clamps of the test machine break the cylindrical specimens easily, a couple of transitional grips are used to grip the specimen as shown in the Figure 3. Figure 3(a) shows the cross-section of the transitional grip, it can be seen that the transitional grip consists of four parts, namely, the inner cone sleeve (marked as 1), the outer cone sleeve (marked as 2), the compression nut (marked as 3) and the clamping screw sleeve (marked as 4). Figure 3(b) shows the actual photo of the transitional grips. The taper of the inner cone sleeve is consistent with that of the outer cone sleeve. The inner cone sleeve has an opening gap along the axial direction, which is used as the reserved space for pressing. After the inner cone sleeve is inserted into the outer cone sleeve, the PFRC is passed through the inner cone sleeve, and is screwed into the compression nut. Under the action of the compression nut, the inner cone sleeve is gradually pushed inward. Due to the existence of taper, the outer cone sleeve evenly presses the inner cone sleeve, making its axial gap narrow, so as to achieve the effect of squeezing and holding the PFRC sample. Four load levels, namely, Case 1, Case 2, Case 3 and Case 4, were selected for the tensile fatigue test. The maximum cyclic loads of Case 1, Case 2, Case 3 and Case 4 are 180 kN, 150 kN, 120 kN and 90 kN, respectively, the corresponding minimum cyclic loads are 60 kN, 50 kN, 40 kN and 30 kN, respectively, and the stress ratio k is 0.33. The fatigue test was carried out under normal temperature and pressure, and the force-controlled Sine wave loading with 10 Hz frequency was adopted. (a) Cross-section of the transitional grips, (b) The actual photo of the transitional grips.
Determination of tensile fatigue failure
The typical evolution law of residual stiffness for composite under tensile fatigue load is shown in Figure 4. For fibre reinforced composites, the elastic modulus of fibre and matrix is quite different, because of the high elastic modulus of fibre, it bears most of the load under tensile fatigue load. At the early stage of the fatigue, a large number of small cracks appear in the matrix, and accumulate continuously, resulting in the rapid reduction of the stiffness. In the middle stage of fatigue, when the density of matrix crack reaches saturation, the work done by external load is consumed by the coupling of cracks, delamination and fibre fracture. The work required by the above failure modes is much more than that of the matrix cracking, so the middle fatigue stage is long, and the stiffness attenuation is relatively slow. At the later stage, the failure of matrix and delamination is serious. The stress concentration at the crack tip is higher than the fibre strength, which causes the fibre fracture. Due to the large number of fibre fracture, the stiffness of the composite decreases rapidly until the composite final fails. The typical evolution law of residual stiffness of composite under tensile fatigue.
For the unidirectional composite plate with fatigue load along the fibre direction, the degradation law of stiffness and the total decrease degree of stiffness at final failure are basically consistent under different stress levels. 28 Besides, the decrease degree of stiffness at failure is relatively small. The PFRC studied in this paper is composed of three layers, but the winding layer of Layer-2 is very thin. The PFRC is mainly composed of Layer-1 and Layer-3, whose fibres along the axial direction. Therefore, the stiffness degradation of PFRC is similar to that of unidirectional composite plate. Considering that the stiffness of PFRC decreases little when the ultimate tensile fatigue failure occurs, and a lot of damage must have occurred before the failure, which affects the engineering application, the failure criterion of tensile fatigue test for PFRC is that the axial stiffness decreases by 5%. That is, when the axial stiffness decreases by 5%, the fatigue failure of PFRC is determined.
Fatigue life model considering dispersion
The prediction of S-N curve is the general objective of fatigue failure studies. However, the fatigue life of fibre reinforced polymer composite shows obviously dispersion because of impurities, bubbles, porosity, lean/rich resin, fibre bending and other defects. It is necessary to study the dispersion of the fatigue life based on probability distribution.
Fatigue life model
Fatigue life model is the basis of the fatigue life distribution model. Here, the fatigue life model of PFRC subjected to tensile fatigue load was proposed based on the shape characteristics of the S-N curves, 29 which includes three periods. With the increase of the transverse fatigue life, the absolute value of the slope of the S-N curve increases at the first period, and the S-N curve is approximately linear in the second period. At the third period, the absolute value of the slope of the curve gradually decreases, and the S-N curve finally tends to approximate horizon.
Because the thickness of Layer-2 is only 0.9 mm, the volumes of Layer-1 and Layer-3 in PFRC studied in this paper are greatly larger than Layer-2, which indicates that the influence of Layer-2 to the strength of PFRC can be ignored. The fibre direction of Layer-1 (Carbon/epoxy) and Layer-3 (Glass/epoxy) is consistent to the loading direction, therefore, the tensile strength

Considering the classic shape characteristics of S-N curve for fibre reinforced polymer composite, the fatigue life function of PFRC can be expressed as follows

Fatigue Life distribution model
For composite materials, the Weibull distribution has been proved to be particularly suitable for describing the distribution of fatigue life. 27 Under a certain stress level S, the probability of fatigue life N is the survival rate P. Here, Weibull distribution was used to study the probability distribution of the tensile fatigue life of PFRC, and the P-S-N curves based on the three parameter Weibull distribution were developed.
Under a certain stress level, if the fatigue life N obeys the three parameter Weibull distribution, the probability density function can be expressed as
30

The fatigue life N of PFRC under constant amplitude tension cyclic load is taken as random variable. The probability of

By substituting equation (4) into equation (3), and integrating, the distribution function of fatigue life is obtained as follows

Then the probability of fatigue life

The probability

The expectation and variance of variables obeying Weibull distribution can be expressed as equations (8) and (9), respectively.


Assuming that for x fatigue stress levels S
i
(i = 1, 2, x), the number of test samples for the ith stress level S
i
is m
i
, and the fatigue life is sorted from small to large by array N
ix
(x = 1, 2, m
i
). In order to obtain the probability distribution model of fatigue life, that is, P-S-N curve, it is necessary to determine the statistical parameters
The logarithm of both sides of equation (7) can be expressed as

Combining the equations (8–10), the nonlinear equations are established. According to a set of tested fatigue lives under a certain stress level, the nonlinear equations are solved, and the three parameters of Weibull distribution under a certain stress level can be obtained.
Since the fatigue life N under stress level S
i
is related to probability, the equation (6) can be rewritten as

According to equation (2), and considering the probability distribution of the fatigue life, the fatigue life probability distribution model of PFRC can be obtained as follows

Results and discussion
Fatigue life and failure morphology
The tensile fatigue life of PFRC obtained by the experiment.

The failed PFRC is shown in Figure 5. It can be seen that the PFRC under the four load levels have similar failure morphology, and cracks along the axial direction of the specimen appeared. Therefore, the cyclic load level has no obvious effect on the tensile fatigue failure morphology of PFRC. The final failed specimens of the four stress levels under tensile fatigue.
Due to the tight clamping, the transitional grips could not be removed after the test. In order to deeply observe the tensile fatigue failure of PFRC, the middle parts of the failed specimens were removed by cutting, as shown in Figure 6. It is found that the tensile fatigue failure modes of PFRC include axial crack, a small amount of fibre fracture in Layer-2, delamination between Layer-1 and Layer-2 (delamination-1) and delamination between Layer-2 and Layer-3 (delamination-2). Some of the axial cracks propagated to coalesce with delamination-2. It shows that the fatigue load has a significant impact on the interlaminar interface performance, which eventually leads to the serious delamination of PFRC in addition to matrix cracks, which is also observed in the tensile fatigue failure of composite laminates.
31
Based on the analysis above, the dominant failure mode for PFRC under tensile fatigue is the coupling of the matrix cracking and the delamination. The tensile fatigue damage mode.
Analysis of damage modes
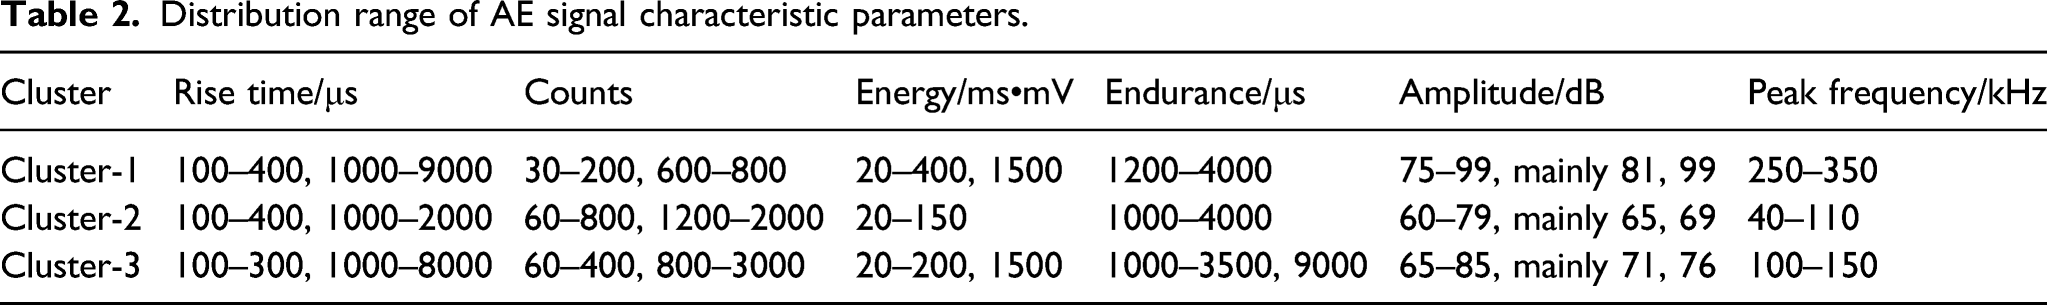
Distribution range of AE signal characteristic parameters.
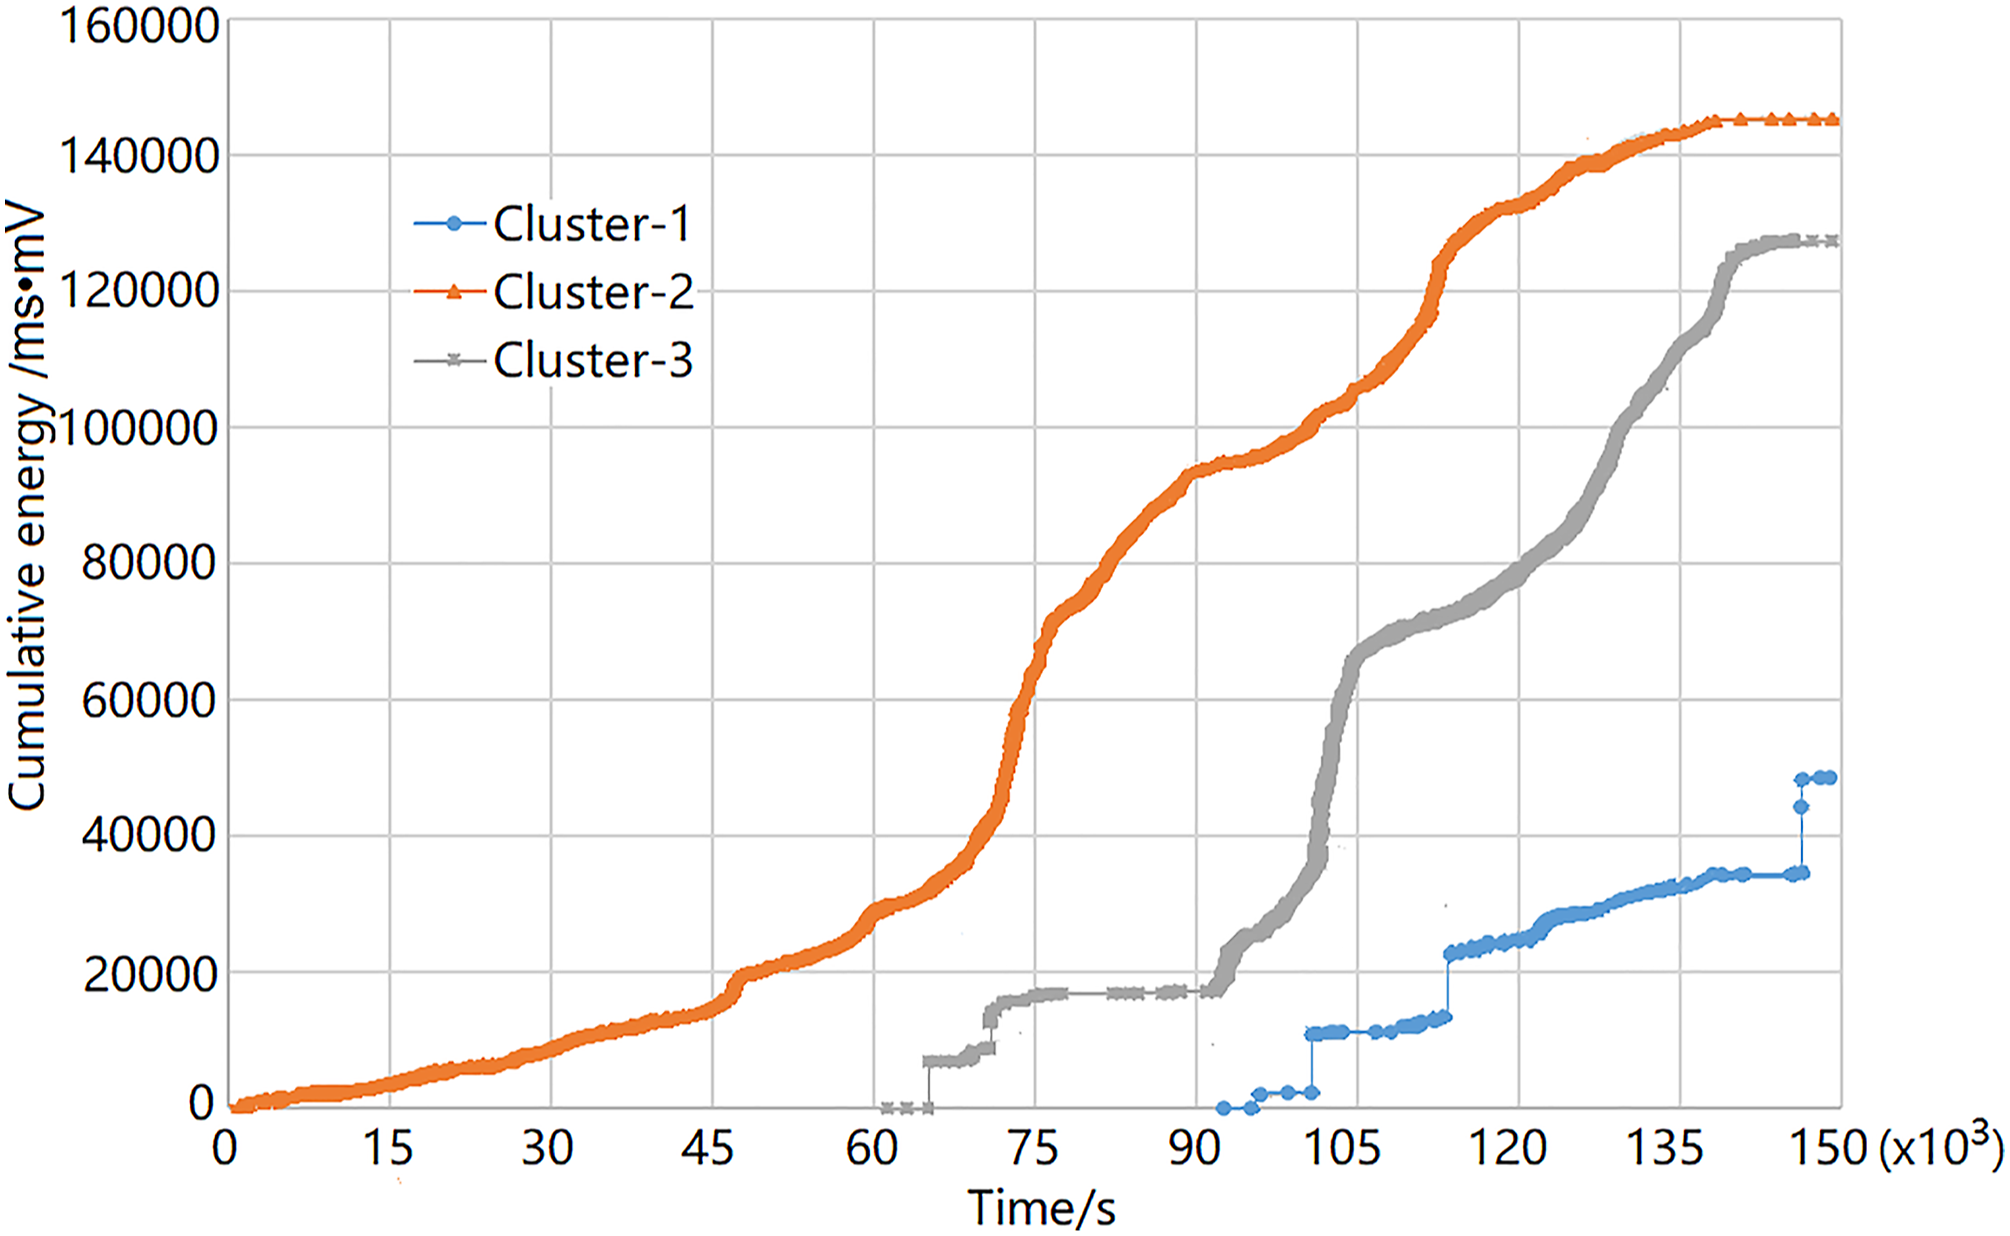
Figures 7 and 8 show the cumulative counts and cumulative energy of each cluster versus testing time, respectively. It is found that the Cluster-2 generated before zero second, and then Cluster-3 and Cluster-1 generated in turn. The cumulative number of Cluster-1, 2, 3 are 308, 2974 and 1735, respectively. There is a slope mutation at the initial part of the cumulative energy curves for Cluster-1 and Cluster-3, and there is a significant increase at the end of the cumulative energy for Cluster-1. The cumulative count and energy have no abrupt change for Cluster-2. Combined with the above analysis, it can be concluded that the intensity of Cluster-2 is lower than that of other two clusters, and the intensity of Cluster-1 is the highest. Cumulative counts of AE signals for tensile fatigue. Cumulative energy of AE signals for tensile fatigue.
The results of the AE signals analysis for the four cases of fatigue test.

Analysis of fatigue life dispersion
Verification of fatigue life model
Using equation (2), the median life obtained from the test is fitted as shown in Figure 9. It can be seen that the fatigue life curve in Figure 9 has good fitting quality with the test data, and the fitting quality factor R2 reaches 0.99852. The fitted fatigue life curve obviously includes the first two stages of the typical S-N curve for composite materials: the stage of absolute slope gradual increasing, and the stage of approximately linear. The third stage of the typical S-N curve, that is, the absolute value of the slope gradually decreases, is shown at the end of the curve in Figure 9. The tested tensile median fatigue life of PFRC and predicted fatigue life curve.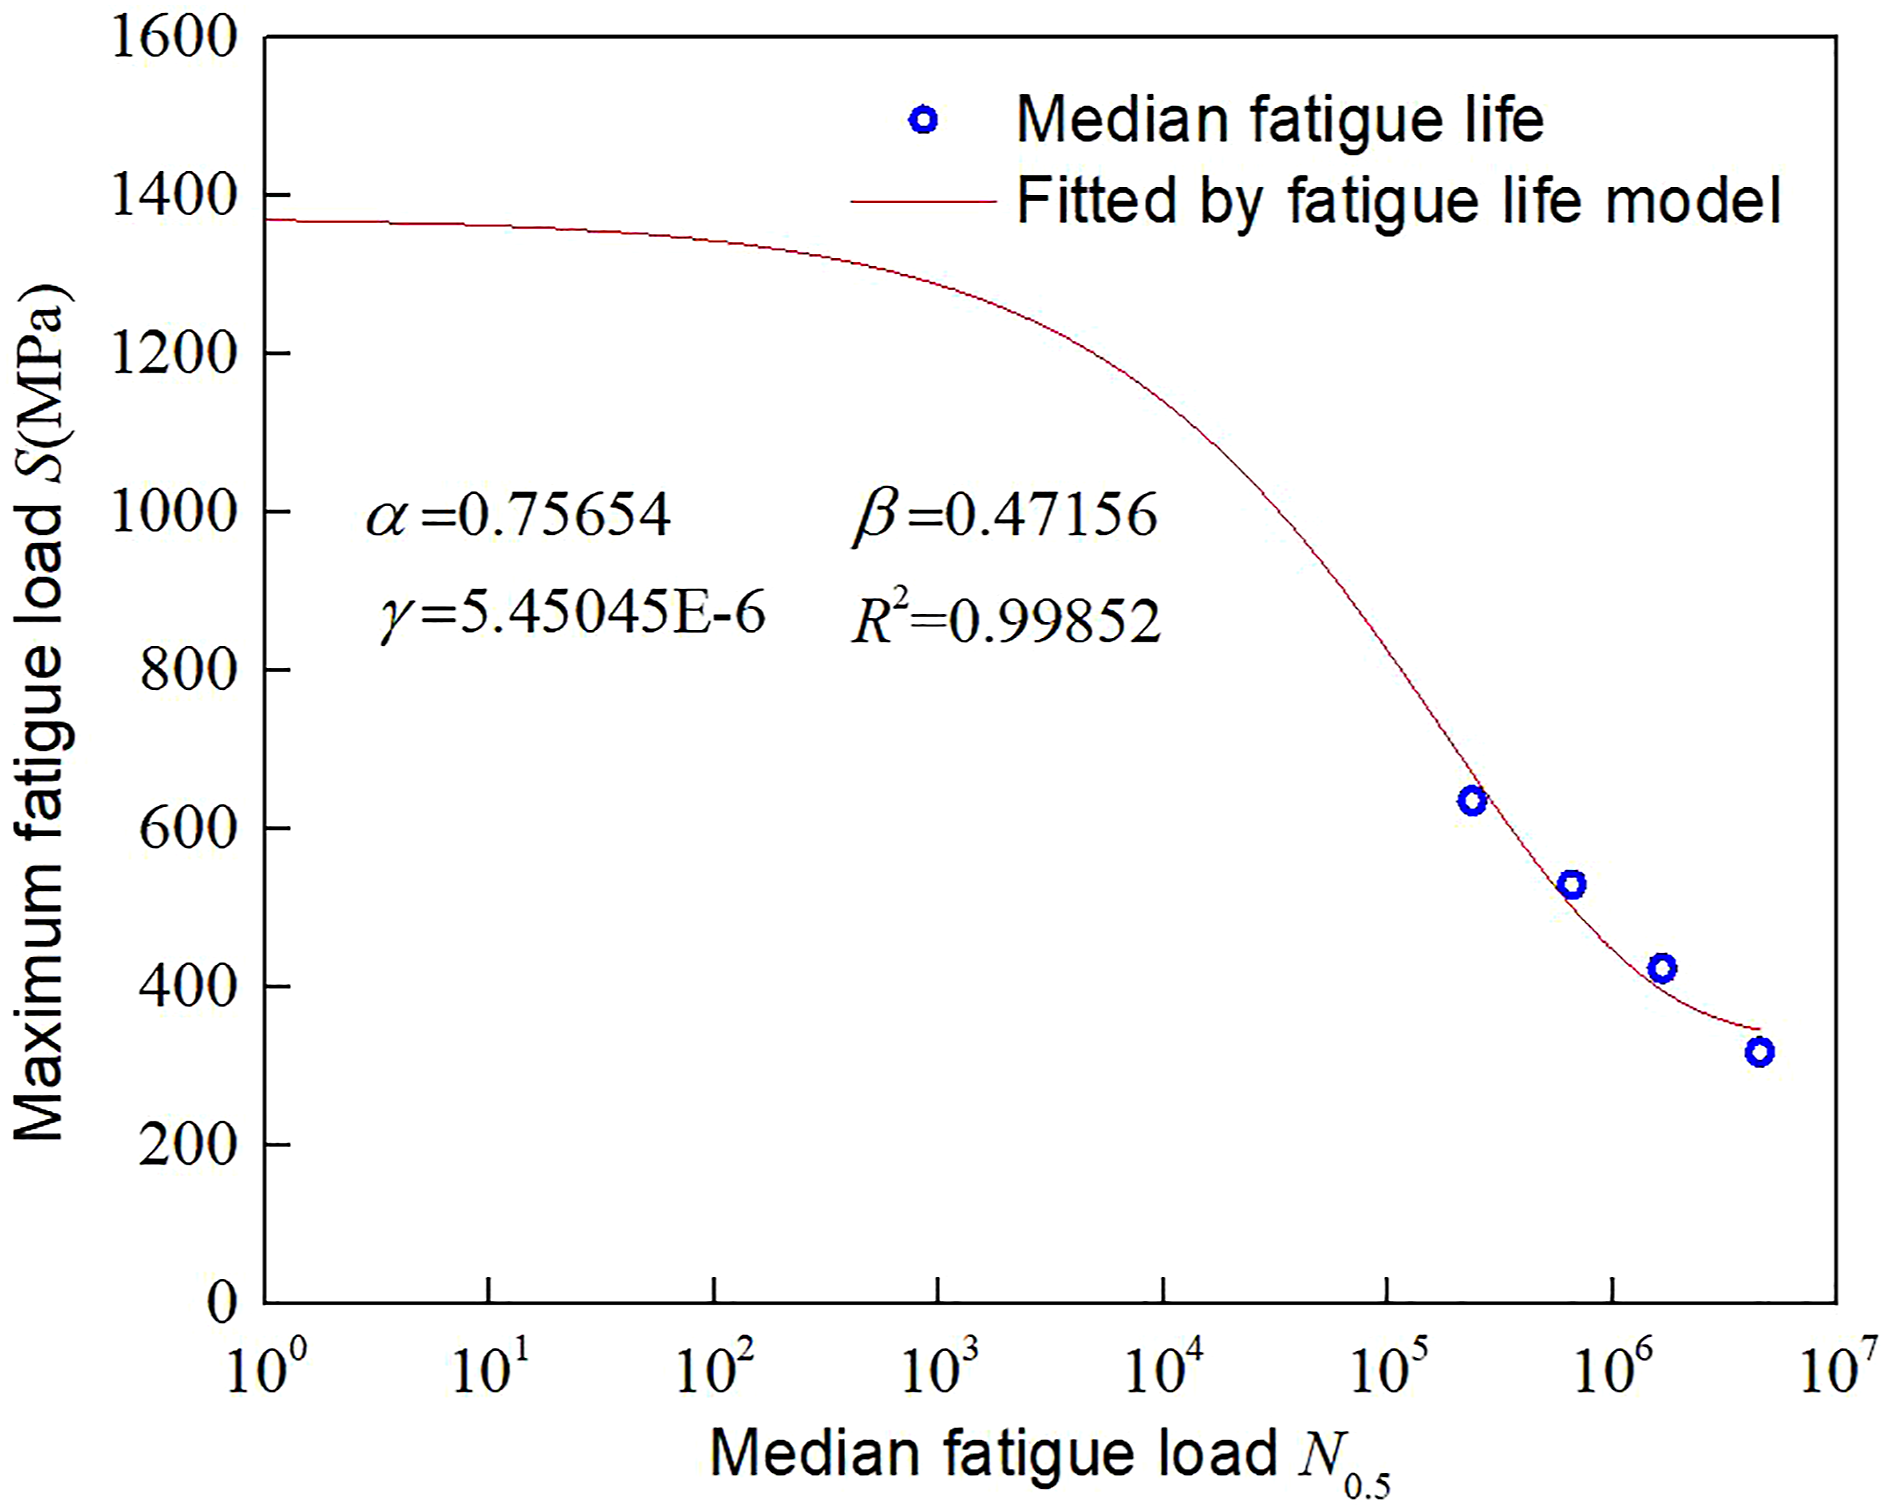
Probability fatigue life curve
Estimated results of Weibull distribution parameters for tensile fatigue life of PFRC.

The tensile fatigue life of PFRC under each stress levels when survival rate equals to 0.9, 0.8, 0.7 and 0.6
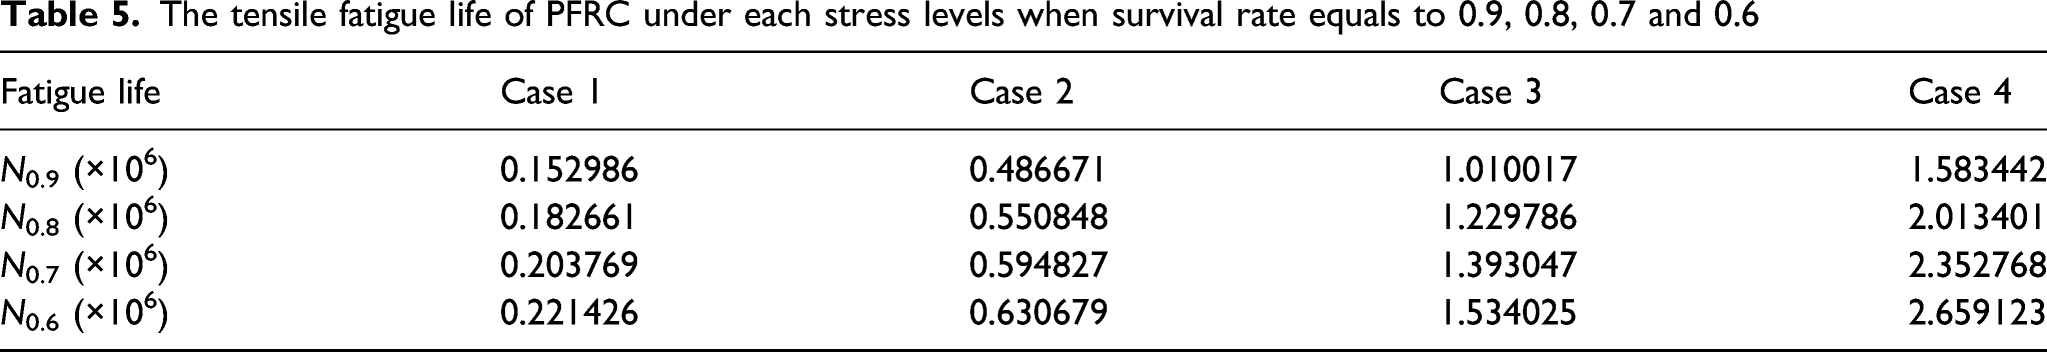
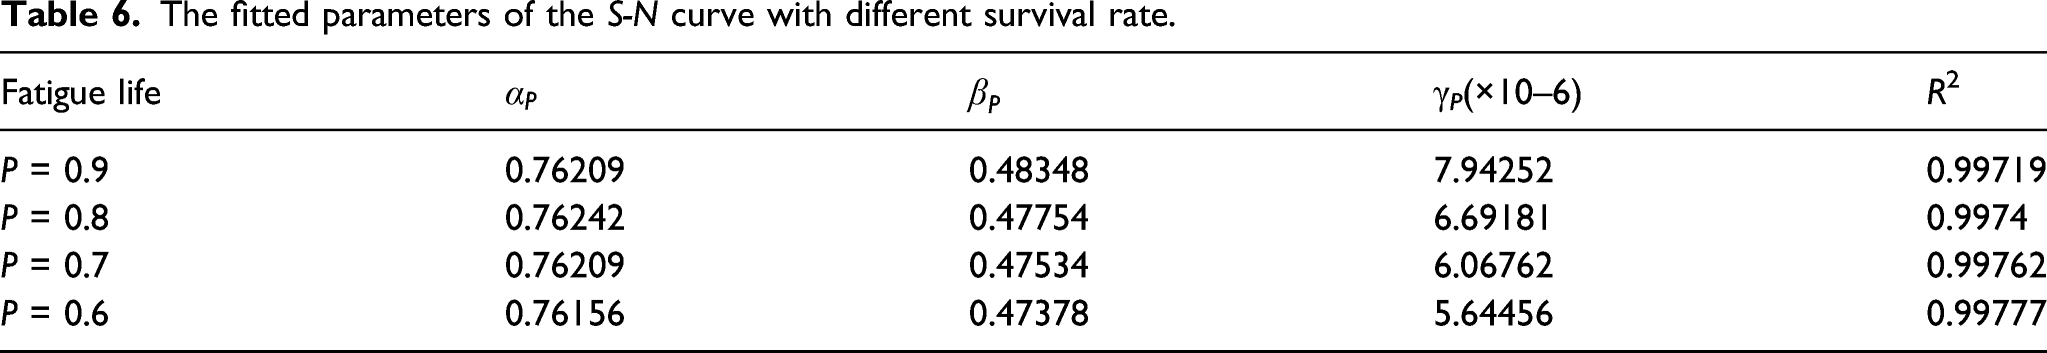
By using equation (12) to fit the fatigue life in Table 5, the S-N curve of survival rate P = 0.9, 0.8, 0.7 and 0.6 can be obtained as shown in Figure 10. The fitted parameters are listed in the Table 6. The S-N curve of survival rate P = 0.9, 0.8, 0.7, 0.6. The fitted parameters of the S-N curve with different survival rate.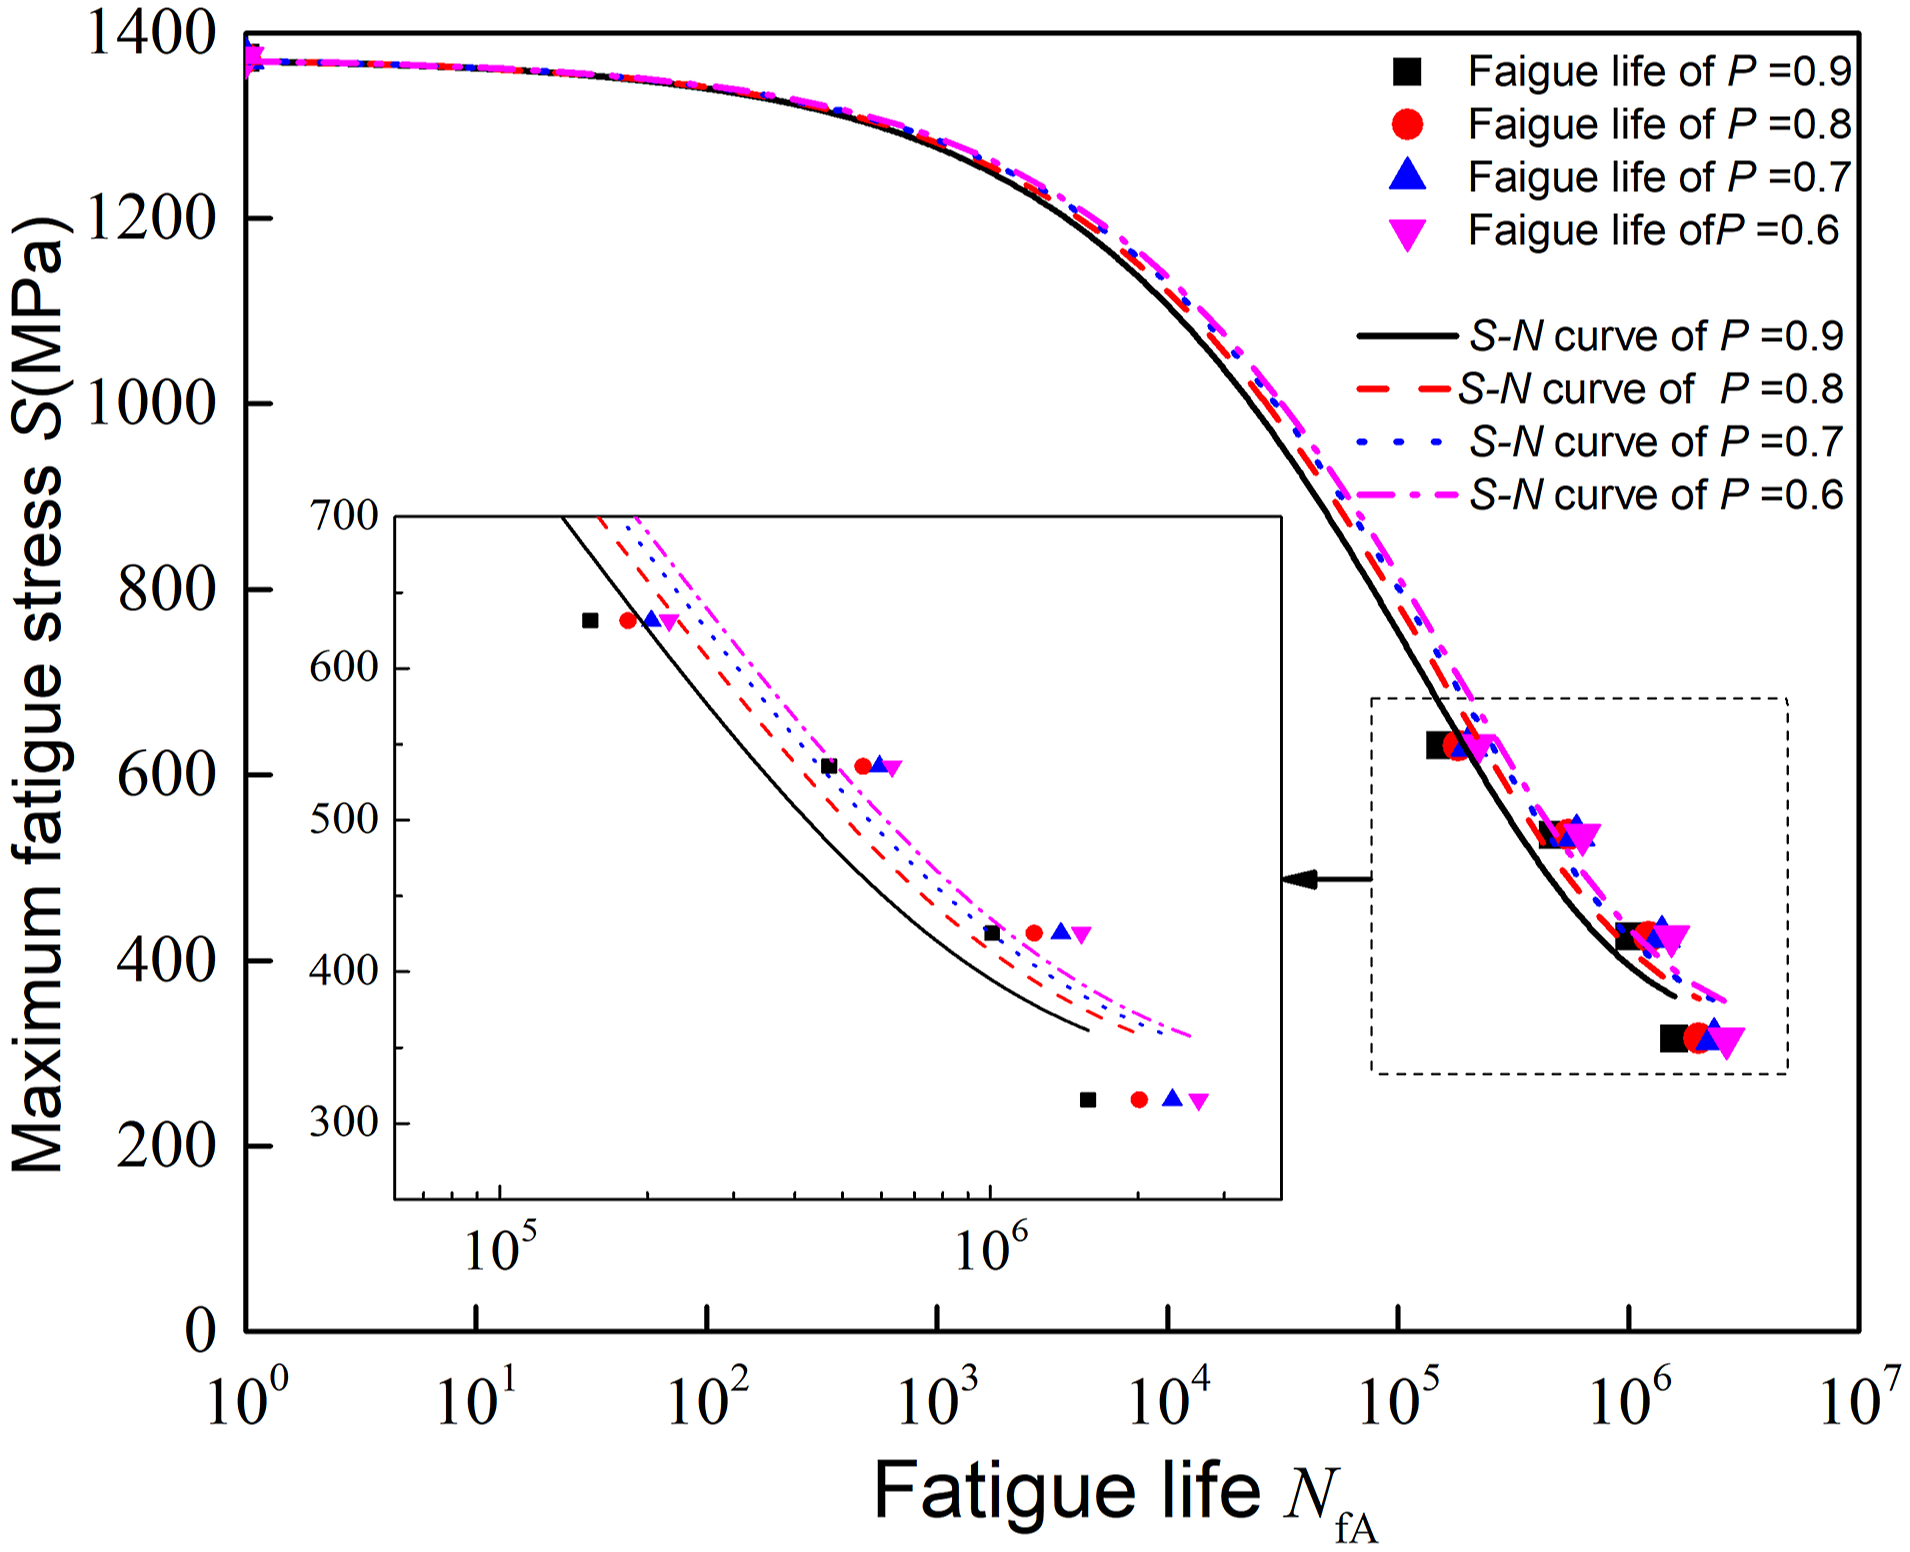
Discussion
Based on the analysis above, it can be seen that the matrix cracking occurs first, followed by delamination and fibre fracture for the tensile fatigue of PFRC. The AE signal quantity of matrix cracking is the largest, followed by delamination and fibre fracture. Because PFRC is mainly composed of Layer-1 and Layer-3, and the strength and elastic modulus of fibre are higher than that of the matrix, the axial fatigue load is mainly carried by fibres. In essence, the fatigue limit of glass fibre and carbon fibre are very high, however, the fatigue performance of the matrix in PFRC is relatively weak. Under the action of fatigue load, the matrix crack generates firstly, and then gradually expands and accumulates, resulting in a certain degree of stiffness degradation. 38 With the increase of matrix crack density, the failure modes such as delamination and a small amount of fibre fracture appear in PFRC, which leads to the further degradation of stiffness, until the PFRC is judged to be invalid.
The proposed fatigue life model has considered the volume fraction of different material components and material properties of PFRC, and the model has a good fitting quality on the tensile fatigue life of PFRC under different load ratios. The obtained fatigue life curve can reasonably reflect the three stages of the typical S-N curve, which indicates that the proposed fatigue life model can accurately describe the whole S-N curve of PFRC. The fatigue life dispersion of PFRC has been analyzed, and the P-S-N curve family of PFRC can be accurately obtained based on the fatigue life distribution model. The fatigue life distribution model includes the volume fraction of each layer, which is convenient to adjust the structural size of PFRC according to the requirements of working conditions.
Conclusions
This paper investigated the fatigue failure morphology and damage evolution of the PFRC through experiment combining with AE technology. The effect of the load levels on the failure modes has been analyzed. The probability distribution characteristics of the tested fatigue life was also investigated by the proposed fatigue life distribution model. The main conclusions are drawn as follows: The failed PFRC generates cracks along the axial direction. There are matrix crack, fibre fracture and delamination appearing for PFRC under the four load levels. The matrix crack appeared firstly, and then the delamination and fibre fracture generated. The matrix cracking is the most serious compared to the delamination and fibre fracture. For PFRC under axial tensile fatigue load, the matrix cracks firstly because of its poor fatigue performance. With the bearing capacity decrease of matrix, the delamination and fibre fracture appear in PFRC, which leads to the further degradation of stiffness until the final failure of PFRC. The proposed fatigue life model can fit the tensile fatigue life of PFRC very well, and the three stages of the typical S-N curve have been reasonably reflected. The fatigue life distribution model can also accurately obtain the P-S-N curve family of PFRC.
Footnotes
Declaration of conflicting interests
The author(s) declared no potential conflicts of interest with respect to the research, authorship, and/or publication of this article.
Funding
The author(s) disclosed receipt of the following financial support for the research, authorship, and/or publication of this article: This work was supported by the Natural Science Foundation of Shandong Province (ZR2021QE099), the China Postdoctoral Science Foundation (2020M682257), National Natural Science Foundation of China (51905545), Fundamental Research Funds for the Central Universities (20CX06099A; 20CX02219A) and the Postdoctoral projects in Qingdao (qdyy20200059).