
Abstract
In the first stage of this work, the degradation temperature of polyamide-12 was investigated using biocompatible fuels as a reference with different temperatures by thermogravimetric analysis (TGA) test. Those fuels were containing 20% and 85% ethanol as well as ethanol-free. In the second stage, the multilayer perceptron (MLP) neural network and radial basis function neural network (RBF) were designed to predict the degradation temperature of polyamide-12. Fuel temperature, ethanol percentage, and the time of placing samples in the fuel were selected as input and polymer degradation temperature was defined as network output. The results obtained from the modeling were compared with the results obtained from the test TGA. The results obtained from neural networks MLP and RBF showed slight differences with the experimental results that can be used as an efficient and low-cost tool to predict the degradation temperature of polymers.
Keywords
Introduction
Plastics are a valuable alternative to metals that can corrode. Automotive companies have been using polymer materials including polyamide in their fuel delivery systems for more than 30 years. The main reason for this is their resistance to corrosion, acoustic insulation, bump ability, chemical resistance, flexibility, design freedom, cost-effectiveness, and good weight performance. Of course, one of their problems is their high dependence on temperature and time. When selecting polymeric materials for such an important application, a high understanding of the behavior of materials is required. Biofuels are important renewable resources that can replace petroleum fuels. Therefore, it is important to look for suitable alternatives for the use of available sources of biofuels (such as ethanol).1-5 There are currently several biocompatible fuels available, but most major biofuels combine alcohol and gasoline, with benefits such as reducing petroleum pollutants, reducing air pollution, reducing fuel demand, and reducing greenhouse gas emissions. They improve air quality, have a positive impact on the environment, improve urban economic development, and improve vehicle performance. Also, biocompatible fuels have a higher-octane number than conventional gasoline, which results in lower temperatures and longer burns. 6 However, despite these benefits, biofuels have disadvantages associated with their compatibility with polymer materials. Ethanol-gasoline compounds are commonly used in gasoline-powered cars, so some components of cars need to be modified because the characteristics of biocompatible fuels are slightly different from gasoline.7-8 Several car companies have made cars that are fuel-efficient and can work with fuels that contain a high percentage of ethanol. These cars have a lot of engine changes compared to regular cars, which has led to an increase in their final price. 3 Polymer material compatibility is one of the main issues discussed when changing fuel structure. Changes in fuel structure usually cause problems such as corrosion and erosion in polymer materials. 9 Fuel systems in modern cars have an estimated lifespan of 15–20 years. At present, all fuel systems are compatible with 10% ethanol, but the need for more efficient materials has increased with the increase in ethanol content. So far, little information is available on the effect of increasing ethanol on the components of the fuel system. In the last 25 years, polyamide-12 has been one of the components of the fueling system because of its low cost and good mechanical properties.2,9 In this work, the effects of several factors such as environmental factors, biofuels, and temperature on the physical properties of polyamide-12 over time using the artificial neural network (ANN) are discussed. Artificial neural networks are advanced modeling tools for experimental data that have been widely used in various branches of polymer science and engineering.10,11 On the other hand, neural networks prove to be one of the most powerful tools in their modeling and prediction. Neural networks have three main advantages: First, neural networks are able to learn complex nonlinear relationships from sets of training examples. Second, the network makes no assumptions about data distribution, and third, neural networks are very flexible about incomplete and missing data.12–18 Also, neural networks have been successful in solving and identifying complex patterns and classification problems and have been used in different fields and have obtained acceptable results. Therefore, due to the satisfactory network history in predicting a large range of parameters in various sciences, it is expected that the degradation temperature of polyamide-12 can be well predicted by a neural network. In this study, modeling with Multilayer perceptron (MLP) and Radial basis function (RBF) is performed to predict the degradation temperature of polyamide-12 using the results of the experimental model. According to what has been said, ANNs have been identified as one of the most effective methods for data prediction. 19
Experimental
Materials
The first step here was to understand the material behavior in the air at short times/accelerated conditions, in the second step, samples were exposed to fuels with different grades. The choice of test conditions (nature of the liquid, immersion temperature, and immersion time), as well as the choice of the properties in which changes are to be measured depends on the eventual application of the plastic under test. To understand the behavior of polymer materials, samples of polyamide-12 (L25W40 Grilamide) were prepared by EMS-GRIVORY Germany. These samples were first exposed to air for approximately 1 h. In the next step, the samples were placed in biocompatible fuels (fuel containing 20% and 85% ethanol) at different temperatures (25, 40 and 60°C). Selection of test conditions (nature of biocompatible fuel, immersion temperature and immersion time), as well as the determination of its properties and variations concerning the final use of polyamide-12 under test, were measured. 20 The polyamide-12 sheets were dried for 10 h in a UF110 laboratory vacuum oven manufactured by Memmert Co, Germany, at 75°C to remove additional products according to the technical data sheet of these samples. The test pieces were selected as two-dimensional dumbbells and flat strips for testing. The main feature of these dumbbell pieces is that they are far from the stress concentration so that the fracture occurs in the narrow section and preferably where the test is performed. Collin hydraulic laboratory forming press P200 was used for fabricating the molded plates at 210°C according to standard procedure. It should be noted that the test results depend on the size of these components and it should be noted that the samples were stored at 23° C and 55% humidity before testing. 21
Thermogravimetric analysis
Thermal weighing tests were performed in two temperature ranges of 260–450 and 450–580°C. Samples were tested in ethanol-free fuel for 900, 3000, and 5000 h at temperatures of 25, 40, and 60°C. In the next step, samples were thermally weighed in fuel containing 20% ethanol at the above-mentioned temperatures and times. In the last step, the samples were thermally weighed in fuel containing 85% ethanol at the mentioned temperatures. In all steps, the degradation temperatures were measured.
Model description
Artificial Neural Networks
Artificial neural networks are computer models based on simple models of biological activities of the human brain such as the ability to learn, think, remember, and solve problems. Neural network models consist of neurons and weights based on the assumption that a continuous system of simple processing elements can learn the relationships of complex independent and dependent variables. 11 Neural network development is not easy unless it involves: data selection, data processing, selection of neural network structure, selection of network training algorithm, trained neural network test, and use of the trained neural network for validation and simulation. 12
Multilayer Perceptron Neural Network
The neural network consists of a common structure of an input layer, a middle layer (called a hidden layer), and an output layer. Each layer is composed of simple processing elements called neurons. Neurons connect layers using regulated weight signals. The input layer receives signals from external sources. The weight for each input in this layer is routed separately and this data is sent to the hidden layer for processing. 22 The hidden layers perform the processing and the results are transferred to the other hidden and output layers using the transfer functions. 11
Radial Basis Function Neural Network
The concept of radial basis function derives from the fact that these functions have axial symmetry. That is, each output unit produces its output corresponding to the desired input and at a specified radial distance. This means that a radial basis function produces the same output for all x’s that are in a circle centered on ci. ci is a center vector of ith hidden layer neuron in the RBF. Actually, RBF is a class of real-valued functions where its output depends on the distance between the input pattern and a point c, defined as the center of the RBF. The learning algorithm in these networks has three stages: the input stage, the intermediate stage or the production of Gaussian function centers, and the output stage. There are different learning algorithms for the network RBF. It uses a simple way of combinatorial learning, which performs estimation of the position and width of the kernel using the k-means clustering algorithm.
Design of neural network model
MATLAB software version 2014 was used to design the ANN. The first step in neural network design is to determine the input and target data. The parameters of concentration, temperature, and time were considered as independent variables, the input of the network and the measured weight value as the target. The main step in network design is to determine the network structure and the first step in determining the network structure is to determine the network type. The most common type of neural network is the multilayer perceptron, which is used in more than 90% of neural network cases.
21
We also used a multilayer perceptron neural network to model experimental data. The amount of neural network complexity depends on the number of hidden layers and the number of neurons in each hidden layer. According to the global approximation theory, an ANN with a hidden layer with a sufficient number of neurons can predict any output with high accuracy. Each layer receives inputs from previous layers, and passing outputs to further layers. The input layer transfers the initial data into the hidden layers for further processing and then processed data is transferred to the output layer. A neuron in a network can receive multiple inputs from not only one neuron but from several or even many neurons. The ANN structure constitutes simple computing parts, namely, artificial neurons. They are responsible for performing some mathematical operations. The mathematical manipulations expressed by equation (1) are carried out by both hidden and output neurons. In this equation, a bias (constant) is actually added to the weighted sum
23


Optimal values of ANN parameters used to predict fuel degradation temperature.

ANN: artificial neural network.
The artificial neural network of radial basis functions
Network RBF is one of the statistical neural networks that are inspired by statistical techniques for classifying patterns and their learning is not based on the logic of biological networks. These networks use bell-shaped surfaces to separate in space, which is prominent in the center and on their center and is drawn around downward. By introducing the bell surface opening amount, the space of the patterns will be divided. The network RBF has only one hidden layer and this is the unique feature of the RBF. The data processing is carried out in one hidden layer. In this layer, each neuron forms a bell surface. It also has a very mathematical basis based on a regularization hypothesis for solving problems. In general, these networks are comprised of approximately three layers including inlet, outlet, and outlet. Regular radial basis functions are used to stimulate the secretory layer neurons. Networks are organized in such a way that conversions to hidden units are performed as a set of functions to map input patterns to output patterns. Therefore, the number of units in the hidden layer must be large enough for the range of space to be interpolated. Transformations from input neurons to output neurons are nonlinear and generally, this part of the network is trained in a non-supervised manner. The training of network parameters (weights) between the hidden layers and the output layers is supervised and based on the target outputs, although the conversions in this part of the network are linear, in general, the process of training is fast. The mathematical form of the output neurons in the RBF is as follows
Results and Discussion
Thermogravimetric analysis results
First, the thermogravimetric analysis (TGA) and derivative thermogravimetric analysis (DTG) were performed on immersed and dried samples. Then, the effect of fuel composition and temperature on the degradation rate was investigated. The Tangent method is recommended for the onset temperature determination in standard (DIN EN ISO 11,358).
24
The results are not satisfactory due to different degrees of conversion related to the onset temperature as well as the difficulty in determining the onset of degradation.
25
Therefore, the onset decomposition temperature for fuel containing 85% ethanol, was defined at a mass loss of 15% of the initial sample mass. The temperatures for all immersion test conditions related to fuel containing 85% ethanol are summarized in Figure 1 for samples in the dry state after fuel exposure for 3000 h. The decomposition in air occurs in two major steps with a residual mass at 600°C lower than 1% of the initial mass. This illustrates that nearly all the sample weight subjected to degradation was transformed into volatile material and the decomposition led to complete vaporization of the sample. The first decomposition step occurring in the range 260–450°C and the second one in the range 450–580°C. Herrera et al.
26
reported that the extra degradation step in the air is due to the decomposition of the char formed in the first step. The term polymer degradation is used to denote changes in physical properties caused by chemical reactions involving bond scission in the polymer backbone. In linear polyamides, these chemical reactions lead to a reduction in molecular weight, that is, to a diminution of chain length. As seen in Figures 1–3, the PA12 samples immersed in all fuels exhibited lower thermal stability than those before immersion. In general, the degradation of PA12 samples immersed in fuel without ethanol (FC), occurred at a temperature above that of the samples immersed in fuels containing ethanol (FCE20a, FCE85a). As seen in Figure 4, the thermal stability of PA12 has reduced particularly in fuels containing a higher percentage of ethanol. Therefore, it can be said that polyamide-12 understudy was significantly affected by ethanol mixed fuels. The degradation temperature of polyamide decreases with increasing amount of ethanol of fuel as well as increasing the fuel’s temperature. In other words, the polyamide in the fuel containing 85% ethanol at 60° C fuel (FCE85a) degrades faster than the polyamide in the fuel containing 20% ethanol (FCE20a), and in the same way the polyamide in the fuel containing 20% ethanol degrades faster than the fuel without ethanol. After 3000 h of immersion test, it is evidence that the decomposition temperature range between reference PA12 and fuel (FCE85a), (ΔT = Tref-TFCE85a) increases from 10.4°C to 16.7°C and 20.7°C, at immersion temperatures of 25°C, 40°C, and 60°C, respectively. Also, the T range between reference and fuel (FC) increases from 5.6°C, 11°C, and 11.4°C, at the same immersion temperatures. This indicates that ethanol mixed with fuels (FCE85a) is highly effective compared with fuel (FC) at higher temperatures. As the immersion temperature increases, a shift in T (85%) and DTG or dTG/dt (derivative of the TG curve with respect to time) to lower temperatures occurs as well as a change in the shape of DTG profiles. Flatter DTG curves are detected for samples immersed at higher temperatures and higher ethanol content fuels as well. Results show a clear dependency on the immersion temperature with degradation. The strong temperature dependence of the rate of depolymerization is due mainly to an increase in the rate of initiation and also to some extent due to an increase of the kinetic chain length with increasing temperature. As the temperature is increased, the scission probability for all kinds of bonds increases. Since bond breakage, that is, initiation, cannot be prevented, in principle, the action of a stabilizer is limited to the inhibition or retardation of subsequent processes that frequently proceed as chain reactions.
27
Heat stabilizer is employed in PA12 to provide certain protection against degradation, it is capable in the course of autoxidation of trapping emerging free radicals or unstable intermediate products and transform them into stable end products.28–30 Thus, consideration of the depletion of this additive is a critical factor to be considered when an understanding lifetime of PA12 in various applications. The resulting lifetime of polymers depends in a complex way on the kinetics of the polymer’s degradation, diffusion of oxygen into the polymer matrix, and the effect of inhibition imparted by the stabilizer employed.30–32 Thermogravimetric analysis (in dynamic air atmosphere) of samples in the dry state after fuel exposure at 25°C for 3000 h. Thermogravimetric analysis (in dynamic air atmosphere) of samples in the dry state after fuel exposure at 40°C for 3000 h. Thermogravimetric analysis (in dynamic air atmosphere) of samples in the dry state after fuel exposure at 60°C for 3000 h. The decomposition temperatures, 


It can be concluded that additives of immersed samples are extracted with dependence on duration. The key variables are the solubility of the additive in the polymer, its diffusion coefficient, its vapor pressure, and its solubility in fuels. Herrera et al. 26 reported that degradation of pure PA12 (without additives) starts at 410°C, it means that for the worst-case-scenario (fuel FCE85a), after the duration of 3000 h, the number of additives inside the polymer are negligible at about 409°C, (Figure 4).
Degradation temperatures shown in Figure 5 indicate a shift in T to lower values particularly in fuels containing a higher percentage of ethanol. After 5000 h of immersion in fuel (FCE85a), at 60°C, the T exhibited a decrease of 31.4°C (from 429.7 (ref PA12) to 398.3°C), (Figure 5). Degradation of polyamides is enhanced by alcohol through the various associations possible among solvent-solvent and polymer-solvent interactions. The behavior of polyamide involves chemical changes such as changes in overall crystallinity, extraction of additives and low molar mass PA12-related species and random chain scission mechanism. These results are supported by other results of experiments. It can be concluded that after 3000 h of immersion in the most corrosive fuel (fuel containing 85% ethanol at 60°C), the degradation begins and the degradation temperature decreases from 409°C (degradation temperature after 3000 h) to 398.3°C (degradation temperature after 5000 h). As seen in Figure 5, the sample aged in hot air at 140°C for 5000 h, shows the rapid decrease of T (from 429.7 (ref PA12) to 363°C). This indicates significant molecular degradation due to the thermo-oxidation process and loss of additives by evaporation from the polymer surface. These mechanisms are supported by Karstens and Rossbach
34
and other authors.35–38 Thermogravimetric analysis (in air) of sample immersed in fuel (FCE85a) at 60°C, and sample aged in air at 140°C, up to 5000 h.
The results obtained from the experimental method.

Artificial Neural Networks results
In this research, the Levenberg-Marquardt optimization method, which is one of the most widely used learning rules, was used for network learning.
The results of the linear regression between the experimental values and the neural network model are shown in Figure 6. Explanation coefficient (R2) between experimental data and neural network model for training, validation, and test data and finally all data were 0.9997, indicating high neural networks’ ability to predict this system. Linear regression results between experimental values and the artificial neural network model.
The Network RBF was designed using 279 data. Three variables of temperature, concentration, and percentage of ethanol fuel were defined as input and degradation temperature of polyamide-12 as output in the grid. In this network, 70% of random data was used as training data and 30% of random data as test data. The network of 80 neurons in the middle layer was used to maximize adaptation to achieve an optimal output. The results of modeling this network for all data and test data are presented in the following figures. The results obtained from the RBF network include regression, mean error squares, error square, and standard deviations are shown for all data in Figure 7. Results of linear regression between experimental values and artificial neural network RBF model for all data.
The results of the neural network.
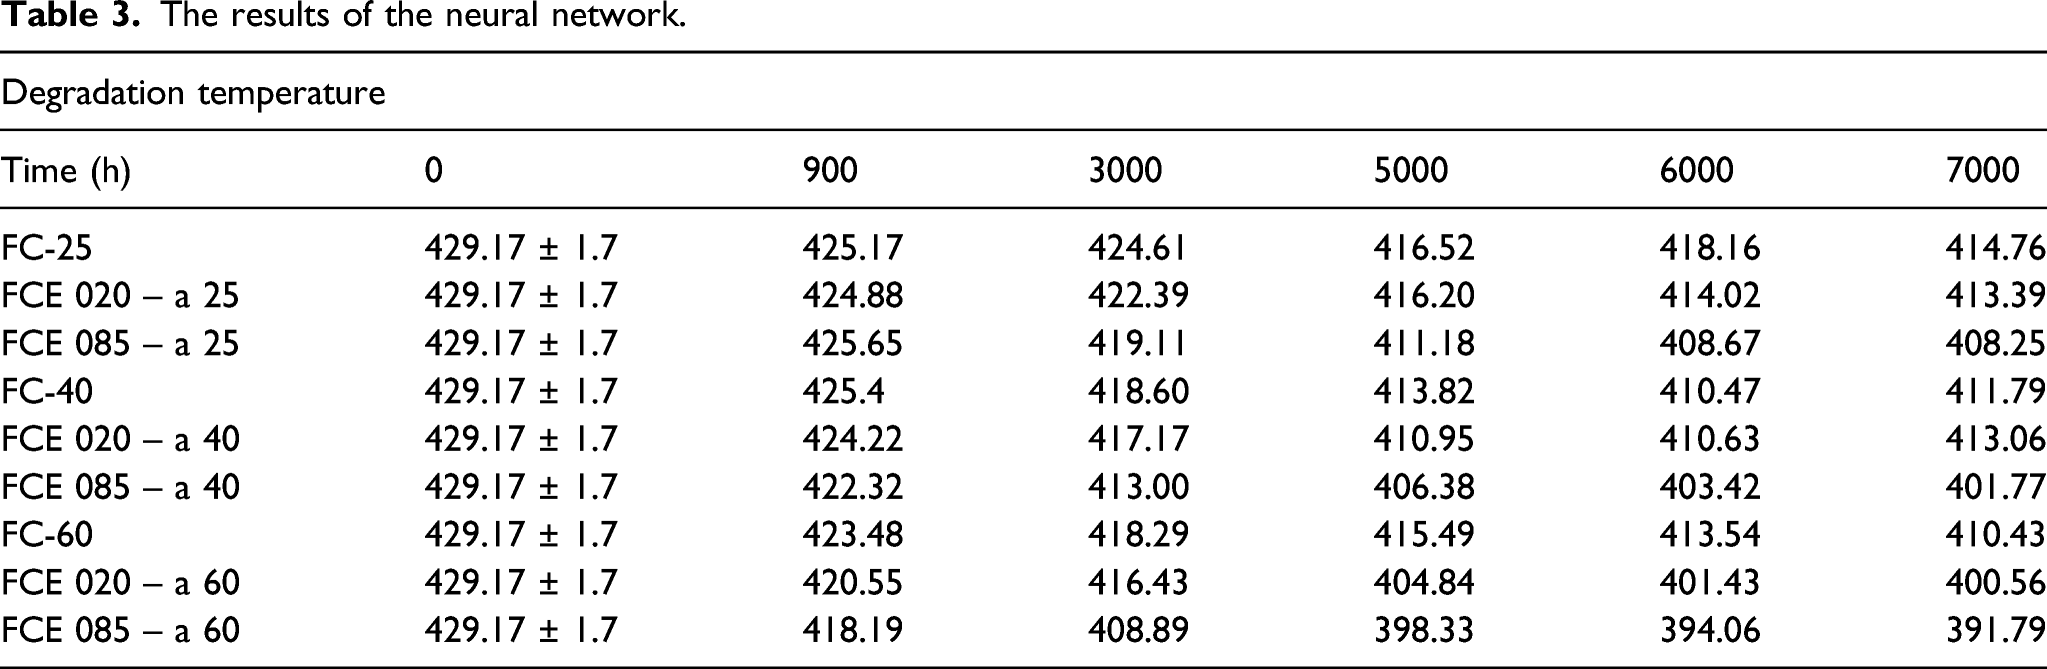
According to the results of neural network modeling, the percent of ethanol and time parameters have the most influence on the degradation temperature of polyamide-12, respectively.
Conclusions
The effect of temperature, concentration, and time on the degradation rate of polyamide-12 was evaluated. The results of TGA test up to 5000 h showed that at the highest ethanol content and the highest temperature, the degradation temperature of polyamide-12 decreases from 429.7°C as a reference to 398.2°C, which indicates that polyamide-12 is suitable for this application. The MLP neural network also predicted a polyamide degradation temperature of 12–7000 h, which increased from 429.7°C as a reference to 391.79°C in a biocompatible fuel containing 85% ethanol at 60°C. Comparison of experimental results and modeling of MLP and RBF neural networks with explanation coefficient of 0.9997 and 0.9777, respectively, and mean square error of 0.090 and 0.035, respectively, and absolute error of the networks of 0.001 and 0.021, respectively, which can determine the temperature of polyamide-12 degradation predict well with biocompatible fuels containing ethanol.
Footnotes
Declaration of conflicting interests
The author(s) declared no potential conflicts of interest with respect to the research, authorship, and/or publication of this article.
Funding
The author(s) received no financial support for the research, authorship, and/or publication of this article.